Article

Climate Indicators of Landslide Risks on Alaska National Park Road Corridors

1
International Arctic Research Center, University of Alaska Fairbanks, Fairbanks, AK 99775, USA
2
National Park Service, Fairbanks, AK 99709, USA
3
Department of Atmospheric Sciences, Geophysical Institute, University of Alaska Fairbanks, Fairbanks, AK 99775, USA
*
Author to whom correspondence should be addressed.
Atmosphere 2023, 14(1), 34; https://doi.org/10.3390/atmos14010034
Submission received: 21 October 2022 / Revised: 7 December 2022 / Accepted: 22 December 2022 / Published: 24 December 2022
(This article belongs to the Section Climatology)

Abstract

:
Landslides along road corridors in Alaska national parks pose threats to public safety, visitor access, subsistence activities, and result in costly remediation of damaged infrastructure. Landslide risk in these areas, which contain near-surface permafrost, is associated with mean annual air temperatures (MAATs) above freezing and heavy precipitation events. Historical (1981–2020) values of MAAT and summer precipitation (JJA PCPT) from the fifth generation European Centre for Medium-Range Weather Forecasts (Reading, UK) atmospheric reanalysis (ERA5) were compared to mid-century (2021–2060) and late-century (2061–2100) downscaled climate model projections across Gates of the Arctic National Park and Preserve (GAAR), Denali National Park and Preserve (DENA), and Wrangell-St. Elias National Park and Preserve (WRST). ERA5 showed that all locations historically had MAAT values below freezing, but all three parks were warming significantly (0.3–0.6 °C per decade). Observed trends of MAAT from 18 stations showed warming trends with 11 of the 18 being significant at the 95% confidence level using the Mann–Kendall non-parametric test. Road corridor values are given for the: (1) proposed Ambler Road through GAAR, (2) Denali Park Road in DENA, and (3) McCarthy Road in WRST. Elevated risk from MAAT was projected in the mid-century period for the Denali Park Road and McCarthy Road and across all three park road corridors in the late-century period; elevated risk from JJA PCPT was projected in all periods for all road corridors.

1. Introduction

Landslide vulnerabilities along permafrost-rich National Park Service roads in Alaska are a hazardous concern as the region’s climate becomes warmer and wetter. The most significant area of recent concern is at the ‘Pretty Rocks’ landslide in Denali National Park and Preserve (hereafter Denali or DENA), located at mile 45.4 of the 92-mile-long Denali Park Road, which has forced an extended closure of the road (Figure 1a). A noticeable acceleration in road displacement at ‘Pretty Rocks’ began in 2014, increasing from a rate of cm per year to cm per day in 2019 (Figure 1b) [1]. The Bipartisan Infrastructure Law has allocated $25 million toward finding a long-term solution to the road displacement in this area [2]. In southern Alaska, the McCarthy Road, which runs through Wrangell–-St. Elias National Park and Preserve (hereafter Wrangell-St. Elias or WRST), was temporarily closed in August 2018 due to mudslides from excessive rainfall [3]. The McCarthy Road provides visitor access to the Kennecott Mines National Historic Landmark, the town of McCarthy, and recreational activities in the park. Collectively, these climatic changes decrease public safety, limit visitor access, restrict subsistence activities, and threaten vulnerable infrastructure. They also present challenges to construction of new infrastructure, such as the proposed Ambler Road, which would traverse from the Dalton Highway in the east, westward across southern portions of Gates of the Arctic National Park and Preserve (hereafter Gates of the Arctic or GAAR) to the Ambler Mining District [4] (see Figure 2 for park and road corridor locations).
Figure 2a shows the location of the three park units in this study in relation to mainland Alaska, as well as roads of interest and meteorological station locations in Gates of the Arctic (Figure 2b), Denali (Figure 2c), and Wrangell–-St. Elias (Figure 2d). Between 1950–2009, surface air temperatures rose 4.3 °C in Denali, the highest increase of all 417 U.S. National Parks [5]. At Eielson Visitor Center, located in Denali, a sustained shift to warmer temperatures began in 2014 when the mean annual air temperature rose above freezing [6]. These changes are consistent with broad, long-term warming across Alaska with the magnitude of the observed trend from 1925–2021 more than doubling from 0.17 °C to 0.44 °C per decade since 1970 [7]. This has resulted in unprecedented warming with statewide mean annual air temperatures for Alaska now routinely exceeding the 114-year record from 1900–2013 [8]. The rate of warming over Alaska during recent decades is two times the global mean [9], and Rantanen et al. [10] concluded that this factor in the pan-Arctic (60–90° N) is even greater at 3–4 °C since the beginning of the modern satellite era in 1979. Across the pan-Arctic, an ongoing run of years with annual near-surface air temperature anomalies greater than 1.0 °C, relative to the 1981–2010 historical average, began in 2014 [11], thus corresponding with the aforementioned abrupt shift in Denali and all northern Alaska national parks [6].
The three park units in this study are underlain by permafrost, or material that is continually at or below 0 °C for at least two consecutive years [15]. Warming temperatures lead to a deepening of the annual active layer (e.g., the layer that warms above freezing in the summer and re-freezes in the winter), permafrost thaw as this layer deepens, and eventually thermokarst formation with irregular soil subsidence. The abundance of near-surface permafrost, measured by percent of total area on permafrost, is generally described by four categories: continuous (90–100%), discontinuous (50–90%), sporadic (10–50%), and isolated (0–10%); in Alaska, this loosely describes the permafrost in areas south of the Alaska Range as isolated or sporadic, the boreal Interior as discontinuous, and the North Slope as continuous [16,17]. Stations on Alaska’s North Slope have shown higher magnitude warming trends than those in the Interior [8], which is consistent with Biskaborn et al. [18] who found warming of 0.39 °C from 2007–2016 in continuous permafrost zones compared to 0.20 °C in discontinuous permafrost areas. However, the latter are much closer to freezing, and thus are more susceptible to thaw [6,19], and consequently to increased road damage and landslide activity [9,20,21]. Melvin et al. [17] projected $180 million in damages (in 2015 dollars) would occur to Alaska’s road infrastructure from 2015–2099 solely due to permafrost thaw under a high greenhouse gas emissions scenario.
The northernmost park of interest in this study, Gates of the Arctic is located in the western Brooks Range and parts of its southern foothills (Figure 2b). From 2000–2009, Panda et al. [12] found that 99% of the National Park Service Arctic Network area, which includes Gates of the Arctic, was underlain with permafrost; however, this was projected to decrease to 91% by 2051–2060, and to 49% by 2091–2100 in permafrost model simulations driven by output from global climate models. Denali is located in the central Alaska Range (Figure 2c). Panda et al. [13] found that 49% of Denali had near-surface permafrost from 2000–2009, which was projected to decrease to 6% by 2051–2060, and to merely 1% from 2091–2100. Panda et al. [14] conducted a similar analysis for Wrangell-St. Elias (Figure 2d), finding underlying near-surface permafrost on 72%, 42%, and 15% of Wrangell-St. Elias from 2000–2009, 2051–2060, and 2091–2100, respectively. Much of the road corridor areas in Denali (Figure 2c) and Wrangell-St. Elias (Figure 2d) from 2000–2009 already show mean annual ground temperatures (MAGT) hovering around freezing.
Permafrost in Alaska can be unevenly distributed across short distances because of its varied topography, slope angle, aspect, and surface vegetation types. Moreover, the ice-richness of permafrost can vary by an order of magnitude across a horizontal scale of only meters [15], where built infrastructure atop ice-rich soil is much more vulnerable to damage from thawing than are adjacent ice-poor soils [17]. The proposed Ambler Road, Denali Park Road, and McCarthy Road all traverse areas with steep terrain (Figure 2), which tend to be susceptible to active-layer detachment slides and retrogressive thaw slumps; the former results from the seasonally thawed active later sliding on top of the permafrost layer below, and the latter can be caused when an active-layer detachment slide exposes previously buried permafrost that now becomes susceptible to warm summer atmospheric air temperatures [22,23]. Thawing permafrost from a warming climate represents a disruption to a prior, relatively stable, hydrothermal state, and will support increased landslide activity until a new equilibrium state is reached [21,22,24]. Banks Island in the Canadian High Arctic has seen an order of magnitude increase in the number of retrogressive thaw slumps initiated from 1906–1985 to 2006–2015, resulting from increasingly warm summers [25].
Heavy rainfall events, particularly during summer when the active layer is deepest, have also been identified as contributing causal events of landslides, both broadly [15,19,23] and in Alaska [1]. Yu and Zhong [26] found a significant positive trend in summer precipitation over most of Alaska from 1979–2016 using the ERA-Interim reanalysis. Thoman and Walsh [8] show that annual precipitation has been increasing across every climate division in Alaska during the period 1969–2018. Mean annual precipitation amounts in Gates of the Arctic, Denali, and Wrangell-St. Elias were projected to increase by 5.7%, 15.6%, and 16.8%, respectively when comparing 2051–2060 to 2000–2009; these increases were 26.5%, 28.3%, and 23.5%, respectively when comparing 2091–2100 to 2000–2009 [12,13,14]; these research studies used a 5-member ensemble of future simulations from the A1B ‘medium emissions’ scenario of the Coupled Model Intercomparison Project phase 3 (CMIP3). It has also been shown that extreme precipitation amounts are projected to increase at a greater relative rate than total precipitation; for example, Kharin et al. [27] show that historical 20-year return interval precipitation amounts under the ‘high emissions’ RCP8.5 scenario in CMIP5 increase over 20% by the end of the century, which is 2-3 times larger than the projected increase in annual mean precipitation. Moreover, McCrystall et al. [28] suggest that previous global model simulations have underestimated the anticipated increases in total and extreme precipitation as new climate model experiments become available (e.g., CMIP6).
The objectives of this study are to assess historical (1981–2020) and projected (mid-century 2021–2060; late-century 2061–2100) states of atmospheric indicators of landslide risk, specifically for the National Park Service units of Gates of the Arctic, Denali, and Wrangell-St. Elias and their associated park road corridors that include the proposed Ambler Road, Denali Park Road, and McCarthy Road. The atmospheric indicators include: (1) mean annual air temperature (MAAT) and (2) total summer precipitation (JJA PCPT). This study is novel for its focus on these three parks of concern and their associated at-risk road corridors, the usage of the atmospheric indicators in a landslide vulnerability framework, and in its usage of dynamically downscaled climate reanalysis and model simulations over these regions to obtain the bias-corrected projections. The climate indicators, station and model data, and methods used are described in Section 2. Results, separated by national park, are shown in Section 3. The results are given as the park average and the local road corridor average within each park (i.e., the proposed Ambler Road in Gates of the Arctic, Denali Park Road in Denali, and the McCarthy Road in Wrangell-St. Elias). Section 4 provides a discussion on how the historical trends (station and model) relate to the projected states of MAAT and JJA PCPT; projected changes are also contextualized into a risk framework according to freezing exceedances for MAAT and return intervals for JJA PCPT. Concluding remarks and study limitations are found in Section 5.

2. Data and Methods

2.1. Climate Indicators

Two climate indicators have been identified by the National Park Service as atmospheric proxies of landslide hazards in Alaska’s parks, namely, mean annual air temperature and heavy summer rainfall events [1]. The mechanism for these relationships comes from their interactions with the ground and, in much of Alaska, with the near-surface permafrost. Both of these atmospheric conditions promote destabilization of the ground via saturation and/or near-surface permafrost thaw. Swanson et al. [6] identified a linear relationship between the change in permafrost temperature and mean annual air temperature that is modulated by freezing and thawing factors such as ground vegetation and snow cover. Heavy rainfall events in this study are defined by the cumulative sum of summer (June-July-August; JJA) precipitation. The summer period was selected with the assumption that precipitation is predominantly liquid during these months and is more likely to coincide with above-freezing air temperatures and thawing permafrost.

2.2. Station Observations

Hourly and daily near-surface air temperature and precipitation data from 18 stations in or close to Gates of the Arctic, Denali and Wrangell-St. Elias were retrieved from the NOAA National Centers for Environmental Information (NCEI) Global Historical Climatology Network Daily database (GHCN-D; https://www.ncei.noaa.gov/products/land-based-station/global-historical-climatology-network-daily, accessed on 16 August 2022; [29]), the NPS Arctic Network (ARCN; https://irma.nps.gov/DataStore/Reference/Profile/2279038, accessed on 16 August 2022; [30]), the NPS Central Alaska Network (CAKN; https://irma.nps.gov/DataStore/Reference/Profile/2279039, accessed on 16 August 2022; [31]), and the Western Regional Climate Center Fire Remote Automatic Weather Stations (FIRE; https://wrcc.dri.edu/wraws/akF.html, accessed on 16 August 2022; [32]). The hourly data were aggregated into daily values, and a maximum threshold of allowable missing values of five percent from the total number of possible values was used for both the hourly and daily data. The climate indicators, MAAT and JJA PCPT, were then calculated for each available year. Table 1 provides information for each of these stations, including location, elevation, beginning year of available record and the number of valid years for observed MAAT and JJA PCPT.

2.3. Reanalysis and Downscaled Climate Model Data

Hourly near-surface air temperature and precipitation data from the fifth generation European Centre for Medium-Range Weather Forecasts atmospheric reanalysis (ERA5; https://cds.climate.copernicus.eu/cdsapp#!/home, accessed on 29 July 2022; [33]) were aggregated into daily values from 1981–2020. ERA5 is the latest generation reanalysis from the ECMWF with improved data assimilation, and finer horizontal (31 km), vertical (137 levels), and temporal (hourly) resolutions compared to the earlier ERA-Interim. ERA5 was selected for its superior performance at reproducing extreme temperature and precipitation events in the Arctic [34] and precipitation events in Alaska [35,36]. Furthermore, McCrystall et al. [28] found strong agreement between ERA5 and observed precipitation patterns across the Arctic. In this study, the ERA5 data are considered as gridded observations, as has previously been done across the Arctic [37], and are used for comparison with station observation trends and historical climate model output.
Historical (1981–2020) and projected (2021–2100) output from two climate models of the Coupled Model Intercomparison Project, phase 5 (CMIP5; [38]) archive were used to assess plausible outcomes of how landslide hazards could change in Gates of the Arctic, Denali and Wrangell-St. Elias. These include the NCAR Community Climate System Model, version 4 (CCSM; [39]) and the Geophysical Fluid Dynamics Laboratory Climate Model, version 3 (GFDL; [40]). These models were selected due to their ability to represent observed temperature, precipitation and sea-level pressure for Alaska [41] and to provide a range of modeled futures with varying climate sensitivity. Bachand and Walsh [36] show CCSM to have low sensitivity and GFDL high sensitivity from among over 100 CMIP5 and CMIP6 models. The CMIP5 historical archive ends in 2005, which means that from 2006–2100 the data come from Representative Concentration Pathway 8.5 (RCP8.5; [42]). Thus, the historical period used in this study, which runs from 1981–2020, combines data from each climate model’s historical period from 1981–2005 with that of the RCP8.5 runs from 2006–2020. This is not problematic however, because the RCP scenarios do not diverge significantly until the mid-21st century [43]. The future projections were divided into mid-century (2021–2060) and late-century (2061–2100) periods.
The CCSM and GFDL were dynamically downscaled for Alaska to 20 km × 20 km spatial resolution (https://registry.opendata.aws/wrf-alaska-snap/, accessed on 29 July 2022) using the Advanced Research core of the Weather Research and Forecasting Model, v3 (WRF; [44]). A description of the WRF model configuration used, including the physics options and model spin-up, can be found in Bieniek et al. [45], which describes the same process that was used to downscale ERA-Interim to 20 km. The 31 km ERA5 data were interpolated to the 20 km downscaled grid using the patch method from the NCAR Command Language’s (NCL) Earth System Modeling Framework (ESMF) software, from NCL v6.4.0 [46]. This was done to allow for direct comparison between the gridded datasets. Similar to ERA5, hourly output from the WRF downscaling was aggregated to produce the MAAT and JJA PCPT climate indicators.

2.4. Methods

The historical time series of mean annual air temperature and summer precipitation from ERA5 (1981–2020) and the 18 stations in Table 1 were tested for statistical significance using the Mann–Kendall non-parametric test for monotonic trend and trend estimates were obtained using the Theil-Sen method of median slopes [47,48,49]. All analysis was conducted using a combination of NCL Software, version 6.4.0 [46] and R Statistical Software (v4.1.3; [50]). The mean annual air temperature and summer precipitation distributions of the 40-year projected periods (i.e., 2021–2060 and 2061–2100) were compared to the historical period (1981–2020) using the non-parametric Mann-Wilcoxon-Mann–Whitney U test [51]. Non-parametric tests were used for both the trend analysis and the distributional analyses because normality of the time series were not assumed, thus lessening the potential impact of outliers. Significance for all tests was assumed at the 95% confidence level. Additionally, grid-point and road corridor averages were computed for each park from the gridded products. The road corridor averages were calculated by weighting the grid cells that corresponded to the road coordinates according to the total number of road coordinates in each cell. The shapefiles containing Denali Park Road and McCarthy Road are available from https://dot.alaska.gov/stwddes/gis/shapefiles.shtml (accessed on 29 July 2022) and for the proposed Ambler Road from https://eplanning.blm.gov/eplanning-ui/project/57323/590 (accessed on 29 July 2022).
Prior to assessment of climate indicator change between the RCP8.5 simulations and the ERA5, the projected mean annual air temperature and summer precipitation data were bias-corrected using the quantile-delta mapping algorithm as described by Cannon et al. [52]. With this method, the climate model historical value of temperature was subtracted from the climate model projected value to produce a model relative change, or delta. This delta was then added to the ERA5 value (i.e., gridded observations) to generate a bias-corrected projection. For precipitation, a ratio was applied in the same manner. This was done at all points in the 40-year distributions of MAAT and JJA PCPT for both the mid (2021–2060)- and late-century (2061–2100) periods from the CCSM and the GFDL, relative to the ERA5. For example, the lowest CCSM historical MAAT value (1981–2020) was subtracted from the lowest CCSM mid-century MAAT value (2021–2060) and then that difference was added to the lowest ERA5 MAAT value (1981–2020). This was repeated for all 40 ranked values of the distributions and computed at each grid point. Figure 3 shows the workflow of the research process.

3. Results

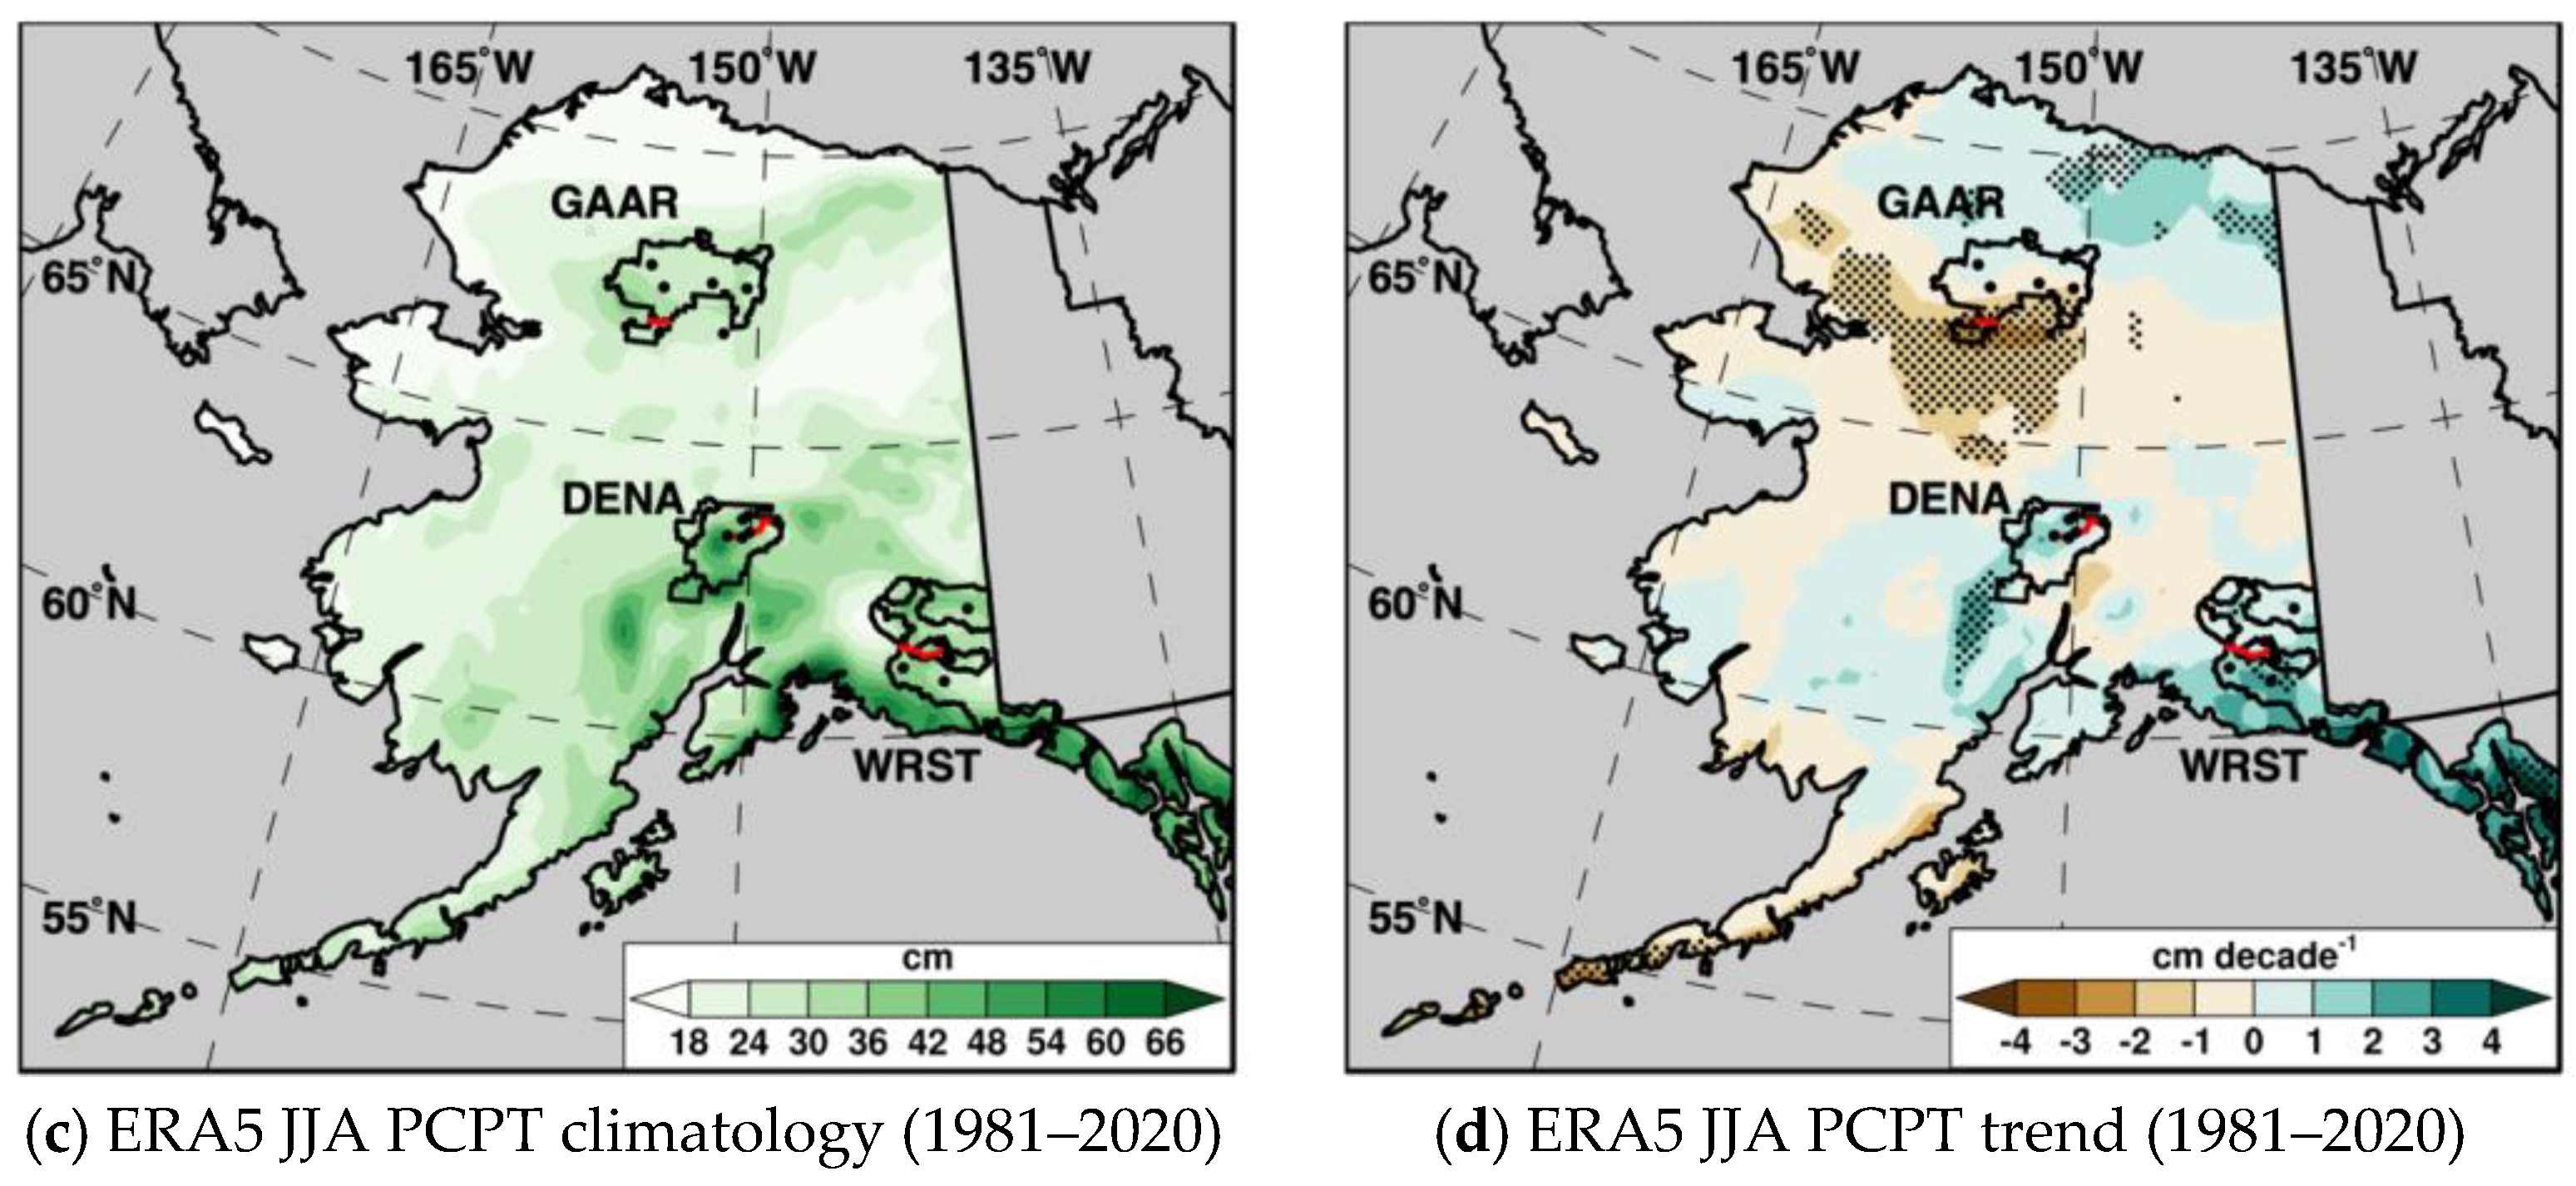
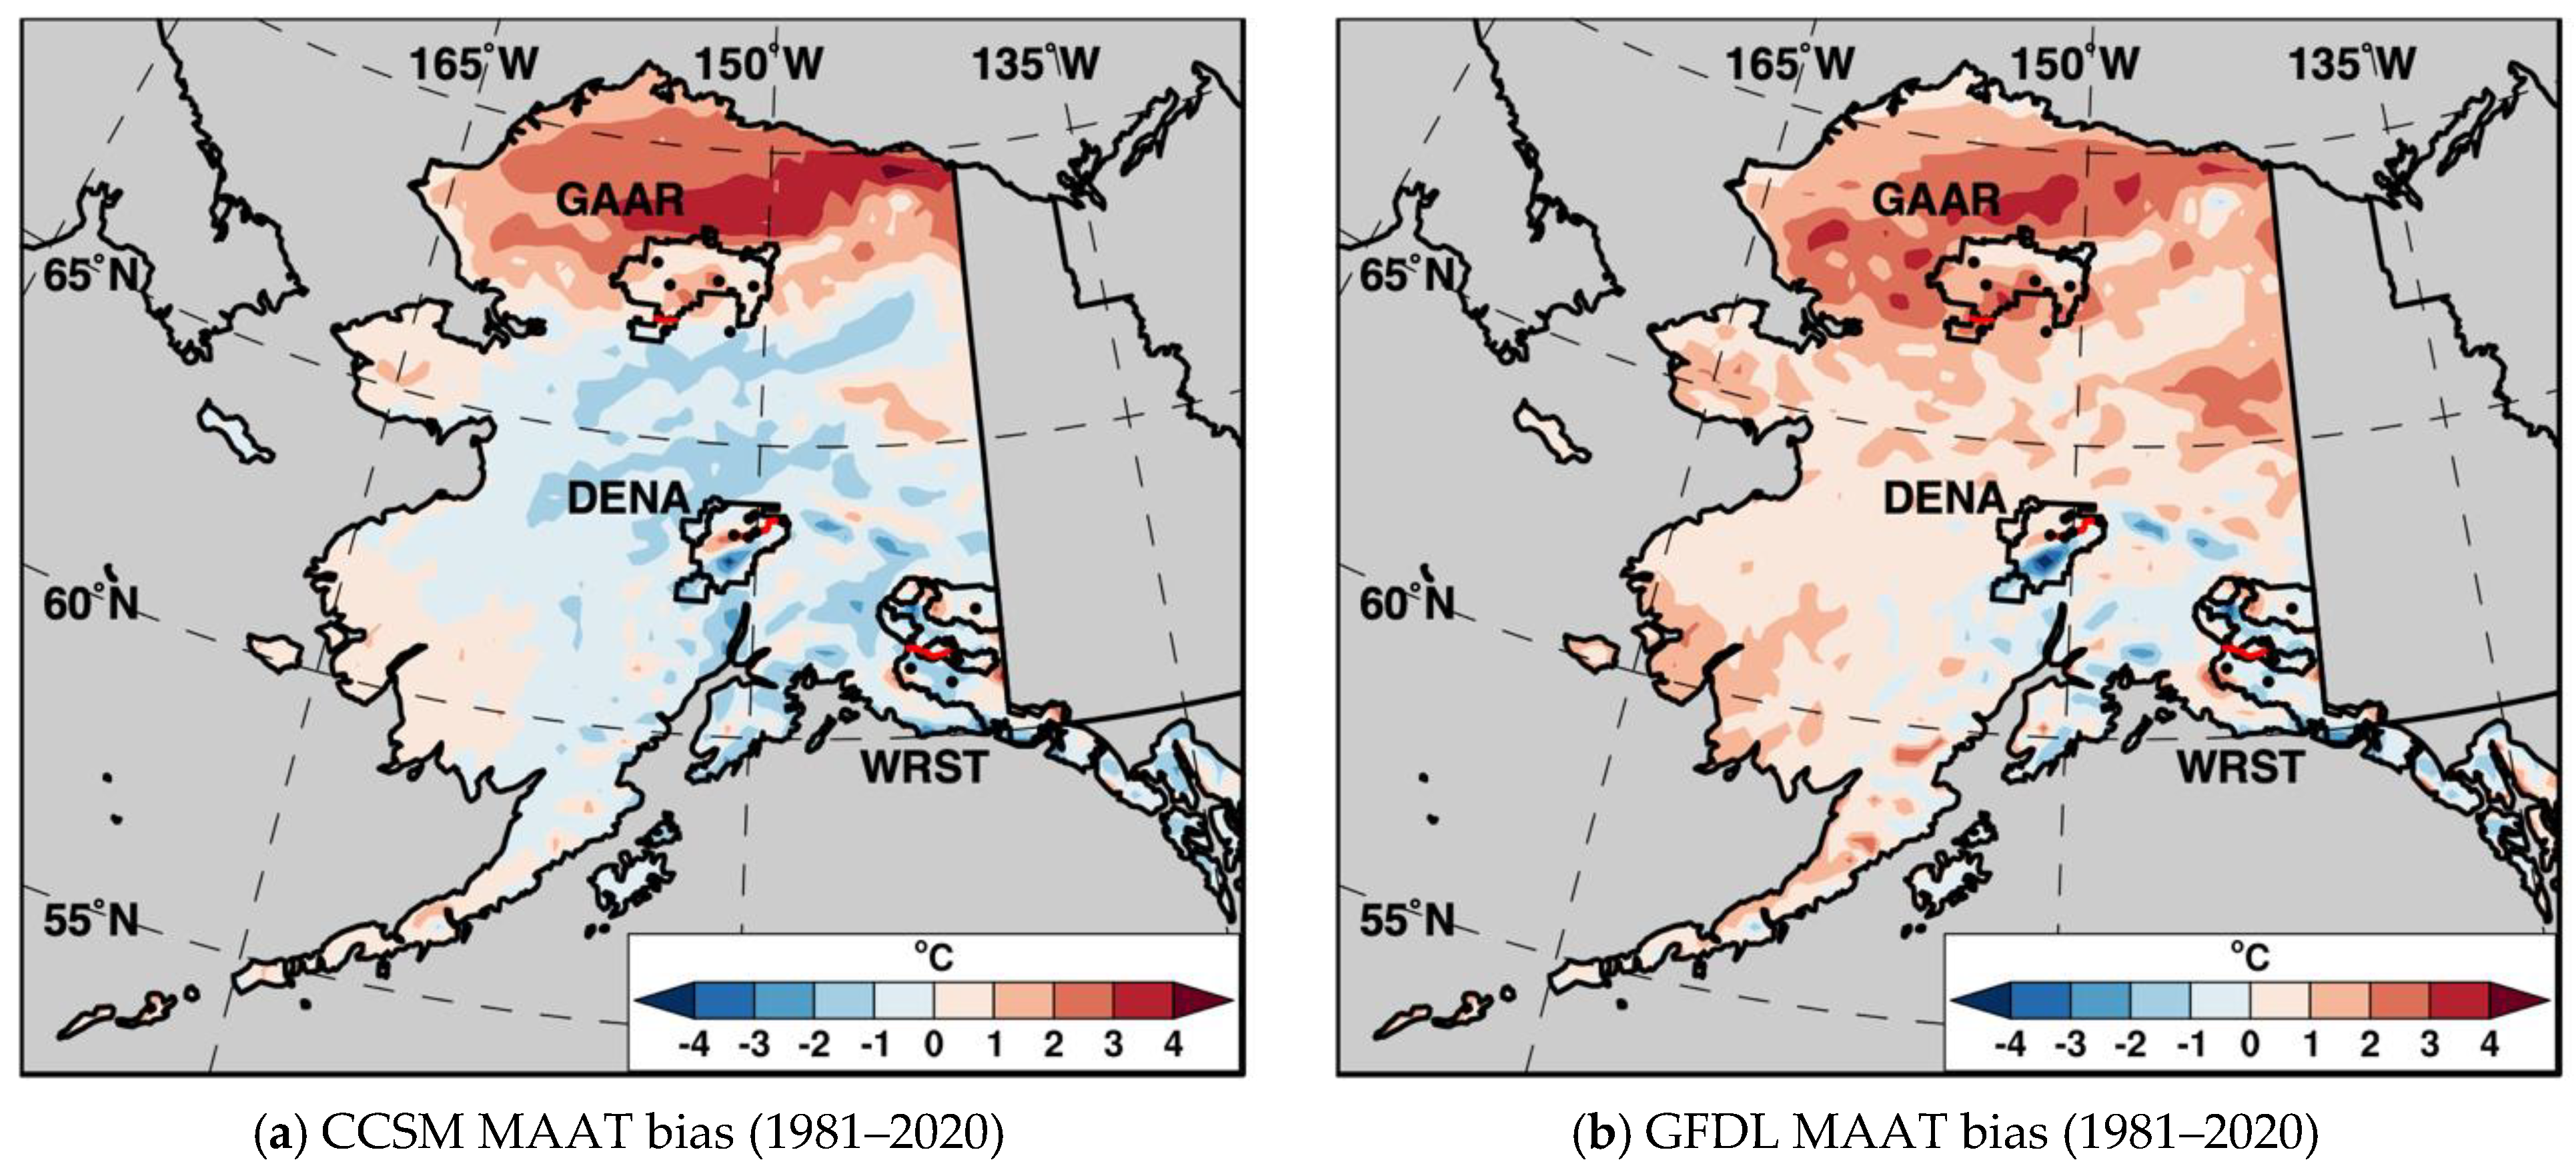
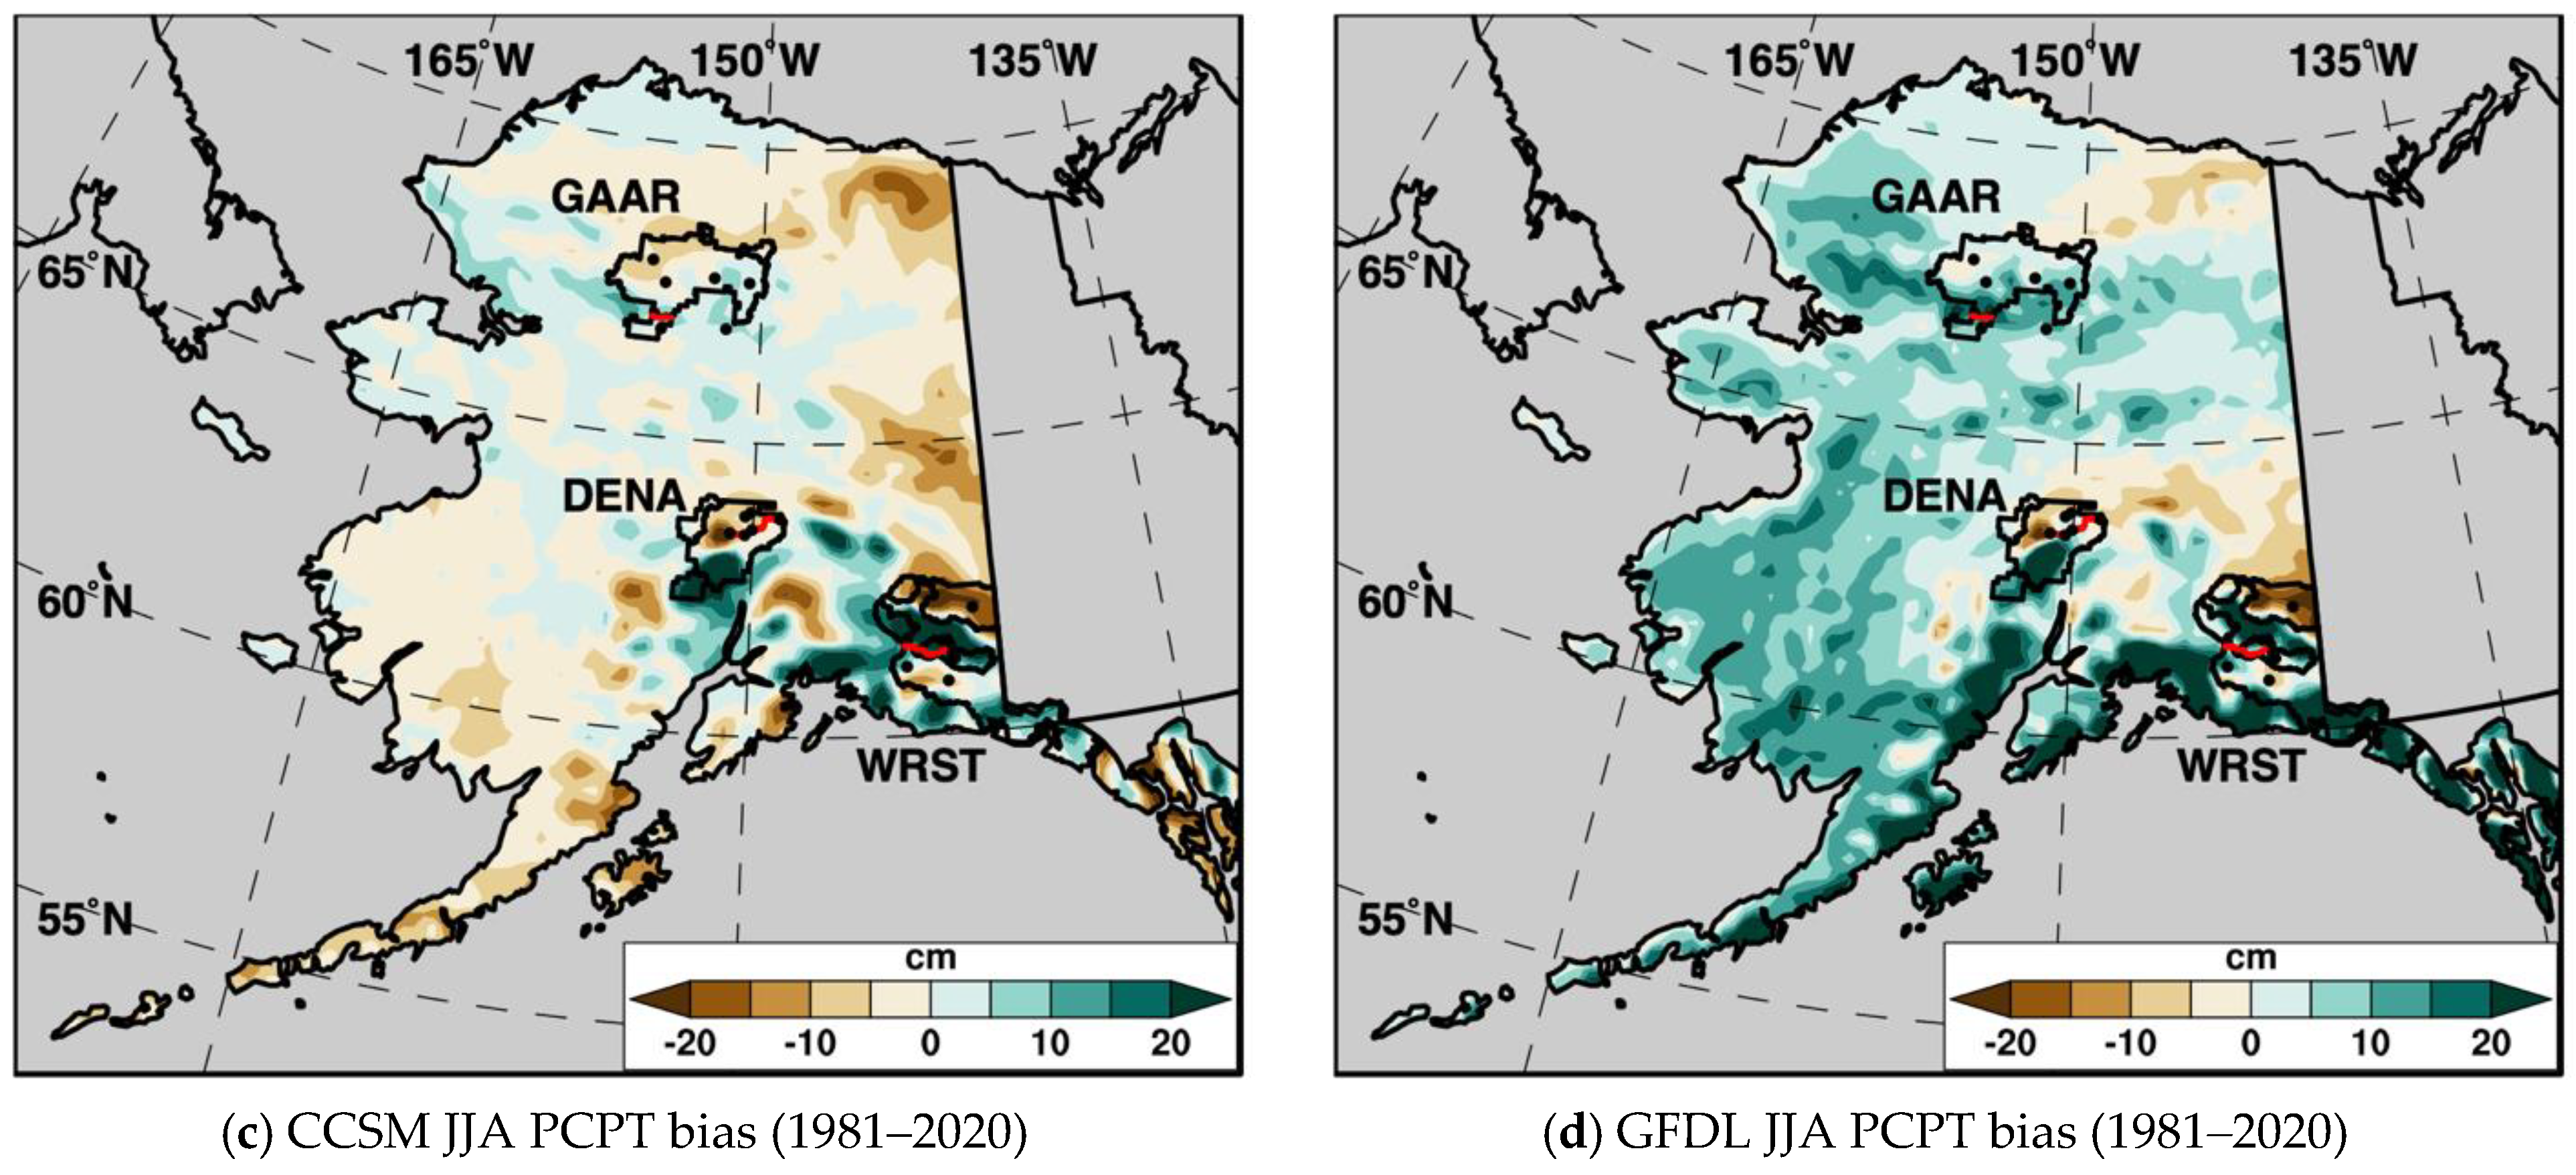
3.1. Historical ERA5 Climatology and Climate Model Bias (1981–2020)

The ERA5 mean annual air temperature climatology (Figure 4a) shows below freezing values for most of mainland Alaska with grid-point park averages of −9.2 °C, −3.8 °C, and −5.1 °C for Gates of the Arctic, Denali, and Wrangell-St. Elias, respectively (Table 2). The majority of these areas show significant warming trends over the past 40 years (Figure 4b) with grid-point park average trends of 0.6 °C, 0.5 °C, and 0.3 °C per decade, for Gates of the Arctic, Denali, and Wrangell-St. Elias, respectively, all of which were significant (Table 2). Significant ERA5 mean annual air temperature trends were also found across the road corridors in all three parks. The ERA5 summer precipitation climatology (Figure 4c) illustrates how variable summer precipitation is across Alaska, with less than 12 cm over areas of the North Slope to greater than 60 cm in parts of southeast Alaska. ERA5 summer precipitation trends (Figure 4d) indicated areas of significantly increasing and decreasing amounts. DENA was the wettest park, on average, at 39.7 cm per summer, followed by WRST (35.9 cm), and GAAR (29.4 cm); meanwhile, none of the ERA5 JJA PCPT per-decade trends were significant, with a negative value in GAAR (−0.5 cm) and positive values at DENA (0.5 cm) and WRST (1.4 cm) (Table 2). Summer precipitation trends over the road corridors were of the same sign as the park averages and were not significant.
The historical climate models (1981–2020) had areas of consistent mean annual air temperature bias relative to the ERA5 (e.g., too warm across the North Slope) and inconsistent bias [e.g., interior Alaska where CCSM was too cool (Figure 5a) and GFDL too warm (Figure 5b)]. The CCSM was 0.9 °C too warm, on average, across Gates of the Arctic, and too cool in Denali and Wrangell-St. Elias with biases of −0.5 °C, and −0.3 °C, respectively; the GFDL was even warmer in Gates of the Arctic with a bias of 1.4 °C, and had equally cool biases as the CCSM across Denali and Wrangell-St. Elias (Table 2). The historical CCSM had a slightly negative summer precipitation bias in Gates of the Arctic (−0.9 cm) and positive biases in Denali (5.6 cm) and Wrangell-St. Elias (5.7 cm) (Figure 5c); the GFDL had positive (i.e., wet) biases in all three parks, with values of 5.7 cm, 10.5 cm, 8.9 cm for Gates of the Arctic, Denali, and Wrangell-St. Elias, respectively. The summer precipitation biases along each park’s road corridor were positive, except for CCSM in Denali (Table 2).

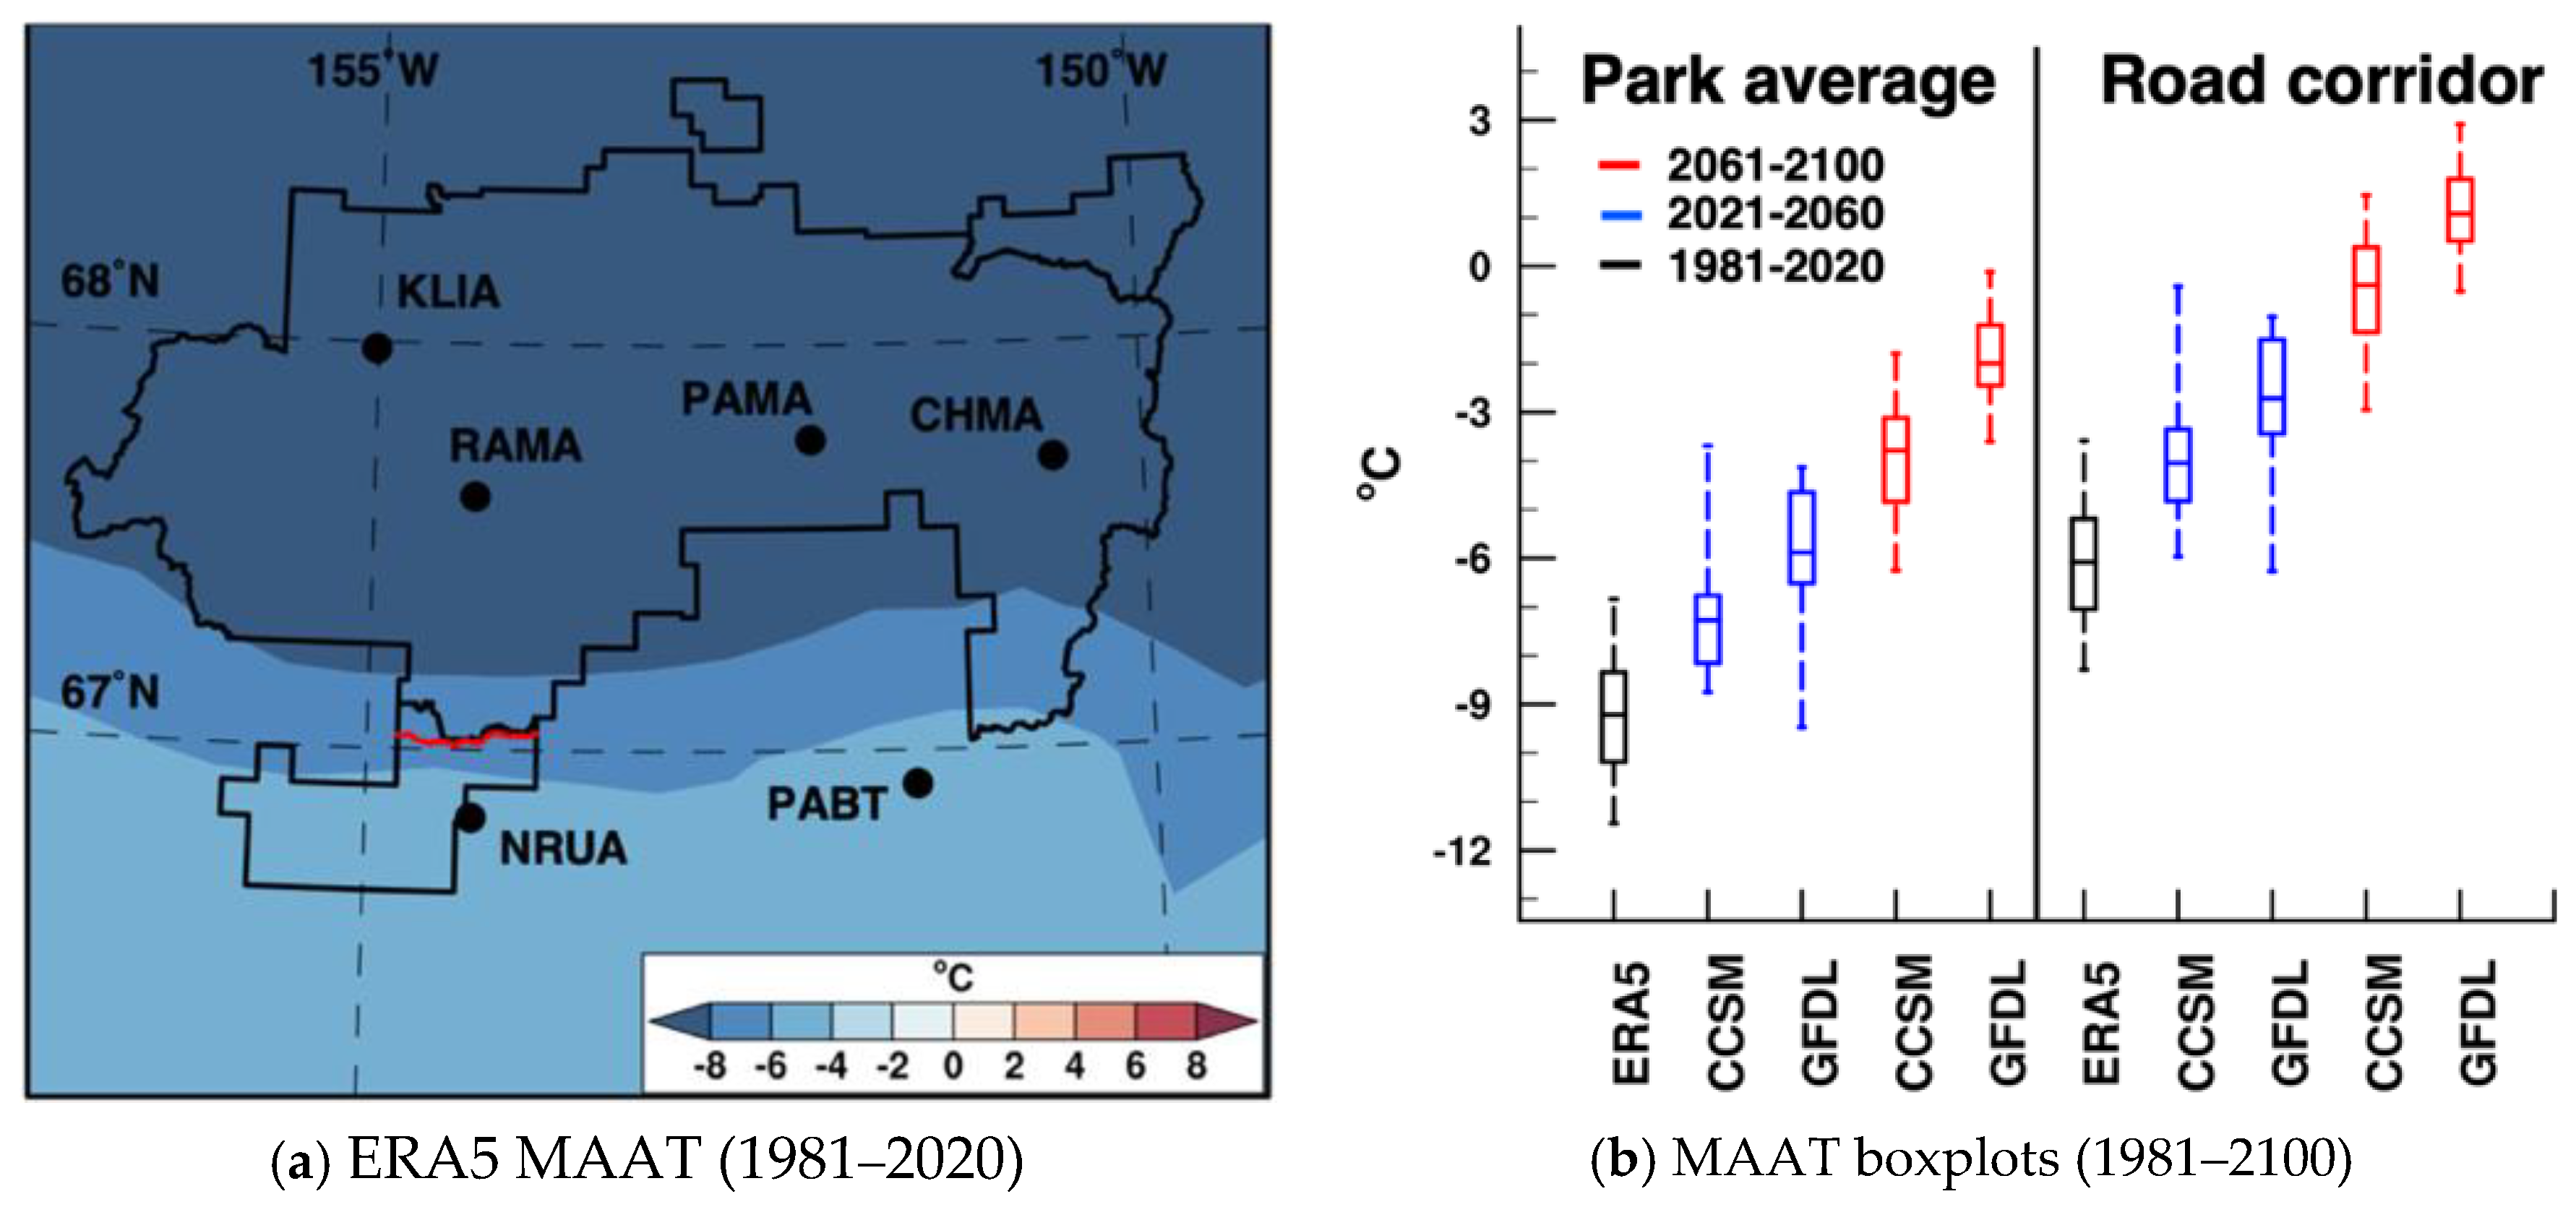
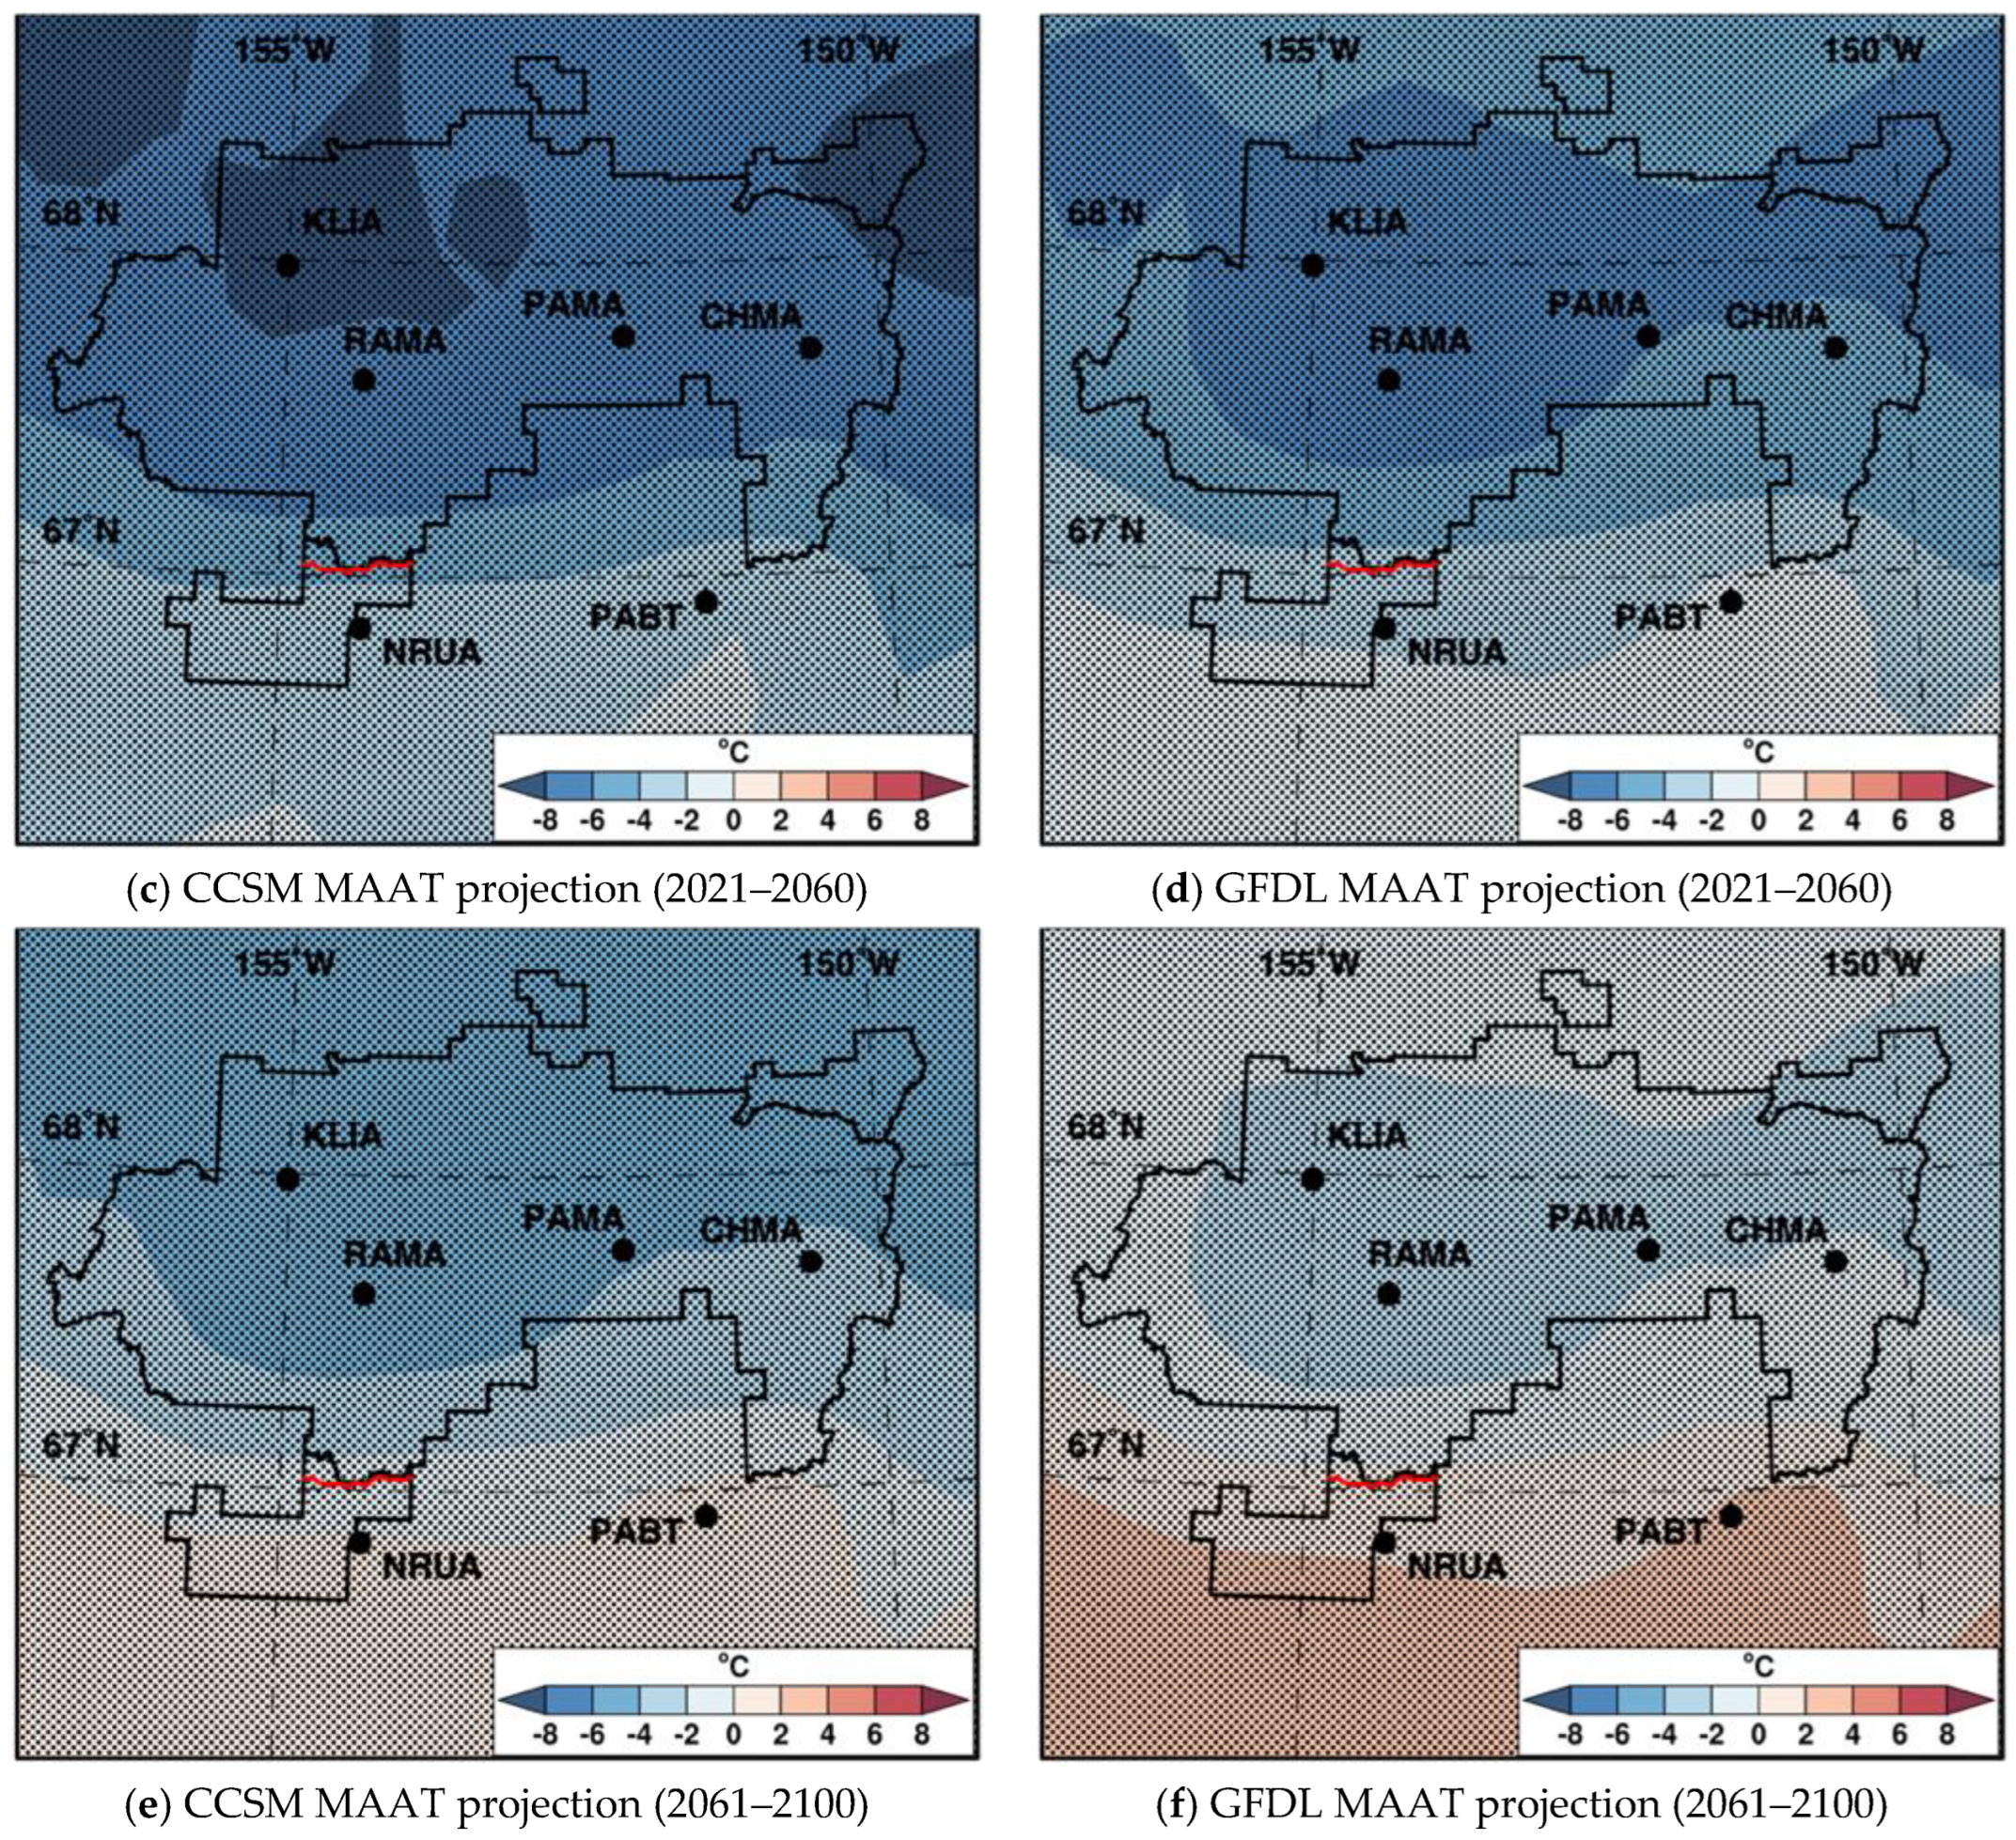
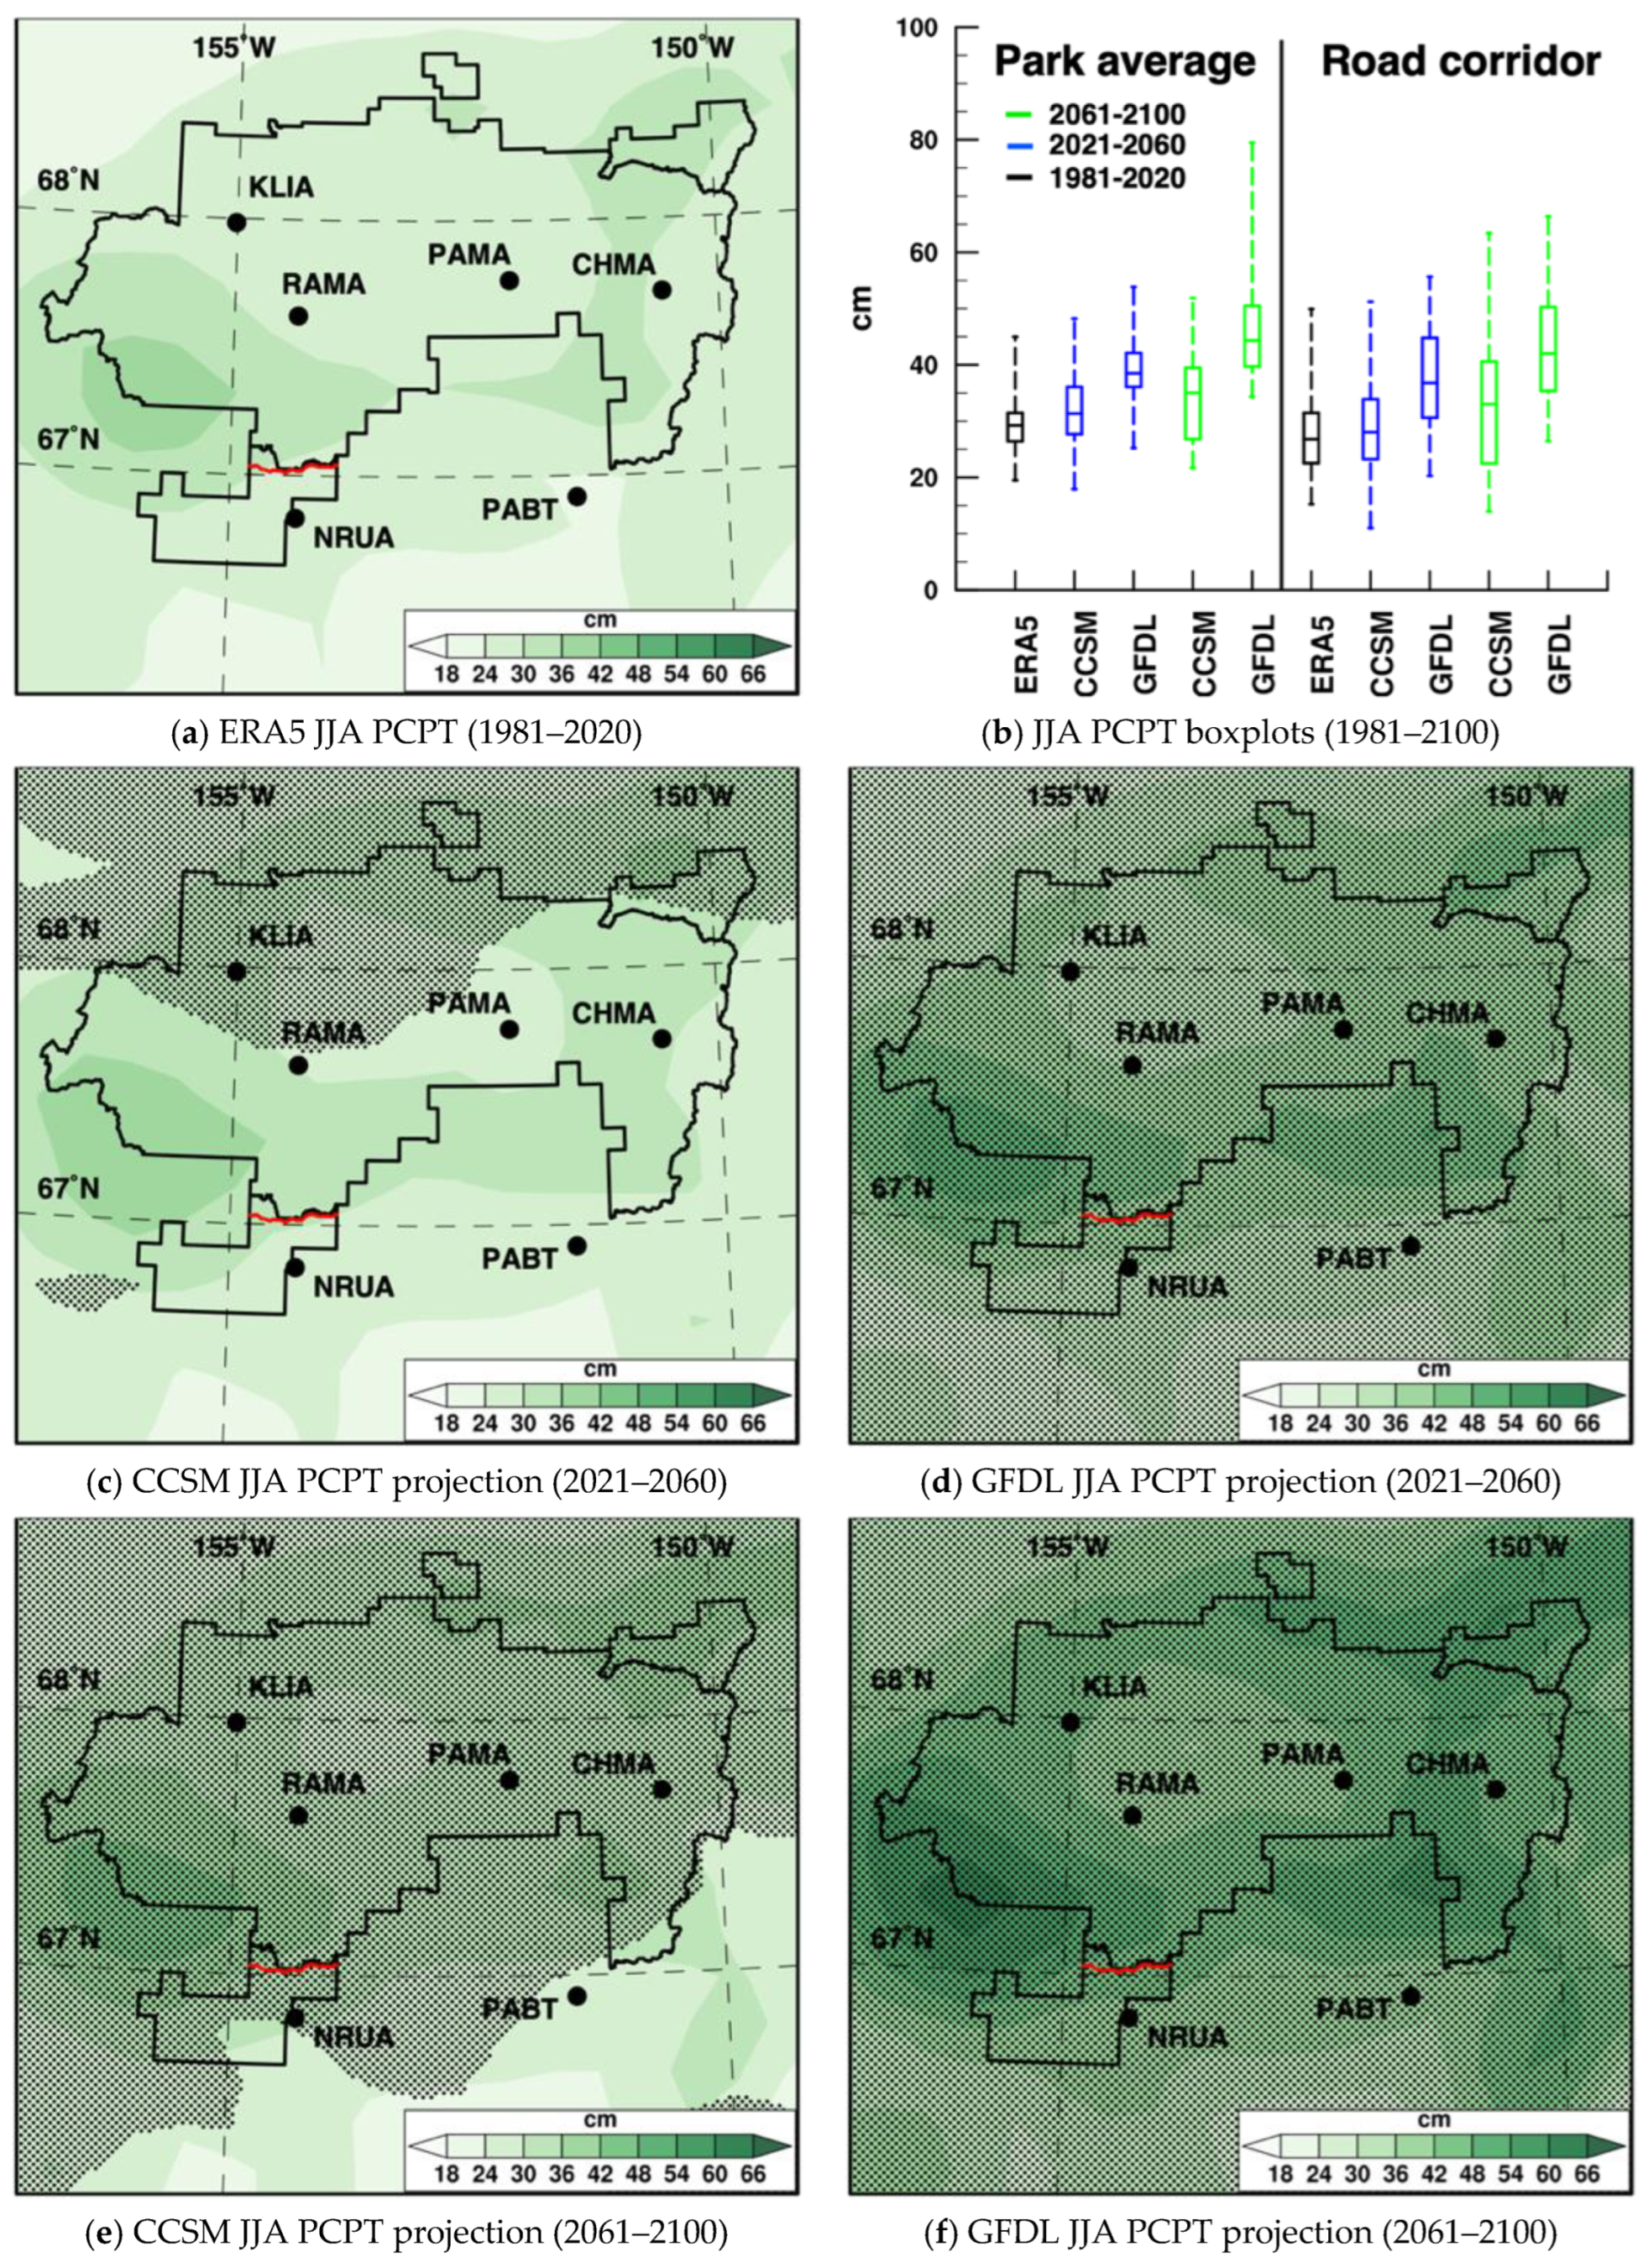
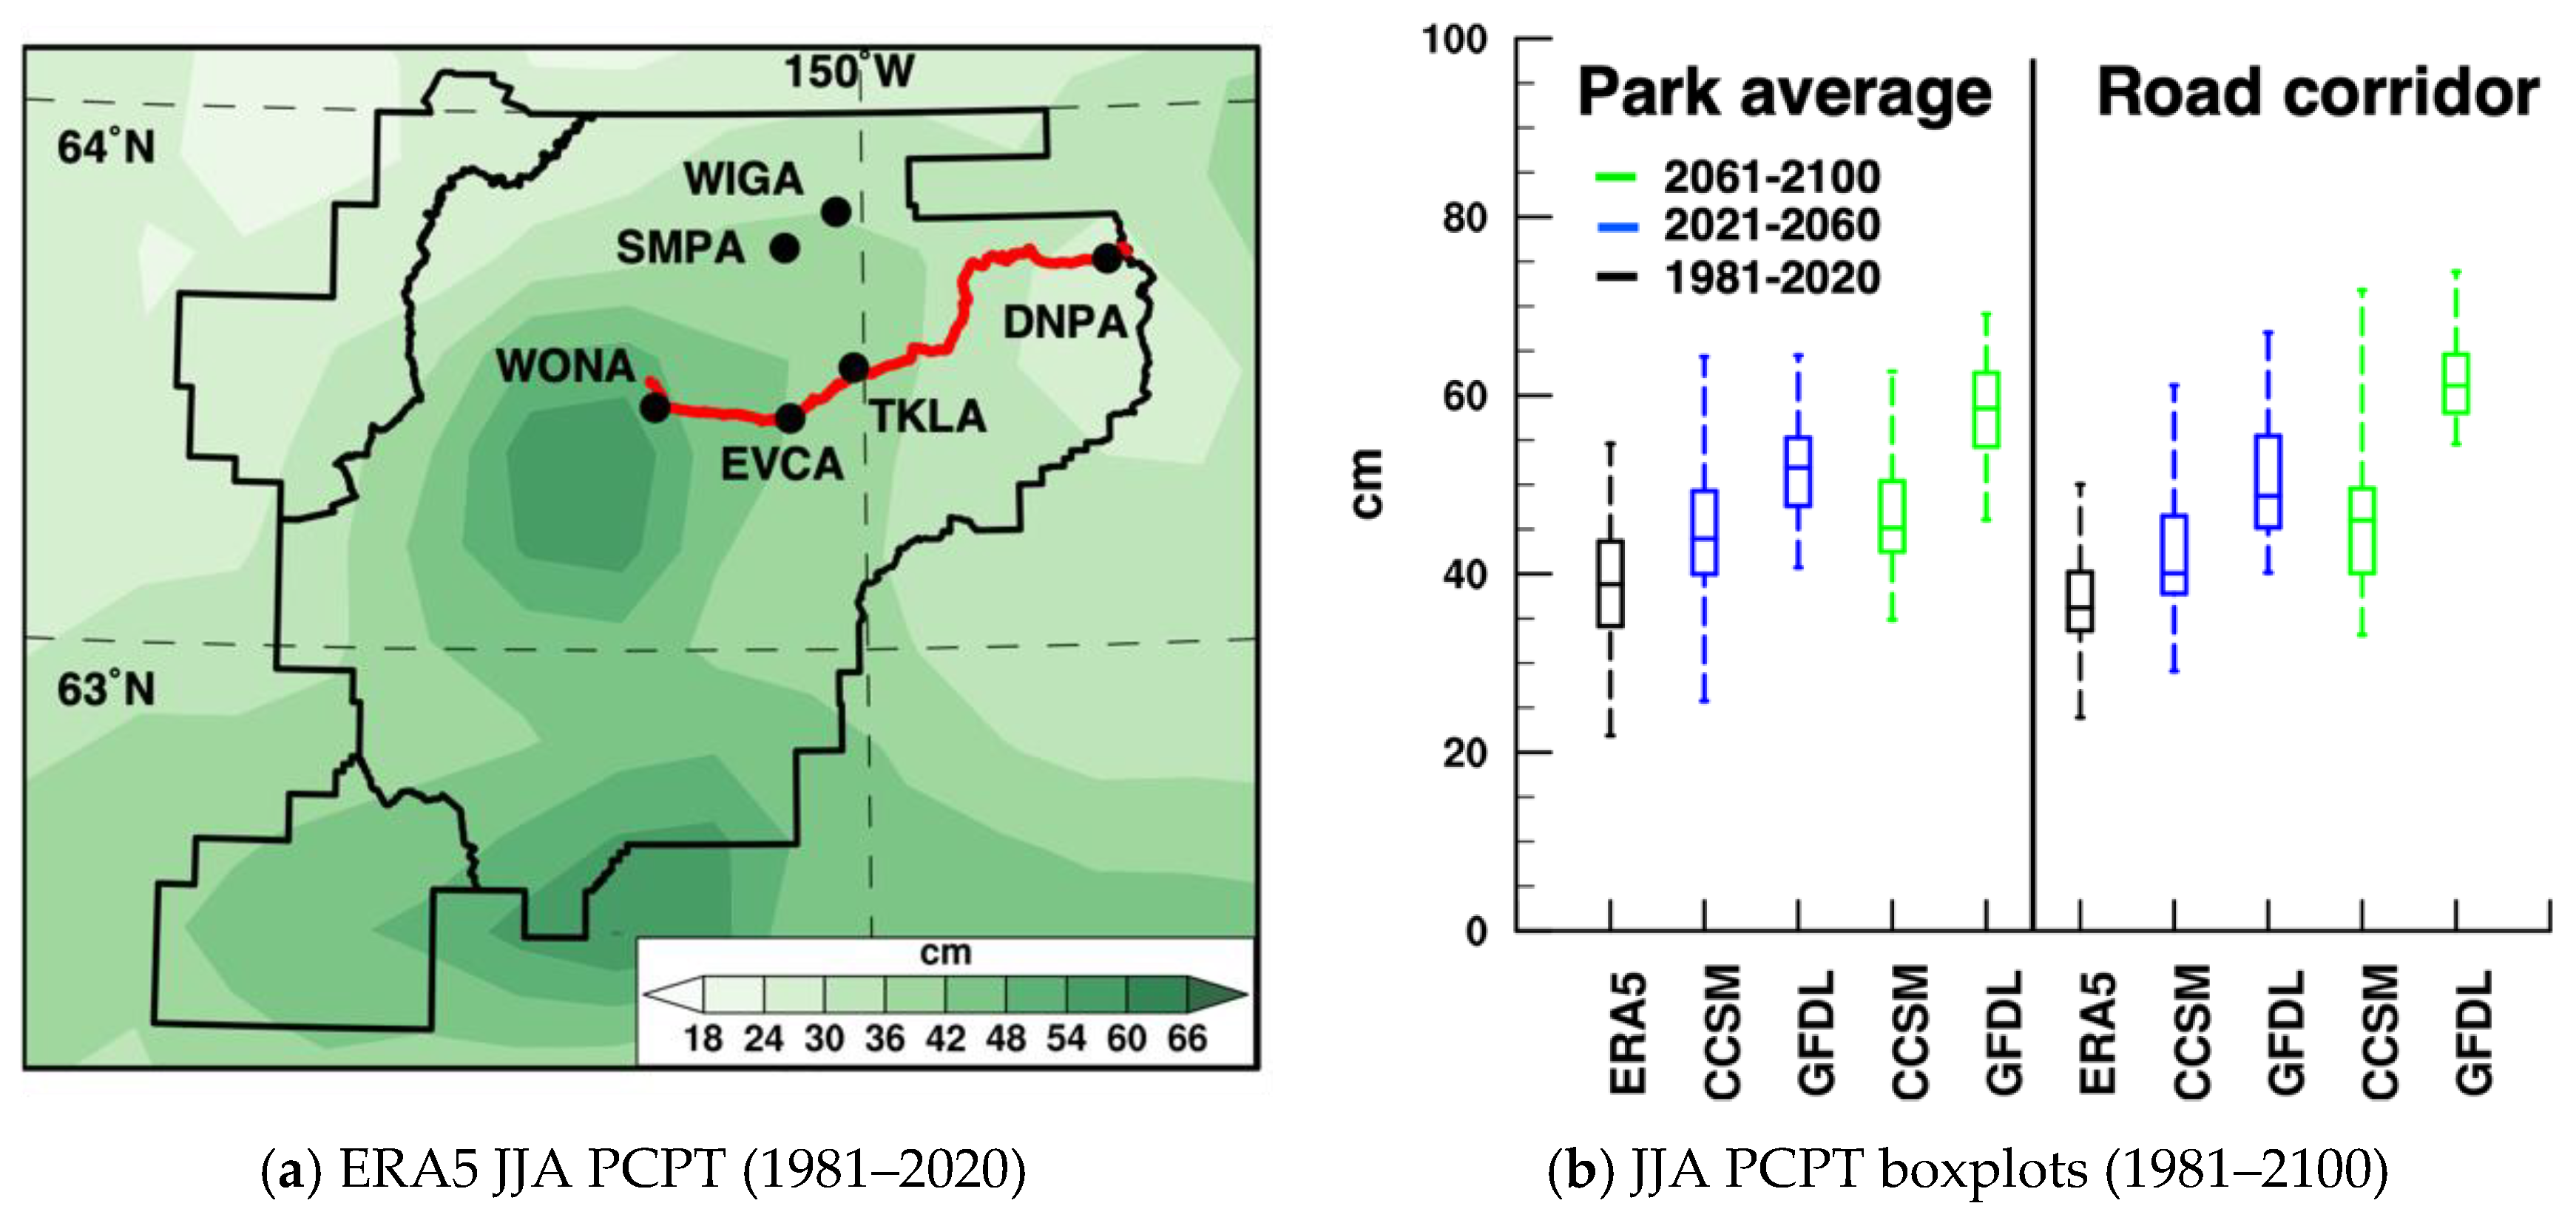
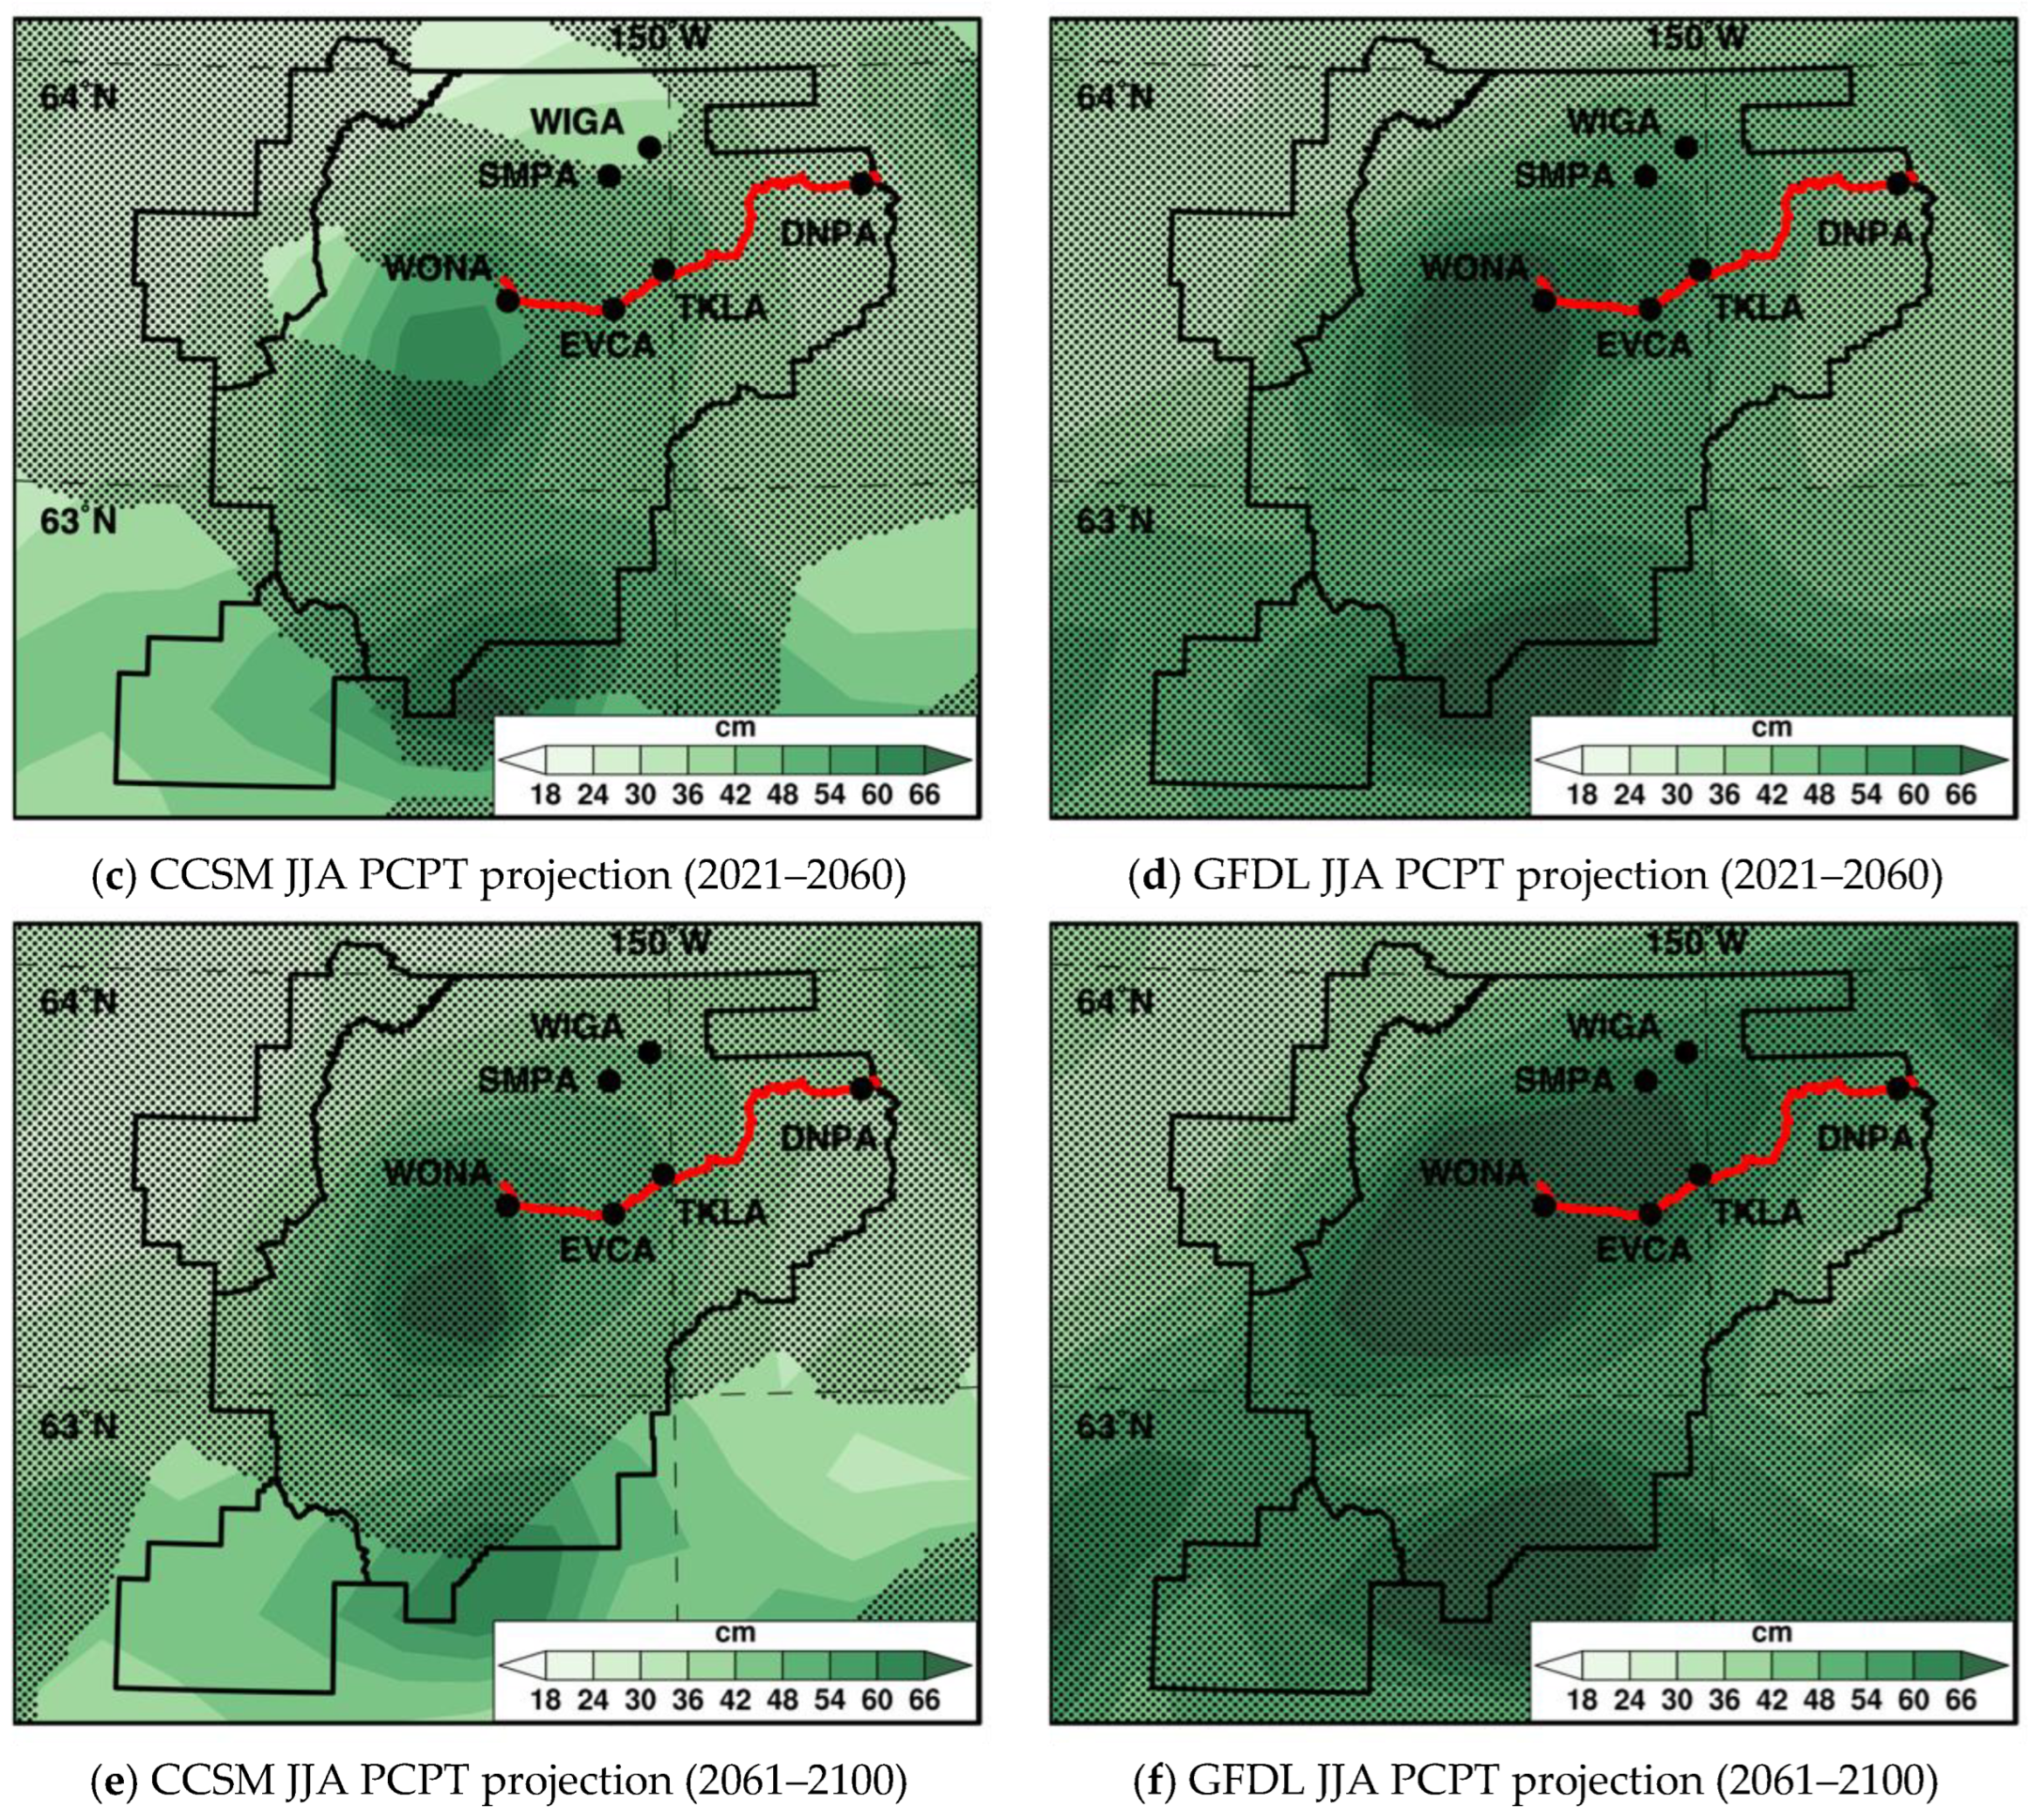
3.2. Gates of the Arctic
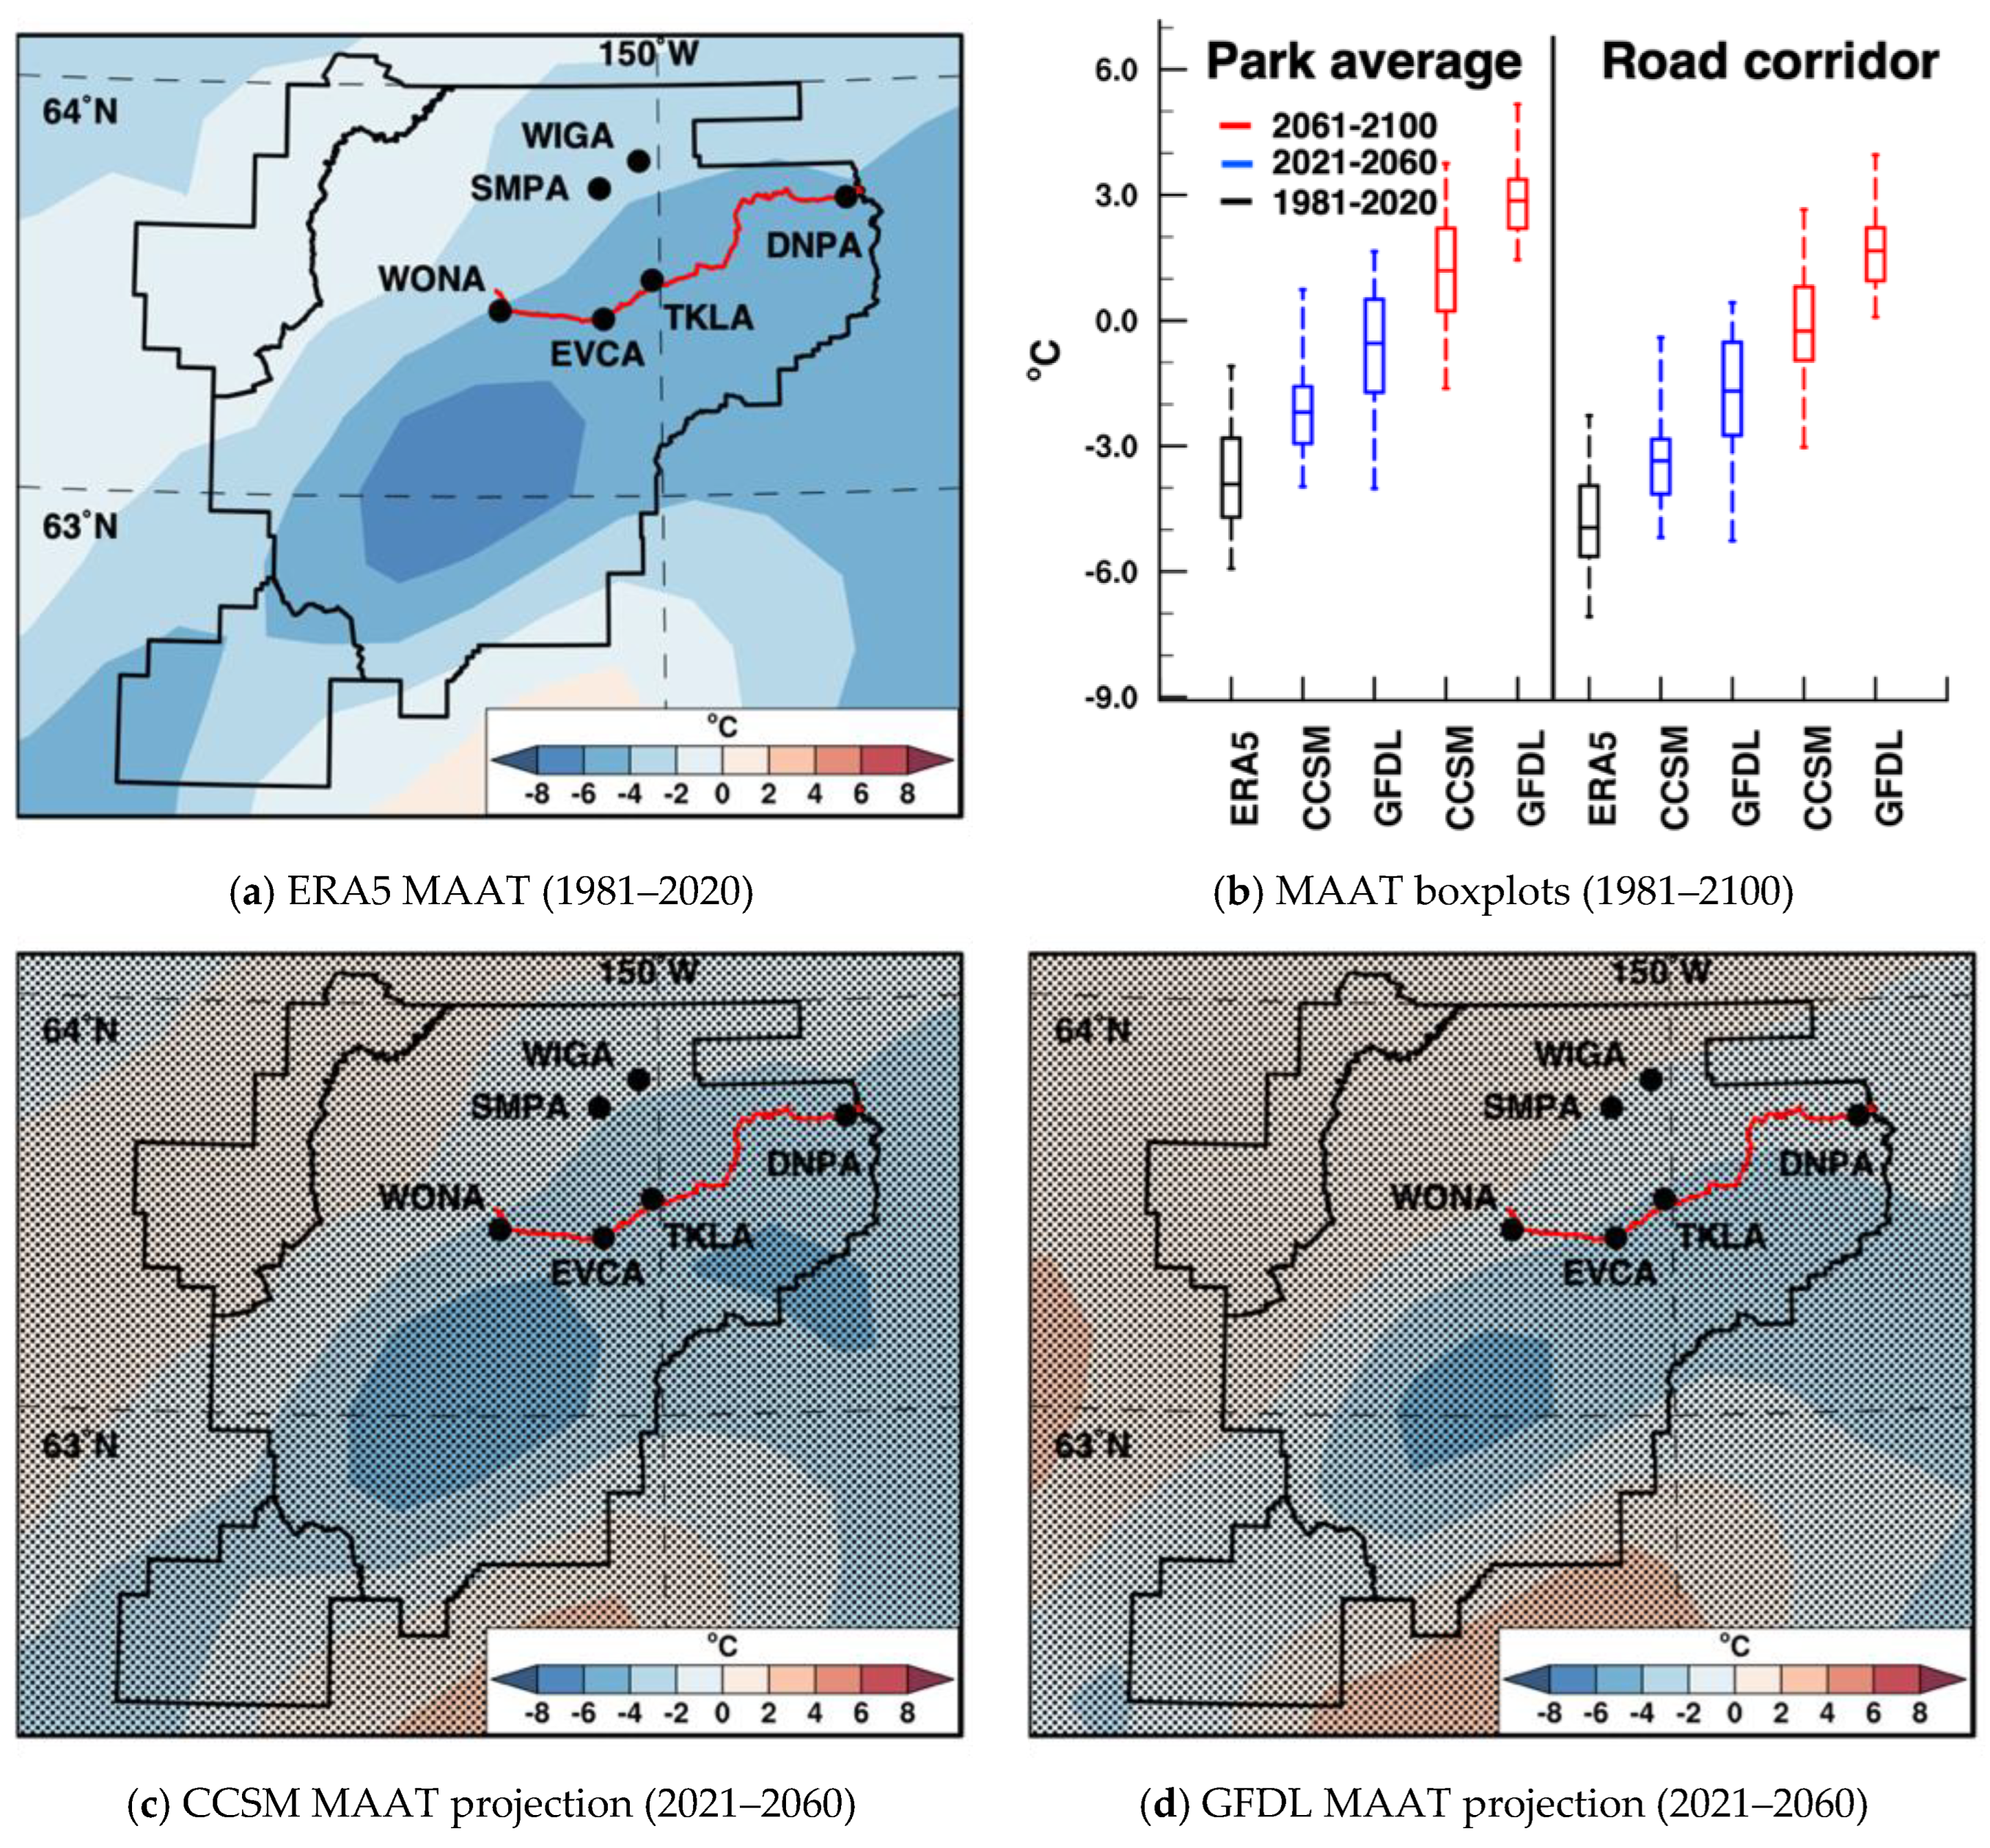
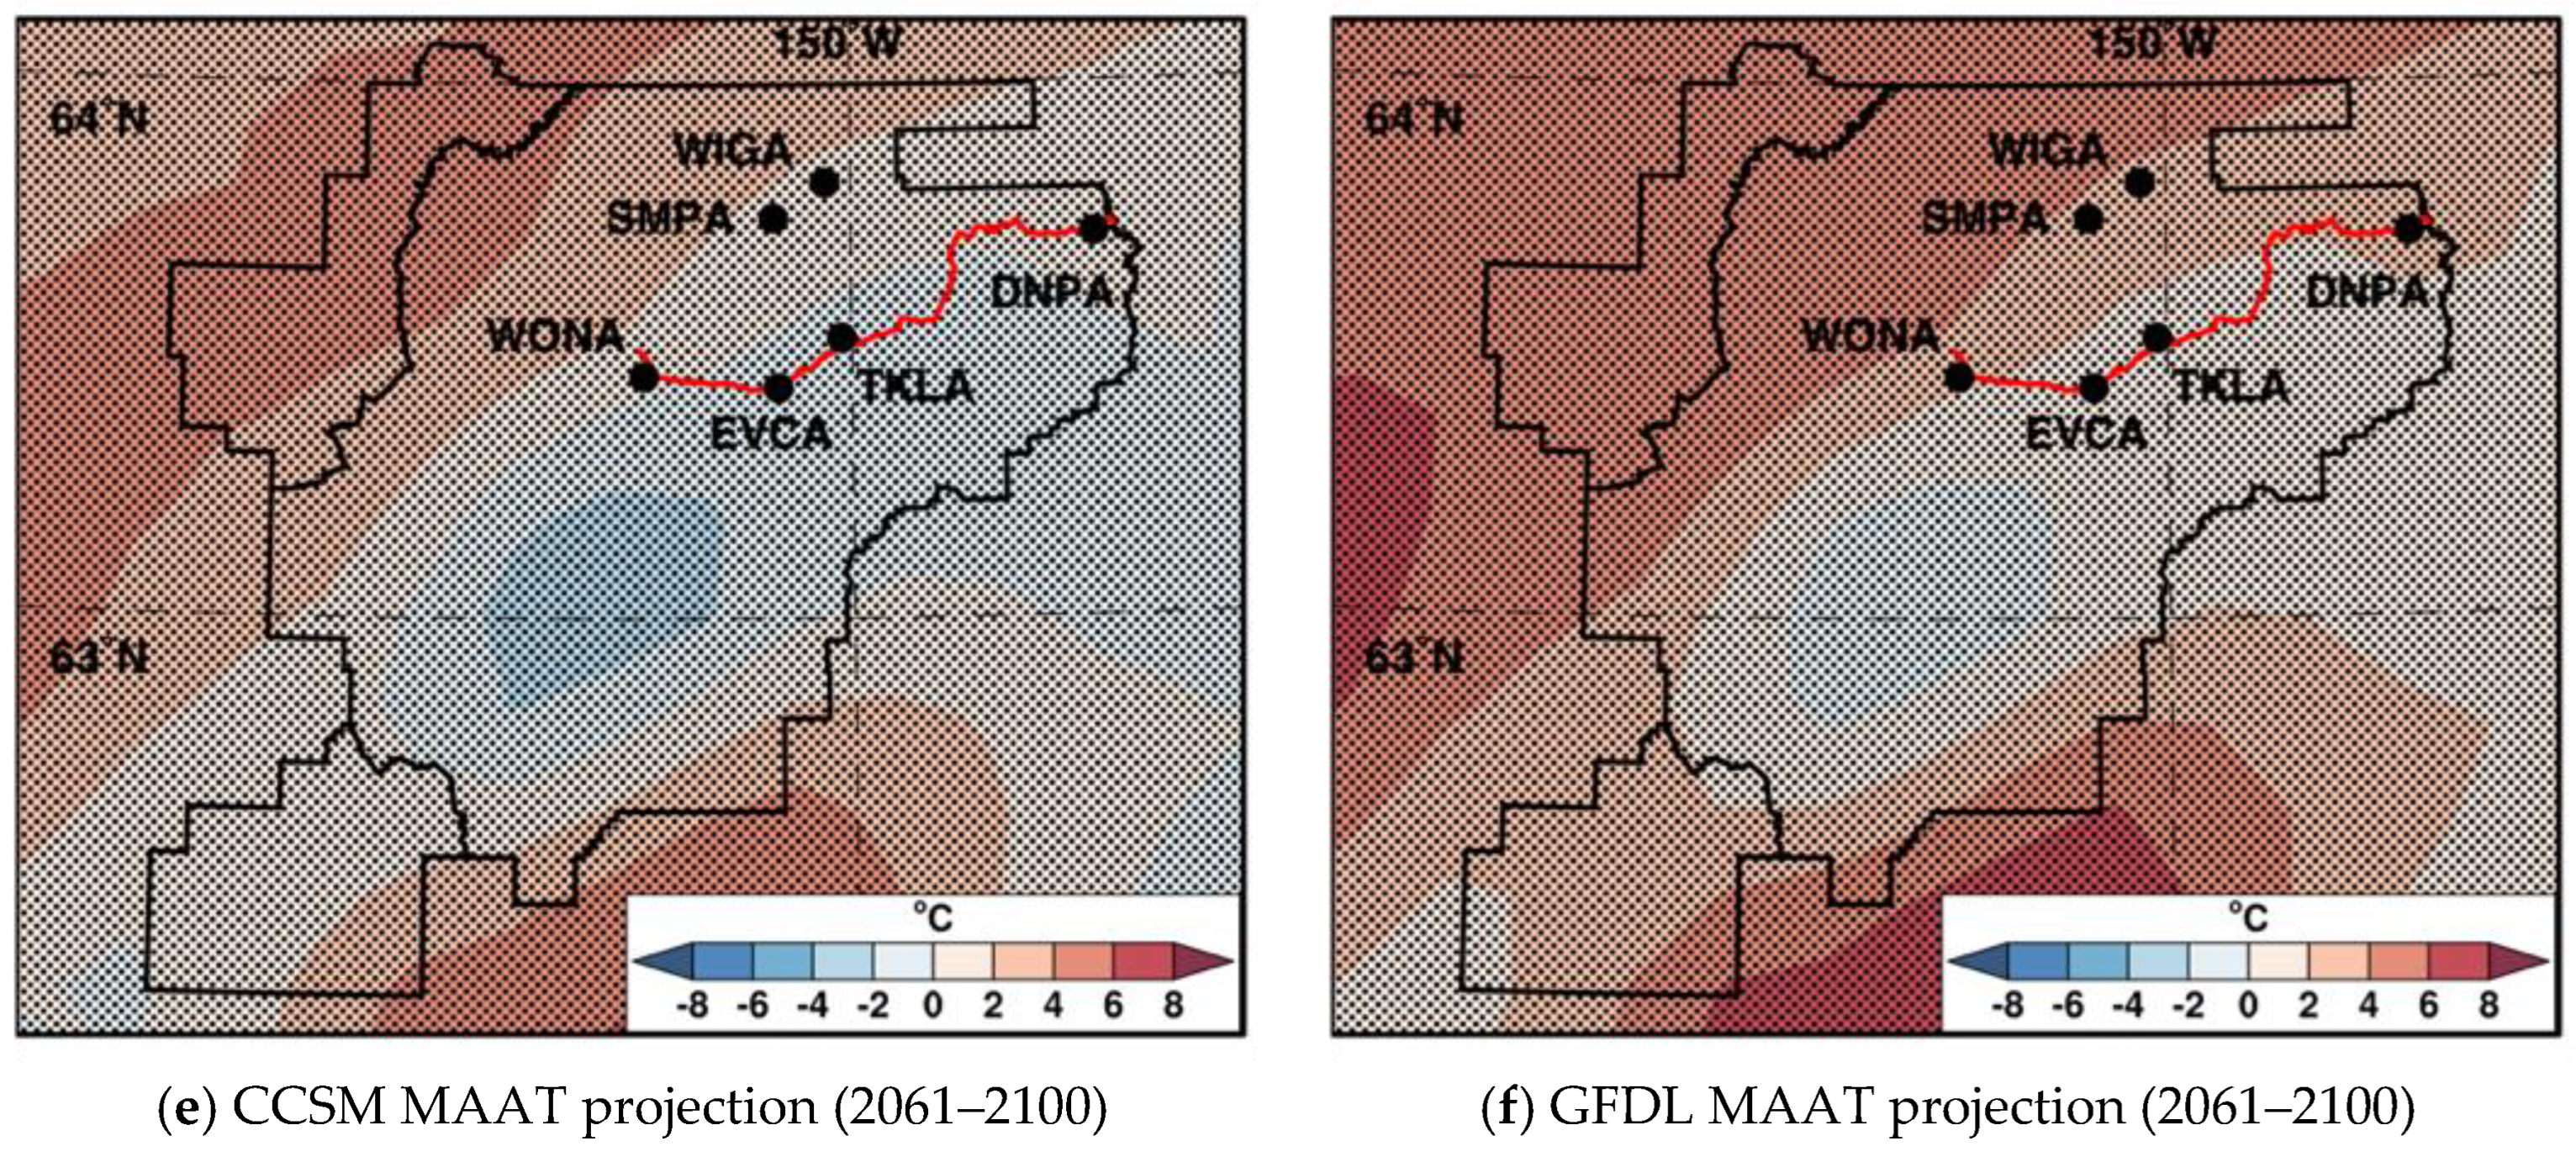
The ERA5 Gates of the Arctic mean annual air temperature climatology (1981–2020) shows a north–south gradient (Figure 6a) with park-average and road corridor means of −9.2 °C and −6.1 °C, respectively (Table 2). None of the ERA5 area averages of mean annual air temperature within Gates of the Arctic exceeded 0 °C, nor did they in the mid-century projected period (2021–2060); however, by late-century (2061–2100) both climate models showed above freezing values along the road corridor (Figure 6b). In the late-century CCSM, the upper quartile value along the road corridor was 0.4 °C and the maximum was 1.5 °C; the GFDL was warmer with a lower quartile value of 0.5 °C and maximum of 2.9 °C (Table 3), thus indicating that above freezing mean annual air temperatures become likely. Mid-century mean annual air temperature projections from CCSM (Figure 6c) and GFDL (Figure 6d) showed significant warming, which then continued into the late-century for CCSM (Figure 6e) and GFDL (Figure 6f). The late-century mean annual air temperature distributions from both CCSM and GFDL showed distributions entirely outside (e.g., warmer) of the ERA5 range (Figure 6b).
Historical Gates of the Arctic summer precipitation amounts from ERA5 (1981–2020) indicated that most areas typically received from 24–36 cm (Figure 7a). The park-average was 29.4 cm, while the average over the road corridor was 27.9 cm (Table 2). Although neither of the grid-averaged historical trends were significantly negative, some trends in the southern parts of Gates of the Arctic were (Figure 4d). However, median precipitation in Gates of the Arctic was projected to increase for each successive 40-year projected period, and the interquartile ranges in all of the projected distributions—park-average and road corridor—were larger than the historical ERA5 (Figure 7b; Table 3). This indicates a general increase in both summer precipitation amount and variability; in fact, CCSM showed lower mid-century (2021–2060) minima than ERA5. Despite this, CCSM showed a broad area of significantly wetter summers by mid-century across northern Gates of the Arctic (Figure 7c) and GFDL showed this over the whole park (Figure 7d). By the late-century projection (2061–2100), CCSM indicated significantly wetter summers across most of Gates of the Arctic (Figure 7e) as did GFDL (Figure 7f).

3.3. Denali

The Denali ERA5 park-average and road corridor mean annual air temperatures (1981–2020) were −3.8 °C, and −4.9 °C, respectively (Figure 8a; Table 2), with significant warming trends parkwide (Figure 4b; Table 2). The road corridor was colder than the park average because of its higher mean elevation and it is located on the north side of the Alaska Range (Figure 2c). Warming trends were projected to continue for each successive 40-year period (Figure 8b), with significantly warmer conditions in both the mid-century (2021–2060) CCSM (Figure 8c) and GFDL (Figure 8d) and late-century (2061–2100) CCSM (Figure 8e) and GFDL (Figure 8f) projected across the entire park. The CCSM and GFDL projected above freezing park-average maximum mean annual air temperatures in the mid-century, but only GFDL did for the road corridor. The late-century CCSM park-average projection indicated that the lower quartile MAAT values would be above freezing, but only the upper quartile MAATs across the road corridor would be; for GFDL, all values of both distributions were projected to be above freezing (Figure 8b; Table 3).
The ERA5 summer precipitation (1981–2020) in Denali ranged from 18–60 cm (Figure 9a), with a long-term average (1923–2019) of 20.4 cm at McKinley Park (DNPA; Table 1), and the highest amounts occurred to the southwest of the road corridor, coincident with the highest elevations. Summer precipitation was projected to increase during each 40-year period relative to the historical ERA5 (Figure 9b). CCSM projections of the mid-century period (2021–2060) indicated significantly more summer precipitation in most parts of Denali (Figure 9c), whereas GFDL projected the entire region to be significantly wetter (Figure 9d). The CCSM projected continued increases in the late-century period (2061–2100), albeit less than the projected change from the historical to the mid-century (Figure 9e); the GFDL indicated no such lessening (Figure 9f) with a minimum late-century road corridor value of 54.6 cm, exceeding the historical ERA5 maximum of 50.0 cm (Table 3).

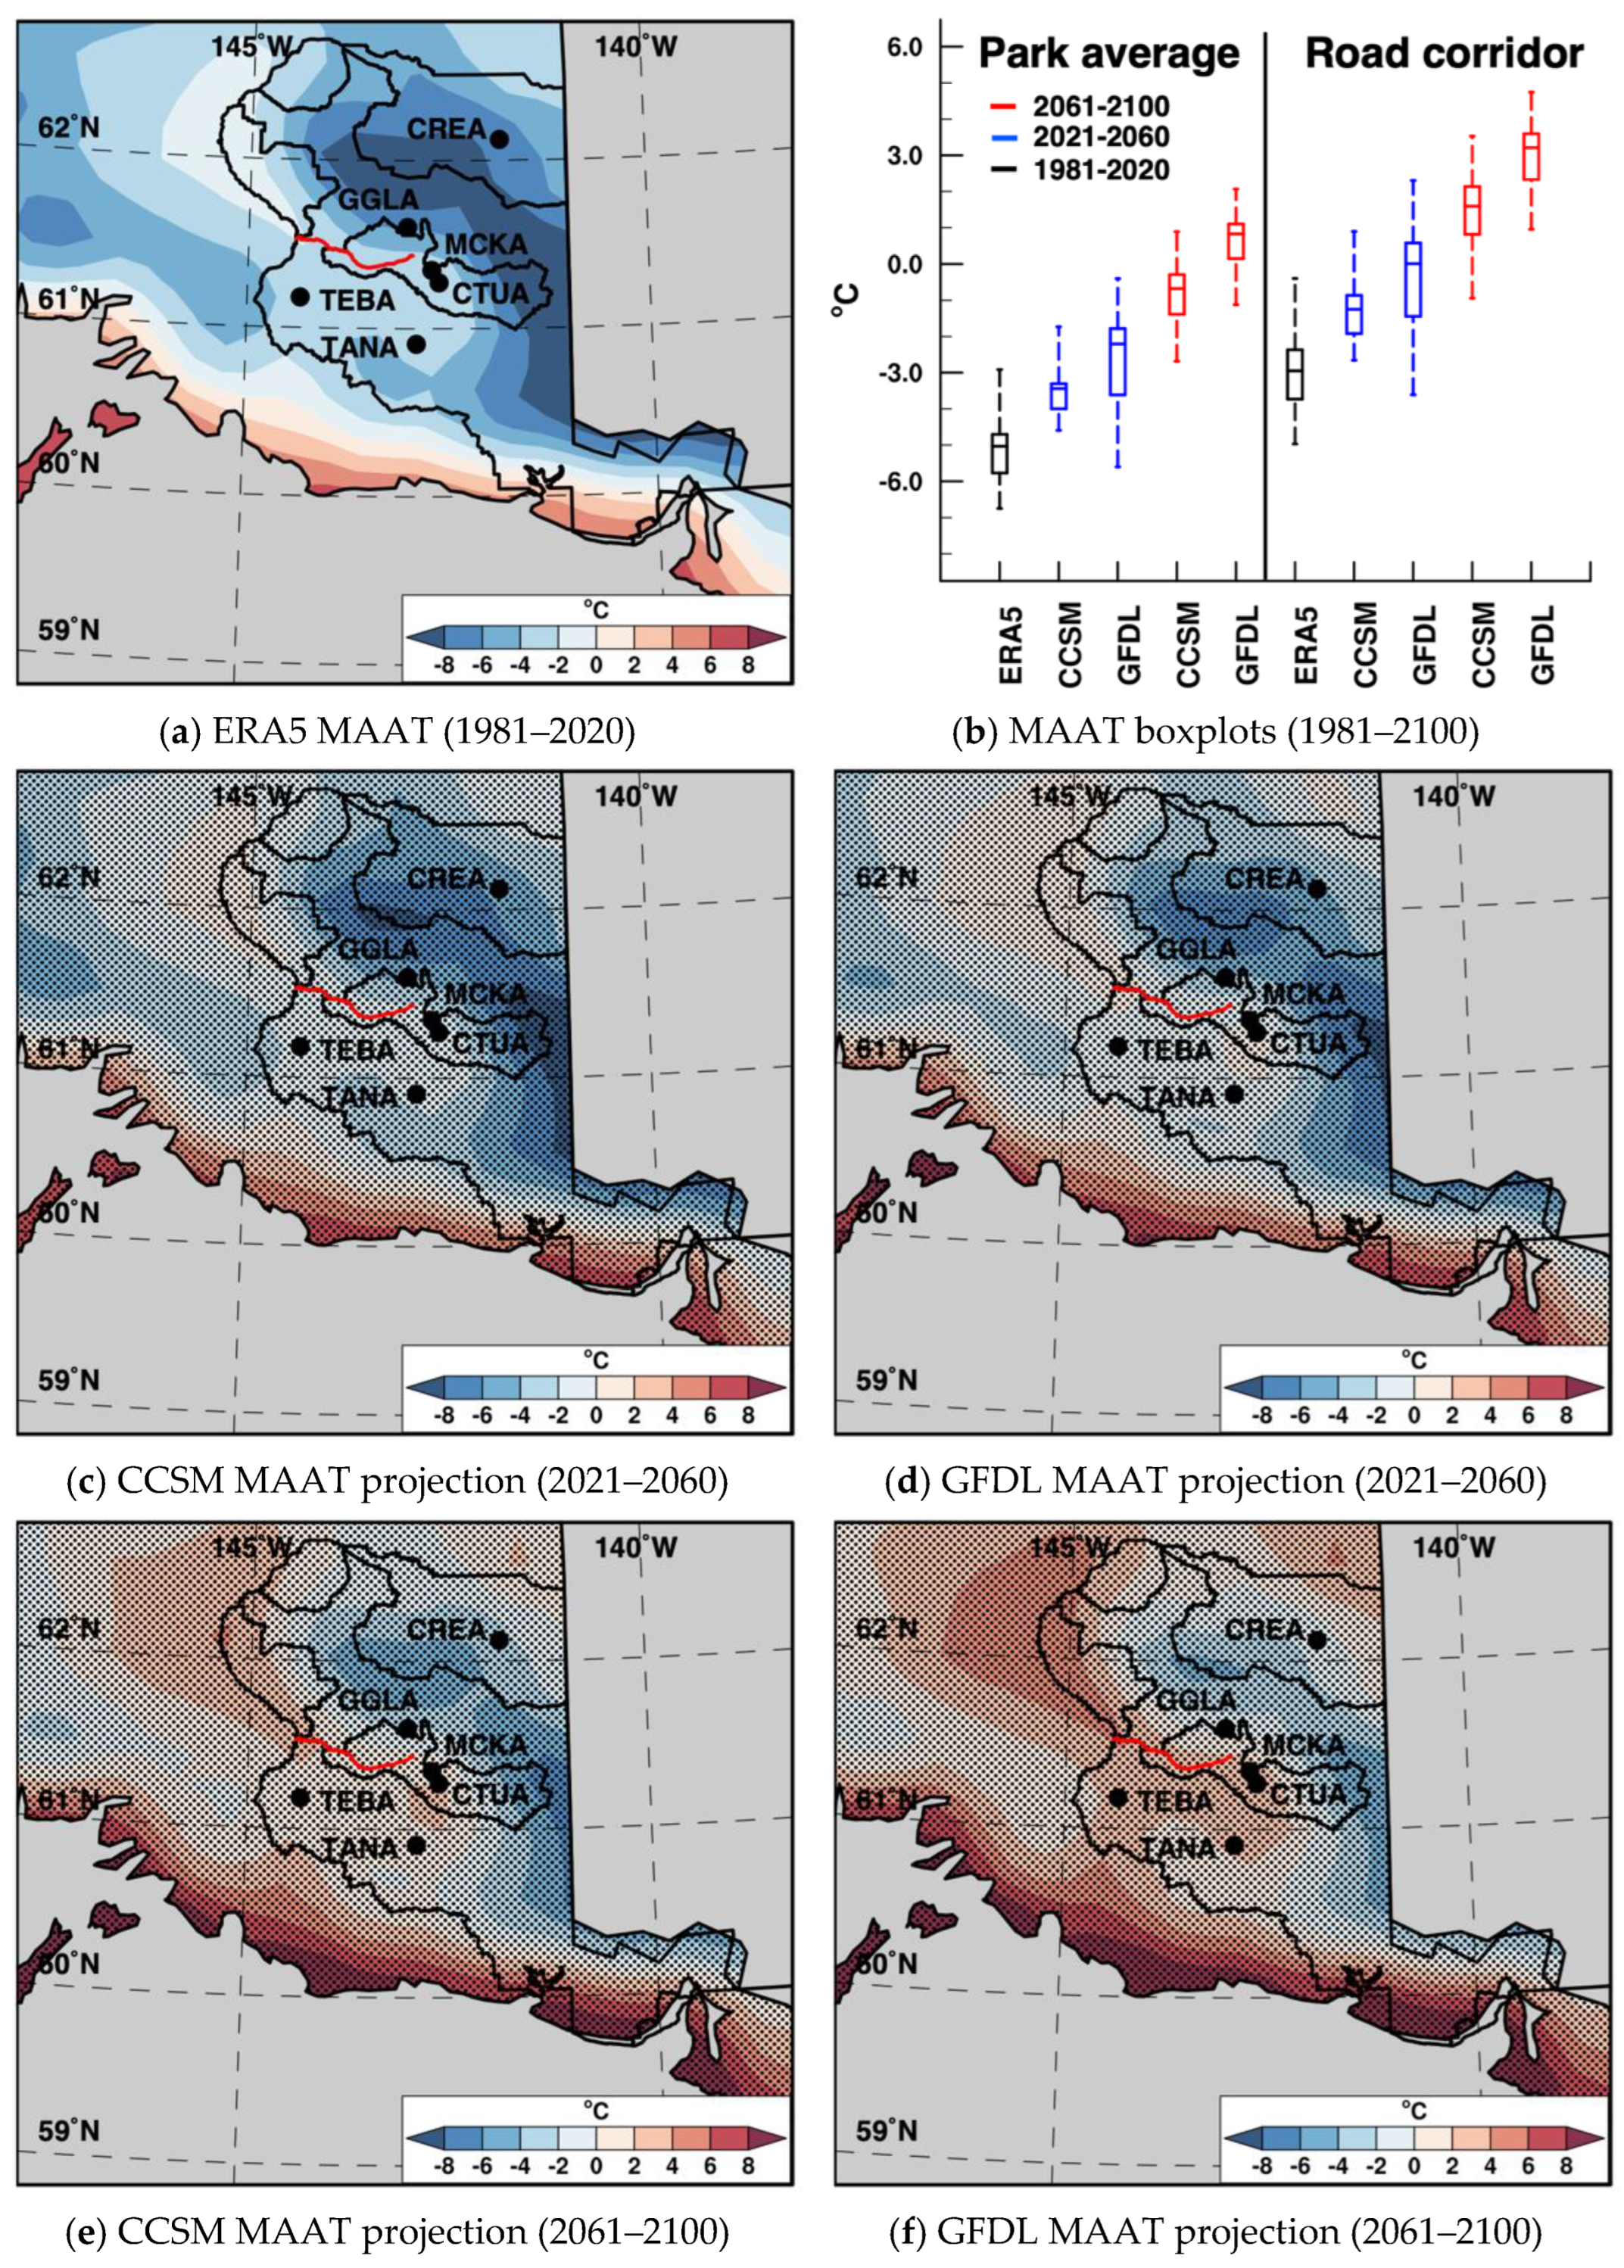
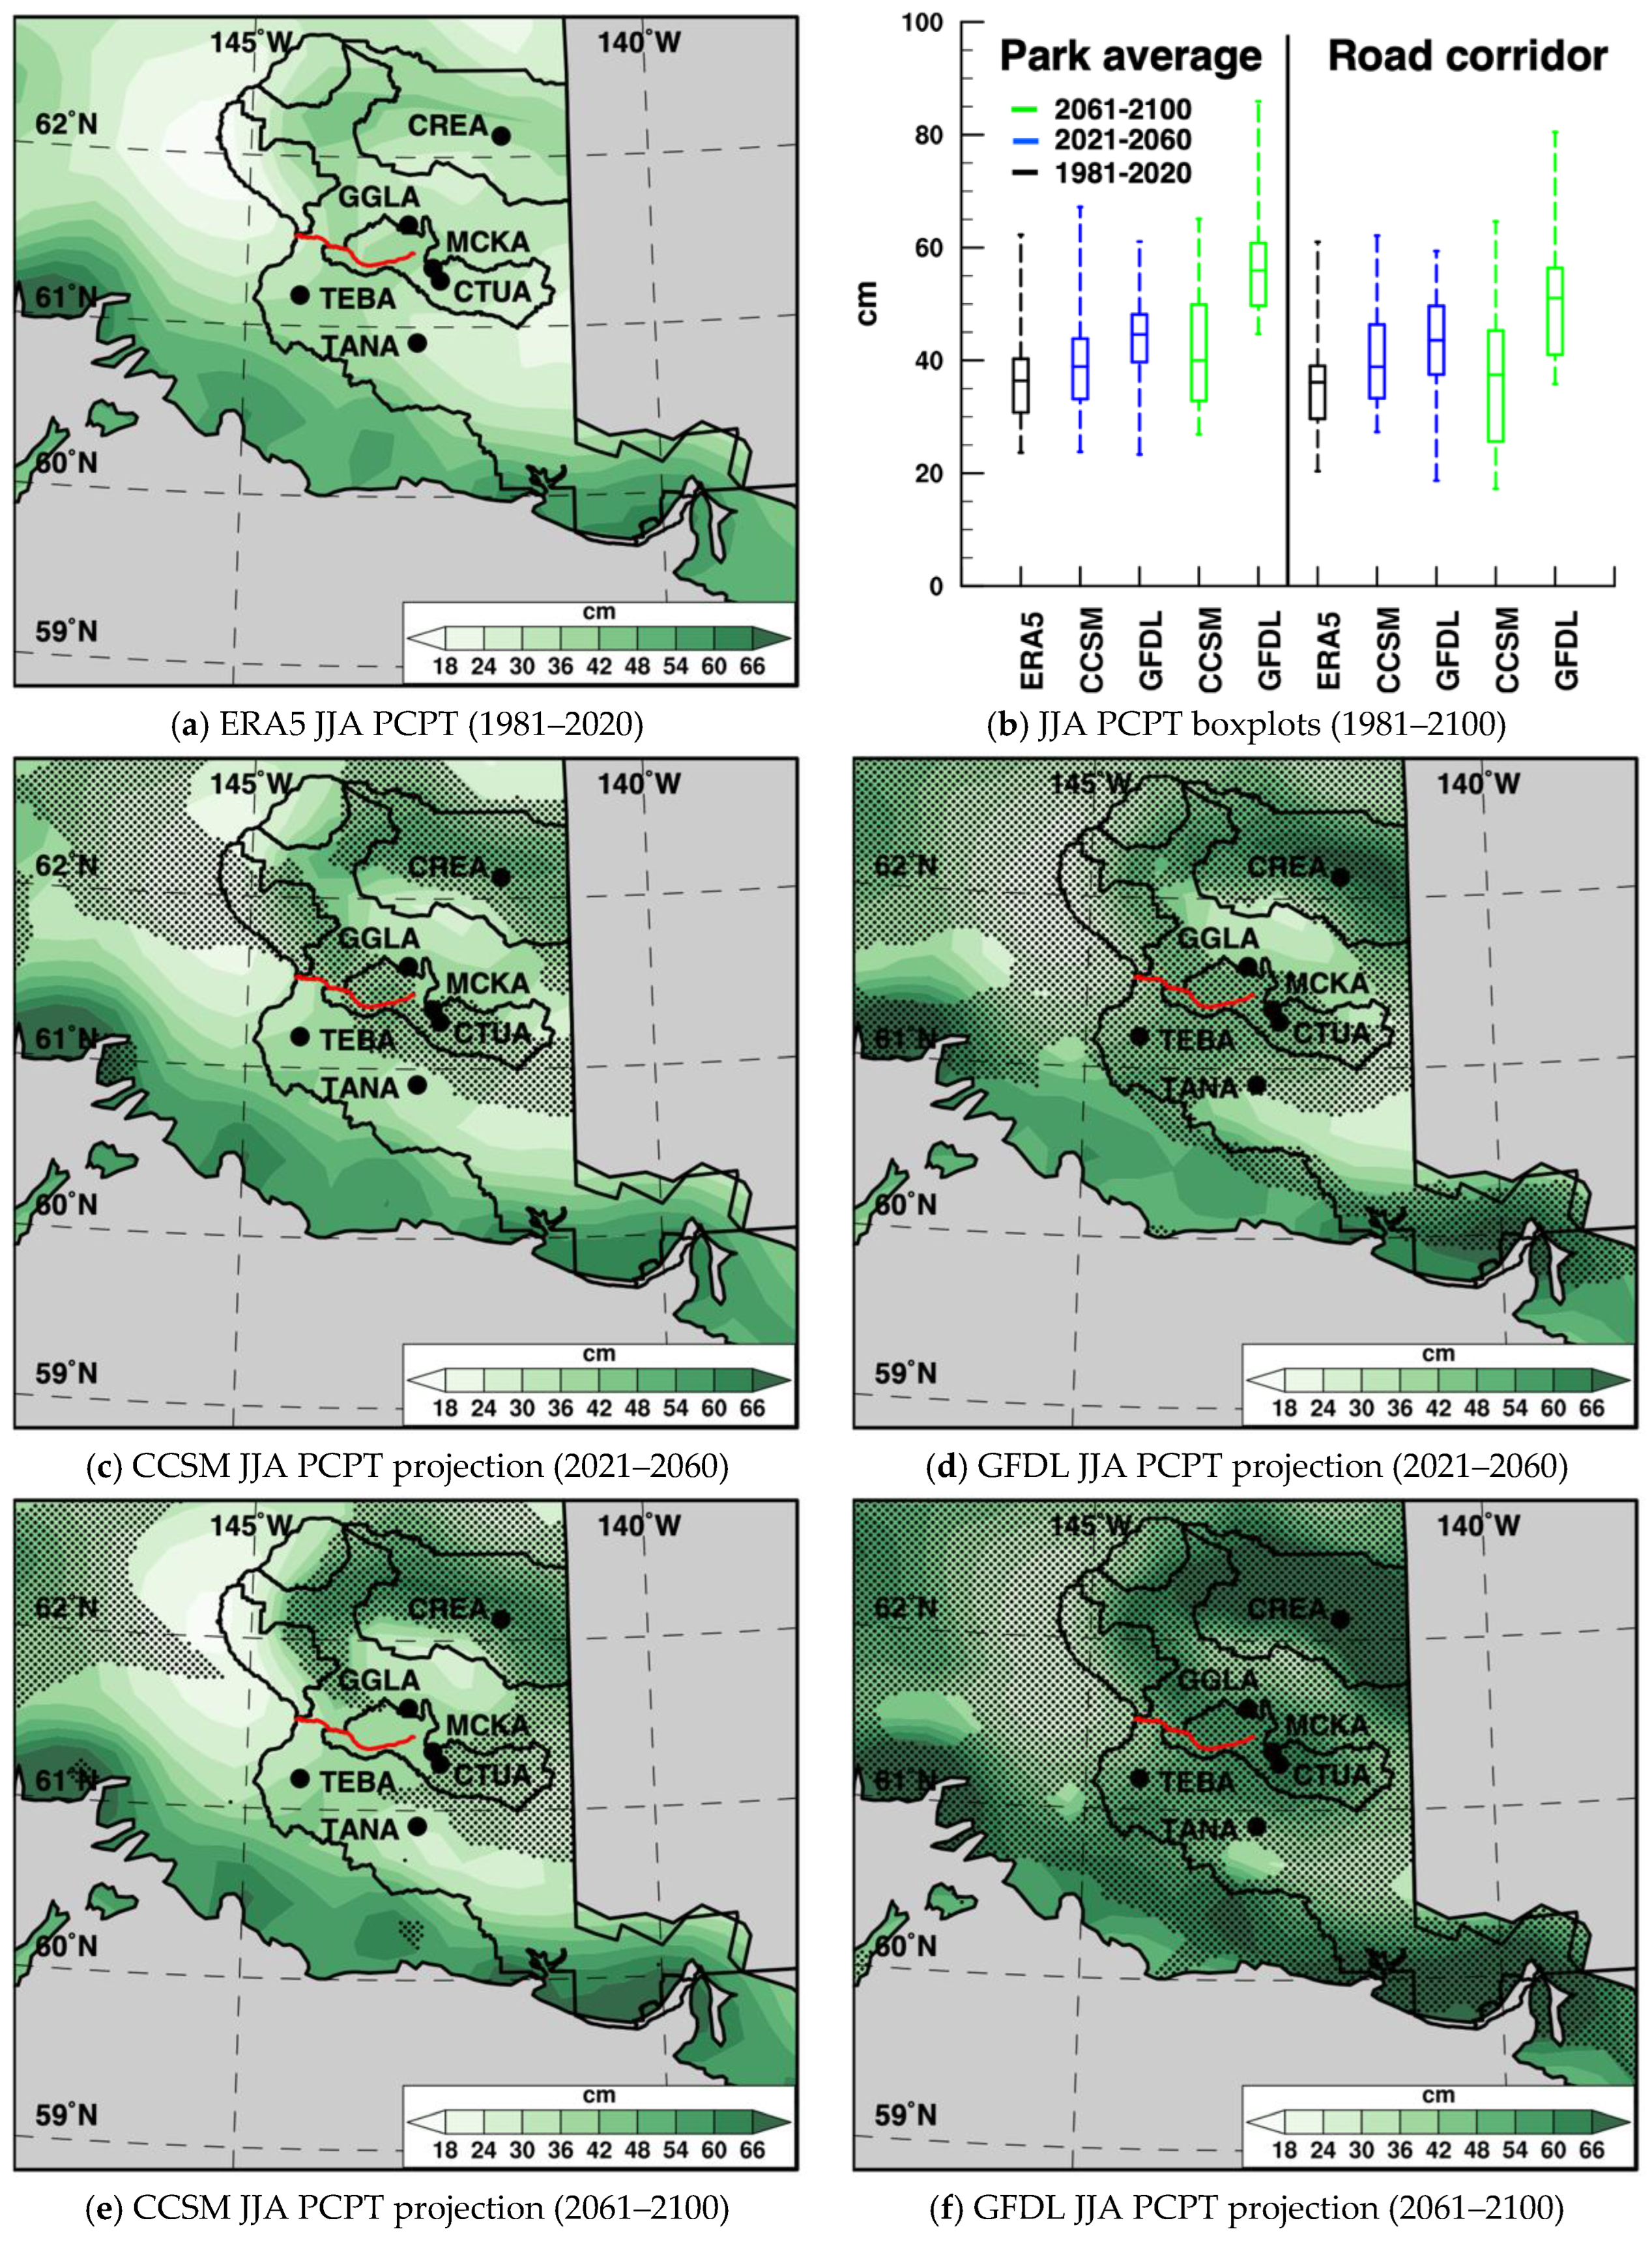
3.4. Wrangell-St. Elias

The ERA5 mean annual air temperature in Wrangell-St. Elias had the lowest trends of the three parks (1981–2020), though still significantly positive, with park-average and road corridor means of −5.1 °C, and −3.0 °C, respectively (Figure 10a; Table 2). The CCSM and GFDL projected approximately linear MAAT increases from the historical period through the late-century (Figure 10b). The mid-century projections (2021–2060) from CCSM (Figure 10c) and GFDL (Figure 10d) showed significant warming across Wrangell-St. Elias, with some locations along the road corridor warming above freezing, on average, in the GFDL. The late-century projections (2061–2100) showed continued warming from the mid-century period, with all but the coldest years being above freezing along the road corridor in the CCSM (Figure 10e) and all years were above freezing in the GFDL (Figure 10f). Parts of the park-average MAAT distributions were projected to climb above freezing in the late-century period in both models; CCSM had a maximum MAAT above freezing, whereas for GFDL all values above the first quartile were above freezing (Table 3).
Summer precipitation across WRST had the largest historical (1981–2020) spatial variability in ERA5 among the three parks, with areas of less than 18 cm to the northwest and near 60 cm in the southeast along the coast (Figure 11a). The median JJA PCPT park-average value was projected to increase in both models with successive 40-year periods, and this was also true for the road corridor in GFDL; however, the late-century (2061–2100) CCSM median projection was slightly lower than the mid-century projection (2021–2060) (Figure 11b). The mid-century CCSM projection showed significantly higher summer precipitation in areas of WRST that were just north of local terrain maxima (Figure 11c) and similar features occurred in GFDL, although GFDL was generally wetter (Figure 11d). The late-century CCSM projection showed a similar pattern as the mid-century, but with fewer areas of significant change relative to the historical period; this included a loss of significant change along the road corridor (Figure 11e). The late-century GFDL projection showed an expansion of the areas of significant increases in JJA PCPT (Figure 11f).

4. Discussion

The historical analysis of gridded ERA5 (1981–2020) and station observed mean annual air temperature showed strong agreement and future projections were consistent with historical trends. Historical mean annual air temperature values in all three parks were below freezing, both in terms of the ERA5 gridded averages and the individual station locations; similarly, all historical mean annual air temperature trends were positive. In Gates of the Arctic, the station trends ranged from 0.4 °C (Bettles Airport) to 6.4 °C (Norutak Lake) per decade with the former being significant, given its 68-year period of record (Table 1); both the park-average and road-corridor trend values from ERA5 were significantly positive at 0.6 °C per decade (Table 2). The analysis periods were separated by 40 years, which means that consistent warming at the historical rate from ERA5 would yield mid-century and late-century values that were 2.4 °C and 4.8 °C warmer, respectively. Table 3 shows projected median mid-century warming (2021–2060) for the proposed Ambler Road corridor of 2.1 °C in CCSM and 3.4 °C in GFDL and late-century (2061–2100) warming of 5.7 °C in CCSM and 7.2 °C in GFDL. In Denali, all stations had warming trends that ranged from 0.2 °C to 2.8 °C per decade and all were significant except for one, at Wigand, which had only 6 usable years of record. ERA5 showed significant warming trends of 0.5 °C per decade for the Denali park average and the Denali Park Road corridor, which would yield warming of 2.0 °C (2021–2060) and 4.0 °C (2061–2100) if continued. Climate model projections showed a median mid-century warming of 1.5 °C (CCSM) and 3.2 °C (GFDL), and late-century warming of 4.7 °C (CCSM) and 6.6 °C (GFDL). In Wrangell-St. Elias, station observed warming ranged from 1.7 °C (Chitutu) to 2.9 °C (Tebay) per decade with only Tana Knob not reaching statistical significance, likely again due to a short usable record of only 5 years. The McCarthy Road corridor trend from ERA5 was 0.4 °C per decade, yielding expected warming of 1.6 °C (2021–2060) and 3.2 °C (2061–2100). The CCSM showed median mid-century and late-century warming of 1.7 °C and 4.6 °C, respectively; these values for GFDL were 3.0 °C and 6.2 °C, respectively. Thus, there is consistency through 2021–2060 in which CCSM projects a slightly lower rate and GFDL a higher rate of warming, before both climate models project a higher warming rate from 2061–2100.
The projected frequency of above freezing mean annual air temperatures depended on the park and the climate model. In Gates of the Arctic, both climate models showed below freezing mean annual air temperature values through the mid-century (2021–2060). In the late-century (2061–2100) they both show above freezing years; along the proposed Ambler Road corridor, above freezing mean annual air temperatures occurred between the median and upper quartile of the distribution in CCSM and between the minimum and lower quartile for GFDL (Table 3). In Denali, more immediate risk was indicated with GFDL showing an above freezing maximum mean annual air temperature value from 2021–2060. Recall that this is for the entire Denali Park Road corridor average, meaning that some areas, as is the case at Pretty Rocks, may already be experiencing increased landslide risk, while others may remain more stable. By 2061–2100, the CCSM showed above freezing mean annual air temperatures between the median and the upper quartile of the distribution, whereas every year in GFDL was above freezing. Along the McCarthy Road corridor in Wrangell-St. Elias, CCSM indicated above freezing mean annual air temperatures by mid-century above the upper quartile of the distribution and from the median upward for GFDL; by late-century, CCSM had above freezing mean annual air temperatures between the minimum and the lower quartile and GFDL showed all values above freezing.
Historical (1981–2020) summer precipitation amounts, unlike mean annual air temperatures, did not display a consistent direction of change among the station observations, nor between the three parks. Of the 18 stations analyzed, only Killik Pass in Gates of the Arctic and Wonder Lake in Denali showed significant trends (both positive) (Table 1). While the park average and proposed Ambler Road corridor mean in Gates of the Arctic showed negative trends in ERA5 (Table 2), median summer precipitation from both climate models were projected to increase with each successive 40-year future period (Table 3). In Denali, the ERA5 trend over the Denali Park Road was 1.0 cm per decade, which would project an increase of 4.0 cm (2021–2060) and 8.0 cm (2061–2100) if it continued. The climate models bracketed the expected mid-century (2021–2060) change with CCSM displaying an increase of 3.9 cm and GFDL of 12.5 cm. By the late-century (2061–2100), both climate models showed considerably higher median amounts than what would be achieved using historical trends with CCSM 13.8 cm and GFDL 24.9 cm wetter than the 1981–2020 ERA5 median. In Wrangell-St. Elias, the ERA5 McCarthy Road trend was 1.1 cm per decade, yielding expected changes of 4.4 cm (2021–2060) and 8.8 cm (2061–2100). The climate models bracketed these projected changes in both the mid-century (CCSM, 2.8 cm; GFDL, 7.5 cm) and late-century (CCSM 1.4 cm; GFDL, 14.9 cm).
The number of summers that met the historical (1981–2020) 40-year return interval (R40) of summer precipitation, based on the largest value in the bias-adjusted future time periods, was projected to increase in most instances across the three parks, with substantially higher maximum values by the late-century. The R40 from the ERA5 summer precipitation along the proposed Ambler Road corridor was 49.9 cm. Both the CCSM and GFDL projected higher R40 values in the mid (2021–2060)- and late-century (2061–2100); for GFDL, the upper quartile of the late-century projection exceeded the historical R40. In Denali, the ERA5 R40 value of 50.0 cm along the Denali Park Road was projected to increase in CCSM and GFDL in both projection periods. The GFDL projected much wetter summers by the late-century, such that every summer was wetter than the historical R40. Along the McCarthy Road in Wrangell-St. Elias, the ERA5 R40 value was 61.0 cm. In the mid-century period, CCSM projected a slightly higher R40, and GFDL slightly lower; both climate models project higher R40 values in the late-century, although unlike for Gates of the Arctic and Denali, the upper quartile values of the projected distributions did not exceed the historical R40 (Table 3).
Given that above freezing mean annual air temperatures have been linked to increased landslide risk in Alaska’s national parks and that built infrastructure has been designed based on historical distributions of temperature and precipitation (1981–2020), a hazard framework is defined herein characterized by projected risk levels of: high, medium, and low (Table 4). High means that the projected upper quartile value was above 0 °C for mean annual air temperature, and above the historical R40 value for summer precipitation; medium means that the projected maximum exceeded 0 °C for mean annual air temperature, and exceeded the historical R40 for summer precipitation; finally, low means that the projected maxima were below freezing and below the historical R40 for mean annual air temperature and summer precipitation, respectively. These definitions when applied to the road corridors yielded medium risk from the GFDL mean annual air temperature in the mid-century (2021–2060) for Denali, and in CCSM for Wrangell-St. Elias. High risk was found in the mid-century GFDL mean annual air temperature projection for Wrangell-St. Elias and for all parks in both climate models in the late-century (2061–2100). For summer precipitation, medium risk was projected for: Gates of the Arctic (both climate models, mid-century; CCSM, late-century), Denali (CCSM, mid-century; CCSM, late-century), and Wrangell-St. Elias (CCSM, mid-century; both climate models, late-century). High summer precipitation risk is projected for: Gates of the Arctic (GFDL, late-century), and Denali (GFDL, mid-century; GFDL, late-century).
There are important caveats to these designations, however. First, they represent road corridor averages and localized areas may be more or less risk prone. Second, these do not account for the soil properties found in each park. Yu et al. [19] identified stability classifications for permafrost that ranged from stable (mean annual ground temperature < −3 °C) to extremely unstable (mean annual ground temperature between 0.5 °C to −0.5 °C). From 2000–2009, the proposed Ambler Road corridor in Gates of the Arctic had mean annual ground temperatures in the −2 °C to −3 °C range (Figure 2b; [12]), but the Denali Park Road corridor in Denali (Figure 2c; [13]) and the McCarthy Road corridor in Wrangell-St. Elias (Figure 2d; [14]) showed mean annual ground temperatures that were already in the extremely unstable range. Permafrost thaw and ice melt in the active layer can saturate the soil layer and lead to liquefaction, wherein the soil loses its shear strength and becomes prone to sliding; this is especially true in earthquake prone areas [53,54], such as the three parks units in this study. The rate of permafrost thaw and ice melt likely increases the risk of soil liquefaction along the road corridors in this study; increased monitoring of the water table, both in terms of spatial density and temporal frequency, could improve assessments of high water in these areas [55], and inform risk management planning. These findings would support more elevated risk levels in the mid-century period along the Denali Park Road and McCarthy Road than were found using the atmospheric indicators alone. A third consideration is ecosystem transition from permafrost to non-permafrost soils and into new landslide equilibrium states. The transition phase is likely to increase landslide activity [21], but once the permafrost is gone, landslide susceptibility is likely to decrease, as is the situation along the Alaska Highway corridor in Yukon, Canada [22].

5. Conclusions

Recent landslides along road corridors in Alaska national parks have been linked to mean annual air temperatures warming above freezing and heavy precipitation events, particularly during the summer months. Significant observed warming trends are projected to continue into the mid (2021–2060)- and late-century (2061–2100) periods across Gates of the Arctic, Denali, and Wrangell-St. Elias; moreover, observed trends of summer precipitation that were mixed are projected to increase significantly across most (CCSM), if not all (GFDL) areas of these parks. Large portions of Denali and Wrangell-St. Elias are projected to have above freezing mean annual air temperatures in the mid-century period, indicating an elevated risk for landslides. Southern portions of Gates of the Arctic are projected to have above freezing mean annual air temperatures in the late-century period. Station observation trends of mean annual air temperature were largely consistent with the ERA5, and while observed summer precipitation trends were mixed, there was good climate model agreement of significantly wetter summers in the projected periods. Substantial federal funding is already being directed at the Pretty Rocks slide area in Denali, and as temperatures continue to warm and summer precipitation amounts increase, the risk of landslide activity will likely rise.
The findings in this study can help inform decisions on management of existing infrastructure and planning of future infrastructure projects in National Park Service lands in Alaska. This study provides a comparative analysis of historical and projected atmospheric indicators that have previously been identified as relevant to landslide risk in permafrost-rich lands, but it is not designed to analyze specific landslides within the three National Park Service units. The usage of dynamically downscaled climate model simulations to analyze these indicators is novel for these areas, however, the existence of only two model futures (both from RCP8.5) also represents a limitation of this study. Future research could benefit from the inclusion of additional models and emission scenarios, particularly those from CMIP6.

Author Contributions

Conceptualization, R.L. and P.S.; methodology, R.L.; formal analysis, R.L.; data curation, R.L. and P.S.; writing—original draft preparation, R.L.; writing—review and editing, R.L., P.S., U.S.B., J.E.W. and P.A.B. All authors have read and agreed to the published version of the manuscript.

Funding

This research was funded by the U.S. Geological Survey Alaska Climate Adaptation Science Center, grant number G21AC10718.

Institutional Review Board Statement

Not applicable.

Informed Consent Statement

Not applicable.

Data Availability Statement

The authors confirm that all data used in this study are publicly available. The hourly and daily station data for GAAR, DENA, WRST are available from: NOAA NCEI GHCN-D (https://www.ncei.noaa.gov/products/land-based-station/global-historical-climatology-network-daily, accessed on 16 August 2022; [29]), the NPS Arctic Network (https://irma.nps.gov/DataStore/Reference/Profile/2279038, accessed on 16 August 2022; [30]), the NPS Central Alaska Network (https://irma.nps.gov/DataStore/Reference/Profile/2279039, accessed on 16 August 2022; [31]), and the Western Regional Climate Center Fire Remote Automatic Weather Stations (FIRE; https://wrcc.dri.edu/wraws/akF.html, accessed on 16 August 2022; [32]). The shapefiles containing Denali Park Road and McCarthy Road are available from https://dot.alaska.gov/stwddes/gis/shapefiles.shtml (accessed on 29 July 2022) and for the proposed Ambler Road from https://eplanning.blm.gov/eplanning-ui/project/57323/590 (accessed on 29 July 2022). The hourly ERA5 reanalysis products are available from https://cds.climate.copernicus.ecdsapp#!/home (accessed on 29 July 2022) and the 20 km downscaled climate model data from NCAR CCSM4 and GFDL-CM3 from https://registry.opendata.aws/wrf-alaska-snap/ (accessed on 29 July 2022).

Acknowledgments

This research was funded by the U.S. Geological Survey Alaska Climate Adaptation Science Center. The project described in this publication was supported by Grant G21AC10718 from the United States Geological Survey. The views and conclusions contained in this document are those of the authors and should not be interpreted as representing the opinions or policies of the U.S. Geological Survey. Mention of trade names or commercial products does not constitute their endorsement by the Alaska Climate Adaptation Science Center or the US Geological Survey. This manuscript is submitted for publication with the understanding that the United States Government is authorized to reproduce and distribute reprints for Governmental purposes.

Conflicts of Interest

The authors declare no conflict of interest.

References

  1. National Park Service. Pretty Rocks Landslide. Available online: https://www.nps.gov/dena/learn/nature/pretty-rocks.htm (accessed on 29 July 2022).
  2. Department of the Interior. Bipartisan Infrastructure Law to Fund Critical Transportation Project in Denali National Park. Available online: https://www.doi.gov/pressreleases/bipartisan-infrastructure-law-fund-critical-transportation-project-denali-national (accessed on 14 September 2022).
  3. Alaska Public Media. McCarthy Road Reopened after Being Rocked by Mudslide. Available online: https://alaskapublic.org/2018/08/22/mccarthy-road-reopened-after-being-rocked-by-mudslide/ (accessed on 29 July 2022).
  4. National Park Service. United States Department of the Interior National Park Service Ambler Mining District Industrial Access Project Gates of the Arctic National Park and Preserve Environmental and Economic Analysis. Available online: https://parkplanning.nps.gov/document.cfm?parkID=11&projectID=37092&documentID=105431 (accessed on 6 September 2022).
  5. Gonzalez, P.; Wang, F.; Notaro, M.; Vimont, D.J.; Williams, J.W. Disproportionate Magnitude of Climate Change in United States National Parks. Environ. Res. Lett. 2018, 13, 104001. [Google Scholar] [CrossRef] [Green Version]
  6. Swanson, D.K.; Sousanes, P.J.; Hill, K. Increased Mean Annual Temperatures in 2014–2019 Indicate Permafrost Thaw in Alaskan National Parks. Arct. Antarct. Alp. Res. 2021, 53, 1–19. [Google Scholar] [CrossRef]
  7. Bissolli, P.; Ganter, C.; Mekonnen, A.; Sánchez-Lugo, A.; Zhu, Z.; Abida, A.; Agyakwah, W.; Aldeco, L.S.; Alfaro, E.J.; Allen, T.; et al. Regional Climates. Bull. Am. Meteorol. Soc. 2022, 103, S341–S454. [Google Scholar] [CrossRef]
  8. Thoman, R.; Walsh, J.E. Alaska’s Changing Environment: Documenting Alaska’s Physical and Biological Changes through Observations. Available online: https://uaf-iarc.org/our-work/alaskas-changing-environment/ (accessed on 28 August 2022).
  9. Markon, C.; Gray, S.; Berman, M.; Eerkes-Medrano, L.; Hennessy, T.; Huntington, H.P.; Littell, J.; McCammon, M.; Thoman, R.; Trainor, S.F. Chapter 26: Alaska. Impacts, Risks, and Adaptation in the United States: The Fourth National Climate Assessment; U.S. Global Change Research Program: Washington, DC, USA, 2018; Volume II. [Google Scholar]
  10. Rantanen, M.; Karpechko, A.Y.; Lipponen, A.; Nordling, K.; Hyvärinen, O.; Ruosteenoja, K.; Vihma, T.; Laaksonen, A. The Arctic Has Warmed Nearly Four Times Faster than the Globe since 1979. Commun. Earth Environ. 2022, 3, 168. [Google Scholar] [CrossRef]
  11. Ballinger, T.J. NOAA Arctic Report Card 2021: Surface Air Temperature; NOAA: Washington, DC, USA, 2021. [Google Scholar] [CrossRef]
  12. Panda, S.; Romanovksy, V.; Marchenko, S. High-Resolution Permafrost Modeling in the Arctic Network National Parks, Preserves and Monuments. Natural Resource Report NPS/ARCN/NRR-2016/1366. National Park Service. Fort Collins, CO. Available online: https://irma.nps.gov/DataStore/DownloadFile/563790 (accessed on 28 August 2022).
  13. Panda, S.; Marchenko, S.; Romanovksy, V. High-Resolution Permafrost Modeling in Denali National Park and Preserve. Natural Resource Technical Report NPS/CAKN/NRTR-2014/858. National Park Service, Fort Collins, Colorado. Available online: https://irma.nps.gov/DataStore/DownloadFile/492958 (accessed on 28 August 2022).
  14. Panda, S.; Marchenko, S.; Romanovksy, V. High-Resolution Permafrost Modeling in Wrangell-St. Elias National Park and Preserve. Natural Resource Technical Report NPS/CAKN/NRTR-2014/861. National Park Service, Fort Collins, Colorado. Available online: https://irma.nps.gov/DataStore/DownloadFile/493136 (accessed on 28 August 2022).
  15. Blunden, J.; Arndt, D.S. State of the Climate in 2018. Bull. Am. Meteorol. Soc. 2019, 100, Si-S306. [Google Scholar] [CrossRef] [Green Version]
  16. Larsen, P.; Goldsmith, S.; Smith, O.; Wilson, M.; Strzepek, K.; Chinowsky, P.; Saylor, B. Estimating Future Costs for Alaska Public Infrastructure at Risk from Climate Change. Glob. Environ. Chang. 2008, 18, 442–457. [Google Scholar] [CrossRef]
  17. Melvin, A.M.; Larsen, P.; Boehlert, B.; Neumann, J.E.; Chinowsky, P.; Espinet, X.; Martinich, J.; Baumann, M.S.; Rennels, L.; Bothner, A.; et al. Climate Change Damages to Alaska Public Infrastructure and the Economics of Proactive Adaptation. Proc. Natl. Acad. Sci. USA 2017, 114, E122–E131. [Google Scholar] [CrossRef] [Green Version]
  18. Biskaborn, B.K.; Smith, S.L.; Noetzli, J.; Matthes, H.; Vieira, G.; Streletskiy, D.A.; Schoeneich, P.; Romanovsky, V.E.; Lewkowicz, A.G.; Abramov, A.; et al. Permafrost Is Warming at a Global Scale. Nat. Commun. 2019, 10, 264. [Google Scholar] [CrossRef] [Green Version]
  19. Yu, W.; Zhang, T.; Lu, Y.; Han, F.; Zhou, Y.; Hu, D. Engineering Risk Analysis in Cold Regions: State of the Art and Perspectives. Cold Reg. Sci. Technol. 2020, 171, 102963. [Google Scholar] [CrossRef]
  20. Rasigraf, O.; Wagner, D. Landslides: An Emerging Model for Ecosystem and Soil Chronosequence Research. Earth-Sci. Rev. 2022, 231, 104064. [Google Scholar] [CrossRef]
  21. Patton, A.I.; Rathburn, S.L.; Capps, D.M. Landslide Response to Climate Change in Permafrost Regions. Geomorphology 2019, 340, 116–128. [Google Scholar] [CrossRef]
  22. Blais-Stevens, A.; Kremer, M.; Bonnaventure, P.P.; Smith, S.L.; Lipovsky, P.; Lewkowicz, A.G. Active layer detachment slides and retrogressive thaw slumps susceptibility mapping for current and future permafrost distribution, yukon alaska highway corridor. In Engineering Geology for Society and Territory; Lollino, G., Manconi, A., Clague, J., Shan, W., Chiarle, M., Eds.; Springer International Publishing: Cham, Switzerland, 2015; Volume 1, pp. 449–453. ISBN 978-3-319-09299-7. [Google Scholar]
  23. Niu, F.; Luo, J.; Lin, Z.; Fang, J.; Liu, M. Thaw-Induced Slope Failures and Stability Analyses in Permafrost Regions of the Qinghai-Tibet Plateau, China. Landslides 2016, 13, 55–65. [Google Scholar] [CrossRef]
  24. Osterkamp, T.E.; Jorgenson, M.T.; Schuur, E.A.G.; Shur, Y.L.; Kanevskiy, M.Z.; Vogel, J.G.; Tumskoy, V.E. Physical and Ecological Changes Associated with Warming Permafrost and Thermokarst in Interior Alaska: Physical and Ecological Changes Associated with Thermokarst. Permafr. Periglac. Process. 2009, 20, 235–256. [Google Scholar] [CrossRef]
  25. Lewkowicz, A.G.; Way, R.G. Extremes of Summer Climate Trigger Thousands of Thermokarst Landslides in a High Arctic Environment. Nat. Commun. 2019, 10, 1329. [Google Scholar] [CrossRef] [PubMed] [Green Version]
  26. Yu, L.; Zhong, S. Trends in Arctic Seasonal and Extreme Precipitation in Recent Decades. Theor. Appl. Climatol. 2021, 145, 1541–1559. [Google Scholar] [CrossRef]
  27. Kharin, V.V.; Zwiers, F.W.; Zhang, X.; Wehner, M. Changes in Temperature and Precipitation Extremes in the CMIP5 Ensemble. Clim. Chang. 2013, 119, 345–357. [Google Scholar] [CrossRef]
  28. McCrystall, M.R.; Stroeve, J.; Serreze, M.; Forbes, B.C.; Screen, J.A. New Climate Models Reveal Faster and Larger Increases in Arctic Precipitation than Previously Projected. Nat. Commun. 2021, 12, 6765. [Google Scholar] [CrossRef]
  29. Menne, M.J.; Durre, I.; Vose, R.S.; Gleason, B.E.; Houston, T.G. An Overview of the Global Historical Climatology Network-Daily Database. J. Atmos. Ocean. Technol. 2012, 29, 897–910. [Google Scholar] [CrossRef]
  30. Hill, K.; Sousanes, P.J. WC_G ARCN RAWS Corrected Data. Available online: https://irma.nps.gov/DataStore/Reference/Profile/2279038 (accessed on 16 August 2022).
  31. Hill, K.; Sousanes, P.J. WC_G CAKN RAWS Corrected Data. Available online: https://irma.nps.gov/DataStore/Reference/Profile/2279039 (accessed on 16 August 2022).
  32. Western Regional Climate Center. RAWS USA Climate Archive. Available online: https://wrcc.dri.edu/wraws/akF.html (accessed on 16 August 2022).
  33. Hersbach, H.; Bell, B.; Berrisford, P.; Hirahara, S.; Horányi, A.; Muñoz-Sabater, J.; Nicolas, J.; Peubey, C.; Radu, R.; Schepers, D.; et al. The ERA5 Global Reanalysis. Q. J. R. Meteorol. Soc. 2020, 146, 1999–2049. [Google Scholar] [CrossRef]
  34. Avila-Diaz, A.; Bromwich, D.H.; Wilson, A.B.; Justino, F.; Wang, S.-H. Climate Extremes across the North American Arctic in Modern Reanalyses. J. Clim. 2021, 34, 2385–2410. [Google Scholar] [CrossRef]
  35. White, J.H.R.; Walsh, J.E.; Thoman, R.L. Using Bayesian Statistics to Detect Trends in Alaskan Precipitation. Int. J. Climatol. 2021, 41, 2045–2059. [Google Scholar] [CrossRef]
  36. Bachand, C.L.; Walsh, J.E. Extreme Precipitation Events in Alaska: Historical Trends and Projected Changes. Atmosphere 2022, 13, 388. [Google Scholar] [CrossRef]
  37. Räisänen, J. Effect of Atmospheric Circulation on Surface Air Temperature Trends in Years 1979–2018. Clim. Dyn. 2021, 56, 2303–2320. [Google Scholar] [CrossRef]
  38. Taylor, K.E.; Stouffer, R.J.; Meehl, G.A. An Overview of CMIP5 and the Experiment Design. Bull. Am. Meteorol. Soc. 2012, 93, 485–498. [Google Scholar] [CrossRef] [Green Version]
  39. Gent, P.R.; Danabasoglu, G.; Donner, L.J.; Holland, M.M.; Hunke, E.C.; Jayne, S.R.; Lawrence, D.M.; Neale, R.B.; Rasch, P.J.; Vertenstein, M.; et al. The Community Climate System Model Version 4. J. Clim. 2011, 24, 4973–4991. [Google Scholar] [CrossRef] [Green Version]
  40. Donner, L.J.; Wyman, B.L.; Hemler, R.S.; Horowitz, L.W.; Ming, Y.; Zhao, M.; Golaz, J.-C.; Ginoux, P.; Lin, S.-J.; Schwarzkopf, M.D.; et al. The Dynamical Core, Physical Parameterizations, and Basic Simulation Characteristics of the Atmospheric Component AM3 of the GFDL Global Coupled Model CM3. J. Clim. 2011, 24, 3484–3519. [Google Scholar] [CrossRef]
  41. Walsh, J.E.; Bhatt, U.S.; Littell, J.S.; Leonawicz, M.; Lindgren, M.; Kurkowski, T.A.; Bieniek, P.A.; Thoman, R.; Gray, S.; Rupp, T.S. Downscaling of Climate Model Output for Alaskan Stakeholders. Environ. Model. Softw. 2018, 110, 38–51. [Google Scholar] [CrossRef]
  42. Riahi, K.; Rao, S.; Krey, V.; Cho, C.; Chirkov, V.; Fischer, G.; Kindermann, G.; Nakicenovic, N.; Rafaj, P. RCP 8.5—A Scenario of Comparatively High Greenhouse Gas Emissions. Clim. Chang. 2011, 109, 33–57. [Google Scholar] [CrossRef] [Green Version]
  43. van Vuuren, D.P.; Edmonds, J.; Kainuma, M.; Riahi, K.; Thomson, A.; Hibbard, K.; Hurtt, G.C.; Kram, T.; Krey, V.; Lamarque, J.-F.; et al. The Representative Concentration Pathways: An Overview. Clim. Chang. 2011, 109, 5–31. [Google Scholar] [CrossRef]
  44. Skamarock, W.; Klemp, J.; Dudhia, J.; Gill, D.; Barker, D.; Wang, W.; Huang, X.-Y.; Duda, M. A Description of the Advanced Research WRF Version 3; UCAR/NCAR: Boulder, CO, USA, 2008; p. 1002. [Google Scholar]
  45. Bieniek, P.A.; Bhatt, U.S.; Walsh, J.E.; Rupp, T.S.; Zhang, J.; Krieger, J.R.; Lader, R. Dynamical Downscaling of ERA-Interim Temperature and Precipitation for Alaska. J. Appl. Meteorol. Climatol. 2016, 55, 635–654. [Google Scholar] [CrossRef]
  46. Brown, D.; Brownrigg, R.; Haley, M.; Huang, W. NCAR Command Language (NCL) (Version 6.4.0); UCAR/NCAR: Boulder, CO, USA, 2012. [Google Scholar]
  47. Sen, P.K. Estimates of the Regression Coefficient Based on Kendall’s Tau. J. Am. Stat. Assoc. 1968, 63, 1379–1389. [Google Scholar] [CrossRef]
  48. Theil, H. A Rank-Invariant Method of Linear and Polynomial Regression Analysis. Proc. K. Ned. Akad. Van Wet. 1950, 53A, 386–392. [Google Scholar]
  49. Wilks, D. Statistical Methods in the Atmospheric Sciences, 4th ed.; Elsevier: Amsterdam, The Netherlands, 2019. [Google Scholar]
  50. R Core Team. R: A Language and Environment for Statistical Computing; R Foundation for Statistical Computing: Vienna, Austria, 2013. [Google Scholar]
  51. Mann, H.B.; Whitney, D.R. On a Test of Whether One of Two Random Variables Is Stochastically Larger than the Other. Ann. Math. Statist. 1947, 18, 50–60. [Google Scholar] [CrossRef]
  52. Cannon, A.J.; Sobie, S.R.; Murdock, T.Q. Bias Correction of GCM Precipitation by Quantile Mapping: How Well Do Methods Preserve Changes in Quantiles and Extremes? J. Clim. 2015, 28, 6938–6959. [Google Scholar] [CrossRef]
  53. Chung, J.-W.; Rogers, J.D. Influence of Assumed Groundwater Depth on Mapping Liquefaction Potential. Environ. Eng. Geosci. 2013, 19, 377–389. [Google Scholar] [CrossRef]
  54. Forcellini, D. The Role of the Water Level in the Assessment of Seismic Vulnerability for the 23 November 1980 Irpinia–Basilicata Earthquake. Geosciences 2020, 10, 229. [Google Scholar] [CrossRef]
  55. Morgan, C.P.; Stolt, M.H. A comparison of several approaches to monitor water-table fluctuations. Soil Sci. Soc. Am. J. 2004, 68, 562–566. [Google Scholar] [CrossRef]
Figure 1. (a) Outline of the Pretty Rocks landslide along the Denali Park Road in 2015 (red dashed lines), and (b) road displacement of 14 vertical feet in the slide area in 2021 (Source: National Park Service photos; https://www.nps.gov/dena/learn/nature/pretty-rocks.htm, accessed on 29 July 2022).
Atmosphere 14 00034 g001
Figure 2. (a) Map of mainland Alaska showing the location of three National Park Service (NPS) units, the road of interest (colored lines) inside each, and location of the NPS surface stations, and (b) Mean annual ground temperature (MAGT) in Gates of the Arctic, (c) MAGT in Denali, and (d) MAGT in Wrangell-St. Elias. MAGT values are for 2000–2009 and areas of concern in each park are indicated. Permafrost mapping in (bd) from [12,13,14].
Atmosphere 14 00034 g002aAtmosphere 14 00034 g002b
Figure 3. Flowchart of the research process involved in this study.
Atmosphere 14 00034 g003
Figure 4. Historical (1981−2020) (a) ERA5 mean annual air temperature (MAAT; °C) climatology, (b) ERA5 MAAT trend (°C decade−1), (c) ERA5 summer precipitation (JJA PCPT; cm) climatology, and (d) ERA5 JJA PCPT trend (cm decade−1). Significant trends at the 95% confidence level are shaded with stippling.
Atmosphere 14 00034 g004aAtmosphere 14 00034 g004b
Figure 5. Historical (a) CCSM and (b) GFDL mean annual air temperature (MAAT) bias (°C), and (c) CCSM and (d) GFDL summer precipitation (JJA PCPT) bias (cm). Biases are relative to the ERA5 MAAT and JJA PCPT climatologies, respectively.
Atmosphere 14 00034 g005aAtmosphere 14 00034 g005b
Figure 6. Gates of the Arctic (a) ERA5 mean annual air temperature (MAAT) climatology (°C), (b) park-average (left) and road corridor (right) boxplots of MAAT, and bias-corrected: mid-century MAAT projections from (c) CCSM and (d) GFDL and late-century MAAT projections from (e) CCSM and (f) GFDL. All projections are significant at the 95% confidence level (shaded with stippling).
Atmosphere 14 00034 g006aAtmosphere 14 00034 g006b
Figure 7. Gates of the Arctic (a) ERA5 summer precipitation (JJA PCPT) climatology (cm), (b) park-average (left) and road corridor (right) boxplots of MAAT, and bias-corrected: mid-century MAAT projections from (c) CCSM and (d) GFDL and late-century MAAT projections from (e) CCSM and (f) GFDL. Projected changes at the 95% confidence level are shaded with stippling.
Atmosphere 14 00034 g007
Figure 8. Denali National Park (a) ERA5 mean annual air temperature (MAAT) climatology (°C), (b) park-average (left) and road corridor (right) boxplots of MAAT, and bias-corrected: mid-century MAAT projections from (c) CCSM and (d) GFDL and late-century MAAT projections from (e) CCSM and (f) GFDL. All projections are significant at the 95% confidence level (shaded with stippling).
Atmosphere 14 00034 g008aAtmosphere 14 00034 g008b
Figure 9. Denali National Park (a) ERA5 summer precipitation (JJA PCPT) climatology (cm), (b) park-average (left) and road corridor (right) boxplots of MAAT, and bias-corrected: mid-century MAAT projections from (c) CCSM and (d) GFDL and late-century MAAT projections from (e) CCSM and (f) GFDL. Projected changes at the 95% confidence level are shaded with stippling.
Atmosphere 14 00034 g009aAtmosphere 14 00034 g009b
Figure 10. Wrangell-St. Elias (a) ERA5 mean annual air temperature (MAAT) climatology (°C), (b) park-average (left) and road corridor (right) boxplots of MAAT, and bias-corrected: mid-century MAAT projections from (c) CCSM and (d) GFDL and late-century MAAT projections from (e) CCSM and (f) GFDL. All projections are significant at the 95% confidence level (shaded with stippling).
Atmosphere 14 00034 g010
Figure 11. Wrangell-St. Elias (a) ERA5 summer precipitation (JJA PCPT) climatology (cm), (b) park-average (left) and road corridor (right) boxplots of MAAT, and bias-corrected: mid-century MAAT projections from (c) CCSM and (d) GFDL and late-century MAAT projections from (e) CCSM and (f) GFDL. Projected changes at the 95% confidence level are shaded with stippling.
Atmosphere 14 00034 g011
Table 1. Station information for locations in or near Gates of the Arctic (GAAR), Denali (DENA) and Wrangell-St. Elias (WRST). This includes each station’s: identifier (Code), source (Type), latitude (Lat), longitude (Lon), elevation (Elev), beginning year of available record (BOR) and number of valid years (N), mean ( x ¯ ) and trend of mean annual air temperature (MAAT) and summer precipitation (JJA PCPT). Significant trends at the 95% confidence level are in bold font.
MAATJJA PCPT
StationCodeTypeLat (° N)Lon (° W)Elev (m)BORN x ¯ (°C) Trend (°C dec−1)N x ¯ (cm) Trend (cm dec−1)
Gates of the Arctic (GAAR)
Bettles
Airport
PABTGHCN66.9151.5196195268−5.10.46715.40.6
Chimney LakeCHMAARCN67.7150.6115220137−4.52.3621.27.5
Killik PassKLIAARCN68.0155.0132720136−6.72.5617.117.5
Norutak LakeNRUAFIRE66.8154.37419995−5.36.41417.9−0.8
Pamichtuk LakePAMAARCN67.8152.2100420136−4.20.6713.9−6.1
Ram CreekRAMAARCN67.6154.3125320155−5.00.9412.1−7.1
Denali (DENA)
Eielson VCEVCACAKN63.4150.31113200614−1.12.81346.0−0.3
McKinley ParkDNPAGHCN63.7149.0631192373−2.40.27620.40.7
StampedeSMPACAKN63.7150.3549200416−3.61.71421.55.3
ToklatTKLACAKN63.5150.0890200614−2.42.81430.116.1
WigandWIGACAKN63.8150.154320146−1.11.2625.4−2.2
Wonder LakeWONAFIRE63.5150.9659200411−2.82.61428.815.6
Wrangell-St. Elias (WRST)
Chicken CreekCREACAKN62.1141.81597200515−3.32.11425.2−7.4
ChitutuCTUACAKN61.3142.61385200515−2.11.71314.88.8
Gates
Glacier
GGLACAKN61.6143.01237200614−1.52.61130.92.2
May CreekMCKAFIRE61.3142.7491199812−1.12.61614.40.4
Tana KnobTANACAKN60.9142.9114020085−1.72.568.5−4.4
TebayTEBACAKN61.2144.3573200613−1.42.91314.9−0.5
Table 2. Historical mean annual air temperature (MAAT; °C) and summer precipitation (JJA PCPT; cm) from ERA5, CCSM, and GFDL for Gates of the Arctic, Denali, and Wrangell-St. Elias. ERA5 trends of MAAT (°C decade−1) and JJA PCPT (cm decade−1) are shown with significance at the 95% confidence level in bold.
MAAT (1981–2020)JJA PCPT (1981–2020)
National ParkERA5 Mean
(°C)
ERA5 Trend (°C dec−1)CCSM Bias (°C)GFDL Bias (°C)ERA5 Mean (cm)ERA5 Trend (cm dec−1)CCSM Bias (cm)GFDL Bias (cm)
Gates of the Arctic (GAAR)
Park average−9.20.60.91.429.4−0.5−0.95.7
Road corridor−6.10.60.42.227.9−2.25.312.9
Denali (DENA)
Park average−3.80.5−0.5−0.539.70.55.610.5
Road corridor−4.90.50.20.037.31.0−6.42.0
Wrangell-St. Elias (WRST)
Park average−5.10.3−0.3−0.335.91.45.78.9
Road corridor−3.00.4−0.20.835.31.114.63.1
Table 3. ERA5 historical (1981–2020) and bias-corrected CCSM and GFDL mid-century (2021–2060) and late-century (2061–2100) projected boxplot values of mean annual air temperature (MAAT; °C) and summer precipitation (JJA PCPT; cm) for the three national parks (i.e., GAAR, DENA, and WRST). These values include the: minimum (Min), lower quartile (Q1), median (Med), upper quartile (Q3) and maximum (Max). Each park’s grid-point average (PA) and road corridor average (RC) are given.
MAATJJA PCPT
National ParkPeriodMinQ1MedQ3MaxMinQ1MedQ3Max
Gates of the Arctic (GAAR)
ERA5-PA 1981–2020−11.4−10.2−9.2−8.3−6.819.526.429.231.545.0
ERA5-RC1981–2020−8.3−7.0−6.1−5.2−3.615.222.526.831.549.9
CCSM-PA2021–2060−8.8−8.2−7.3−6.8−3.717.927.731.336.148.2
CCSM-RC2021–2060−6.0−4.8−4.0−3.3−0.411.023.328.033.951.2
GFDL-PA2021–2060−9.5−6.5−5.9−4.6−4.125.236.138.542.153.8
GFDL-RC2021–2060−6.3−3.4−2.7−1.5−1.020.330.636.844.855.7
CCSM-PA2061–2100−6.3−4.8−3.8−3.1−1.821.726.835.039.551.9
CCSM-RC2061–2100−3.0−1.4−0.40.41.513.922.533.040.663.4
GFDL-PA2061–2100−3.6−2.5−2.0−1.2−0.134.339.744.450.579.5
GFDL-RC2061–2100−0.50.51.11.82.926.535.442.050.366.4
Denali (DENA)
ERA5-PA 1981–2020−5.9−4.7−3.9−2.8−1.121.934.138.843.654.6
ERA5-RC1981–2020−7.1−5.6−4.9−3.9−2.323.933.736.240.250.0
CCSM-PA2021–2060−4.0−2.9−2.2−1.60.725.840.044.049.364.3
CCSM-RC2021–2060−5.2−4.1−3.4−2.8−0.429.137.840.146.561.1
GFDL-PA2021–2060−4.0−1.7−0.50.51.640.747.651.955.364.5
GFDL-RC2021–2060−5.3−2.7−1.7−0.50.440.145.248.755.467.0
CCSM-PA2061–2100−1.60.21.22.23.834.942.545.150.462.7
CCSM-RC2061–2100−3.0−0.9−0.20.82.733.240.146.049.671.8
GFDL-PA2061–21001.42.22.93.45.246.154.358.562.569.1
GFDL-RC2061–21000.11.01.72.24.054.658.161.164.673.9
Wrangell-St. Elias (WRST)
ERA5-PA 1981–2020−6.8−5.8−5.0−4.7−2.923.630.836.440.362.2
ERA5-RC1981–2020−5.0−3.7−3.0−2.4−0.420.429.736.139.061.0
CCSM-PA2021–2060−4.6−4.0−3.4−3.3−1.723.833.238.943.967.2
CCSM-RC2021–2060−2.7−1.9−1.3−0.90.927.333.338.946.462.1
GFDL-PA2021–2060−5.6−3.6−2.2−1.8−0.423.339.744.648.161.0
GFDL-RC2021–2060−3.6−1.40.00.62.318.737.543.649.759.4
CCSM-PA2061–2100−2.7−1.4−0.7−0.30.926.932.840.049.965.1
CCSM-RC2061–2100−0.90.81.62.13.517.225.637.545.364.6
GFDL-PA2061–2100−1.10.10.81.12.144.749.755.960.885.9
GFDL-RC2061–21001.02.33.23.64.735.841.051.056.480.5
Table 4. Risk level matrix for the bias-corrected CCSM and GFDL mid-century (2021–2060, left) and late-century (2061–2100, right) projections of mean annual air temperature (MAAT; °C) and summer precipitation (JJA PCPT; cm) for the road corridors in the three Alaska national parks. High means that the projected upper quartile value was above 0 °C for MAAT, and above the historical R40 value for JJA PCPT; medium means that the projected maximum MAAT exceeded 0 °C, and exceeded the historical R40 for JJA PCPT; finally, low means that the projected maxima were below freezing for MAAT and below the historical R40 for JJA PCPT.
2021–20602061–2100
National ParkLowMediumHighLowMediumHigh
Gates of the Arctic (GAAR)
CCSMMAATJJA PCPT JJA PCPTMAAT
GFDLMAATJJA PCPT MAAT, JJA PCPT
Denali (DENA)
CCSMMAATJJA PCPT JJA PCPTMAAT
GFDL MAATJJA PCPT MAAT, JJA PCPT
Wrangell-St. Elias (WRST)
CCSM MAAT, JJA PCPT JJA PCPTMAAT
GFDLJJA PCPT MAAT JJA PCPTMAAT
Disclaimer/Publisher’s Note: The statements, opinions and data contained in all publications are solely those of the individual author(s) and contributor(s) and not of MDPI and/or the editor(s). MDPI and/or the editor(s) disclaim responsibility for any injury to people or property resulting from any ideas, methods, instructions or products referred to in the content.

