Article

VOC Emission Characteristics of the Glass Deep-Processing Industry in China

1
College of Resource and Environment, Henan Polytechnic University, Jiaozuo 454003, China
2
Henan Ecological Environment Monitoring and Safety Center, Zhengzhou 450046, China
3
Henan Key Laboratory for Environmental Monitoring Technology, Zhengzhou 450004, China
*
Author to whom correspondence should be addressed.
Atmosphere 2023, 14(1), 179; https://doi.org/10.3390/atmos14010179
Submission received: 21 November 2022 / Revised: 29 December 2022 / Accepted: 4 January 2023 / Published: 13 January 2023
(This article belongs to the Section Air Quality)

Abstract

:
To understand the pollution characteristics of volatile organic compounds (VOCs) in the glass deep-processing industry, samples were collected using polyvinyl fluoride bags and quickly transferred to summa tanks for GC/MS/FID analysis. The emission characteristics of VOCs, the ozone formation potential and the secondary aerosol formation potential were studied. The results showed that the VOCs emitted by the six enterprises were mainly aromatics and OVOCs, accounting for 35% to 97% of the emissions, with high emission loads of alkanes and halocarbons from individual enterprises. The stack emissions from Enterprise 2 were as high as 38 mg/m3, while the emissions from the remaining five enterprises were all in the range of 1.7~4.1 mg/m3, probably because the terminal treatment facilities were not updated in a timely manner, resulting in excessive stack emissions from Enterprise 2. The characteristic pollutants, including OVOCs, aromatics and alkanes, which are mainly derived from spray painting and gluing, were screened in the six enterprises. Aromatics and OVOCs contributed the most to the ozone formation potential in the six enterprises, with some enterprises having a high contribution from alkanes and alkenes. On the basis of the secondary aerosol formation potential, toluene, benzene, ethylbenzene, o-xylene and m/p-xylene account for 98% of the six enterprises’ emissions. Glass enterprises should prioritise the control of benzene and OVOCs emissions. The glass processing industry mainly emits aromatics, OVOCs and alkanes. Through a preliminary study on the emission characteristics of VOCs in the glass deep-processing industry, we provided basic data for the reduction and control of VOCs in the glass deep-processing industry in China.

1. Introduction

Volatile organic compounds (VOCs), a general term for a class of compounds, have a melting point below room temperature and a boiling point between 50 °C and 260 °C [1,2]. The emissions of many VOCs can contribute to stratospheric ozone depletion, tropospheric ozone formation, ground-level smog formation and toxic and carcinogenic human health effects [3,4]. PM2.5 and O3 synergistic treatment has been implemented in China [5,6,7]. PM2.5 is composed of primary PM2.5 that is directly emitted and secondary PM2.5 that is formed by the conversion of gaseous precursors (such as SO2, NOx, VOCs and NH3) [8], and near-surface O3 is mainly generated by the biochemical reaction of NOx and VOCs under light [9], so the key is the synergistic reduction of NOx and VOCs [10]. In recent years, the secondary formation, photochemical reactivity and health risk assessment of industrial VOCs have become research hotspots among scholars. Previous studies showed that the sources of VOCs in China are mainly industrial sources, which account for more than 50% of the total [11,12,13,14].
Currently, industrial parks and first-class industries are the primary research orientations in terms of industrial VOCs. For example, a study was conducted to examine the emissions of VOCs from crude oil processing and judge the overall magnitude of VOC emissions from the various stages of oil processing [15]. In addition, an investigation of VOCs from the cement industry helped deepen the understanding on the emission characteristics of the cement industry and to provide data for industry control [16]. Recently, the research on industrial VOC emissions has begun to shift from key control industries, such as petrochemicals, surface coatings and solvents, to other neglected industries in China. However, no research on the VOC emission characteristics of the glass-deep processing industry has been conducted.
Ordinary flat glass cannot meet people’s increasing needs with the rapid development of society and economy, so glass deep-processing has become the main trend in the development of the glass industry [17]. The pollution emission problems of glass deep-processing have gradually attracted people’s interest, and the pollution emission control of the glass deep-processing industry has gradually received attention. According to China’s National Bureau of Statistics, China’s production of deep-processed glass reached 912 million square meters in 2020. The proportion of glass deep-processing in industrial developed countries has exceeded 80%, while China’s glass deep-processing accounts for only 40%. Many organic solvents are used in spraying, coating, screen printing and other glass deep-processing processes. The pollution caused by VOC emissions should not be underestimated in glass processing enterprises. Studies have shown that glass deep-processing in the production and decoration of spray painting, drying, baking, drawing and other processes generates many VOCs [18]. The VOC pollution prevention and control feasibility technical guide includes glass products in key VOC control industries in Zhejiang Province, China, and points out that VOC emissions mainly exist in the spray painting and coating process [19]. Meanwhile, China’s National Development and Reform Commission, the Ministry of Industry and Information Technology, the Ministry of Ecology and Environment and the National Energy Administration jointly issued the ‘Implementation Guide for Energy-saving and Carbon-reducing Transformation and Upgrading in Key Areas of High Energy-Consuming Industries (2022 Edition)’, in which 17 industries, including glass, are classified as key industries [20].
In this study, six typical glass deep-processing enterprises were selected for study, containing tempered glass, insulating glass, glass aluminium mirrors, glass coating, glass baking, glass printing and silk-screen printing. The stack emissions of VOC components were monitored during solvent use, such as spray painting, coating and gluing. The components of VOCs in the organic emissions of organic solvents that are used in processes such as spray painting and coating were monitored. Fifty-three VOCs were identified, including alkanes, alkenes, aromatics, halocarbons and OVOCs. The analysis of the emission characteristics, the ozone formation potential and the secondary aerosol formation potential identified the species with great environmental impact. This study fills the gap in the research of VOC emission characteristics in glass deep-processing in China. The analysis of the VOC pollution characteristics of different types of glass deep-processing enterprises provides basic data support for the reduction and control of VOCs in China’s glass deep-processing industry.

2. Materials and Methods
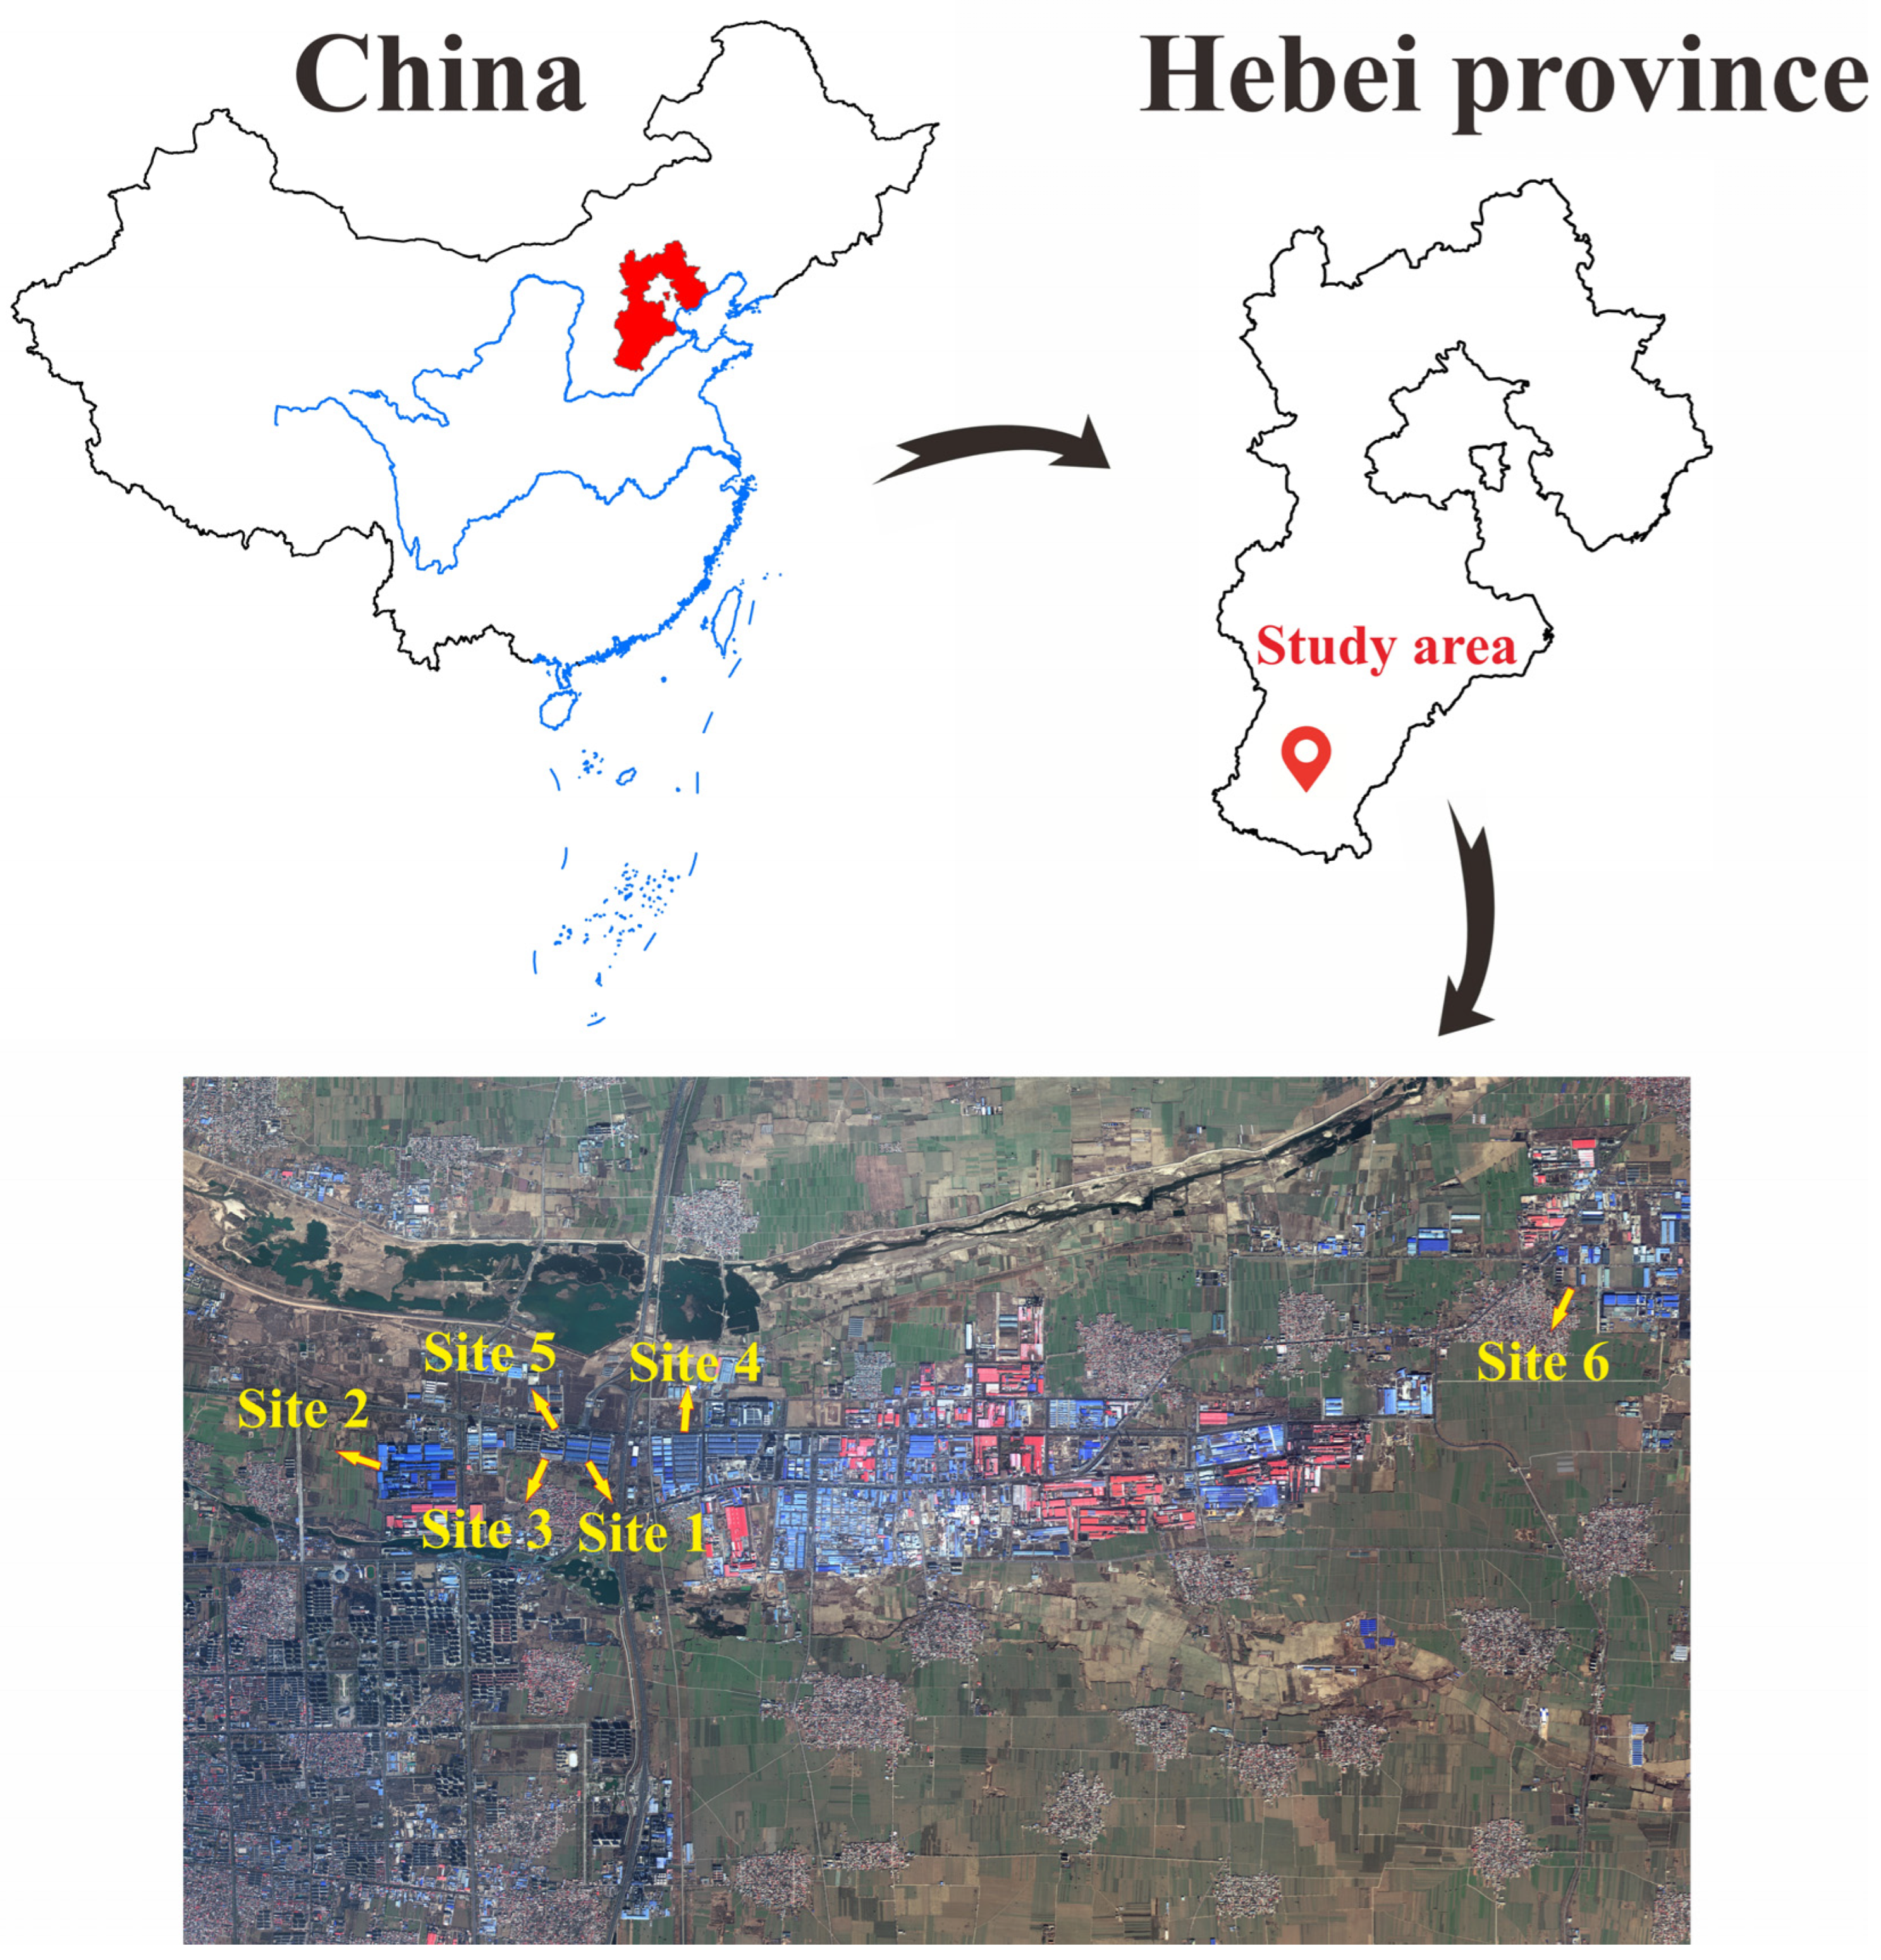
2.1. Sampling Sites

As shown in Figure 1, the six glass deep-processing factories selected in Xingtai City, Hebei Province, China, produce over 1 million square meters of deep-processed glass in each factory annually. The products include paint, silk printing, coated, insulating, laminated and aluminium mirror glasses. Among the glass deep-processed products, paint and silk printing glasses require a large amount of paint, ink and thinner, while hollow, coated and laminated glasses need a huge amount of adhesives in their production. When these solvents are used and dried, many VOCs are produced. We prepared stack emission VOC samples related to the six factories’ deep-processing processes. Organised sampling was carried out at the chimney sampling port that was unaffected by other plant areas and the surrounding climate.

2.2. Sampling Collection and Chemical Analysis

VOC measurement was conducted using the method outlined in a previous study [21]. Sampling points were selected from the pipeline sampling port in front of the treatment facility and the sampling port near the chimney outlet, and the two samples were collected simultaneously for 1 h. The exhaust gases emitted by the exhaust pipe of the stationary source were collected and stored directly in polyvinyl fluoride bags that were chemically inert using equipment such as vacuum boxes and suction pumps. A total of 24 samples were taken, including parallel samples.
After the sample collection, the waste gas was quickly transferred from the sampling bag to the summa tank by using a gas-tight glass syringe and sent to the laboratory for testing. The sample transfer process was carried out in sealed state, and the summa tank was in vacuum state. The error of the transfer process was very small and could be ignored. The gas was analysed using a GC/MS-QP2010 Plus gas chromatograph–mass-selective detector/flame ionisation detector to determine the fraction of VOCs.
The measurement strictly complied with the National Environmental Protection Standard of the People’s Republic of China (HJ759-2015). Exhaust gas samples were pre-concentrated using a three-stage cold trap (Entech 7100 system, California, USA) gas chromatograph–mass-selective detector/flame ionisation detector (GC-MS/FID) VOC monitoring system to analyse the VOC components. For the primary cold trap, the trap temperature was −150 °C; the trap flow rate was 100 mL/min; the resolution temperature was 10 °C; the valve temperature was 100 °C; the baking temperature was 150 °C; and the baking time was 15 min. For the secondary cold trap, the trap temperature was −15 °C; the trap flow rate was 10 mL/min; the trap time was 5 min; the resolution temperature was 180 °C; the resolution time was 3.5 min; the baking temperature was 190 °C; and the baking time was 15 min. For tertiary focusing, the focusing temperature was −160 °C; the resolution time was 2.5 min; the baking temperature was 200 °C; and the baking time was 5 min. The transmission line temperature was 120 °C. A total of 72 VOC compounds were detected by the GC-MS/FID system. The detection rate of the six VOCs was less than 50%. Thus, 54 VOCs were investigated in this study, including 2 alkanes, 3 alkenes, 10 aromatics, 19 halocarbons, up to 19 OVOCs and carbon disulphide.

2.3. Quality Control

Qualitative analysis was performed according to the chromatographic retention time and the mass spectrogram and according to the chromatographic peak areas of the sample and the standard sample. The internal standard method (monochloromethane, 1,2-difluorobenzene, chlorobenze-d5, 4-bromofluorobenzene) was used for quantification. The To-14 and PAMS standard fractions of 1 × 10⁻⁶ were diluted to 0.5 × 10⁻⁹, 1.5 × 10⁻⁹, 15 × 10−9 and 30 × 10−9 by high-precision dilution (Entech 4700, Entech Instruments Inc., Simi Valley, CA, USA). The data were then calibrated based on these calibration results. The calibration curve was established by the relative response factor of the target compounds. The correlation coefficients of the calibration curves were greater than 0.99. In the sample collection, a transport blank (filled with the nitrogen summa tank) was taken to the site. The analysis revealed that it was consistent with the actual sample analysis steps, and the blank sample was not higher than the experimental quantification limit. The quantification limit was calculated according to the ‘Technical Guidelines for the Development of Environmental monitoring and Analytical Methods Standards’. Each time the experimental analysis was performed, the blank experiment was performed first, and the blank experimental result was ensured to not be higher than the experimental quantification limit (experimental quantification limit: Table S1); otherwise, the cause could have eliminated the influence. The instrument was calibrated daily with standard samples, and the error was within 10%; otherwise, the standard curve was re-established. The samples were transported to the laboratory within 7 days after collection, and the experiments were analysed within 7 days. The retention time of the internal standard in the sample was ensured to not deviate by more than 20 s from the retention time of the internal standard in the continuously calibrated standard curve on the same day.

2.4. Reactivity Analysis of Pollution Sources

Ozone formation potential for VOCs.
To determine the effect of emissions on ozone formation in the atmosphere, the chemical reactivity of VOCs should be calculated [22,23,24]. In this study, the maximum incremental reactivity (MIR) method was used to calculate the ozone formation potential (OFP). The O3 formation potential is calculated as follows:
OFPi = VOCi × MIRi,
where OFPi is the ozone formation potential of the individual; VOCi is the atmospheric mass concentration of compound i, mg/m3; and MIRi is the maximum incremental reactivity of compound i taken from the research results of Carter [25].
Secondary aerosol formation potential for VOCs.
On the basis of the Grosjean smoke box experiment, this study estimated the potential contribution of specific VOC species to SOA formation using the aerosol formation coefficient (FAC) method, which is one of the most important indicators for estimating the contribution of individual pollutants to the formation of SOAs and evaluating the impact of VOCs on ambient air:
SOAi = FACi × VOCi × [(1 − Fvocri)]−1,
where SOAi is the secondary aerosol potential of pollutant i from VOCs, mg/m3; FACi is the SOA formation coefficient of pollutant i; VOCi is the initial concentration of pollutant i, mg/m3; and Fvocri is the share of VOCi in the oxidation reaction, %. The value of FAC is based on the research results of Grosjean [26].

3. Result and Discussion

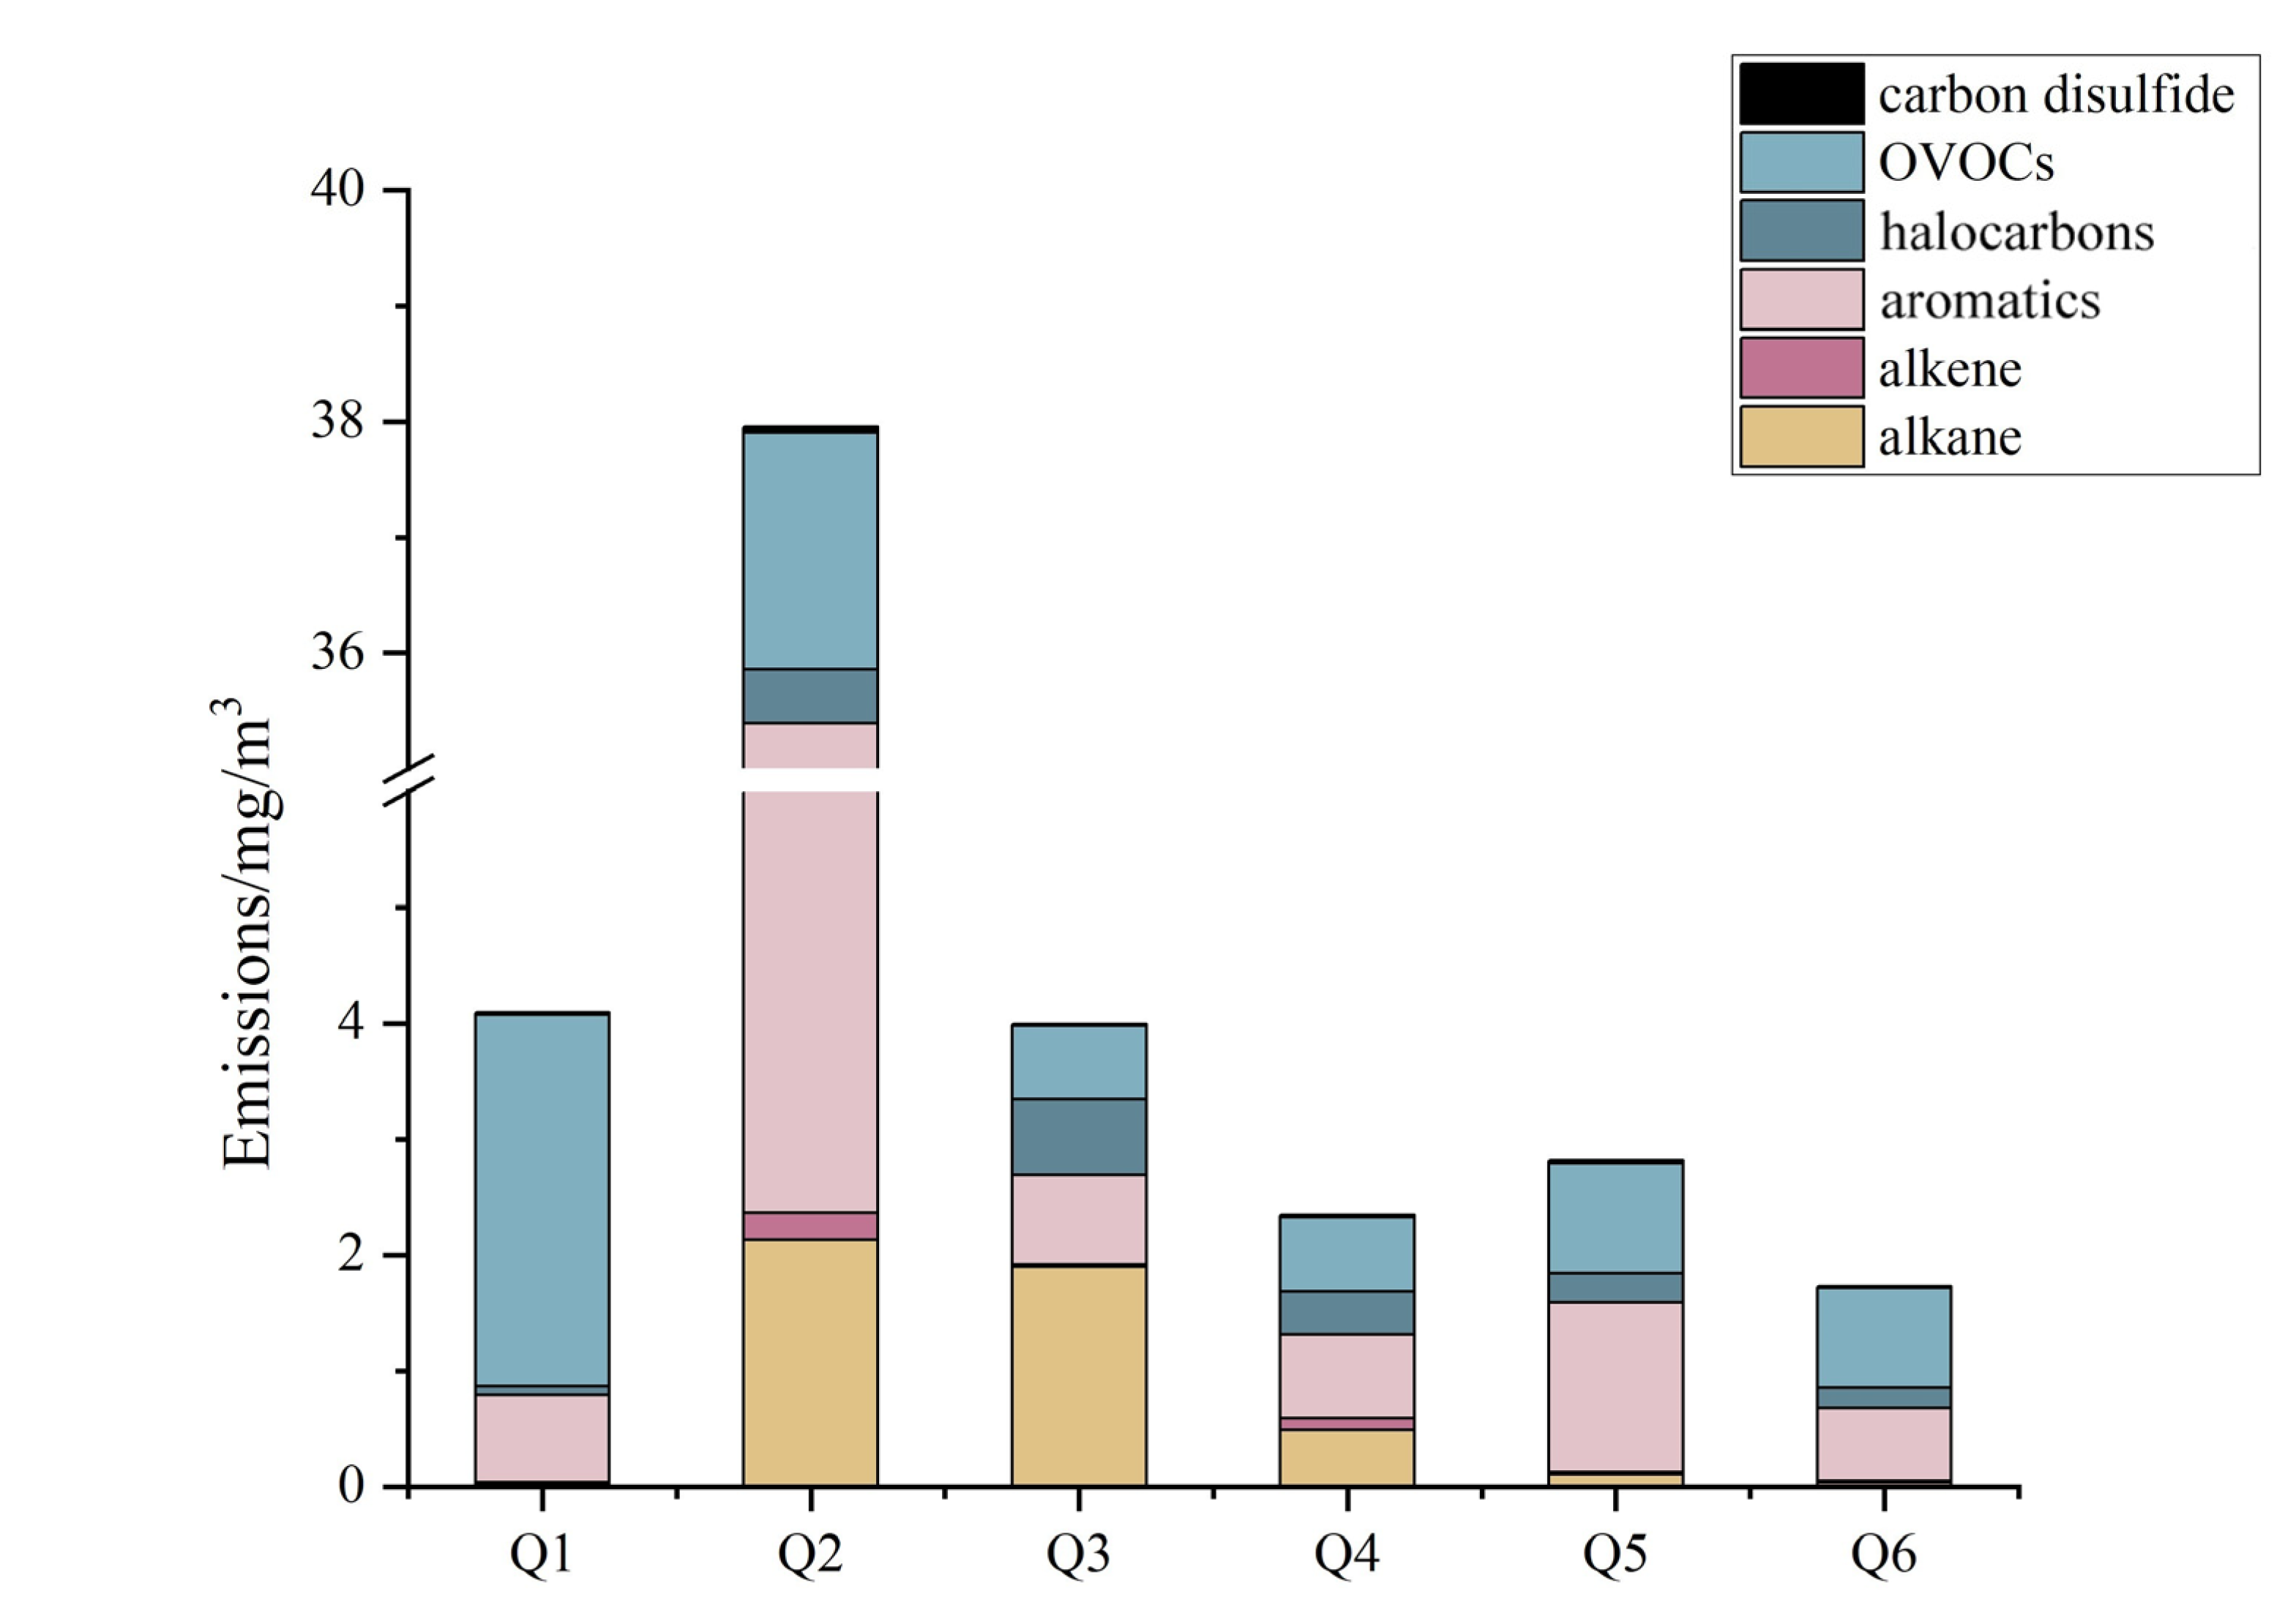
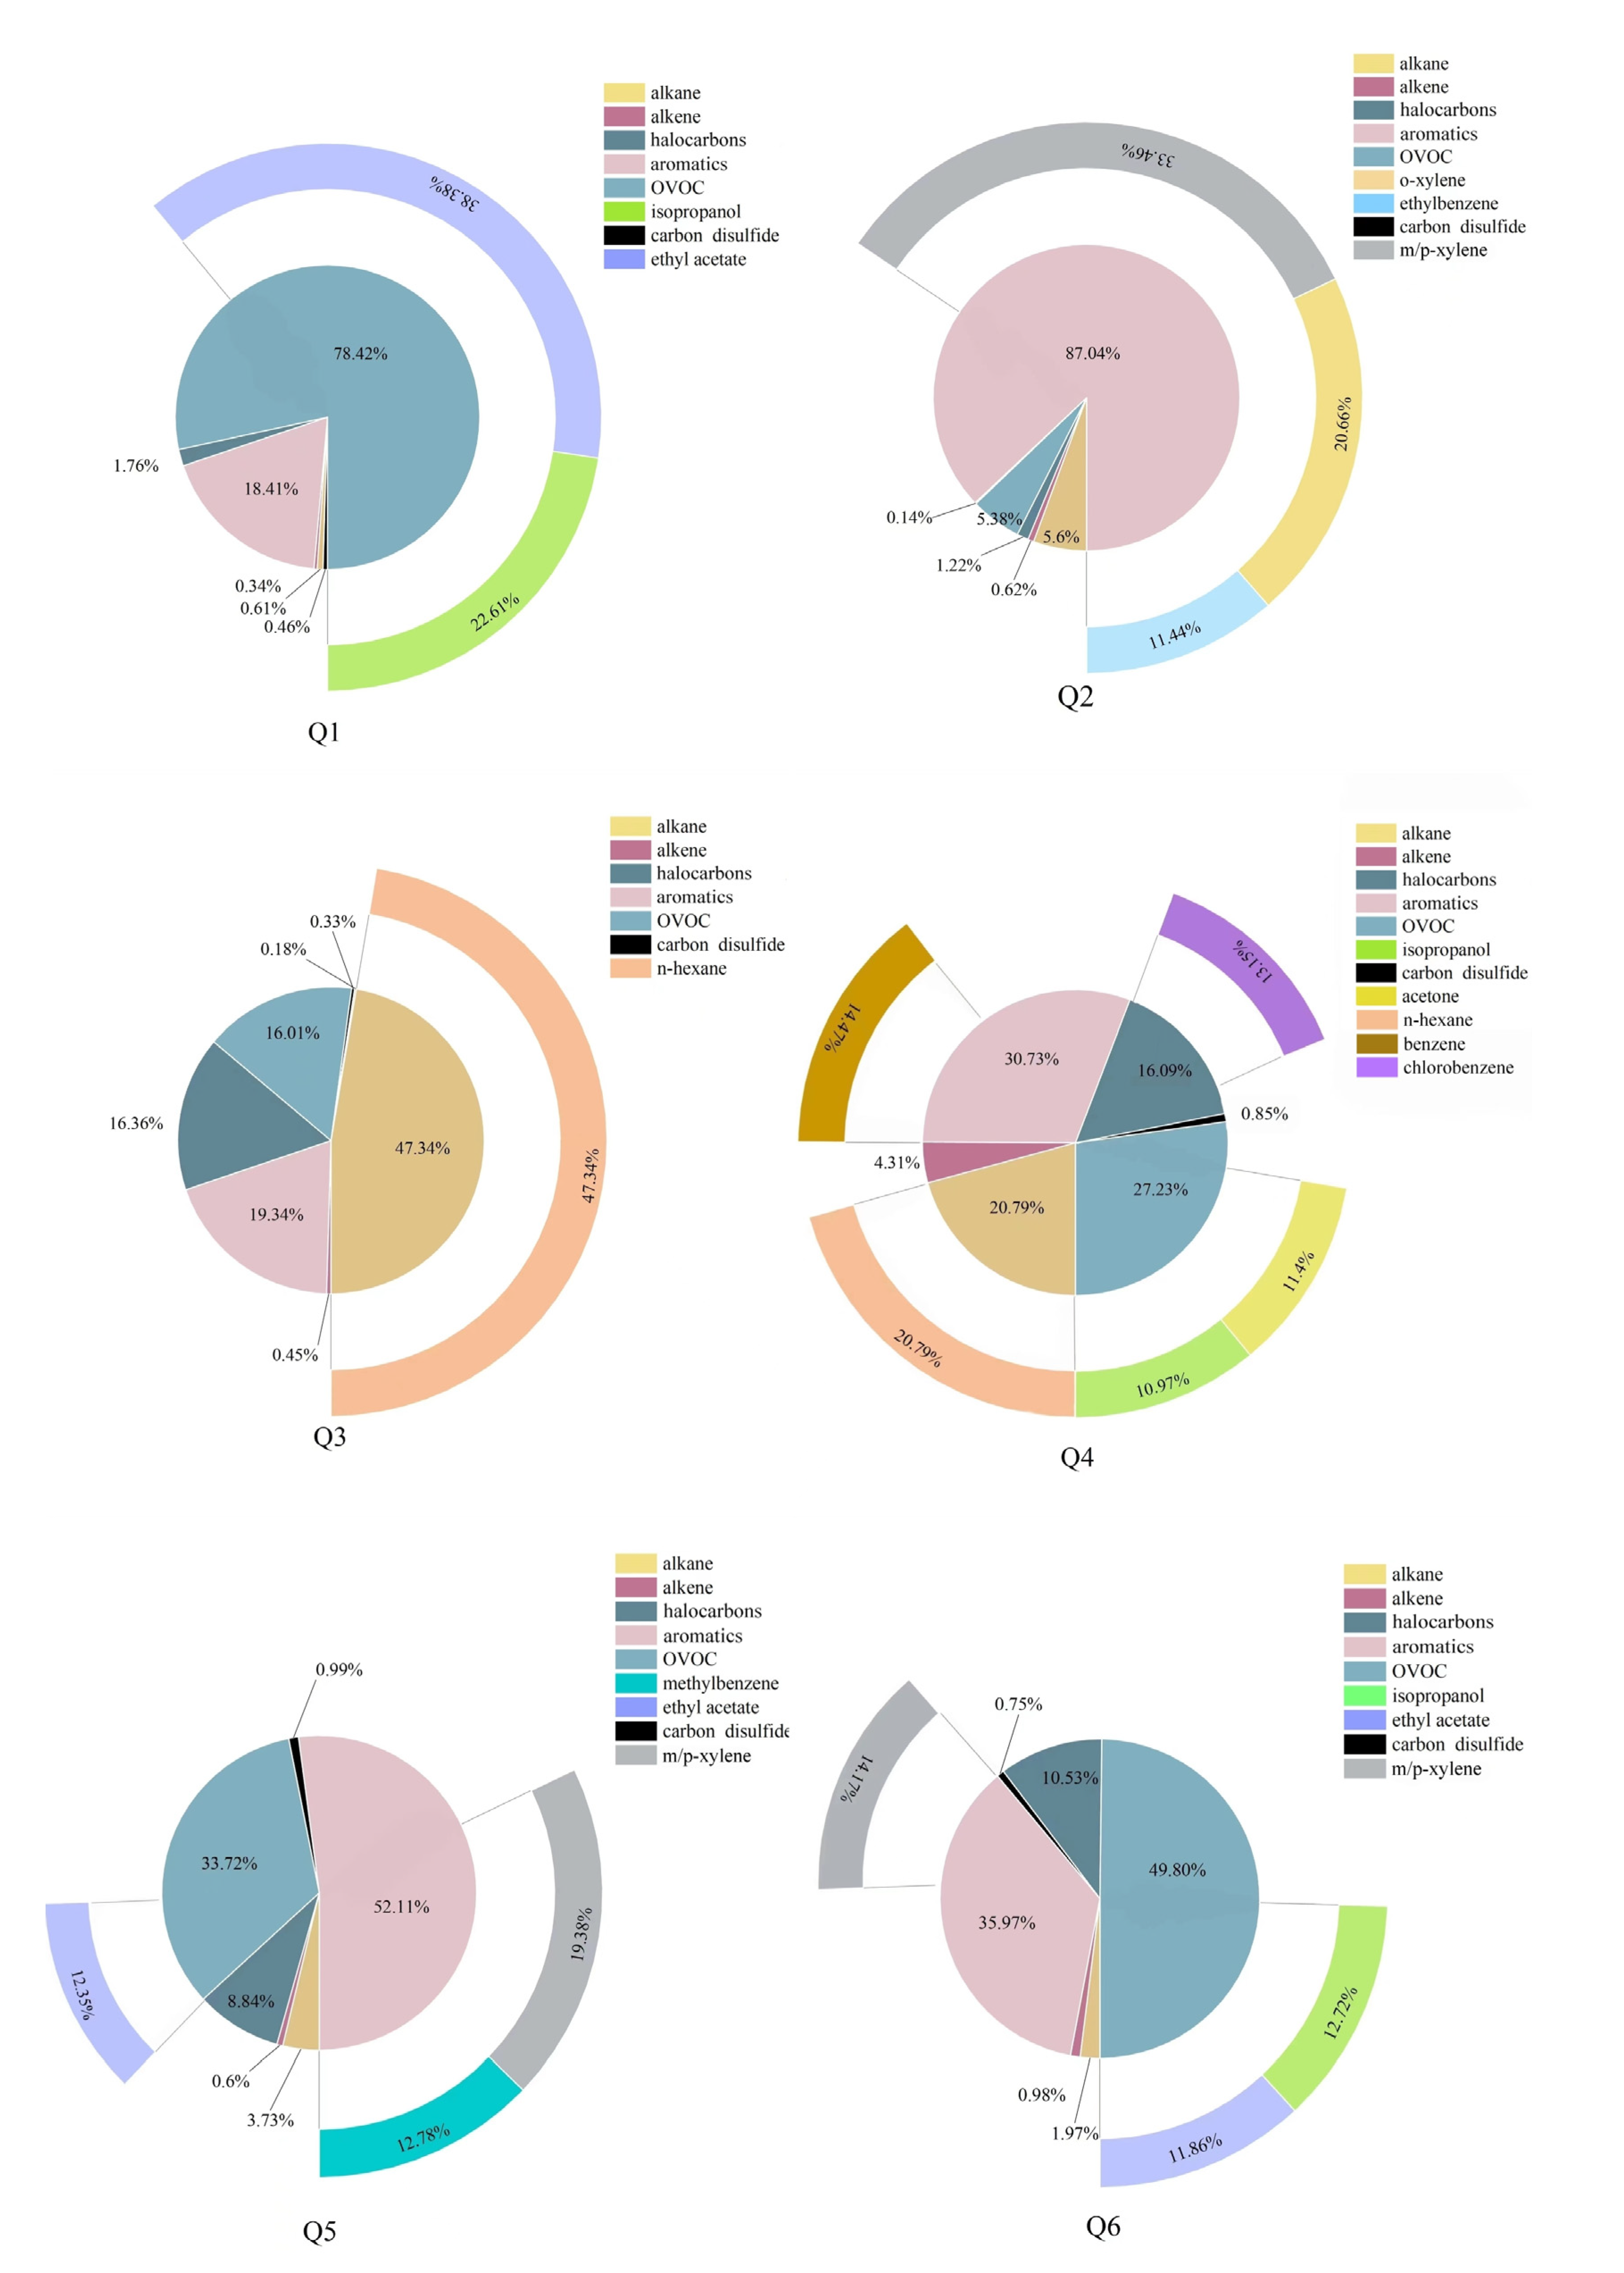
3.1. Characteristics of VOCs Emission

Table 1 describes the sample concentrations, species composition and component characteristics of the organic emissions of VOCs of the six glass manufacturing enterprises, and a total of 54 VOC species were obtained. Of these species, two were alkanes, three were alkenes, ten were aromatics, up to nineteen were halocarbons and OVOCs and one was a carbon disulphide. In terms of total emissions, five of the six enterprises produced emissions between 1.5 and 3.5 mg/m3, but the second enterprise produced emissions up to 38.00 mg/m3. In Qi’s study [27], Enterprises 3 and 4 were glass products and glass deep-processing enterprises, and the emission concentrations of Enterprise 4 were extremely high. Consequently, the measured VOC concentrations of Enterprise 2 in this study was correct. Table 2 describes the concentration of VOCs before and after treatment, the treatment process and the purification efficiency of the six glass deep-processing industries. According to the table, the treatment efficiency of Enterprise 2 was the lowest (33.88%), and the treatment facility was based on activated carbon adsorption + catalytic combustion. This finding can be attributed to the following reasons: the activated carbon adsorption and the catalytic combustion treatment were related to factors such as the temperature humidity flow rate. Low temperature and high humidity can lead to a low purification efficiency; meanwhile, the activated carbon was not replaced in time, and the solvent usage was high [28].
Figure 2 shows that the emissions from Enterprise 1 were mainly aromatics and OVOCs, amounting to 0.753 and 3.208 mg/m3, respectively. Enterprise 2 emitted more alkanes, aromatics and OVOCs than the other five enterprises, and the concentrations of these three substances were high, namely, 2.126, 33.033 and 2.043 mg/m3, respectively. The emissions of alkanes, aromatics, halocarbons and OVOCs were mainly from Enterprise 3, amounting to 1.897, 0.772, 0.653 and 0.639 mg/m3, respectively. The emissions from Enterprises 5 and 6 were mainly from aromatics and OVOCs. The emissions from Enterprise 5 amounted to 1.468 and 0.95 mg/m3, while those from Enterprise 6 amounted to 0.622 and 0.861 mg/m3, respectively. The overall analysis showed that the glass enterprises mainly emitted aromatics and OVOCs, with individual enterprises having high alkane and halocarbon emission loads.
To determine the difference in the VOCs in the different glass deep-processing enterprises, compounds that accounted for more than 10% of the VOC emissions in the six enterprises were used as the characteristic pollutants, as shown in Figure 3. Enterprise 1 emitted 38.4% ethyl acetate and 22.6% isopropyl alcohol. This enterprise mainly produced glass coatings and aluminium mirrors, requiring a large amount of corrosion-resistant and hardening paints in the production process, and used paints and thinners containing a large amount of pollutants such as ethyl acetate and isopropyl alcohol in the process of paint mixing [29], which evaporate during the drying process, resulting in high emissions of both substances. The largest shares of emissions from Enterprise 2 came from m/p-xylene, o-xylene and ethylbenzene, which accounted for 33.5%, 20.6% and 11.4% of the total emissions, respectively. As Enterprise 2 mainly produced printed glass and glass mirrors, the processes involved in the emission of VOCs were mainly paint mixing, lacquering, silk-screening and drying processes in the deep-processing of glass that used large amounts of inks, paints, thinners, gum and curing agents. Organic solvents such as inks and paints contain large amounts of benzene and other volatile substances. Hexane was the main characteristic pollutant emitted by Enterprise 3, accounting for 47.3% of the total emissions. Enterprise 3 was mainly engaged in the production of glass and aluminium mirrors, and the hexane emitted was mainly found in the corrosion-resistant paints and paint thinners used [30]. The proportions of n-hexane, benzene, chlorobenzene, acetone and isopropanol emitted by Enterprise 4 were 20.8%, 14.5%, 13.2%, 11.4% and 11.0%, respectively. Enterprise 4 produced products similar to those of Enterprises 2 and 3, but the thinners used in Enterprises 3 and 4 differed from those used in Enterprise 2, resulting in significant differences in the characteristic pollutants. The process of Enterprise 5 was similar to that of Enterprise 2, with a focus on the production of silk printing glass and the use of solvents, mainly ink. The characteristic pollutants in Enterprise 6 were m/p-xylene, isopropyl alcohol and ethyl acetate, accounting for large proportions of the total emissions, namely, 14.2%, 12.7% and 11.9%, respectively, as Enterprise 6 mainly produced tempered and laminated glasses, consuming substances such as sealant, butyl glue and film in the production process that resulted in high emissions of several substances [31].
The characteristic pollutants were analysed in terms of the production processes and solvents used by the six enterprises. As the glass production process requires the use of many solvents, such as paints, thinners, adhesives and inks, the characteristic pollutants emitted were mainly benzene, OVOCs and alkanes [31]. Among the six enterprises, some enterprises had different production processes, while some enterprises had the same production processes. However, the types of pollutants emitted were different, and the classification of the VOCs indicated that they belonged to alkanes, aromatics and OVOCs. The pollutants emitted were different because the paint, ink, thinner and glue used by the various enterprises were different in terms of the composition of these solvents. Therefore, the control of pollutant emissions from glass enterprises should focus on regulating the use of paints and solvents, and alternative solvents that contain few organic substances and have low volatilities should be selected. In addition, VOC end-of-pipe treatment facilities have a great influence on the pollutant emission type and situation. Thus, the inspection and maintenance of end-of-pipe treatment facilities must be strengthened and updated in a timely manner to ensure the efficient treatment of VOCs.
The analysis of the characteristics of the VOCs emitted by glass enterprises not only depends on the types and characteristics of pollutants but also on the analysis of the chemical reaction activity of the VOCs emitted by the glass industry to provide basic data support for the control and emission reduction measures of the glass processing industry.

3.2. Ozone Formation Potential for VOCs

The MIR method was used to calculate the OFP of the organised VOC emissions from the six glass factories. As shown in Figure 4, aromatics were the largest contributors to ozone formation. The contribution of aromatics to OFP was 208.275 mg/m3 for Enterprise 2, followed by Enterprise 5 (8.540 mg/m3), Enterprise 1 (4.478 mg/m3), Enterprise 6 (3.931 mg/m3), Enterprise 3 (3.149 mg/m3) and Enterprise 4 (2.485 mg/m3).
Figure 5 shows the contribution of different species to the OFP of each enterprise. The figure indicates that the main species contributing to the OFP of Enterprise 1 were aromatics and OVOCs, contributing 65.8% and 33.7% to the OFP, respectively. The aromatic contribution of Enterprise 2 to the OFP was as high as 96.5%. The alkanes, aromatics and halocarbons in Enterprise 3 greatly contributed to the OFP, with 29.9%, 40.0% and 25.5%, respectively. The main species contributing to the OFP in Enterprise 4 were alkanes, alkenes and aromatics, accounting for 12.7%, 26.7% and 52.1%, respectively. Enterprises 5 and 6 were similar to Enterprise 2, with aromatics contributing 88.6% and 83.4%, respectively, and OVOCs contributing 11.3% and 15.6%, respectively.
Aromatics and OVOCs were the main contributing components to the OFP in the six enterprises, while alkanes and alkenes were the main contributors to the OFP in Enterprises 3 and 4. This result shows that the emissions of aromatics and OVOCs should be taken seriously in the glass deep-processing industry. Aromatics and OVOCs are mainly found in the additives to various paints, adhesives and waterproofing materials [29,31], so attention should be paid to the screening of paints and thinners to reduce the contribution of VOC emissions to O3 from the source. VOCs are not only precursors of ozone but also of secondary aerosol formation.

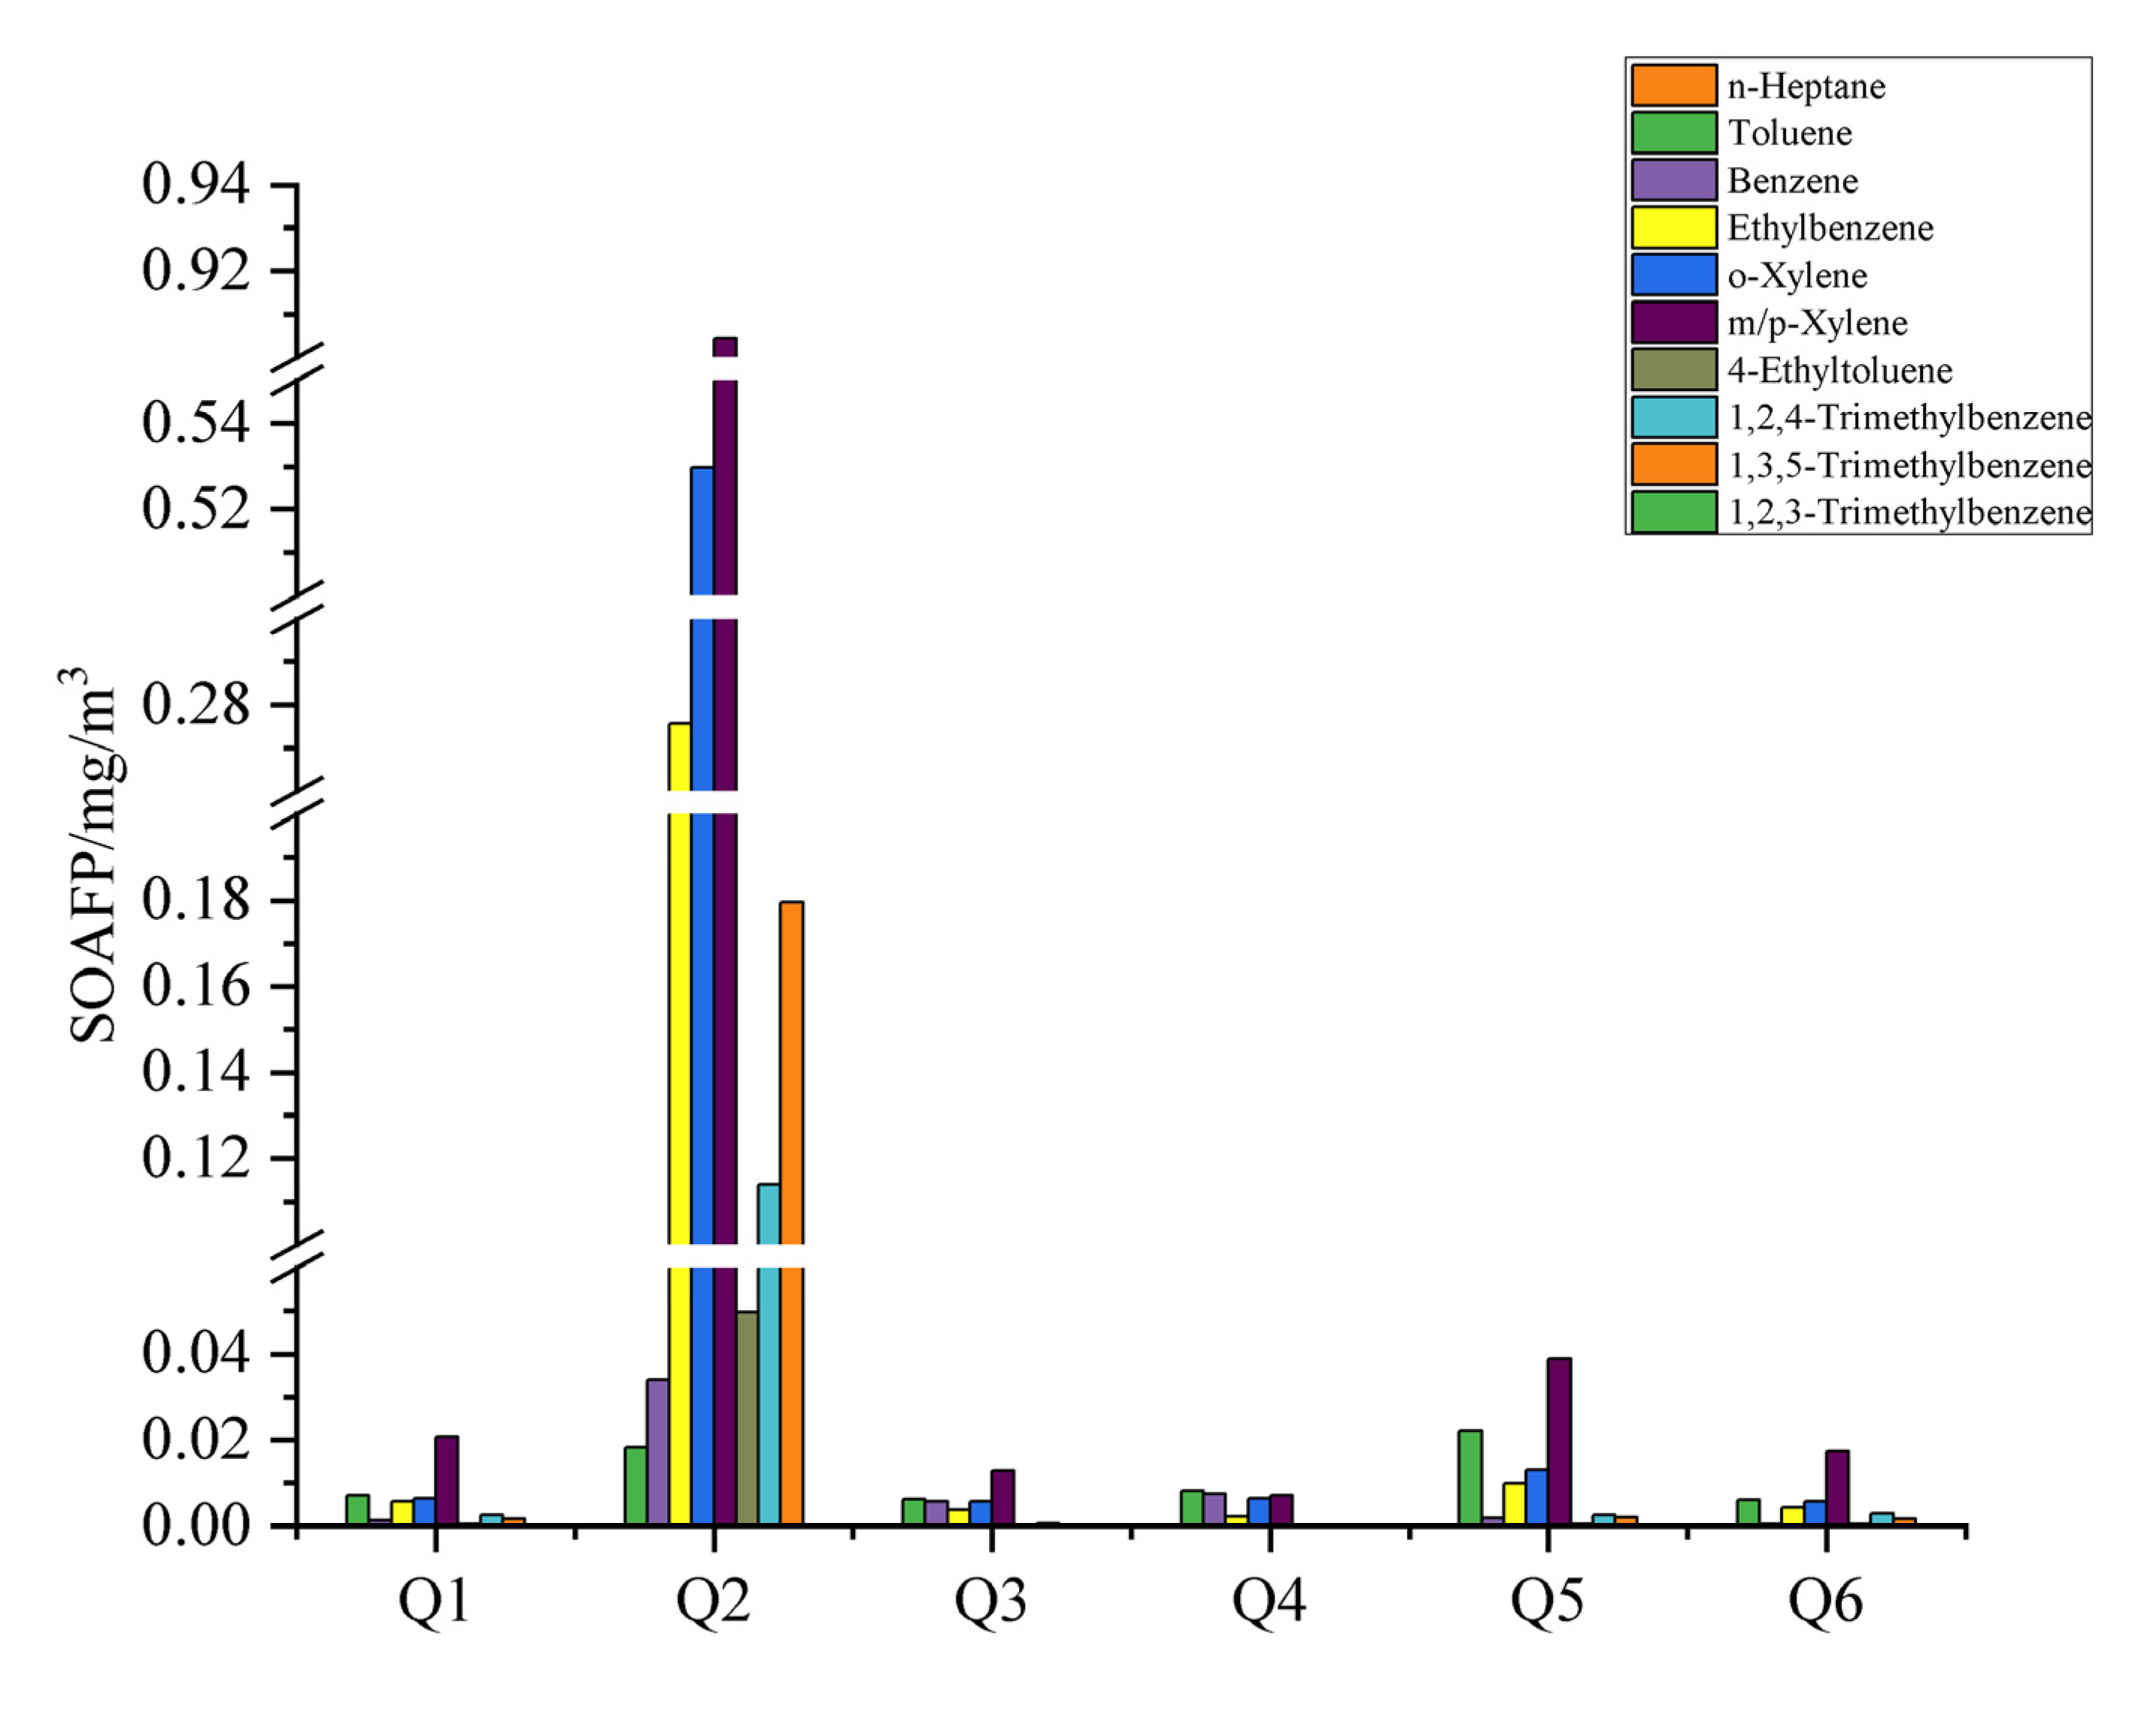
3.3. Secondary Aerosol Formation Potential for VOCs

The SOA formation potential of the VOCs emitted by the six glass producers was analysed using the FAC method as shown in Figure 6. Ten of the fifty-four VOC components measured contributed to the secondary aerosol formation potential (SOAFP), namely n-heptane, toluene, benzene, ethylbenzene, o-xylene, m/p-xylene, 4-ethyltoluene, 1,2,4-trimethylbenzene and 1,3,5-trimethylbenzene. Of these components, benzene accounted for nine. In all six companies, aromatics contributed 98% or more to the SOAFP. The figure shows that the six enterprises contributed to secondary aerosol production, mainly with five substances, namely toluene, benzene, ethylbenzene, o-xylene and m/p-xylene.
Figure 6 shows that Enterprise 1 was the highest contributor of m/p-xylene to the SOAFP, amounting to 20.72 × 10⁻³ mg/m3, followed by toluene (7.17 × 10⁻³ mg/m3), o-xylene (6.56 × 10⁻³ mg/m3) and ethylbenzene (5.78 × 10⁻³ mg/m3). In Enterprise 2, m/p-xylene, o-xylene and ethylbenzene contributed more to the SOAFP than the other species, with contributions of 904.39 × 10⁻³, 529.73 × 10⁻³ and 275.72 × 10⁻³ mg/m3, respectively. The main contributing species to the SOAFP in Enterprise 3 were m/p-xylene (12.81 × 10⁻³ mg/m3), toluene (6.32 × 10⁻³ mg/m3), benzene (5.82 × 10⁻³ mg/m3) and o-xylene (5.81 × 10⁻³ mg/m3). The main species contributing to the SOAFP in Enterprise 4 were toluene (8.16 × 10⁻³ mg/m3), benzene (5.82 × 10⁻³ mg/m3) and o-xylene (5.81 × 10⁻³ mg/m3). The main species contributing to the SOAFP were toluene (8.16 × 10⁻³ mg/m3), benzene (7.53 × 10⁻³ mg/m3), m/p-xylene (7.27 × 10⁻³ mg/m3) and o-xylene (6.55 × 10⁻³ mg/m3). The largest contributors to the SOAFP in Enterprise 5 were m/p-xylene (38.88 × 10⁻³ mg/m3), toluene (22.09 × 10⁻³ mg/m3), o-xylene (13.04 × 10⁻³ mg/m3) and ethylbenzene (9.85 × 10⁻³ mg/m3). Enterprise 6 also contributed 17.45 × 10⁻³ mg/m3 of m/p-xylene, 6.08 × 10⁻³ mg/m3 of toluene, 5.81× 10⁻³ mg/m3 of o-xylene and 4.45 × 10⁻³ mg/m3 of ethylbenzene.
Aromatics such as toluene, benzene, ethylbenzene, o-xylene and m/p-xylene are mainly found in additives to various paints, adhesives and waterproofing materials [29,31]. Solvent additives such as the paints used by the first five companies and the adhesives used by the sixth company contain and release high levels of aromatics, thus contributing to the formation of secondary aerosols.

4. Conclusions

The use of glass deep-processing technology solvents can emit large amounts of VOCs into the atmosphere. This study was the first to study the VOCs emitted by the glass deep-processing industry. In the organic emission characterisation, Enterprise 1 mainly generated pollutants such as ethyl acetate and isopropanol. Enterprise 2 emitted aromatics such as xylene and ethylbenzene. Enterprise 3 mainly emitted n-hexane, and Enterprise 4 mainly emitted n-hexane, benzene, chlorobenzene, acetone and isopropanol. Enterprise 5 mainly emitted xylene, toluene and ethyl acetate, and Enterprise 6 mainly emitted xylene, isopropanol and ethyl acetate. In general, the six industries had different processes and products, but the VOCs they emitted were mainly OVOCs and aromatics, and some enterprises had high alkane emissions. Therefore, the VOC emissions in the glass deep-processing industry are mainly aromatics, OVOCs and alkanes. The OFP showed that aromatics and OVOCs were the main contributors to the OFP in the six enterprises, with alkanes and alkenes contributing greatly to the OFP in Enterprises 3 and 4. The contribution of aromatics to the SOAFP exceeded 98% in all the six enterprises, and the five main contributors to secondary aerosol formation were toluene, benzene, ethylbenzene, o-xylene and m/p-xylene. Aromatics were the main contributors to both the OFP and the SOAFP, while alkanes and OVOCs were the main contributors to the OFP. This preliminary study on the stack emissions of VOCs from glass deep-processing provides basic data support for the reduction and control of VOCs in the glass deep-processing industry in China and the world.
Glass deep-processing enterprises should first reduce their emissions of VOCs from the source (e.g., paint, ink, diluents and other organic solvents). Waterborne and powder paints should be used instead because the diluent used in this kind of paint is water, which has a low volatility and can greatly reduce the emission of VOCs in the process of solvent use. Changing the production process, reducing the use of glue substances or selecting sealants with a high curing rate, such as UV glue, will reduce the volatilisation of VOCs in the curing process. Meanwhile, in focusing on reducing VOC emissions at the source, enterprises should also pay attention to the operation of end-treatment facilities, replace activated carbon and update equipment in a timely manner to improve the efficiency of VOC treatment.

Supplementary Materials

The following supporting information can be downloaded at: https://www.mdpi.com/article/10.3390/atmos14010179/s1, Table S1: Detection item minimum detected concentration.

Author Contributions

Conceptualization, F.Z., M.W. (Mingya Wang) and M.W. (Mingshi Wang); methodology, C.C.; software, X.W.; validation, M.W. (Mingshi Wang), M.W. (Mingya Wang) and X.N.; formal analysis, X.Z.; investigation, Q.X.; resources, M.W. (Mingshi Wang); data curation, P.L.; writing—original draft preparation, F.Z.; writing—review and editing, F.Z., M.W. (Mingshi Wang) and W.W. (Wenju Wang); visualization, C.Z. and Y.W. All authors have read and agreed to the published version of the manuscript.

Funding

This research was funded by the National Natural Science Foundation of China (No.41977284).

Institutional Review Board Statement

Not applicable.

Informed Consent Statement

Not applicable.

Data Availability Statement

The datasets generated during and/or analyzed during the current study are available from the corresponding author on reasonable request.

Acknowledgments

We are grateful for the financial support from the National Natural Science Foundation of China (No.41977284).

Conflicts of Interest

The authors declare no conflict of interest.

References

  1. Zhang, X.; Xue, Z.; Li, H.; Yan, L.; Yang, Y.; Wang, Y.; Duan, J.; Li, L.; Chai, F.; Cheng, M.; et al. Ambient volatile organic compounds pollution in China. J. Environ. Sci. 2017, 55, 69–75. [Google Scholar] [CrossRef] [PubMed]
  2. Zhang, X.; Wang, D.; Liu, Y.; Cui, Y.; Xue, Z.; Gao, Z.; Du, J. Characteristics and ozone formation potential of volatile organic compounds in emissions from a typical Chinese coking plant. J. Environ. Sci. 2020, 95, 183–189. [Google Scholar] [CrossRef] [PubMed]
  3. Carabineiro, S.A.C.; Thompson, D.T. Catalytic Applications for Gold Nanotechnology. In Nanocatalysis; Heiz, U., Landman, U., Eds.; Springer: Berlin/Heidelberg, Germany, 2007; pp. 377–489. [Google Scholar]
  4. Ozturk, B.; Yilmaz, D. Absorptive Removal of Volatile Organic Compounds from Flue Gas Streams. Process. Saf. Environ. Prot. 2006, 84, 391–398. [Google Scholar] [CrossRef]
  5. Lu, X.; Wang, M.; Ding, F.; Yu, Y.; Zhang, Z.; Hu, K. Changes of O3-VOCs-NOx Sensitivity and VOCs Sources at an Urban Site of Nanjing Between 2020 and 2021. Environ. Sci. 2022, 1–18. [Google Scholar] [CrossRef]
  6. Tan, Z.; Lu, K.; Dong, H.; Hu, M.; Li, X.; Liu, Y.; Lu, S.; Shao, M.; Su, R.; Wang, H.; et al. Explicit diagnosis of the local ozone production rate and the ozone-NOx-VOC sensitivities. Sci. Bull. 2018, 63, 1067–1076. [Google Scholar] [CrossRef] [Green Version]
  7. Lu, H.X.; Lyu, X.P.; Cheng, H.R.; Ling, Z.H.; Guo, H. Overview on the spatial-temporal characteristics of the ozone formation regime in China. Environ. Sci. Process. Impacts 2019, 21, 916–929. [Google Scholar] [CrossRef]
  8. Liu, X.; Shi, X.; Lei, Y.; Xue, W. Path of coordinated control of PM25 and ozone in China. Chin. Sci. Bull. 2022, 67, 2089–2099. [Google Scholar] [CrossRef]
  9. Chen, J.; Peng, J.; Xu, Y. Spatiotemporal Distribution and Health Impacts of PM2.5 and O3 in Beijing, from 2014 to 2020. Environ. Sci. 2021, 42, 4071–4082. [Google Scholar] [CrossRef]
  10. Zhong, M.; Tian, J.; Ye, D. China’s Total VOCs Control Program Research and Suggestions during the 14th Five-Year Period. Environ. Impact Assess. 2021, 43, 1–6. [Google Scholar] [CrossRef]
  11. Liu, J.F.; Zhao, J.; Li, T.T.; Bai, Y.H.; Liu, Z.R. Establishment of Chinese anthropogenic source volatile organic compounds emission inventory. China Environ. Sci. 2008, 28, 496–500. [Google Scholar]
  12. Qi, Y.; Shen, L.; Zhang, J.; Yao, J.; Lu, R.; Miyakoshi, T. Species and release characteristics of VOCs in furniture coating process. Environ. Pollut. 2019, 245, 810–819. [Google Scholar] [CrossRef]
  13. Cheng, N.; Jing, D.; Zhang, C.; Chen, Z.; Li, W.; Li, S.; Wang, Q. Process-based VOCs source profiles and contributions to ozone formation and carcinogenic risk in a typical chemical synthesis pharmaceutical industry in China. Sci. Total Environ. 2021, 752, 141899. [Google Scholar] [CrossRef]
  14. Liang, X.M.; Zhang, J.N.; Chen, X.F.; Shi, T.L.; Sun, X.B.; Fan, L.Y.; Ye, D.Q. Reactivity-based Anthropogenic VOCs Emission Inventory in China. Environ. Sci. 2017, 38, 845–854. [Google Scholar] [CrossRef]
  15. Rajabi, H.; Mosleh, M.H.; Mandal, P.; Lea-Langton, A.; Sedighi, M. Emissions of volatile organic compounds from crude oil processing—Global emission inventory and environmental release. Sci. Total Environ. 2020, 727, 138654. [Google Scholar] [CrossRef] [Green Version]
  16. Bai, X.; Liu, W.; Wu, B.; Liu, S.; Liu, X.; Hao, Y.; Liang, W.; Lin, S.; Luo, L.; Zhao, S.; et al. Emission characteristics and inventory of volatile organic compounds from the Chinese cement industry based on field measurements. Environ. Pollut. 2023, 316, 120600. [Google Scholar] [CrossRef]
  17. Zheng, W. Market Situation of glass deep processing industry. Chin. Build. Met. Struct. 2018, 45–47. [Google Scholar]
  18. Zhou, J.; Jiangtao, S. Instructions for the Preparation of Emission Standards for Air Pollutants in Glass Industry (Draft). In Proceedings of the 2020 23rd National Glass Kiln Technology Seminar, Anhui, China, April 14–17 2020; pp. 195–220. [Google Scholar]
  19. Zhejiang Provincial Department of Ecology and Environment. Feasible Technical Guide for the Prevention and Control of Volatile Organic Matter Pollution: Ecological Environment of Zhejiang Province; Department of Ecology and Environment of Zhejiang Province: Hangzhou, China, 2021.
  20. National Development and Reform Commission of the People’s Republic of China. Implementation Guide for Upgrading Energy Conservation and Carbon Reduction in Key Sectors of Energy-Intensive Industries (2022 Edition); National Development and Reform Commission: Beijing, China, 2022.
  21. Liu, H.; Xu, B.; Li, J.; Yao, Y.; Fang, X.; Yang, H. The test method of Volatile Organic Compounds (VOCs). Electr. Power Technol. Environ. Prot. 2017, 33, 1–5. [Google Scholar]
  22. Li, Q.; Su, G.; Li, C.; Wang, M.; Tan, L.; Gao, L.; Mingge, W.; Wang, Q. Emission profiles, ozone formation potential and health-risk assessment of volatile organic compounds in rubber footwear industries in China. J. Hazard. Mater. 2019, 375, 52–60. [Google Scholar] [CrossRef]
  23. Li, L.; An, J.Y.; Shi, Y.Y.; Zhou, M.; Yan, R.S.; Huang, C.; Wang, H.L.; Lou, S.R.; Wang, Q.; Lu, Q.; et al. Source apportionment of surface ozone in the Yangtze River Delta, China in the summer of 2013. Atmos. Environ. 2016, 144, 194–207. [Google Scholar] [CrossRef]
  24. Wang, Q.; Li, S.; Dong, M.; Li, W.; Gao, X.; Ye, R.; Zhang, D. VOCs emission characteristics and priority control analysis based on VOCs emission inventories and ozone formation potentials in Zhoushan. Atmos. Environ. 2018, 182, 234–241. [Google Scholar] [CrossRef]
  25. Carter, W.P.L. Development of the SAPRC-07 chemical mechanism. Atmos. Environ. 2010, 44, 5324–5335. [Google Scholar] [CrossRef]
  26. Grosjean, D.; Seinfeld, J.H. Parameterization of the formation potential of secondary organic aerosols. Atmos. Environ. 1989, 23, 1733–1747. [Google Scholar] [CrossRef]
  27. Qi, Y.; Ni, J.; Zhao, D.; Zhang, N.; Ji, T.; Gong, S. Emission Characteristics of Volatile Organic Compounds (VOCs) fromTypical Industrial Sectors in Xingtai City. Res. Environ. Sci. 2021, 34, 2339–2349. [Google Scholar] [CrossRef]
  28. Wu, J.; Chen, Q.; Cai, Z.; Chen, C.; Ye, F. Problems and Process Optimization of Adsorption and Catalytic CombustionProcess in Waste Gas Treatment of Coating Industry. J. Salt Sci. Chem. Ind. 2020, 49, 7–9. [Google Scholar] [CrossRef]
  29. Zhang, J.; Zhang, G.; Zhang, Y.; Zhu, J.; Wang, W.; Jiang, H.; Liu, Z. Research progress on paint thinner testing and identification. Fire Sci. Technol. 2020, 39, 282–284. [Google Scholar]
  30. Jin, P. Characteristics of hexane (n-hexane). Saf. Health 2010, 07, 34. [Google Scholar]
  31. Zhang, L.; Wu, T.; He, Y.; Li, Z.; Yan, H. Study on detection methods of volatile organic compounds in adhesives. China Adhes. 2019, 28, 45–48. [Google Scholar] [CrossRef]
Figure 1. Location map of sampled enterprises. (Enterprise 1:36°53′56.11″ N,114°32′40.95″ E; Enterprise 2:36°53′48.33″ N,114°31′40.69″ E; Enterprise 3:36°53′59.07″ N,114°32′36.77″ E; Enterprise 4:36°54′2.19″ N,114°33′23.32″ E; Enterprise 5:36°54′4.29″ N,114°32′28.47″ E; Enterprise 6:36°55′15.20″ N,114°39′8.63″ E).
Atmosphere 14 00179 g001
Figure 2. Characteristics of species concentration of six glass deep-processing enterprises.
Atmosphere 14 00179 g002
Figure 3. Percentage of characteristic pollutants.
Atmosphere 14 00179 g003
Figure 4. Contribution of different components to OFP.
Atmosphere 14 00179 g004
Figure 5. Percentage contribution of different components to OFP.
Atmosphere 14 00179 g005
Figure 6. Contribution of different components to SOA.
Atmosphere 14 00179 g006
Table 1. Sample concentrations, species composition and component characteristics of the organic emissions of VOCs.
Q1Q2Q3Q4Q5Q6
Types of VOCsMIRFACmg/m3mg/m3mg/m3mg/m3mg/m3mg/m3
Alkanesn-Hexane1.24 0.0252.121.890.4870.1050.034
n-Heptane1.070.0600.0060.007000
Alkenes1-Decene 0.00300000.004
1,3-Butadiene12.61 00.2340.0110.10100
1-Dodecene 0.01100.00700.0170.013
HalocarbonsDibromochloromethane 000000
Tribromomethane 000000
Carbon tetrachloride 00.013000.0110
1,2-Dibromoethane 000000
1,2-Dichloroethane0.21 0.0150.0050.00500.1250.022
1,1,1-Trichloroethane 000000
1,1,2-Trichloroethane0.086 000.001000
1,1,2-Trichlorotrifluoroethane 00.0120.005000.004
1,1,2,2-Tetrachloroethane 000000
Hexamethyldisiloxane 0000.01100
1,1-Dichloroethylene 00.0030000
cis-1,2-Dichloroethylene 000000
trans-1,2-Dichloroethylene 000000.127
Tetrachloroethylene0.031 0.0570.1380.0910.0370.0780.029
Chloropropene7 00.0440.27700.0060
cis-1,3-Dichloropropene5.03 00.0020000
trans-1,3-Dichloropropene3.7 000000
Chlorobenzene0.32 00.1610.2010.3080.0130
1,3-Dichlorobenzene 00.0860.0730.0210.0160
AromaticsBenzene0.7220.0611.530.2620.3390.0830.02
Toluene45.40.1170.2990.1030.1330.360.099
Ethylbenzene3.045.40.0914.340.060.0350.1550.07
o-Xylene7.6450.0977.840.0860.0970.1930.086
m/p-Xylene8.24.70.29112.70.180.1020.5460.245
1,2,3-Trimethylbenzene 00.4210000
1,2,4-Trimethylbenzene8.8720.0532.390.01300.0530.063
1,3,5-Trimethylbenzene 2.90.0151.61000.0180.015
4-Ethyltoluene4.442.50.0161.57000.0160.015
Ethenylbenzene1.73 0.0120.3330.0680.0140.0440.009
Carbon disulphide 0.0190.0520.0130.020.0280.013
OVOCsTetrahydrofuran4.31 0.0930.2010.0060.0030.0360.062
Benzaldehyde−0.67 0.0020.0570.010.0110.0050.002
Acetone0.36 0.130.80.2230.2670.070.09
3-Pentanone 000000
Cyclopentanone 00.0030.002000
2-Nonanone 000000
2-Hexanone 000000
4-Methyl-2-pentanone 0.1580.1920.0480.0240.0630.115
2-Heptanone 00.0080.001000
Anisole 000000
tert-Butyl methyl ether0.73 0.00500.00200.0030
Ethyl acetate0.83 1.570.1720.0870.0580.3480.205
Vinyl acetate3.2 0.0140000.1720.019
n-Butyl acetate0.83 0.2920.4240.0160.0180.1150.137
Ethyl lactate 000000
Propylene glycol monomethyl ether acetate 0.0190.0150.00500.0210.011
Methyl methacrylate 00.0470.15000
Isopropanol0.61 0.9250.1240.0890.2570.1170.22
Table 2. End-treatment facilities, pre-treatment and post-treatment concentrations and corresponding treatment efficiencies of each enterprise.
EnterpriseVOCs Concentration Before Evolution (mg/m3)End-Treatment ProcessVOCs Concentration after Evolution (mg/m3)Purification Efficiency (%)
Enterprise145.73Activated carbon adsorption + water curtain spraying + catalytic combustion4.0991.06
Enterprise 257.47Activated carbon adsorption + catalytic combustion38.0033.88
Enterprise 346.91Activated carbon adsorption + spray tower + dry adsorption + catalytic combustion3.9991.49
Enterprise 420.82RTO exhaust gas treatment2.3488.76
Enterprise 56.13Activated carbon adsorption + UV photo-oxidation2.8254.00
Enterprise 67.53Activated carbon adsorption + UV photo-oxidation catalyst1.7377.02
Disclaimer/Publisher’s Note: The statements, opinions and data contained in all publications are solely those of the individual author(s) and contributor(s) and not of MDPI and/or the editor(s). MDPI and/or the editor(s) disclaim responsibility for any injury to people or property resulting from any ideas, methods, instructions or products referred to in the content.

