Article

Spatiotemporal Characteristics of Watershed Warming and Wetting: The Response to Atmospheric Circulation in Arid Areas of Northwest China

1
Key Laboratory of Plateau Geographic Processes and Environment Change of Yunnan Province, Faculty of Geography, Yunnan Normal University, Kunming 650500, China
2
Key Laboratory of Water Cycle and Related Land Surface Processes, Institute of Geographic Sciences and Natural Resources Research, CAS, Beijing 100101, China
*
Author to whom correspondence should be addressed.
Atmosphere 2023, 14(1), 151; https://doi.org/10.3390/atmos14010151
Submission received: 23 December 2022 / Revised: 31 December 2022 / Accepted: 5 January 2023 / Published: 10 January 2023

Abstract

:
The Tarim Basin is a large inland arid basin in the arid region of northwest China and has been experiencing significant “warming and wetting” since 1987. As a result, the purpose of this paper is to determine whether the climate transition phenomenon occurred in the Tarim Basin as well as the role of atmospheric circulation in this process. We use meteorological data and atmospheric circulation indexes to study the seasonal trends of climate change in this region from 1987 to 2020 to understand how they are affected by atmospheric circulation. The findings show that, from 1987 to 2020, the Tarim Basin experienced significant warming and wetting; with the exception of the winter scale, all other seasonal scales exhibited a clear warming and wetting trend. From the perspective of spatial distribution, most of the areas showed a significant warming trend, and the warming amplitude around the basin is greater than that in the central area of the basin. However, there are significant regional differences in precipitation change rates. Meanwhile, wavelet analysis shows that there is a significant oscillation period of 17–20 years between climate change and the atmospheric circulation index during 1987–2020. The correlation analysis shows that the Pacific decadal oscillation (PDO) and El Niño-Southern Oscillation (ENSO) are the main influencing factors of climate change in the Tarim Basin at different seasonal scales, while the teleconnection of the Arctic Oscillation (AO) and North Atlantic Oscillation (NAO) is low and the PDO dominates the summer and autumn temperature changes in the Tarim Basin. The research results of this paper show that, despite the warming and wetting trends since 1987 in the Tarim Basin, the climate type did not change. From 1987 to 2020, the main teleconnection factors of climate change in the Tarim Basin were PDO and ENSO.

1. Introduction

The Tarim Basin in China has a typical continental desert climate and is thus very sensitive to the climate of Central Asia and to global climate change. According to current research, the arid region of northwest China has experienced a significant increase in temperature and humidity since 1987, mainly characterized by a significant increase in the frequency of extreme precipitation events [1,2,3,4,5]. The Tarim Basin is the most important inland basin in the arid region of northwest China and even in the whole arid region of Central Asia. A significant increase in extreme precipitation events in this region could destabilize the annual runoff in the Tarim River Basin. Seasonally specific climate change, in particular, will have a significant impact on the Tarim Basin’s ecological environment, agricultural environment, and social economy [6,7,8]. Therefore, given the intensification of the “warming and wetting” phenomenon in the arid region of northwest China, the question arises of how climate change is manifested on the seasonal timescale and whether it significantly affects the Tarim Basin. In addition, the Tarim River is the major river in the arid continental region of northwest China and is important for the development of these areas, so the “wetting” phenomenon, especially the seasonally specific type, affects not only the water resources of the Tarim Basin but also the development of ecological resources. Moreover, it strongly affects the economic and agricultural development of this region [9,10,11,12,13]. Therefore, it is vital to understand how seasonally specific climate change affects the inland basins in these arid regions.
Numerous investigations, both domestic and international, have focused on the warming and wetting phenomena. For example, Shi et al. [1] reported a climate transition occurring in northwest China in the early 21st century, and, based on meteorological data, Chen et al. and Li et al. [14,15] confirmed that northwest China was experiencing a significant warming and wetting phenomenon through trend analysis. In addition, Wu et al. and Wang et al. [2,3] showed that the significant warming and wetting phenomenon in the arid region of northwest China was caused primarily by a significant increase in extreme precipitation events in the arid region. Similarly, by studying the intensity of the humidification index in arid areas, Yang et al. and Zhang et al. [16,17] showed that precipitation varied strongly in the different areas and seasons in northwest China, and Gessner et al. [18] confirmed the result. Numerous studies of these regions thus report that the main contributor to the warming and wetting phenomena is the significant increase in the frequency of extreme precipitation, which strongly affects local ecosystems [19,20,21]. However, to date, more studies have focused on climate change on the interannual scale in the arid region of northwest China, whereas little research has focused on seasonally specific climate change in this region.
Previous studies have shown that atmospheric circulation plays a significant role in climate change over different time scales. For example, the El Niño Southern Oscillation (ENSO) can cause extreme hydrological events [4]. Numerous studies have investigated the relationship between climate change and atmospheric circulation in arid areas, and the results confirm that atmospheric circulation helps determine the climate in arid areas on an inter-annual timescale [22,23,24]. However, at present, more studies focus on the interannual timescale than on the seasonal timescale. And the seasonal timescale is important for agriculture in the Tarim Basin because agriculture in this region is mainly rainfed, making it extremely dependent on seasonal precipitation. Thus, the present study considers the seasonal timescale not only to better analyze how atmospheric circulation affects the seasonal climate in the Tarim Basin but also to determine what seasonal agricultural adjustments should be made in this region.
Thus, the purpose of this study is to ascertain if the climate type in the arid Tarim Basin of northwest China has changed since 1987 and to explain the seasonal relationship between atmospheric circulation and climate change in this area. In addition, we investigate the spatial characteristics of the seasonally specific warming and wetting phenomena in the Tarim Basin by analyzing meteorological data and atmospheric circulation indexes from 1987 to 2020, and we discuss the relationship between seasonally specific climate change and atmospheric circulation. The results reveal seasonally changing climate patterns in this area and provide a basis for understanding how atmospheric circulation affects climate change on a seasonal timescale. Finally, the research results of this paper show that, despite the warming and wetting trends since 1987 in the Tarim Basin, the climate type did not change. On the seasonal timescale, the Pacific decadal oscillation (PDO) and the El Niño-Southern Oscillation (ENSO) are the main teleconnection factors of climate change in the Tarim Basin during 1987–2020.

2. Materials and Methods

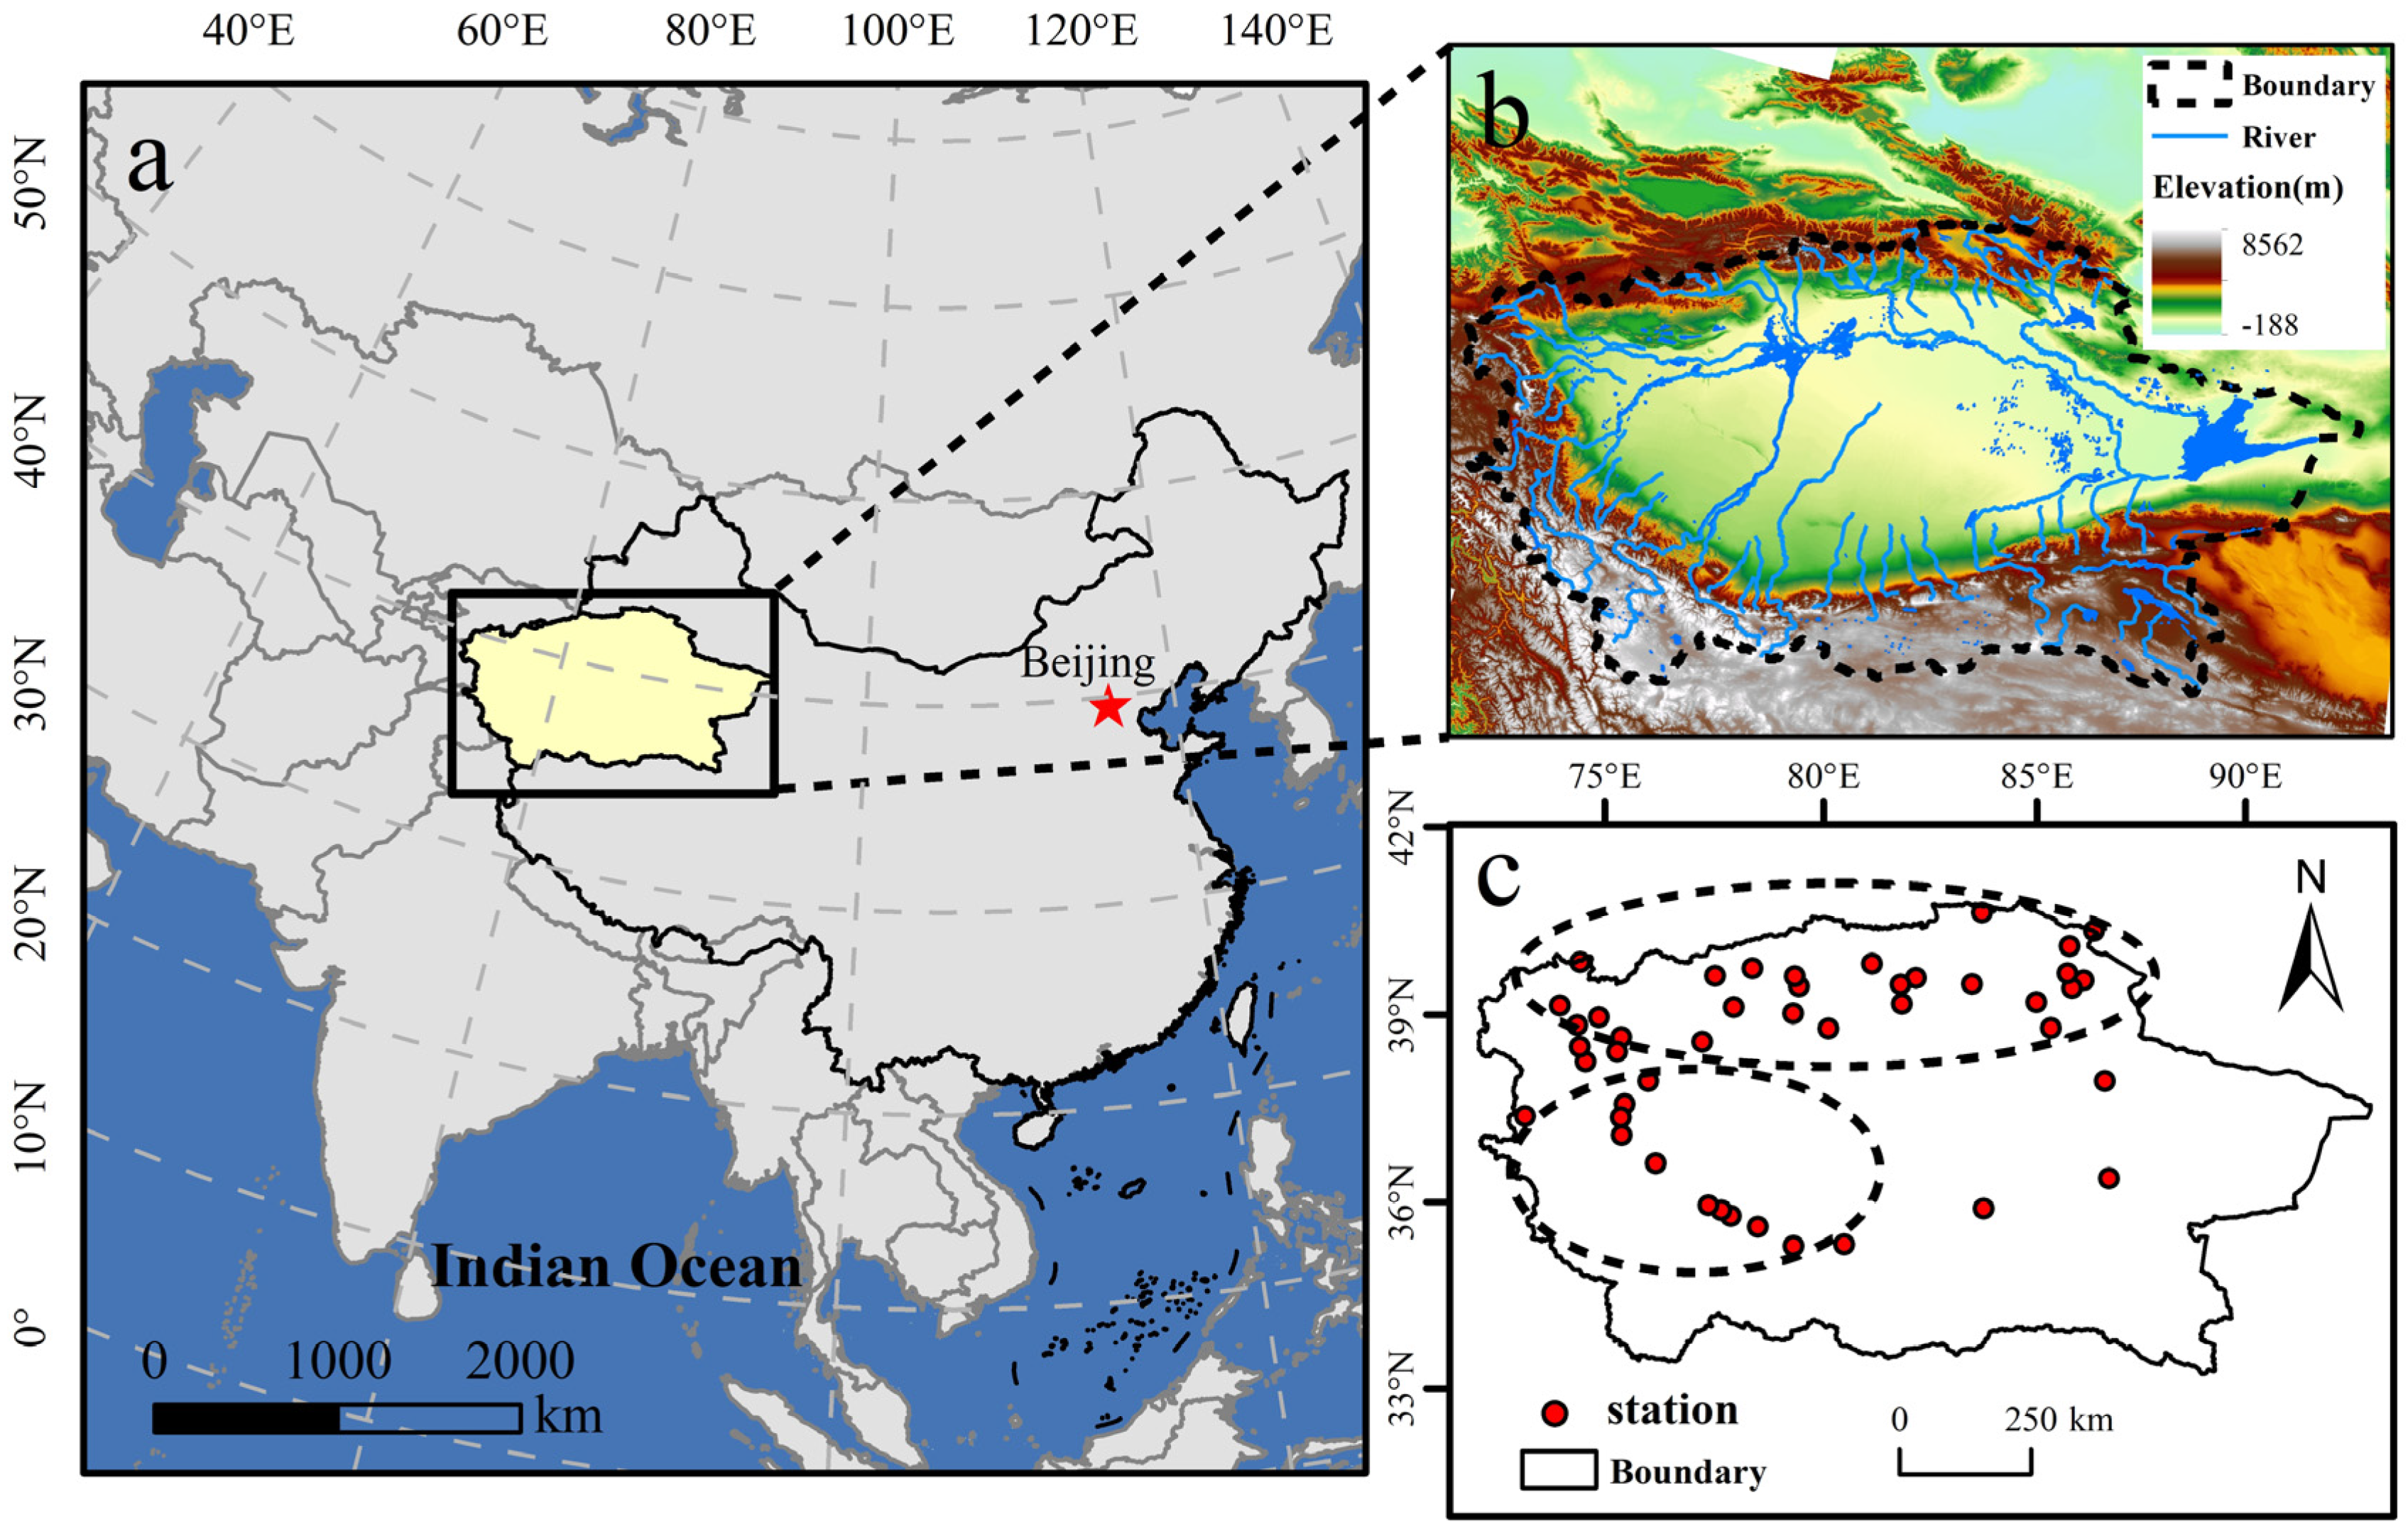
2.1. Study Area and Data Sources

The Tarim Basin is an important inland arid basin in the arid region of northwest China (its geographical location is shown in Figure 1). It has a typical continental desert climate and is located between the Tianshan and Kunlun Mountains. It is 1100 km long from east to west and is one of the largest inland basins in the world. The Tarim River system is composed of four sources and one trunk. It is one of the more complicated river systems in the inland river basin [25,26]. The Tarim River is not only the only flowing water source for animals and plants in southern Xinjiang but also the water system on which the local economy and industry depend for development [18]. In this work, meteorological data is sourced from the Climatic Research Unit TS v.4.03 (CRU) database (http://www.cru.uea.ac.uk/data/, accessed on 22 December 2022) and the data cover the period 1987–2020. The atmospheric circulation index data are from the US National Oceanic and Atmospheric Administration (http://www.esrl.noaa.gov/psd/enso/, accessed on 22 December 2022). The atmospheric circulation indexes considered herein are the Arctic Oscillation (AO) index, the El Niño-Southern Oscillation (ENSO) index, the North Atlantic Oscillation (NAO) index, and the Pacific Decadal Oscillation (PDO) index, and the data cover the period 1987–2020.
The results of Figure 1c show that meteorological stations are mainly distributed in the north and southwest, with an uneven spatial distribution. The CRU data sets are widely used in meteorological and hydrological research. Although the spatial resolution of the data set is relatively low, the spatial distribution in the area without monitoring sites is relatively excellent. For the above reasons, this data set is finally adopted in this paper. In this work, the meteorological data are rasterized using ArcGIS 10.8 software, following which the monthly data are counted as seasonal data by pixel. Finally, the rasterized seasonal data are extracted by region. The monthly atmospheric circulation indexes were calculated and integrated into the seasonal data by using the R programming language. The four seasons were divided according to the meteorological standard: spring ran from March to May; summer from June to September; autumn from September to November; and winter from December to February of the following year.

2.2. Research Methods

2.2.1. Analysis of Change Trend

Unitary linear regression is used in this paper to examine the temporal variation trend of meteorological element value in the study area [27,28]. It is expressed as follows:
S = n × i = 1 n ( i × x i ) · ( i = 1 n i ) × i = 1 n ( x i ) n × ( i = 1 n i 2 ) · ( i = 1 n i ) 2
where x is the meteorological element value of each grid; n is the number of years in the research period, and n in this study is 10 a; S reflects the change rate of meteorological factor values over time. When S > 0 (S < 0), the meteorological factor values showed an increase-decrease trend, and the larger/smaller the value, the more significant the growth (reduction) rate.

2.2.2. Spatial Interpolation Method

Inverse distance weighted interpolation (IDW) is a relatively mature spatial analysis method used in the discipline of meteorology [29,30]. In this method, the distance between the interpolation point and the sample point is used as the weighted average weight. The closer the sample point is to the interpolation point, the greater the weight assigned to the sample point.
Suppose a series of discrete points are distributed on the plane. Because we know that all of the coordinates are Xi, Yi, Zi (i = 1,2,3,…,n), the distance (Di) between the discrete point (Xi, Yi) and the grid point (X, Y) is:
D i = ( X i X ) 2 + ( Y i Y ) 2
The estimated value of grid points (X, Y) is:
Z = i = 1 n ( Z i D i 2 ) i = 1 n ( 1 D i 2 )

2.2.3. Wavelet Analysis

To calculate the real part of the wavelet, this study uses the Morlet continuous complex wavelet as the basis function (i.e., the comr function) [31,32]. It is expressed as follows:
c o m r ( x ) = σ 2 i π · F e × x 2 F b π · F b
where Fe is the center frequency and Fb is the frequency bandwidth. The wavelet square difference is denoted Var and can be obtained by integrating the square of the wavelet coefficient over the time translation domain b:
V a r ( α ) = ω f | ( a , b ) | 2 d b

2.2.4. Correlational Analysis

Correlation analysis is a statistical method to analyze the correlation between variables and is widely used in hydrometeorology. Consider two time series, x and y; we use statistical methods to calculate the correlation coefficient between the two, as follows:
r = i = 1 n ( x i x ¯ ) ( y i y ¯ ) i = 1 n ( x i x ¯ ) 2 i = 1 n ( y i y ¯ ) 2
where r is the correlation coefficient, which ranges from −1.0 to 1.0. When r > 0 (r < 0), the two time series are positively (or negatively) correlated. The correlation is stronger for larger |r| [33,34].

3. Results

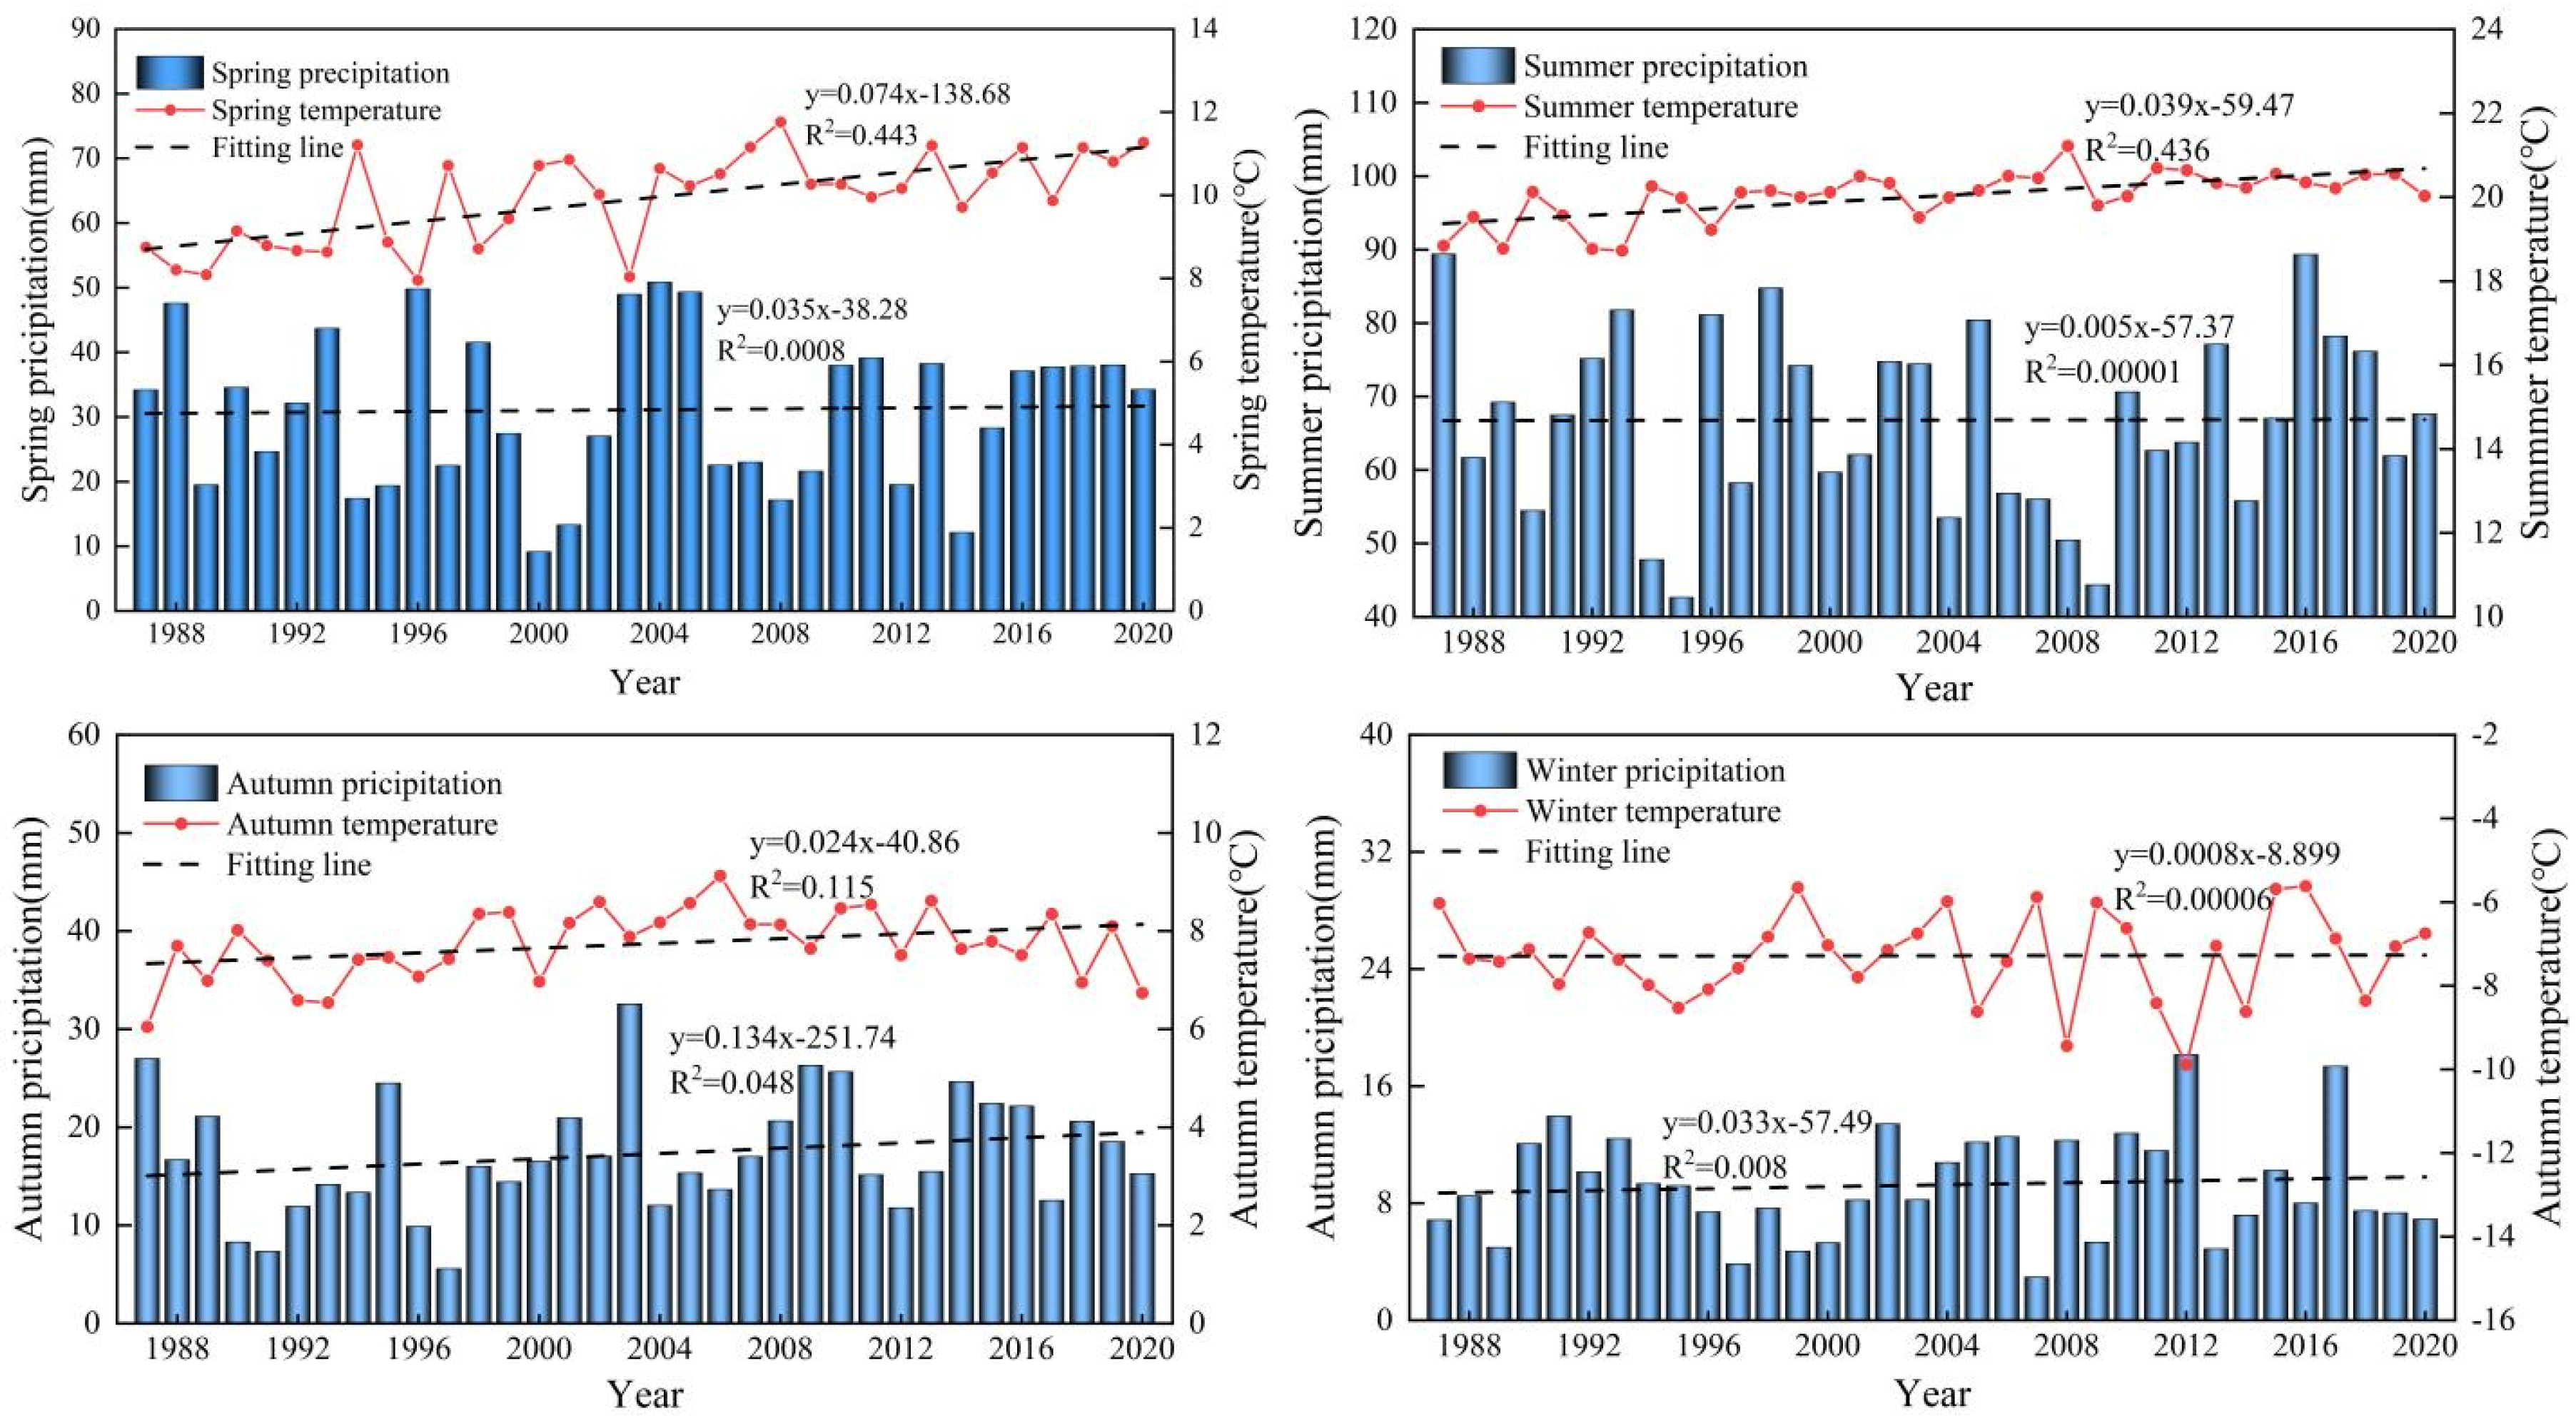
3.1. Temporal Characteristics of Climate Change in the Tarim Basin

This study investigates the interannual variation of temperature and rainfall in the Tarim Basin (Figure 2). For all seasons, temperatures and precipitation rise during the study period. The warming trend in spring is the most significant, with a warming rate of 0.443 °C/decade. The warming trend in winter is not significant, with a warming rate of 0.008 °C/decade. The autumn precipitation increases at the greatest rate (1.34 mm/decade). The increasing rate of precipitation in winter is 0.05 mm/decade. Overall, the warming and wetting phenomenon has been significant in the Tarim Basin over the last 30 years in the spring, summer, and autumn but less so in the winter. This variation is consistent with the typical continental desert climate characteristics of the Tarim Basin, which involve significant changes in climate between the four seasons, with winters being cold and dry [35].
A Morlet wavelet analysis is used to study the seasonal climate cycles in the Tarim Basin from 1987 to 2020 (Figure 3). The results show that the temperatures and precipitation from 1987 to 2020 in the Tarim Basin alternate between a positive phase and a negative phase in the 17–20 year weekly period, which indicates that, from 1987 to 2020, the temperature and precipitation in the Tarim Basin undergo seasonally periodic variations. Calculating the wavelet square difference of temperature and precipitation for each season (results not shown) indicates that, for each season, the temperature and precipitation oscillate with a period of 17–20 years. This phenomenon indicates that the warming and wetting phenomena in the Tarim Basin from 1987 to 2020 followed the same pattern, as shown by the wavelet analysis of the various atmospheric circulation indexes (AO index, ENSO index, NAO index, and PDO index) from 1987 to 2020. From 1987 to 2020, the atmospheric circulation indexes also oscillate significantly with a 17–20-year period, which indicates that the warming and wetting phenomena of the Tarim Basin are related to the atmospheric circulation because they oscillate with the same period. However, how do atmospheric circulation and climate change in space in the Tarim Basin? Further research is needed to address this question.

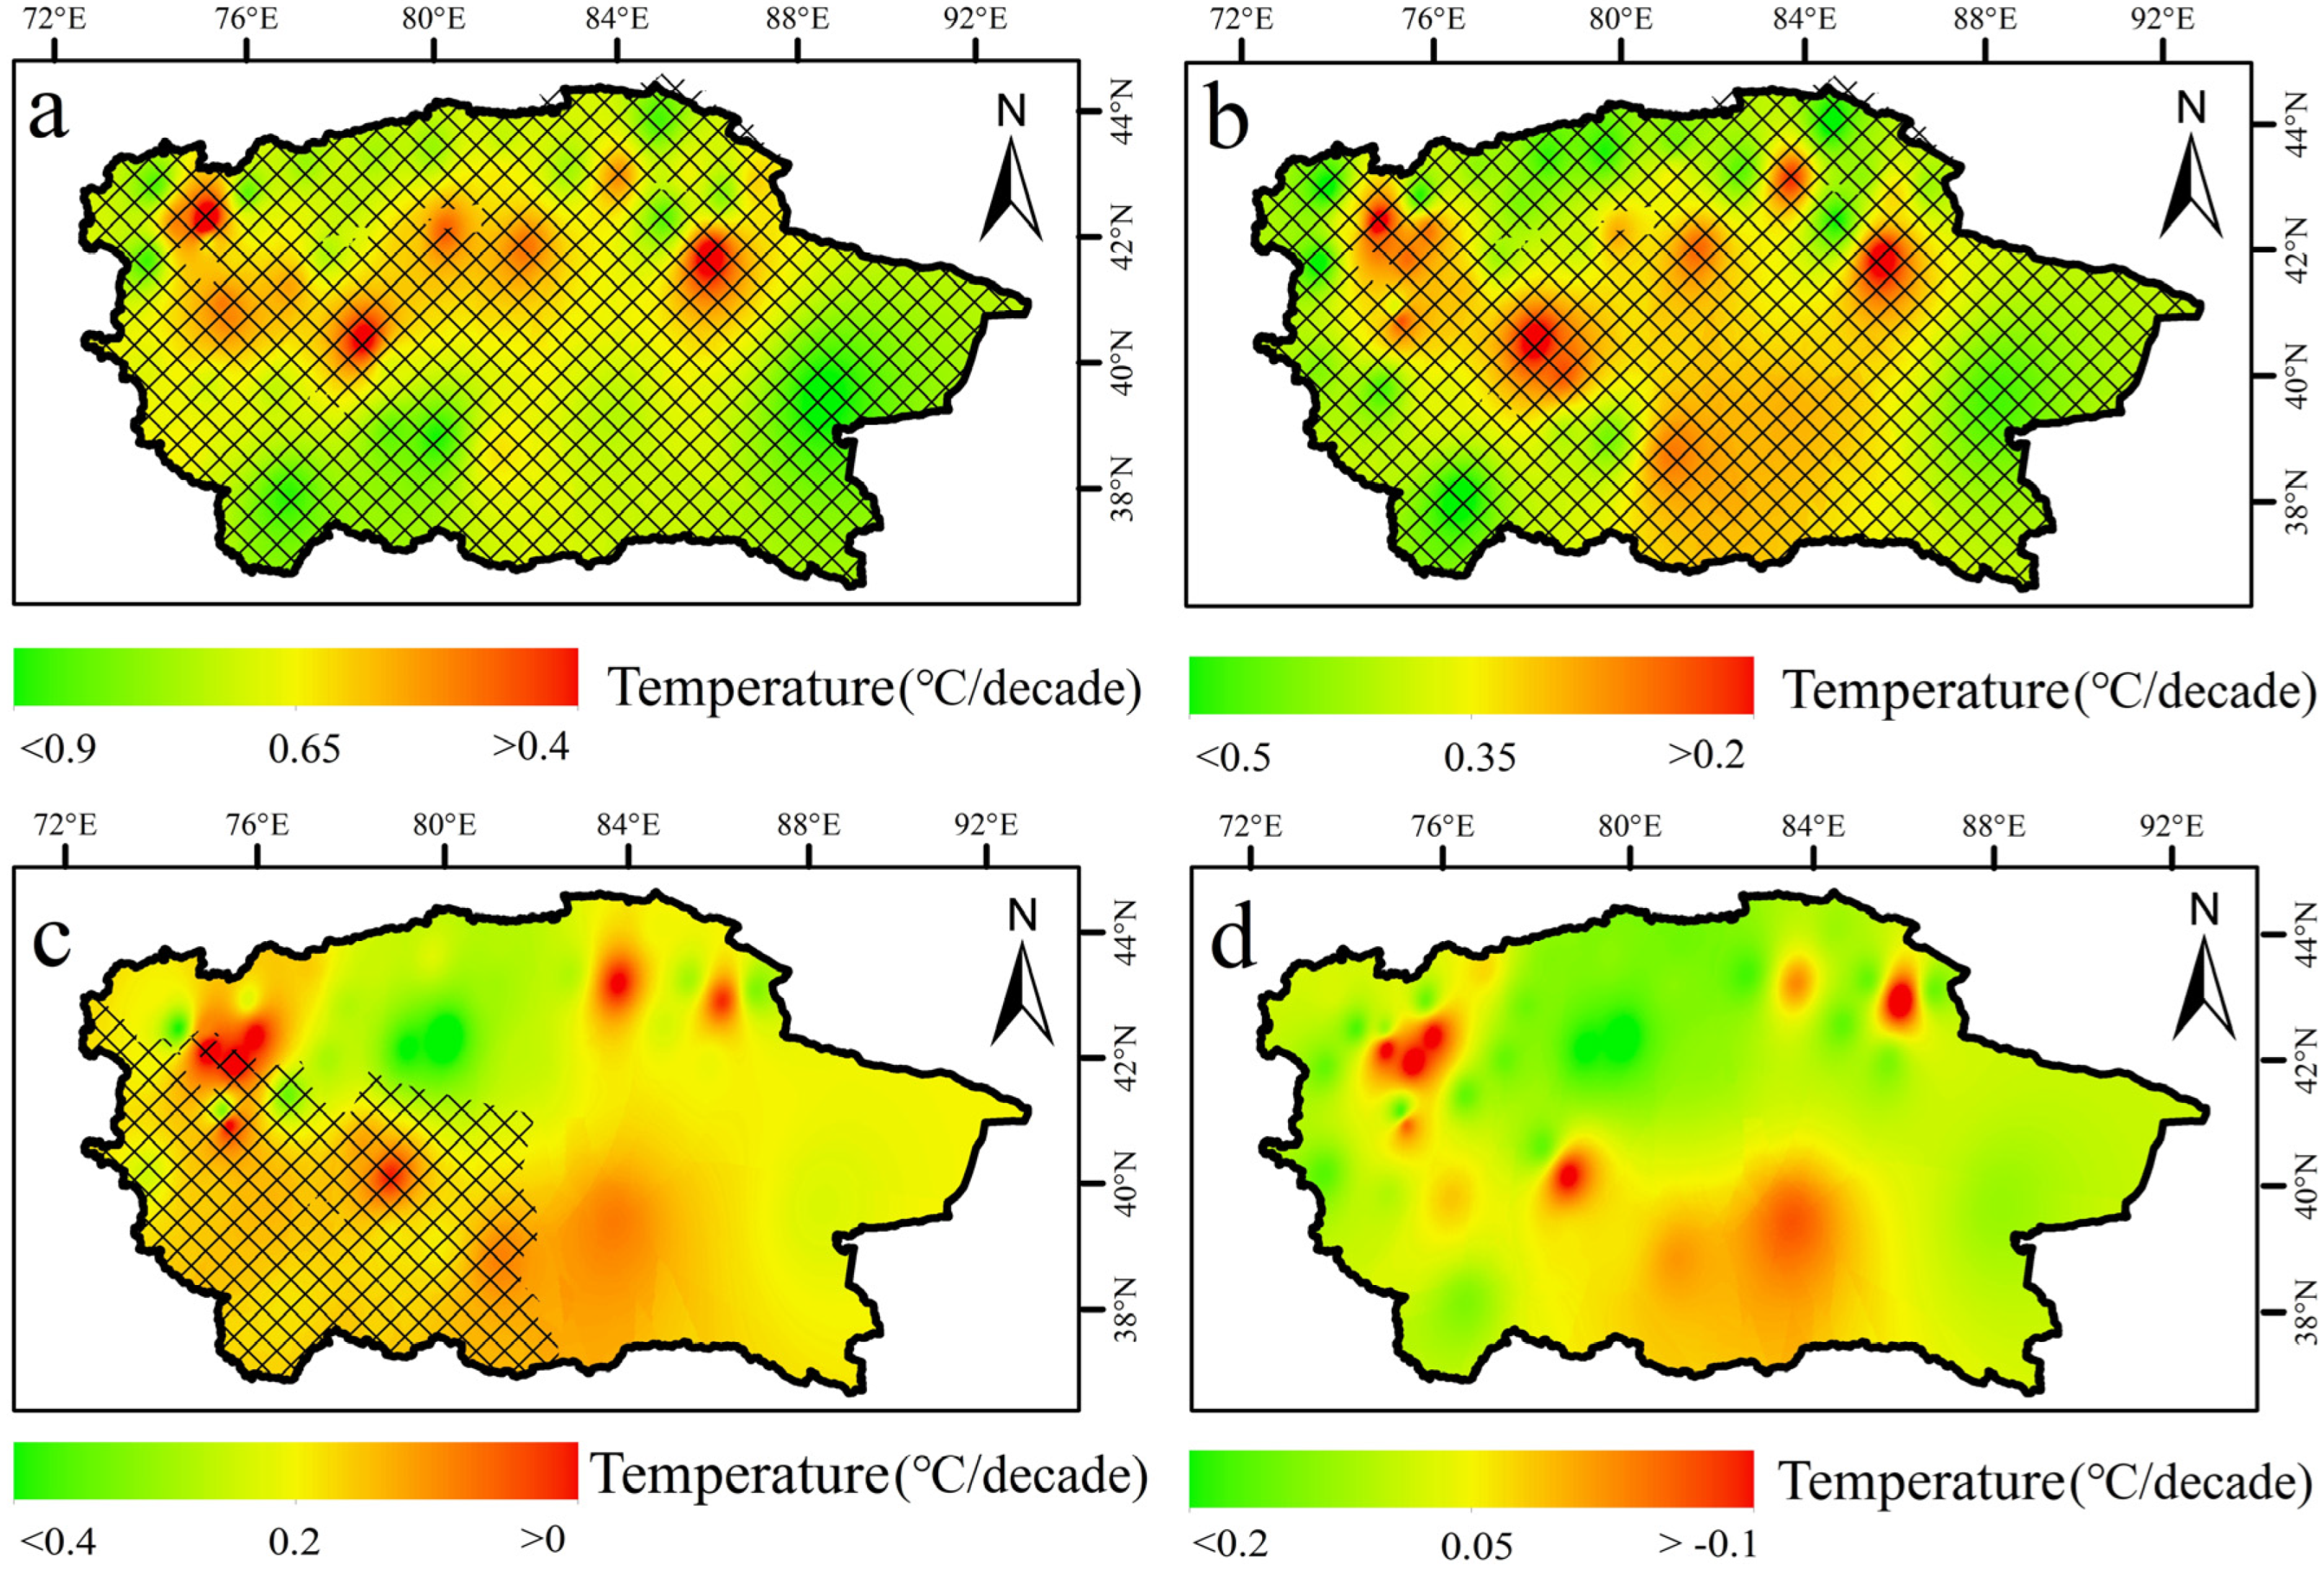
3.2. Spatial Characteristics of Climate Change in the Tarim Basin

The warming and wetting rates of the Tarim Basin are calculated based on the rate of change of the climate, and spatial interpolation (inverse distance weighting) is used to analyze the spatial distribution of climate trends for each season in the Tarim Basin [27,28]. The results in Figure 4 show that the warming trend occurred in most regions of the Tarim Basin for all seasons; the warming amplitude around the basin is greater than that in the central area of the basin. In spring, the temperature increased in the Tarim Basin by 0.827 °C/decade, which was the fastest of all seasons. In winter, the temperature increased in the Tarim Basin by −0.088 °C/decade, which was the slowest of all seasons. The rate of change in precipitation in the Tarim Basin depends on the season and location, with significant increases in some areas and significant decreases in others. The regional rate of change in rainfall in spring is like that in autumn. Precipitation increased significantly in the southeastern parts of the basin, with the highest rate of change in precipitation being 5.062 mm/decade. The regional rate of change of precipitation in the summer varied the most, decreasing from the northwest part of the basin to the southeastern parts of the basin. The maximum rate of change was 6.965 mm/decade. The regional rate of change in precipitation varied the least in winter, reaching −2.319 mm/decade.

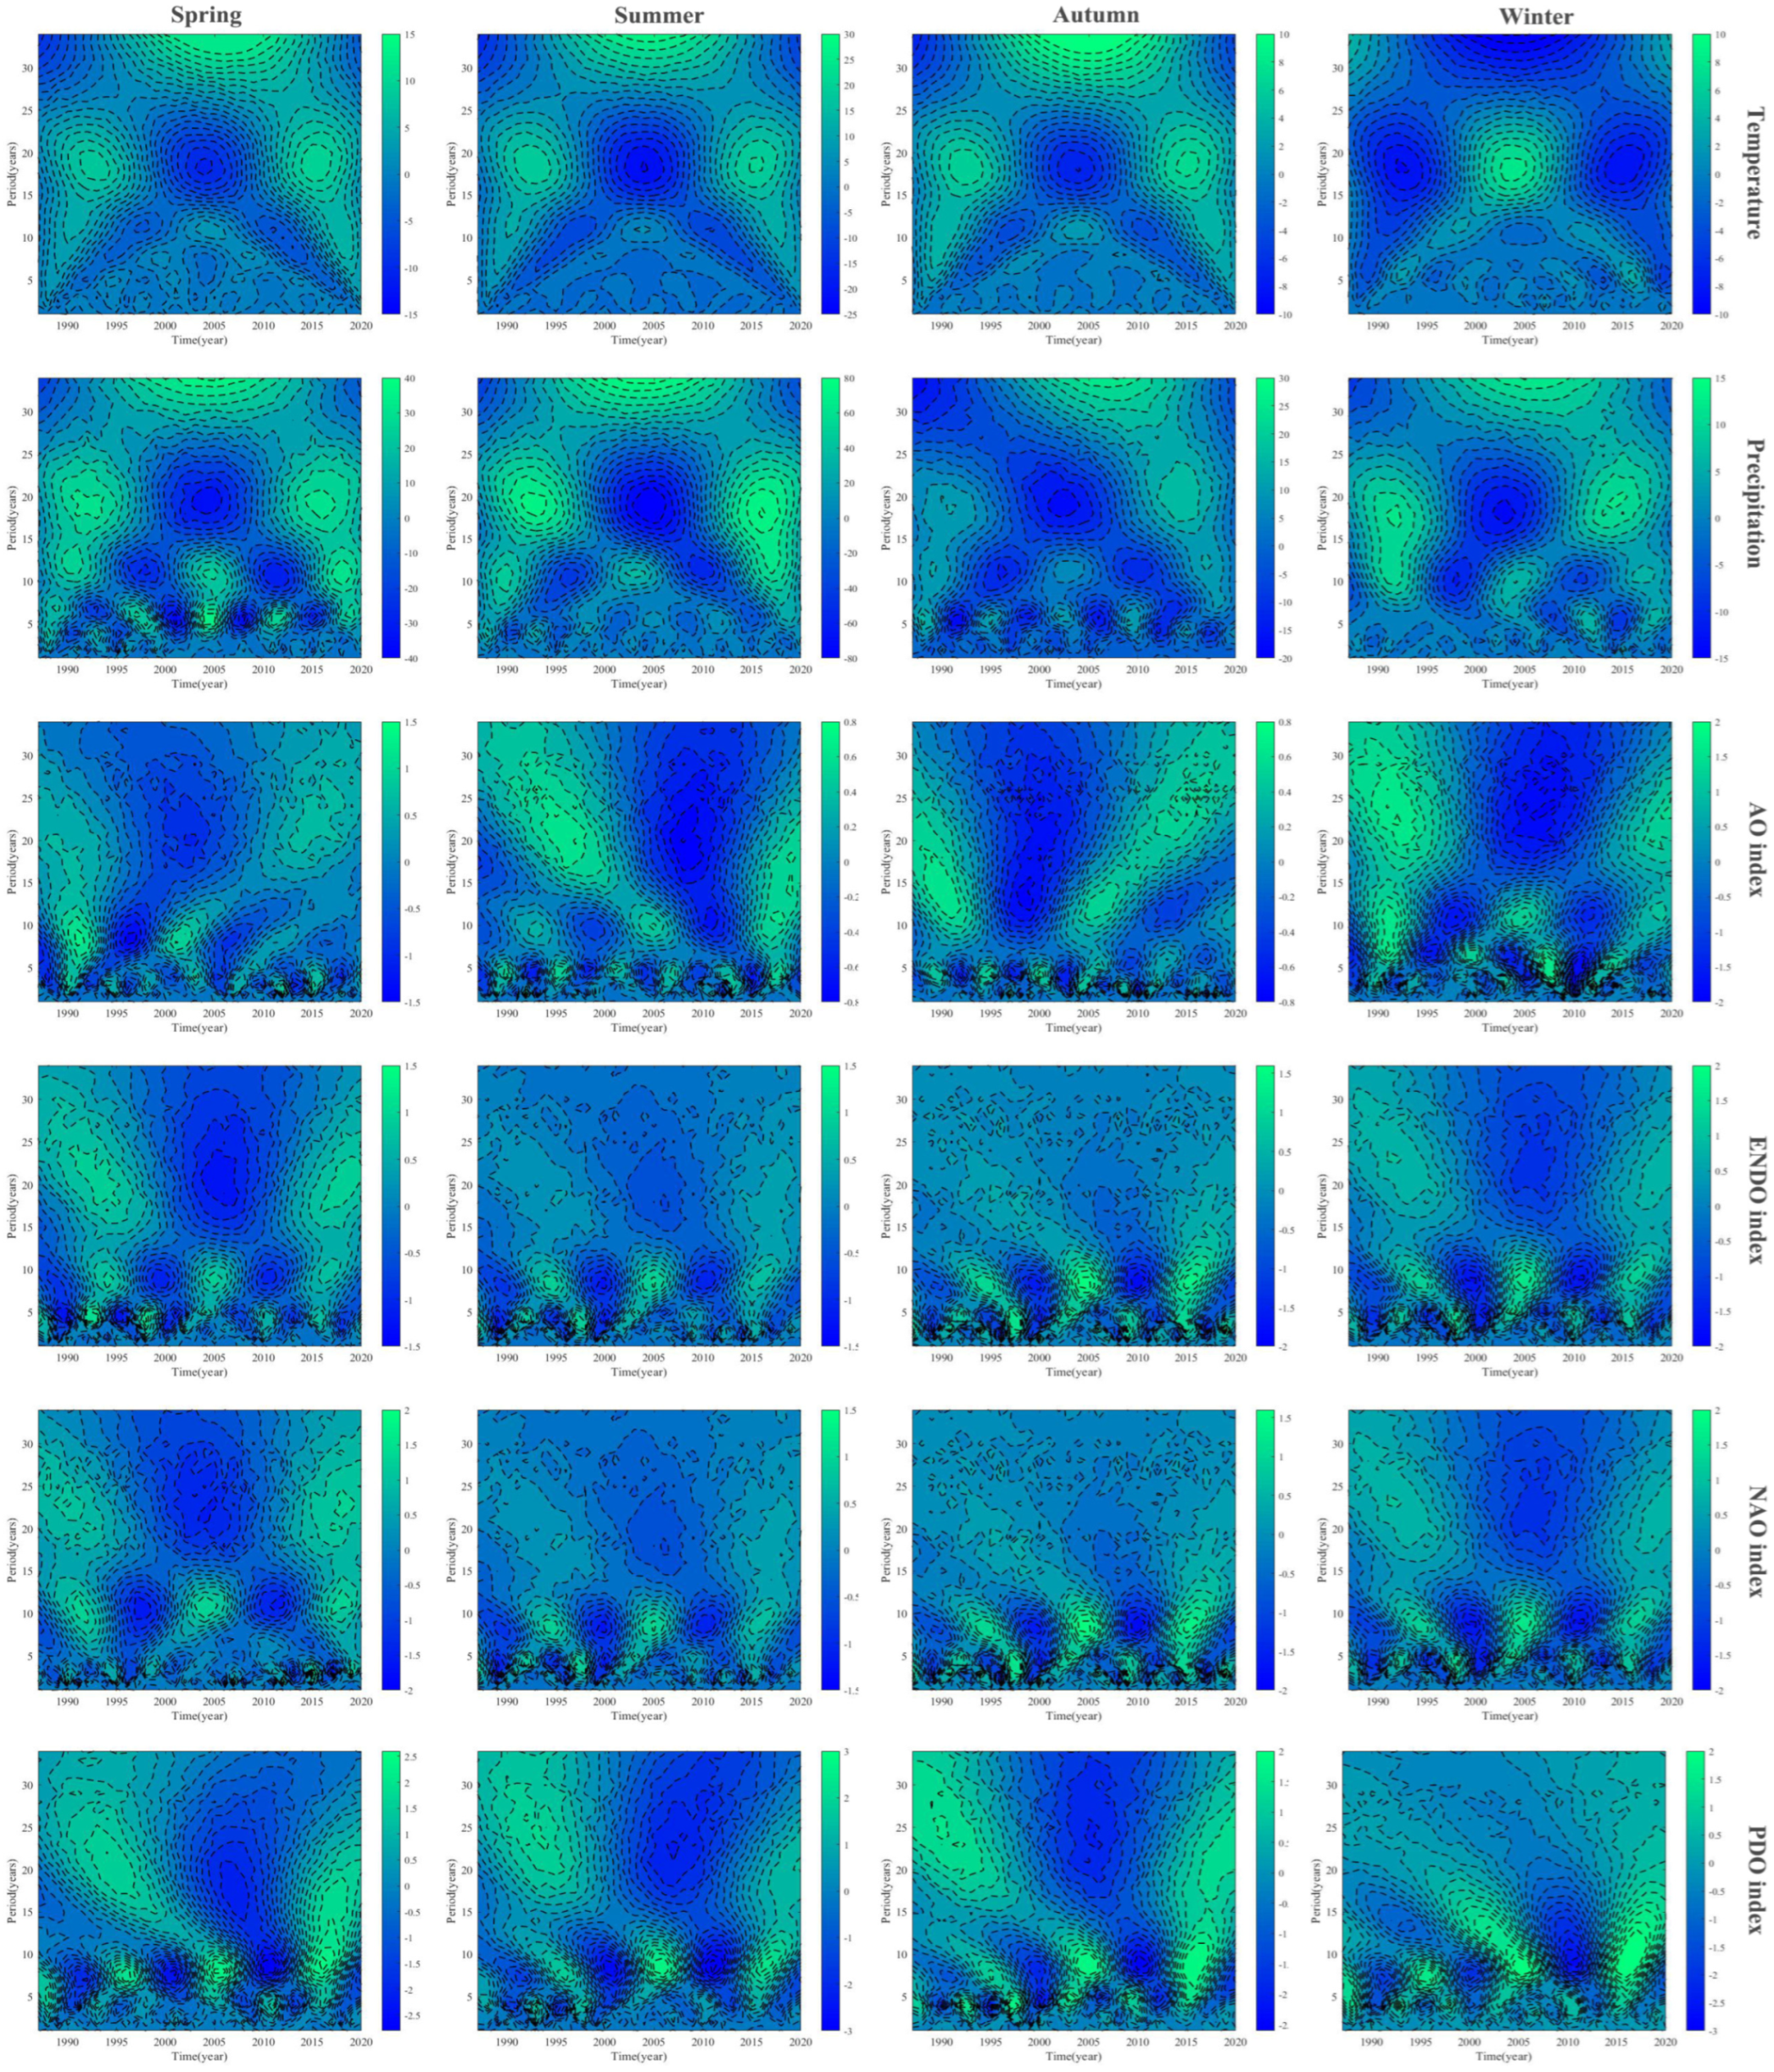
3.3. Climate Change and Atmospheric Circulation in the Tarim Basin

On the interannual scale, the wavelet analysis of climate change shows that the warming and wetting phenomena in the Tarim Basin are related to atmospheric circulation (Figure 3). The results of this paper are consistent with those of Wu et al. and Lv et al. at multiple scales. However, the spatial evolution of teleconnection between warm and humid phenomena is not clear from seasonal atmospheric circulation. For this reason, we use the monthly circulation indexes (AO index, ENSO index, NAO index, and PDO index) that describe the atmospheric circulation from 1987 to 2020 to calculate the seasonal data and determine if seasonal temperature and precipitation are correlated with these indexes in the Tarim Basin. There is a remote correlation between the seasonal temperature and the atmospheric circulation in Section 3.3.1 and a remote correlation between the seasonal precipitation and the atmospheric circulation in Section 3.3.2.

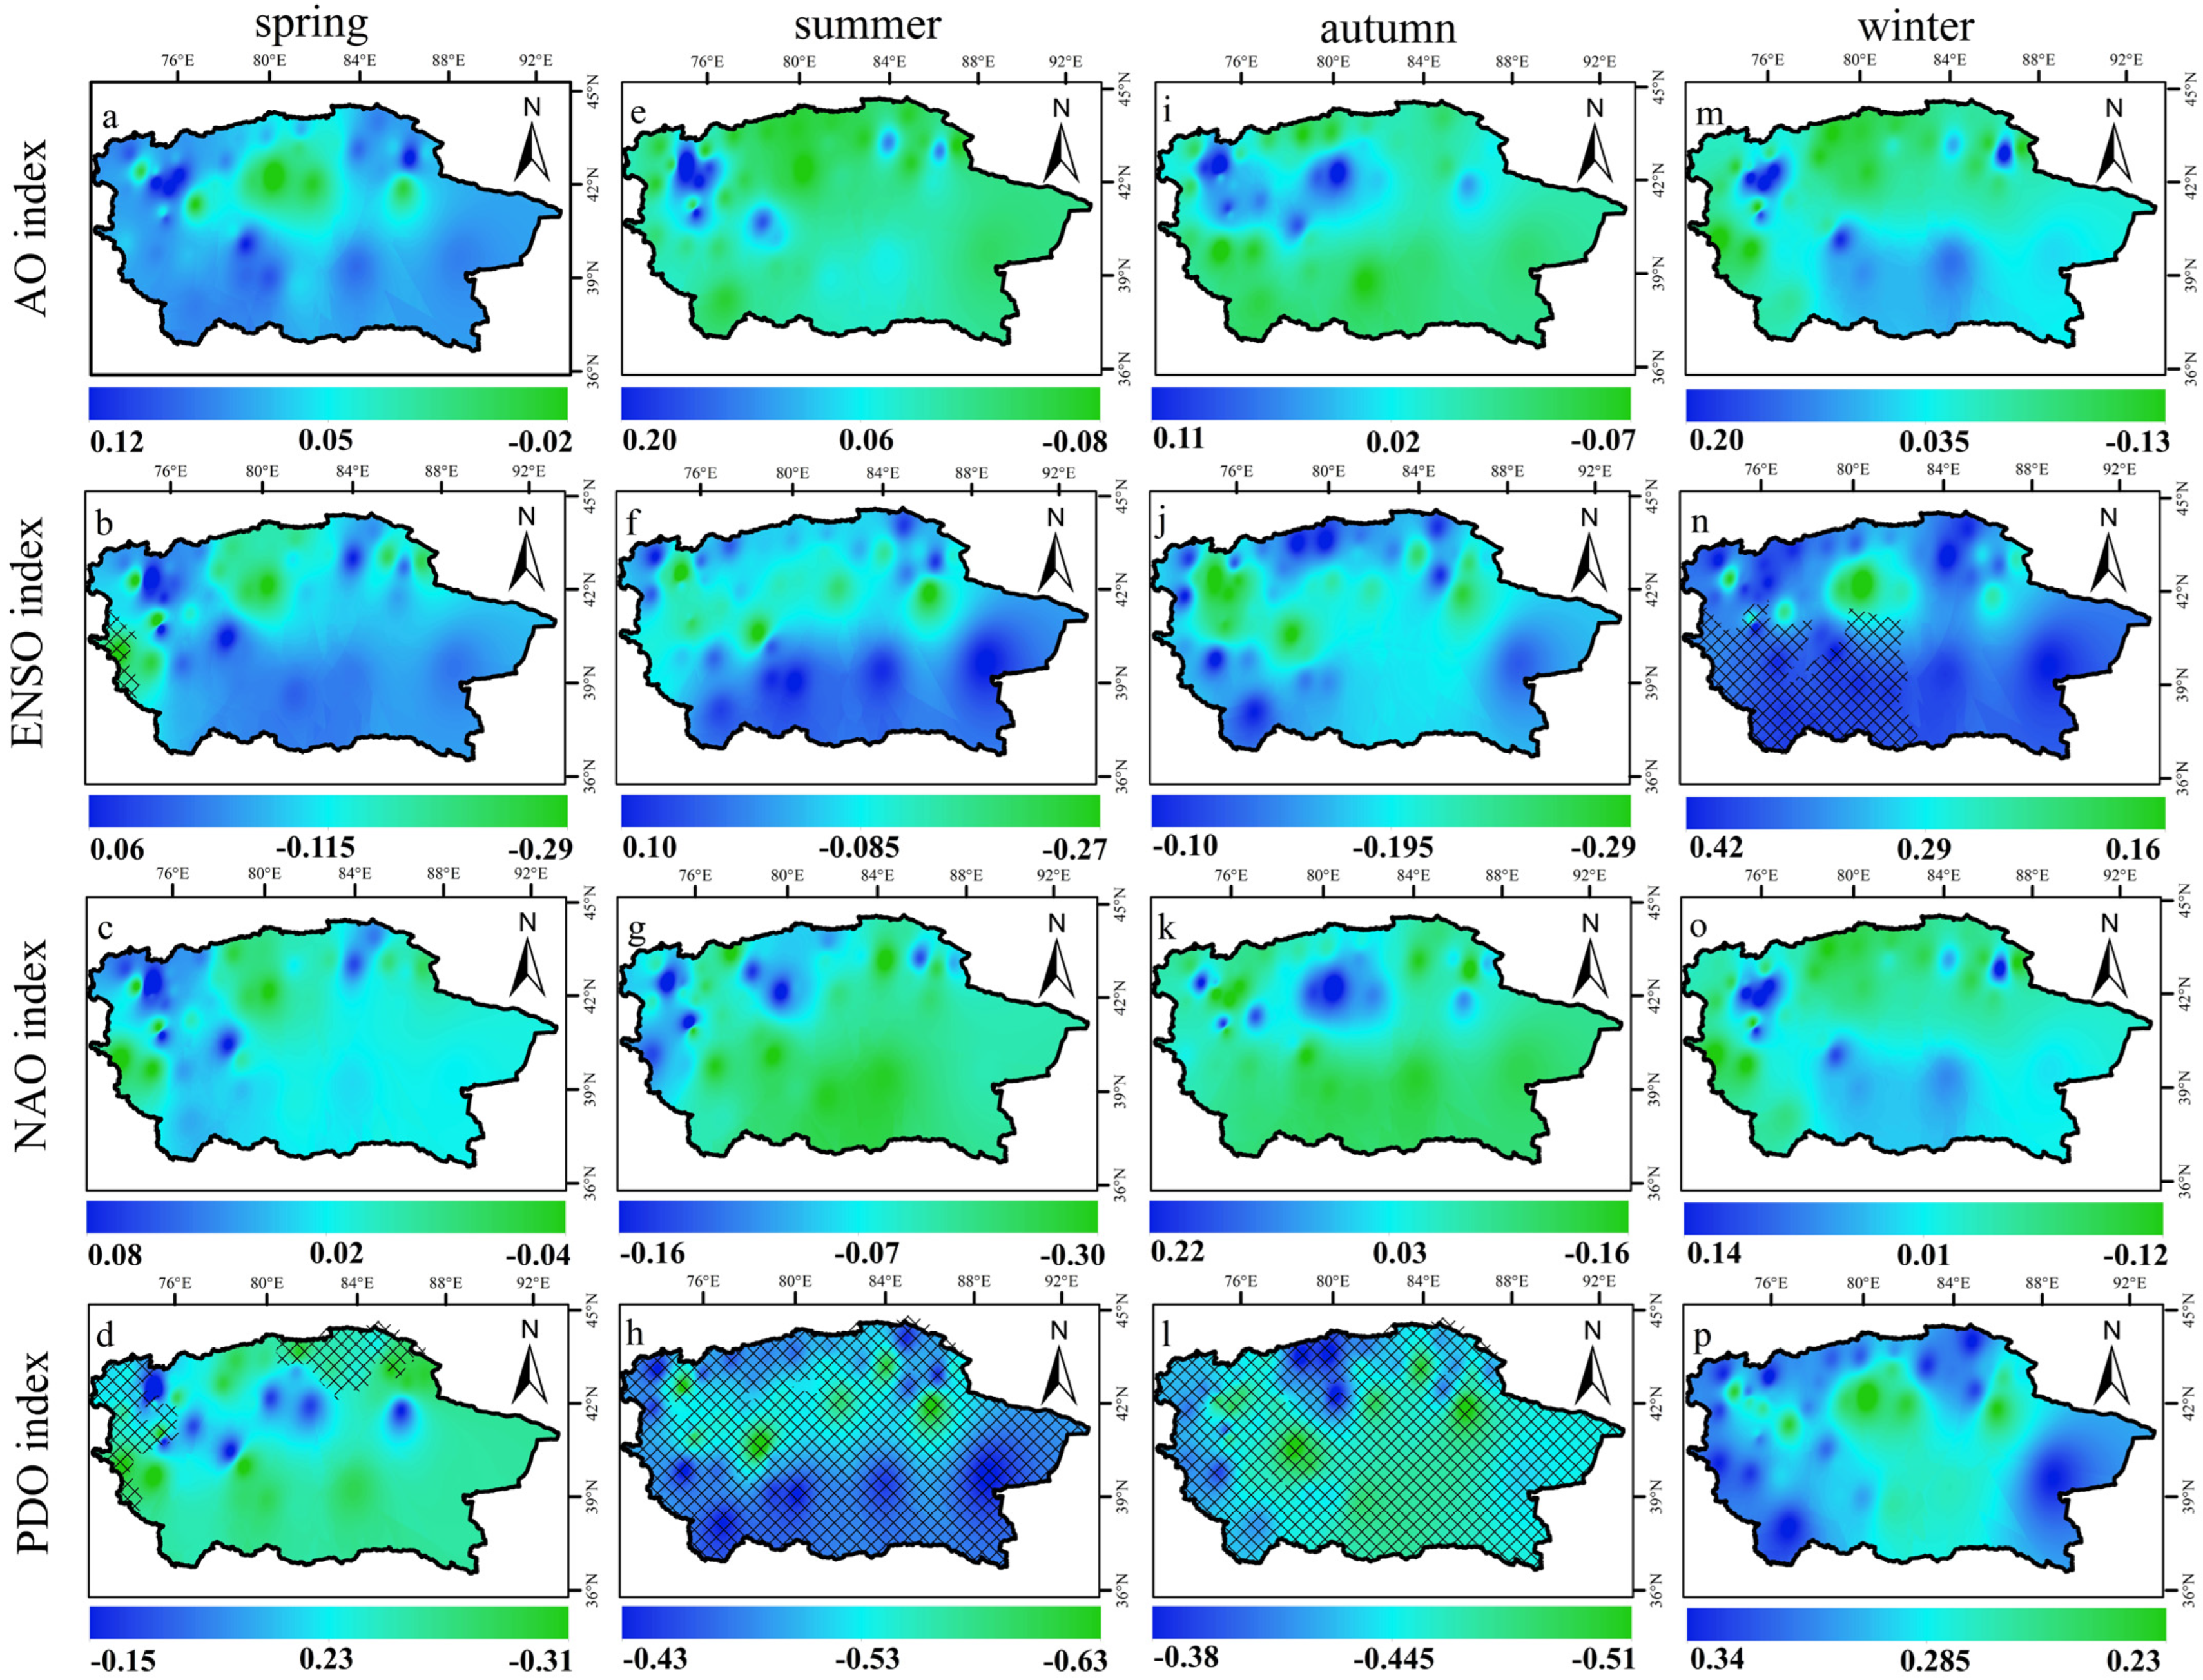
3.3.1. The Seasonal Temperature and Atmospheric Circulation in the Tarim Basin

In most Tarim Basin regions, seasonal temperature and atmospheric circulation indexes are relatively low (α = 0.05) as shown in Figure 5. In spring, the PDO and ENSO indices showed a significant negative correlation with the temperature in some regions. In the summer (autumn), the PDO index had a significant negative correlation with Tarim Basin temperature, whereas the other indexes had no statistical significance. In winter, there is a significant positive correlation between the ENSO index and the southwest Tarim Basin. The results in Figure 5 show that the climate change in the Tarim Basin during 1987–2020 is related to the change of atmospheric circulation. PDO is the leading factor of summer and autumn climate change in the Tarim Basin, and ENSO also plays an important role in spring and winter climate change.

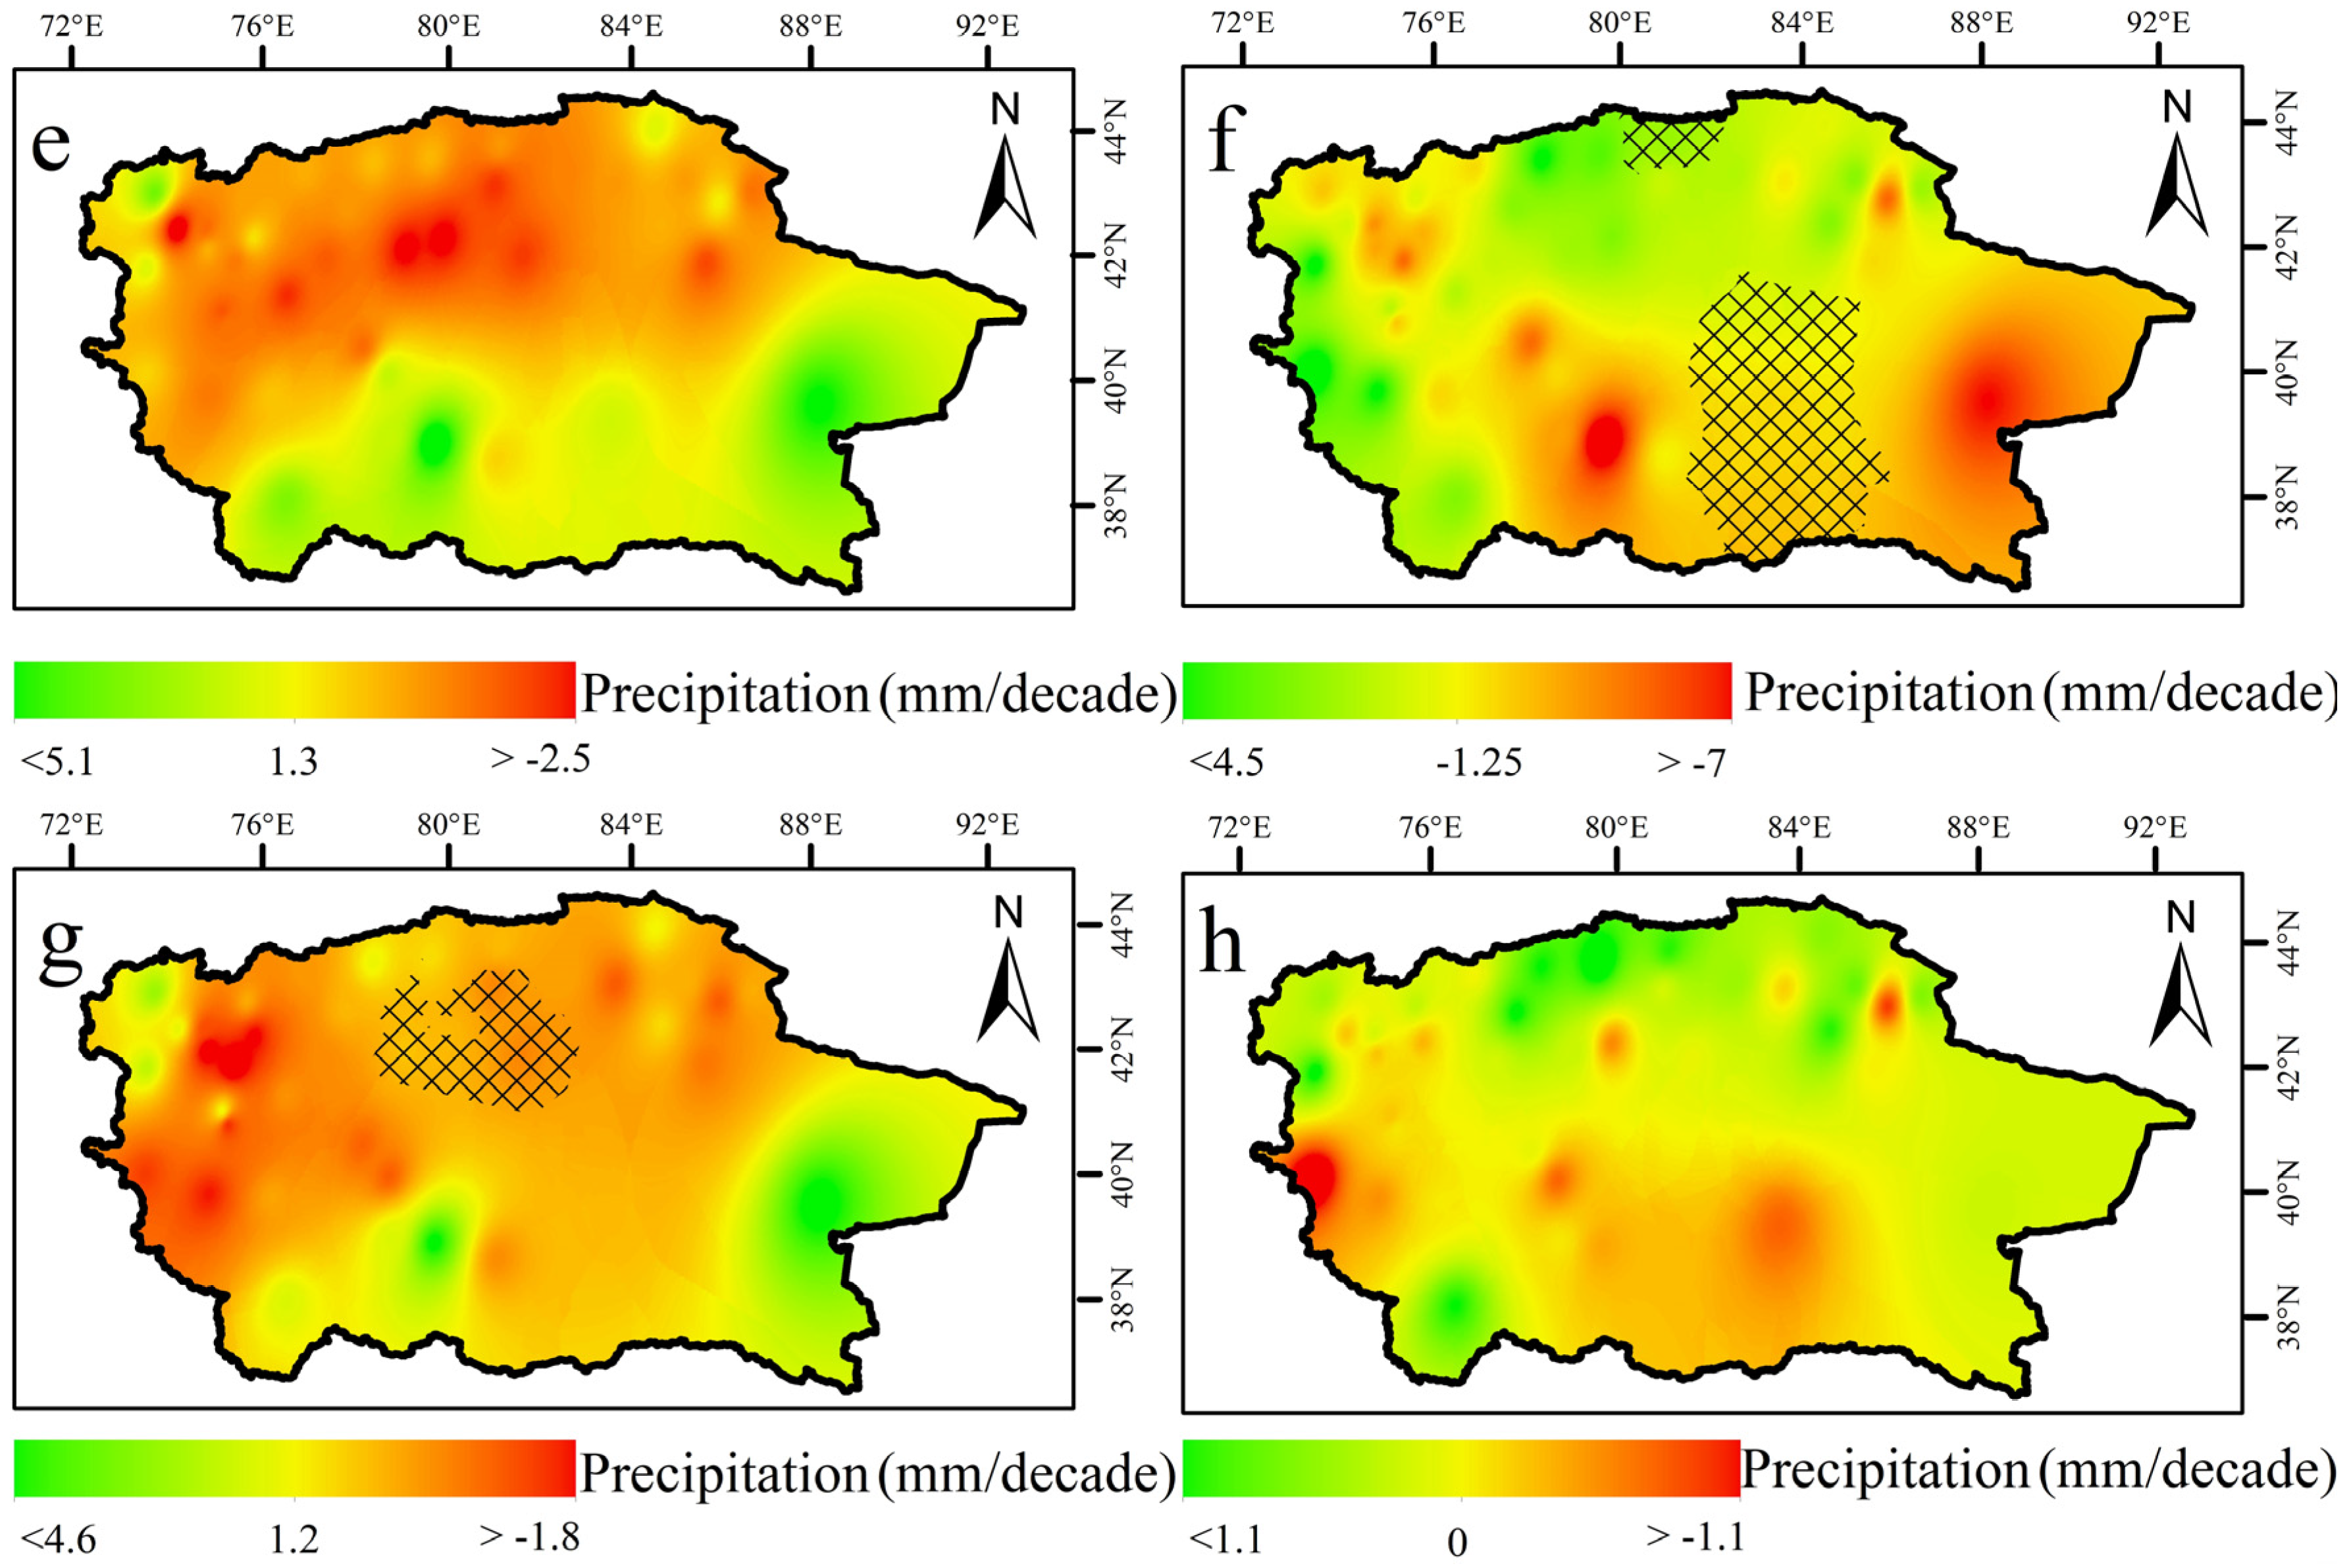
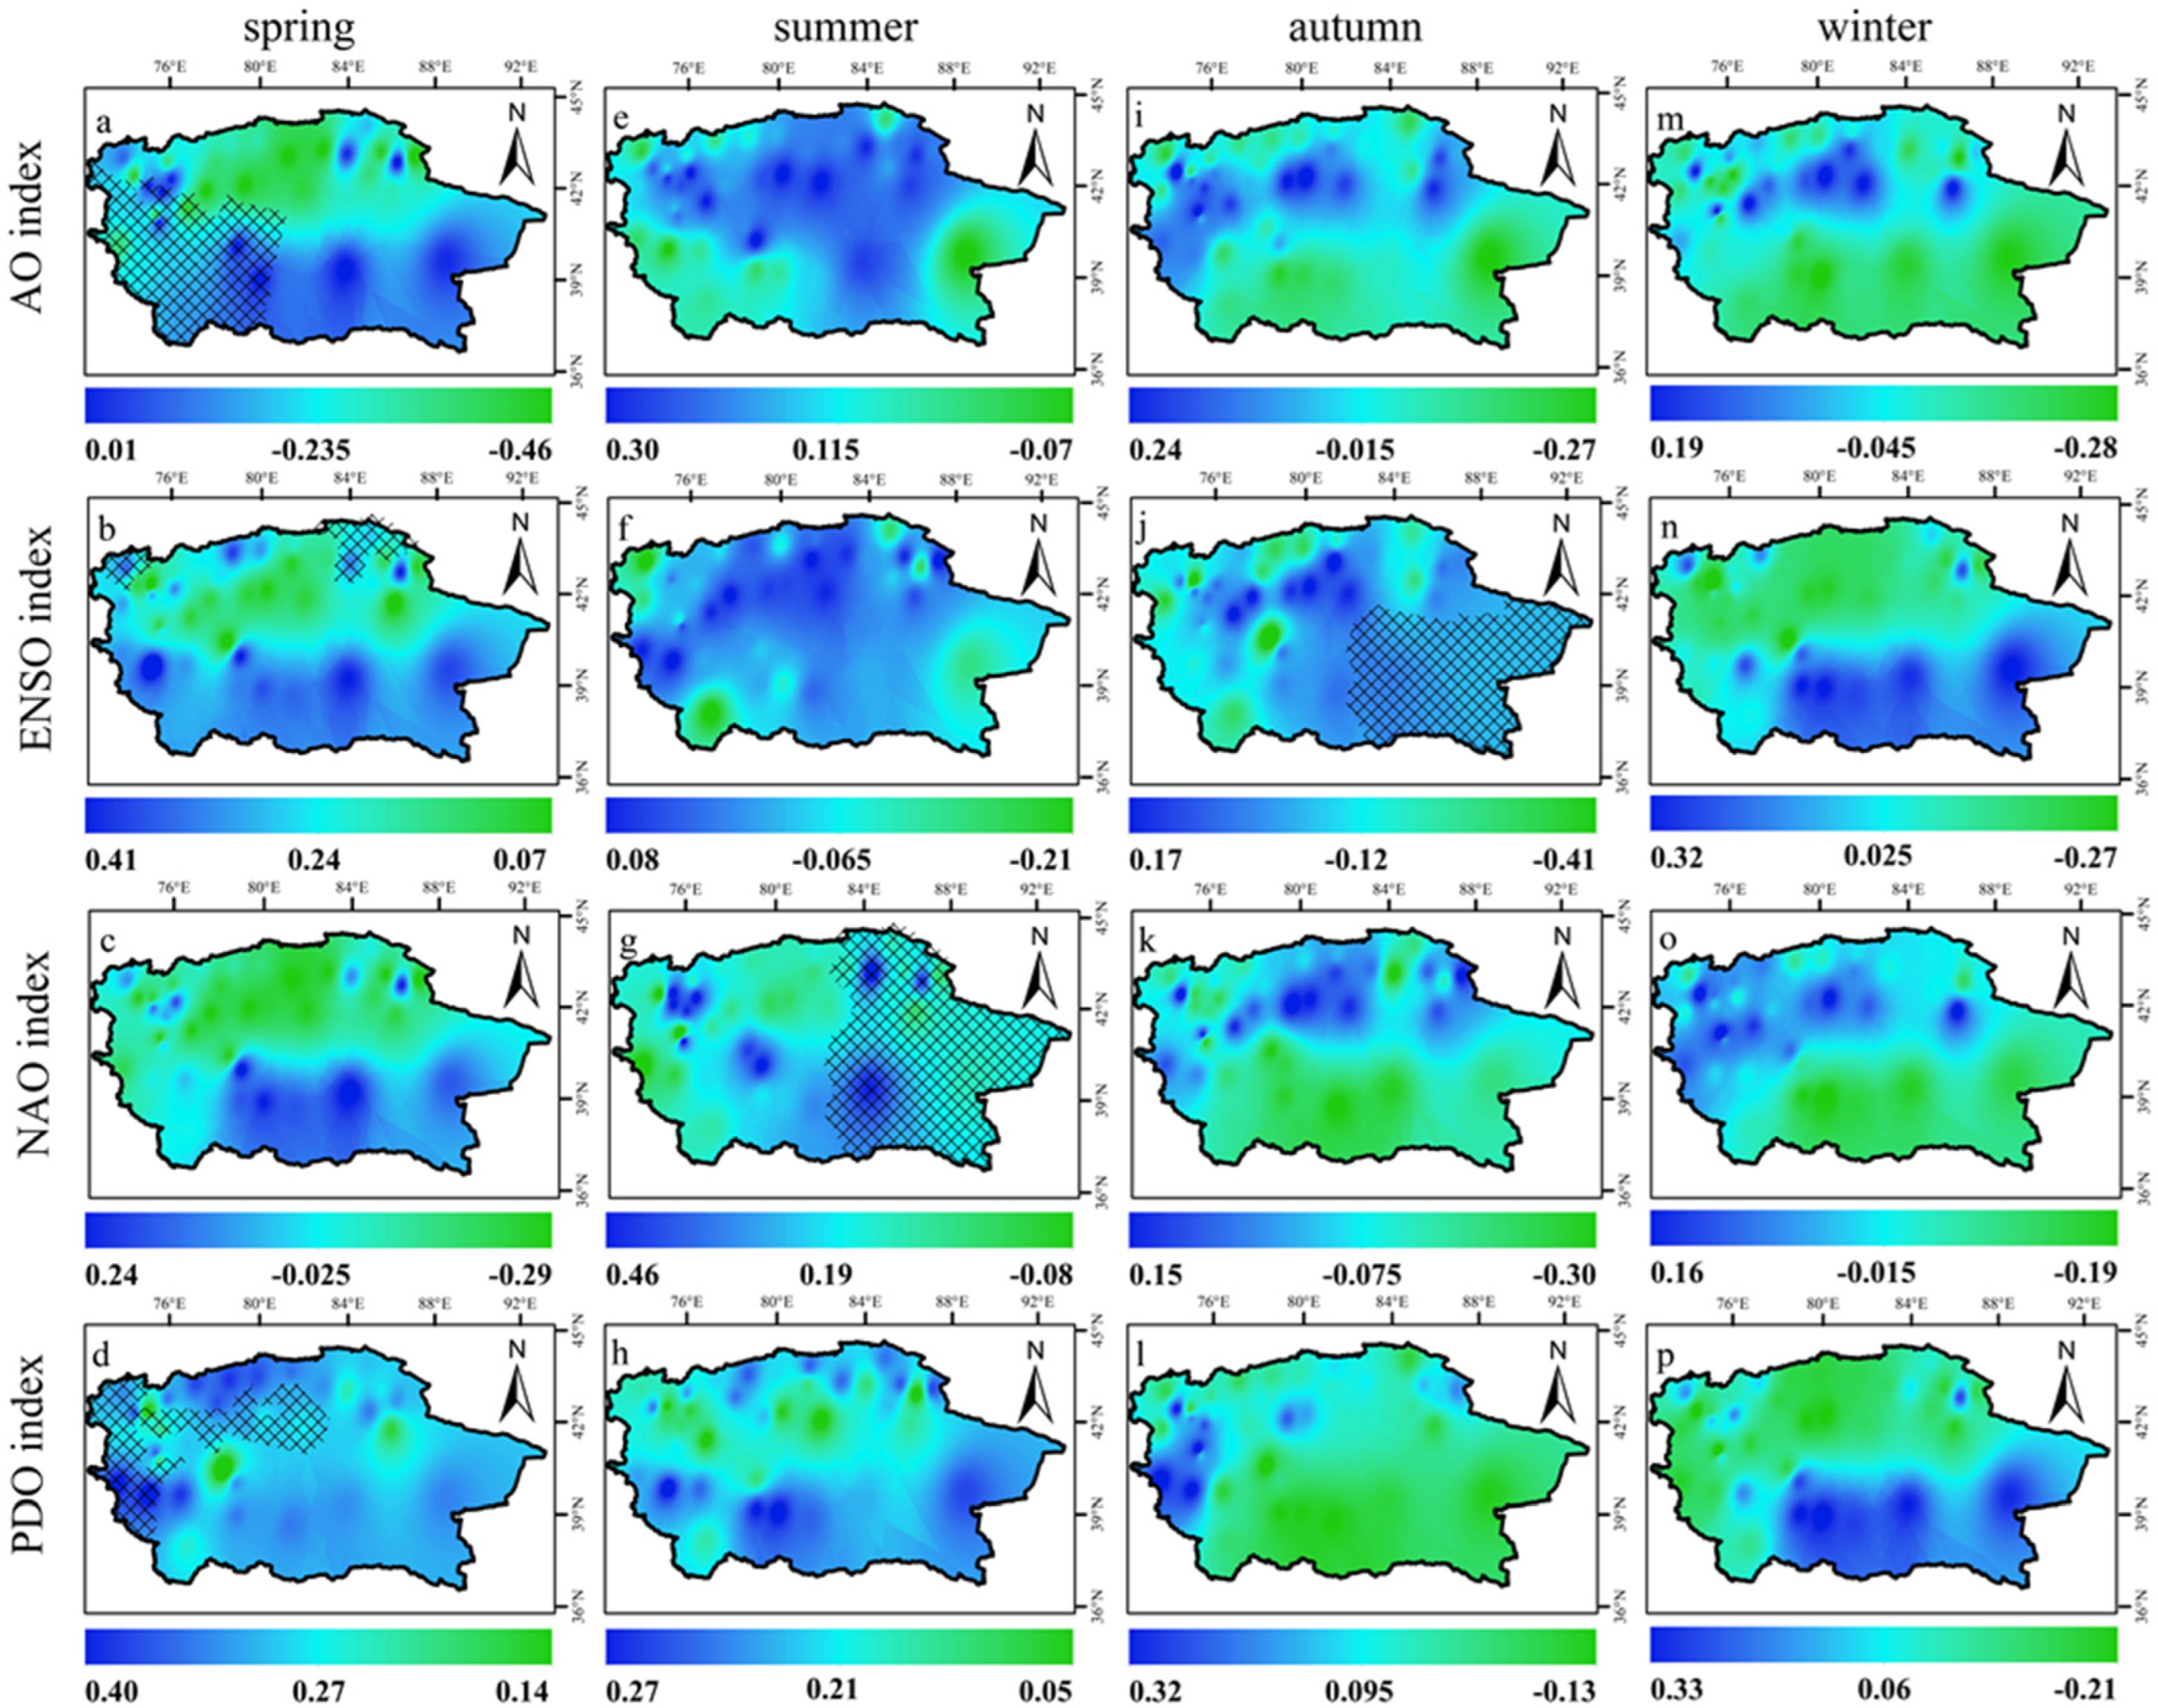
3.3.2. The Seasonal Precipitation and Atmospheric Circulation in the Tarim Basin

Seasonal precipitation and the corresponding atmospheric circulation indexes are relatively low (α = 0.05) in most regions of the Tarim Basin, as shown in Figure 6. In spring, the AO index showed a significant negative correlation with precipitation in some regions, while the ENSO index (PDO index) showed a significant positive correlation with precipitation in some regions. In summer, the NAO index showed a significant positive correlation with precipitation in eastern parts of the basin, while other atmospheric circulation indexes showed no statistical significance. In autumn, there is a significant positive correlation between the ENSO index and precipitation in the southeast Tarim Basin. In winter, the correlation between the atmospheric circulation index and precipitation in the Tarim Basin is not statistically significant. The results of Figure 6 show that the influence of atmospheric circulation on the teleconnection of the Tarim Basin is relatively small. In this paper, it is concluded that atmospheric circulation is not the main factor affecting precipitation in the Tarim Basin at a seasonal scale and that the main controlling factors of precipitation seasonal variation need to be explained in combination with other factors.

4. Discussion

The Tarim Basin has a typical continental desert climate and is in the extremely arid region of northwest China [20,21]. The Tarim Basin is the only inland basin in the arid region of northwest China and is of great significance for research into climate change, the ecological environment, and the social economy of the entire northwest region of China and even the entire arid region of Central Asia [6,7,8,36,37]. However, our current knowledge about the spatial distribution of the warming and wetting phenomena in the Tarim Basin on a seasonal timescale remains poor. Most studies of this phenomenon focus on the spatiotemporal evolution of water resources and drought in the Tarim Basin or analyze the spatial characteristics of climate change on a long-term scale in the arid region of northwest China [35,38,39].

4.1. Spatiotemporal Characteristics of Climate Change in the Tarim Basin

To elucidate the warming and wetting phenomenon that currently envelops the arid region of northwest China, we analyze here its seasonally specific spatial evolution in the Tarim Basin. The results show that the warming trend occurred in most regions of the Tarim Basin for all seasons; the warming amplitude around the basin is greater than that in the central area of the basin. At the same time, the wetting trend differs significantly between different zones of the region. These results are consistent with the climate of the Tarim Basin, namely, the significant seasonal differences in climate and the copious evaporation led to spatial variations in the wetting trend [11,12]. This indicates that the warming and wetting phenomenon in the arid Tarim Basin has not forced the spatiotemporal evolution of the climate on the seasonal scale to depart from the original climate type, which means that this phenomenon has not significantly changed the climate type of the Tarim Basin [13,40].
In this paper, the temporal and spatial characteristics of temperatures and precipitation on the seasonal scale are analyzed by statistical methods. The results show that the climate types in the Tarim Basin have not changed at the seasonal scale, and the climate changes in the Tarim Basin are still consistent with the original climate types. Based on previous research, we conclude that the warming and wetting phenomenon in the Tarim Basin is linked to global warming, extreme precipitation events, and seasonal agricultural activities. A key question now is: how long will the warming and wetting phenomena continue in the future? This is the reason why the climate type of the Tarim Basin will change in the future. Again, this is our next research topic.

4.2. Climate Evolution in the Tarim Basin: Effect of Atmospheric Circulation

A wavelet analysis shows that the periodic characteristics of climate in the Tarim Basin from 1987 to 2020 and atmospheric circulation are similar, which indicates that atmospheric circulation plays a role in generating the warming and wetting phenomena in the Tarim Basin. An analysis of the seasonal correlations between climate change and atmospheric circulation shows that PDO and ENSO are the main influencing factors of climate change in the Tarim Basin at different seasonal scales, while the teleconnection of AO and NAO is low. Among them, the PDO dominates the summer and autumn temperature changes in the Tarim Basin. However, the teleconnection effect of atmospheric circulation on precipitation in the Tarim Basin is relatively low. These results indicate that atmospheric circulation is not the only factor contributing to the warming and wetting phenomena in the Tarim Basin; internal variations in climate factors can also be important. The phenomenon may also be promoted by external stress factors other than atmospheric circulation [41,42].
Many studies have shown that atmospheric circulation is the dominant factor in climate change in northwest China [5,41,42]. However, due to the Tarim Basin’s uniqueness in comparison to northwest China, for example, it has the Tarim River system and the Taklimakan Desert. Therefore, the actual physical mechanism in the Tarim Basin is complicated. In future studies, many factors should be considered to analyze the seasonally specific spatiotemporal characteristics of the warming and wetting phenomena in the Tarim Basin [43,44].

5. Conclusions

The seasonally specific spatiotemporal variations of the Tarim Basin’s climate were studied using climate inclination rate, wavelet analysis, and correlation analysis, and the correlations (α = 0.05) between these climate indexes and atmospheric circulation were examined. The results lead to the following conclusions:
(1)
The Tarim Basin experienced a significant, seasonally specific warming and wetting phenomenon from 1987 to 2020. All areas of the Tarim Basin warmed significantly in all seasons over this period, whereas the precipitation differed significantly across the seasons. The climate of the basin and the atmospheric circulation both oscillated over a period of 17–20 years, which indicates that the atmospheric circulation is involved in the generation of the wetting phenomenon of the Tarim Basin. Moreover, the spatiotemporal evolution of climate change in the Tarim Basin still follows its original climate type, despite experiencing a warming and wetting phenomenon over the study period. Because the two indices of temperature and precipitation were studied by statistical methods in this paper, the research results are weak in explaining the mechanism. In future studies, we need to consider using different indicators (such as the Drought Index, Drought Frequency, and Normalized Difference Vegetation Index) to explore the characteristics of climate change in the Tarim Basin at the seasonal scale.
(2)
Seasonal temperature (precipitation) and the corresponding atmospheric circulation indexes are relatively low (α = 0.05) in most regions of the Tarim Basin. PDO is the leading factor of summer and autumn climate change in the Tarim Basin, and ENSO also plays an important role in spring and winter climate change. However, the teleconnection effect of atmospheric circulation on precipitation in the Tarim Basin is relatively low. The results show that atmospheric circulation is only one of the dominant factors contributing to the warm and wet phenomenon in the Tarim Basin. For example, extreme precipitation events may be the main cause of the wetting phenomenon in the Tarim Basin. Therefore, because the actual physical mechanism in the Tarim Basin is complicated, many internal factors need to be considered in future research.

Author Contributions

Conceptualization, T.L.; methodology, A.L. and T.L.; software, Y.L. and T.L.; validation, T.L. and Y.L.; formal analysis, A.L. and T.L.; investigation, T.L. and Y.L.; resources, A.L. and W.Z.; data curation, A.L., T.L. and W.Z.; writing—original draft preparation, T.L.; writing—review and editing, T.L. and A.L.; visualization, Y.L. and T.L.; supervision, W.Z.; project administration, A.L. and W.Z. All authors have read and agreed to the published version of the manuscript.

Funding

This research was supported by the Third Xinjiang Scientific Expedition and Research Program (2021xjkk0203).

Data Availability Statement

This study’s data is publicly available in this article.

Acknowledgments

We thank the editor and anonymous reviewers for their very helpful comments and suggestions for improving the quality of the article.

Conflicts of Interest

The authors declare no conflict of interest.

References

  1. Shi, Y.; Shen, Y.; Li, D.; Zhang, G.; Ding, Y.; Hu, R.; Kang, E. Discussion on the present climate change from warm-dry to warm wet in northwest China. Quat. Sci. 2003, 23, 152–164. [Google Scholar]
  2. Wu, P.; Ding, Y.; Liu, Y.; Li, X. The characteristics of moisture recycling and its impact on regional precipitation against the background of climate warming over Northwest China. Int. J. Climatol. 2019, 39, 5241–5255. [Google Scholar] [CrossRef]
  3. Wang, C.; Zhang, S.; Zhang, F.; Li, K.; Yang, K. On the increase of precipitation in the northwestern China under the global warming. Adv. Earth Sci. 2021, 36, 980–989. [Google Scholar]
  4. Lv, A.; Qu, B.; Jia, S.; Zhu, W. Influence of three phases of El Niño–Southern Oscillation on daily precipitation regimes in China. Hydrol. Earth Syst. Sci. 2019, 23, 883–896. [Google Scholar] [CrossRef] [Green Version]
  5. Yao, J.Q.; Li, M.Y.; Dilinuer, T.; Chen, J.; Mao, W. The assessment on “warming-wetting” trend in Xinjiang at multi-scale during 1961–2019. Arid Zone Res. 2022, 39, 333–346. [Google Scholar]
  6. Li, M.; Sun, H.Q.; Su, Z.C. Research progress in dry/wet climate variation in northwest China. Geogr. Res. 2021, 40, 1180–1194. [Google Scholar]
  7. Hou, Y.; Chen, Y.; Ding, J.; Li, Z.; Li, Y.; Sun, F. Ecological Impacts of Land Use Change in the Arid Tarim River Basin of China. Remote Sens. 2022, 14, 1894. [Google Scholar] [CrossRef]
  8. Bai, J.; Li, J.; Bao, A.; Chang, C. Spatial-temporal variations of ecological vulnerability in the Tarim River Basin, Northwest China. J. Arid Land 2021, 13, 814–834. [Google Scholar] [CrossRef]
  9. Wang, G.Y.; Wang, Y.J.; Gui, D.W. A review on water resources research in Tarim river basin. Arid Land Geogr. 2018, 41, 1151–1159. [Google Scholar]
  10. Ren, Q.; Long, A.H.; Yang, Y.M. Analysis on remote sensing monitoring of eco-environment variationof main stream basin of Tarim river in recent 20 years. Water Resour. Hydropower Eng. 2021, 52, 103–111. [Google Scholar]
  11. Liu, Q.; Liu, Y.; Niu, J.; Gui, D.; Hu, B.X. Prediction of the Irrigation Area Carrying Capacity in the Tarim River Basin under Climate Change. Agriculture 2022, 12, 657. [Google Scholar] [CrossRef]
  12. Li, H.; Wang, W.; Fu, J.; Chen, Z.; Ning, Z.; Liu, Y. Quantifying the relative contribution of climate variability and human activities impacts on baseflow dynamics in the Tarim River Basin, Northwest China. J. Hydrol. Reg. Stud. 2021, 36, 100853. [Google Scholar] [CrossRef]
  13. Han, Y.; Zhang, S.; Lv, A.F.; Zeng, H. Risk Assessment of Water Resources Carrying Capacity in China. JAWRA J. Am. Water Resour. Assoc. 2021, 57, 539–551. [Google Scholar] [CrossRef]
  14. Chen, Y.; Deng, H.; Li, B.; Li, Z.; Xu, C. Abrupt change of temperature and precipitation extremes in the arid region of Northwest China. Quat. Int. 2014, 336, 35–43. [Google Scholar] [CrossRef]
  15. Li, B.; Chen, Y.; Shi, X.; Chen, Z.; Li, W. Temperature and precipitation changes in different environments in the arid region of northwest China. Theor. Appl. Climatol. 2013, 112, 589–596. [Google Scholar] [CrossRef]
  16. Yang, H.; Xu, J.; Chen, Y.; Li, D.; Zuo, J.; Zhu, N.; Chen, Z. Has the Bosten Lake Basin been dry or wet during the climate transition in North -west China in the past 30 years? Theor. Appl. Climatol. 2020, 141, 627–644. [Google Scholar] [CrossRef]
  17. Zhang, Q.; Zhu, B.; Yang, J.; Ma, P.; Liu, X.; Lu, G.; Wang, Y.; Yu, H.; Liu, W.; Wang, D. New characteristics about the climate humidification trend in northwest China. Chin. Sci. Bull. 2021, 66, 3757–3771. [Google Scholar] [CrossRef]
  18. Gessner, U.; Naeimi, V.; Klein, I.; Kuenzer, C.; Klein, D.; Dech, S. The relationship between precipitation anomalies and satellite-derived vegetation activity in Central Asia. Glob. Planet. Change 2013, 110, 74–87. [Google Scholar] [CrossRef]
  19. Botne, O.; Fraedrich, K.; Zhu, X. Precipitation climate of Central Asia and the large-scale atmospheric circulation. Theor. Appl. Climatol. 2012, 108, 345–354. [Google Scholar]
  20. Jiang, J.; Zhou, T.; Chen, X.; Zhang, L. Future changes in precipitation over Central Asia based on CMIP6 projections. Environ. Res. Lett. 2020, 15, 054009. [Google Scholar] [CrossRef]
  21. Wang, H.; He, M.; Yan, W.; Ai, J.; Chu, J. Ecosystem vulnerability in the tianshan mountains and Tarim oasis based on remote sensed gross primary productivity. Acta Ecol. Sin. 2021, 41, 9729–9737. [Google Scholar]
  22. Fan, L.; Lv, A.F.; Zhang, W.X. Temporal-spatial variation characteristics of drought and its relationship with atmospheric circulation in qinghai province. J. Arid Land Resour. Environ. 2021, 35, 60–65. [Google Scholar]
  23. Ma, Z.G.; Fu, Z.B. The facts of global aridity in the second half of the 20th Century and its connection to the large-scale context. Sci. Sin. (Terrae) 2007, 37, 222–233. [Google Scholar]
  24. Guan, X.D.; Huang, J.P.; Guo, R.X. Changes in Aridity in Response to the Global Warming Hiatus. J. Meteorol. Res. 2017, 31, 117–125. [Google Scholar] [CrossRef]
  25. Zhou, H.; Shen, M.; Chen, J.; Xia, J.; Hong, S. Trends of natural runoffs in the Tarim river basin during the last 60 years. Arid. Land Geogr. 2018, 41, 221–229. [Google Scholar]
  26. Zhang, Y.L.; Chen, Y.N.; Yang, Y.H.; Hao, X.M. Analysis of historical change and future trends Tarim river. Arid Land Geography. 2016, 39, 582–589. [Google Scholar]
  27. Song, C.H. Research on adjusting effect for different mathe matical model of precipitation series. J. Appl. Meteorol. Sci. 1998, 9, 86–91. [Google Scholar]
  28. Li, X.Y.; Huang, S.P.; Ye, H.; Xiong, Y.Z.; Chen, F.; Wang, K.; Pan, L.Y. Comparison characteristics andinhomogeneity adjustments of mean, maximum and minimum surface air temperature for Xiamen meteorological station. Sci. Geogr. Sin. 2010, 30, 796–801. [Google Scholar]
  29. Zhu, J.J.; Zhang, C.Y.; Wang, W.; Li, C. Analysis of correlation between groundwater, air pressure and precipitation in plain areas of Hubei and Hunan province. Sci. Surv. Mapp. 2015, 40, 7–11. [Google Scholar]
  30. Li, Z.Q.; Wu, Y.X. Inverse Distance Weighted Interpolation Involving Position Shading. Acta Geod. Et Cartogr. Sin. 2015, 44, 91–98. [Google Scholar]
  31. Souza Echer, M.P.; Echer, E.; Nordemann, D.J.; Rigozo, N.R.; Prestes, A. Wavelet analysis of a centennial (1895–1994) southern Brazil rainfall series (Pelotas, 31°46′19″ S 52°20′33″ W). Clim. Chang. 2008, 87, 489–497. [Google Scholar] [CrossRef]
  32. Kumar, P. Foufoula-Georgiou, E. Wavelet analysis in geophysics: An introduction. Wavelets Geophys. 1994, 4, 1–43. [Google Scholar]
  33. Xu, J.H. Mathematical Methods in Modern Geography; Higher Education Press: Beijing, China, 1996. [Google Scholar]
  34. Huang, J.Y. Meteorological Statistical Analysis and Forecasting Methods; China Meteorological Press: Beijing, China, 2004; pp. 28–30. [Google Scholar]
  35. Zhang, W.; Bao, W.M.; Feng, X.Q.; Lu, J.L.; Luo, Q.F. Study on the change of meteorological elements in Tarim river basin in recent 50 years. Water Power 2020, 46, 28–34. [Google Scholar]
  36. Fu, A.H.; Chen, Y.N.; Li, W.H. Assessment on ecosystem health in the Tarim river basin. Acta Ecol. Sin. 2009, 29, 2418–2426. [Google Scholar]
  37. Kong, Z.J.; Deng, M.J.; Ling, H.B.; Wang, G.Y.; Xu, S.W.; Wang, Z.R. Ecological security assessment and ecological restoration countermeasures in the dry-uparea of the lower Tarim river. Arid Zone Res. 2021, 38, 1128–1139. [Google Scholar]
  38. Chen, Y.N.; Li, Z.; Fan, Y.T.; Wang, H.J.; Fang, G.H. Research progress on the impact of climate change on water resources in the arid region of northwest China. Acta Geogr. Sin. 2014, 69, 1295–1304. [Google Scholar]
  39. Wei, G.H.; Yang, P.; Zhou, H.Y.; Xia, J.; Chen, J.; Gui, D.W.; Bayindala. An analysis of the drought characteristics and driving factors of Tarim river basin based on downscaled terrestrial water storage from GRACE. China Rural Water Hydropower 2020, 7, 12–19. [Google Scholar]
  40. Tao, H.; Bai, Y.G.; Mao, W.Y. Observed and projected climate changes in Tarim river basin. J. Glaciol. Geocryol. 2011, 33, 738–743. [Google Scholar]
  41. Chen, L.; Wang, S.G.; Shang, K.Z.; Yang, D.B. Atmospheric circulation anomalies of large-scale extreme high temperature events in northwest China. J. Desert Res. 2011, 31, 1052–1058. [Google Scholar]
  42. Gao, M.; Yang, J.; Gong, D.; Shi, P.; Han, Z.; Kim, S.J. Footprints of Atlantic Multidecadal Oscillation in the Low-Frequency Variation of Extreme High Temperature in the Northern Hemisphere. J. Clim. 2019, 32, 791–802. [Google Scholar] [CrossRef]
  43. Liu, Y.; Wu, C.; Jia, R.; Huang, J. An overview of the influence of circulation on the climate in arid and semi-arid region of central and east asia. Sci. Sin. (Terrae) 2018, 48, 1141–1152. [Google Scholar] [CrossRef]
  44. Huang, J.; Guan, X.; Ji, F. Enhanced cold-season warming in semi-arid regions. Atmos. Chem. Phys. 2012, 12, 5391–5398. [Google Scholar] [CrossRef]
Figure 1. Location of the Tarim Basin.((a)—the location of the study area; (b)—the drainage systerm and elevation of Tarim Basin; (c)—distribution of meteorological stations in The Tarim Basin).
Atmosphere 14 00151 g001
Figure 2. Temporal characteristics of seasonal climate change in the Tarim Basin. Panels show the climate change in spring, summer, autumn, and winter, respectively.
Atmosphere 14 00151 g002
Figure 3. The wavelet transforms of climate change and atmospheric conditions in the Tarim Basin from 1987 to 2020 (Different factors of climate change and atmospheric circulation are listed on the horizontal and at different seasonal scales on the vertical).
Atmosphere 14 00151 g003
Figure 4. Spatial variations in seasonal climate change in the Tarim Basin. (ad) Temperature variations in spring, summer, autumn, and winter, respectively. (eh) Precipitation variations in spring, summer, autumn, and winter, respectively (The black grid indicates that the trends are statistically significant at the 0.05 level).
Atmosphere 14 00151 g004aAtmosphere 14 00151 g004b
Figure 5. Spatial distribution of the correlation between average annual temperature and atmospheric circulation in the Tarim Basin. Each column corresponds to a season, and each row corresponds to an atmospheric circulation index (the black bars on the grid indicate that the trends are statistically significant at the 0.05 level).
Atmosphere 14 00151 g005
Figure 6. Spatial distribution of correlation between annual precipitation and atmospheric circulation in the Tarim Basin. Each column in the figure corresponds to a season, and each row corresponds to an atmospheric circulation index (The black grid indicate that the trends are statistically significant at the 0.05 level).
Atmosphere 14 00151 g006
Disclaimer/Publisher’s Note: The statements, opinions and data contained in all publications are solely those of the individual author(s) and contributor(s) and not of MDPI and/or the editor(s). MDPI and/or the editor(s) disclaim responsibility for any injury to people or property resulting from any ideas, methods, instructions or products referred to in the content.

