Article

Drought Vulnerability Assessment of Winter Wheat Using an Improved Entropy–Comprehensive Fuzzy Evaluation Method: A Case Study of Henan Province in China

School of Surveying and Engineering Information, Henan Polytechnic University (HPU), Jiaozuo 454003, China
*
Author to whom correspondence should be addressed.
Atmosphere 2023, 14(5), 779; https://doi.org/10.3390/atmos14050779
Submission received: 22 March 2023 / Revised: 23 April 2023 / Accepted: 24 April 2023 / Published: 25 April 2023

Abstract

:
The percentage precipitation anomaly was used to index the effect of drought on winter wheat grown in Henan Province for the years 2011–2020. Of interest was the effect of drought on winter wheat yield and the accurate assessment of the damage done to winter wheat by drought events in order to improve the risk management of winter wheat in the context of drought hazards. The spatial and temporal variability of winter wheat drought risk in Henan Province was determined by analysis of climate data, winter wheat yield, cultivated area, and socio-economic data across three dimensions: exposure or susceptibility to drought, economic–environmental sensitivity to drought, and capacity to resist drought. A drought vulnerability assessment model, based on the entropy value method and a comprehensive fuzzy evaluation, was developed to assess the drought vulnerability of winter wheat in Henan Province compared with the percentage precipitation anomaly model. (1) There were significant spatial differences in the frequency of the five drought categories devised. (2) Areas in which there was a high frequency of mild drought events were mainly in northern and western Henan and southwestern Henan, with the frequency ranging from 17% to 29%. (3) Areas in which there was a high frequency of moderate drought events were mainly in northwestern, central, and southeastern Henan. (4) Areas in which there was a high frequency of severe and extreme drought were mainly in Anyang in northern Henan, Zhengzhou in central Henan, and Xinyang and surrounding areas in southern Henan, with the frequency ranging from 7% to 9.70%. (5) Winter wheat drought vulnerability shows an overall annually increasing trend. The susceptibility dimension had the greatest influence of the three dimensions, followed by economic–environmental sensitivity and then drought resistance, which had the least impact. The model created in this study shows the influence of drought on winter wheat production more intuitively than a conventional fuzzy synthesis, and the results can inform decision-making in winter wheat drought risk assessment and management.

1. Introduction

Droughts are characterized by their duration, frequency of occurrence, and the area affected. The Sixth Assessment Report of the IPCC states that the frequent occurrence of extreme heat and precipitation events, in the context of global warming, has led to more complexity in the factors that influence the occurrence of droughts, and that these events have increased the frequency and intensity of droughts. In China, drought events have jeopardized economic development and agricultural production. Agricultural drought is one of the main problems faced by agricultural production in China, and studying its vulnerability is the premise of scientific responses. As a major agricultural province, winter wheat production in Henan Province is of great importance to national agricultural production.
Winter wheat is grown in Henan Province in the north China plain region. Winter wheat production in the area accounts for about 25% of national wheat production, and the region is the main grain-producing area in China [1]. Spring droughts occur in the northern part of Henan Province 30–40% of the time, and early summer droughts occur 40–50% of the time; in the most severe drought years, 70% of the province is affected by drought [2]. The delineation of drought vulnerability zones, the scientific management of drought preparation and response, and the mitigation of drought risks, together with pressure on food producers to increase yields and improve quality, are important national issues.
Agricultural droughts result from the interaction of agricultural activities with natural events, with the outcome being insufficient water available for plants and animals [3,4]. Research into agricultural drought and those vulnerable to it began in the 1990s. Two major perspectives have emerged, assessment of the vulnerability of farmers to drought at a micro-scale and assessment of regional agricultural drought vulnerability from a macro perspective. For example, Li et al. [5] analyzed the relationship between drought vulnerability and farmer behavioral response at the micro-scale using questionnaire data from farmers in the North China Plain. Brant et al. [6] analyzed the relationship between household factors and drought sensitivity among farmers in Brazil. Savari et al. [7] investigated the drought vulnerability of farmers in southeastern Iran using a mathematical model developed by Me-Bar and Valdez [8] that identified five dimensions of vulnerability (economic, socio-cultural, psychological, technological environment, and infrastructure). Cheng [9] assessed agricultural drought vulnerability in Xiaogan City, Hubei Province using a fuzzy analytical hierarchy process with empirical data from a sample of farmers and created an agricultural drought index insurance model. Xie et al. [10] used weighted composite scoring of several factors to identify relationships between different farm household livelihoods and quantify societal vulnerability to drought.
Examples of the macro perspective on regional agricultural drought vulnerability include the following. Pei et al. [11] used data envelopment analysis to examine changes in agricultural drought vulnerability in China over the past 40 years. Wang et al. [12] selected 32 indicators, including ecological recharge, grain yield in the summer harvest, water-saving irrigation machinery, and dry field area, to draw a graded vulnerability zone map using principal component analysis. Li et al. [13] used game theory combined with the weighting of 10 indicators to calculate their values for five administrative regions in Guanzhong, Shaanxi Province, and quantified the contribution of each indicator to agricultural drought vulnerability. Pei [14] determined the footprint of the water cycle in Heilongjiang Province and quantified agricultural drought risk zones using an improved standardized precipitation–evapotranspiration index (SPEI). Zarei et al. [15], based on the relationship between the percent annual yield loss (AYL) of winter wheat (Triticum sativum) and three commonly used drought indices, i.e., the standardized precipitation evapotranspiration index (SPEI), reconnaissance drought index (RDI), and standardized precipitation index (SPI), evaluated the accuracy of these indices at 1-, 3-, 6-, and 12-month time scales. Based on natural disaster risk theory, Jia et al. [16] established a drought disaster risk assessment model for winter wheat in Gansu Province and carried out risk zoning for winter wheat in Gansu Province. Yan et al. [17] discussed the spatial and temporal distribution characteristics of winter wheat drought using the Z index and analyzed the effects of meteorological drought on winter wheat yield in Henan Province.
At present, researchers have various understandings of the concepts of drought and drought vulnerability. There are no standard indicators that can be selected to match the actual climate conditions in a study area, nor are there standards for creating a set of indicators or interpreting drought indicators [18,19,20,21,22,23,24,25]. Most current research that includes the evaluation and interpretation of drought indicators uses conventional weighted synthesis methods [26,27]. However, drought is not constrained by the hard boundaries of administrative divisions, and classifications of drought are necessarily arbitrary or fuzzy, and a practical assessment of drought vulnerability must recognize this. The assessment of drought vulnerability has been developed and refined in ongoing research, but it is a work in progress.
We take an approach based on the concept that agricultural drought affects a human–land system and examine winter wheat farming at the scale of municipal administrative units in Henan Province. We selected fifteen indicators that cover three dimensions of agricultural drought: exposure, sensitivity, and resistance. The indicators were grouped into three classes of risk factors: susceptibility, or degree of exposure, to drought in the drought-affected area; economic sensitivity to drought in the area; and drought resistance in the area. An overall drought vulnerability model for winter wheat in Henan Province was created using comprehensive fuzzy evaluation, and categories of drought were established and quantified to describe the overall drought vulnerability of winter wheat in Henan Province.

2. Overview of the Study Area and Data Sources

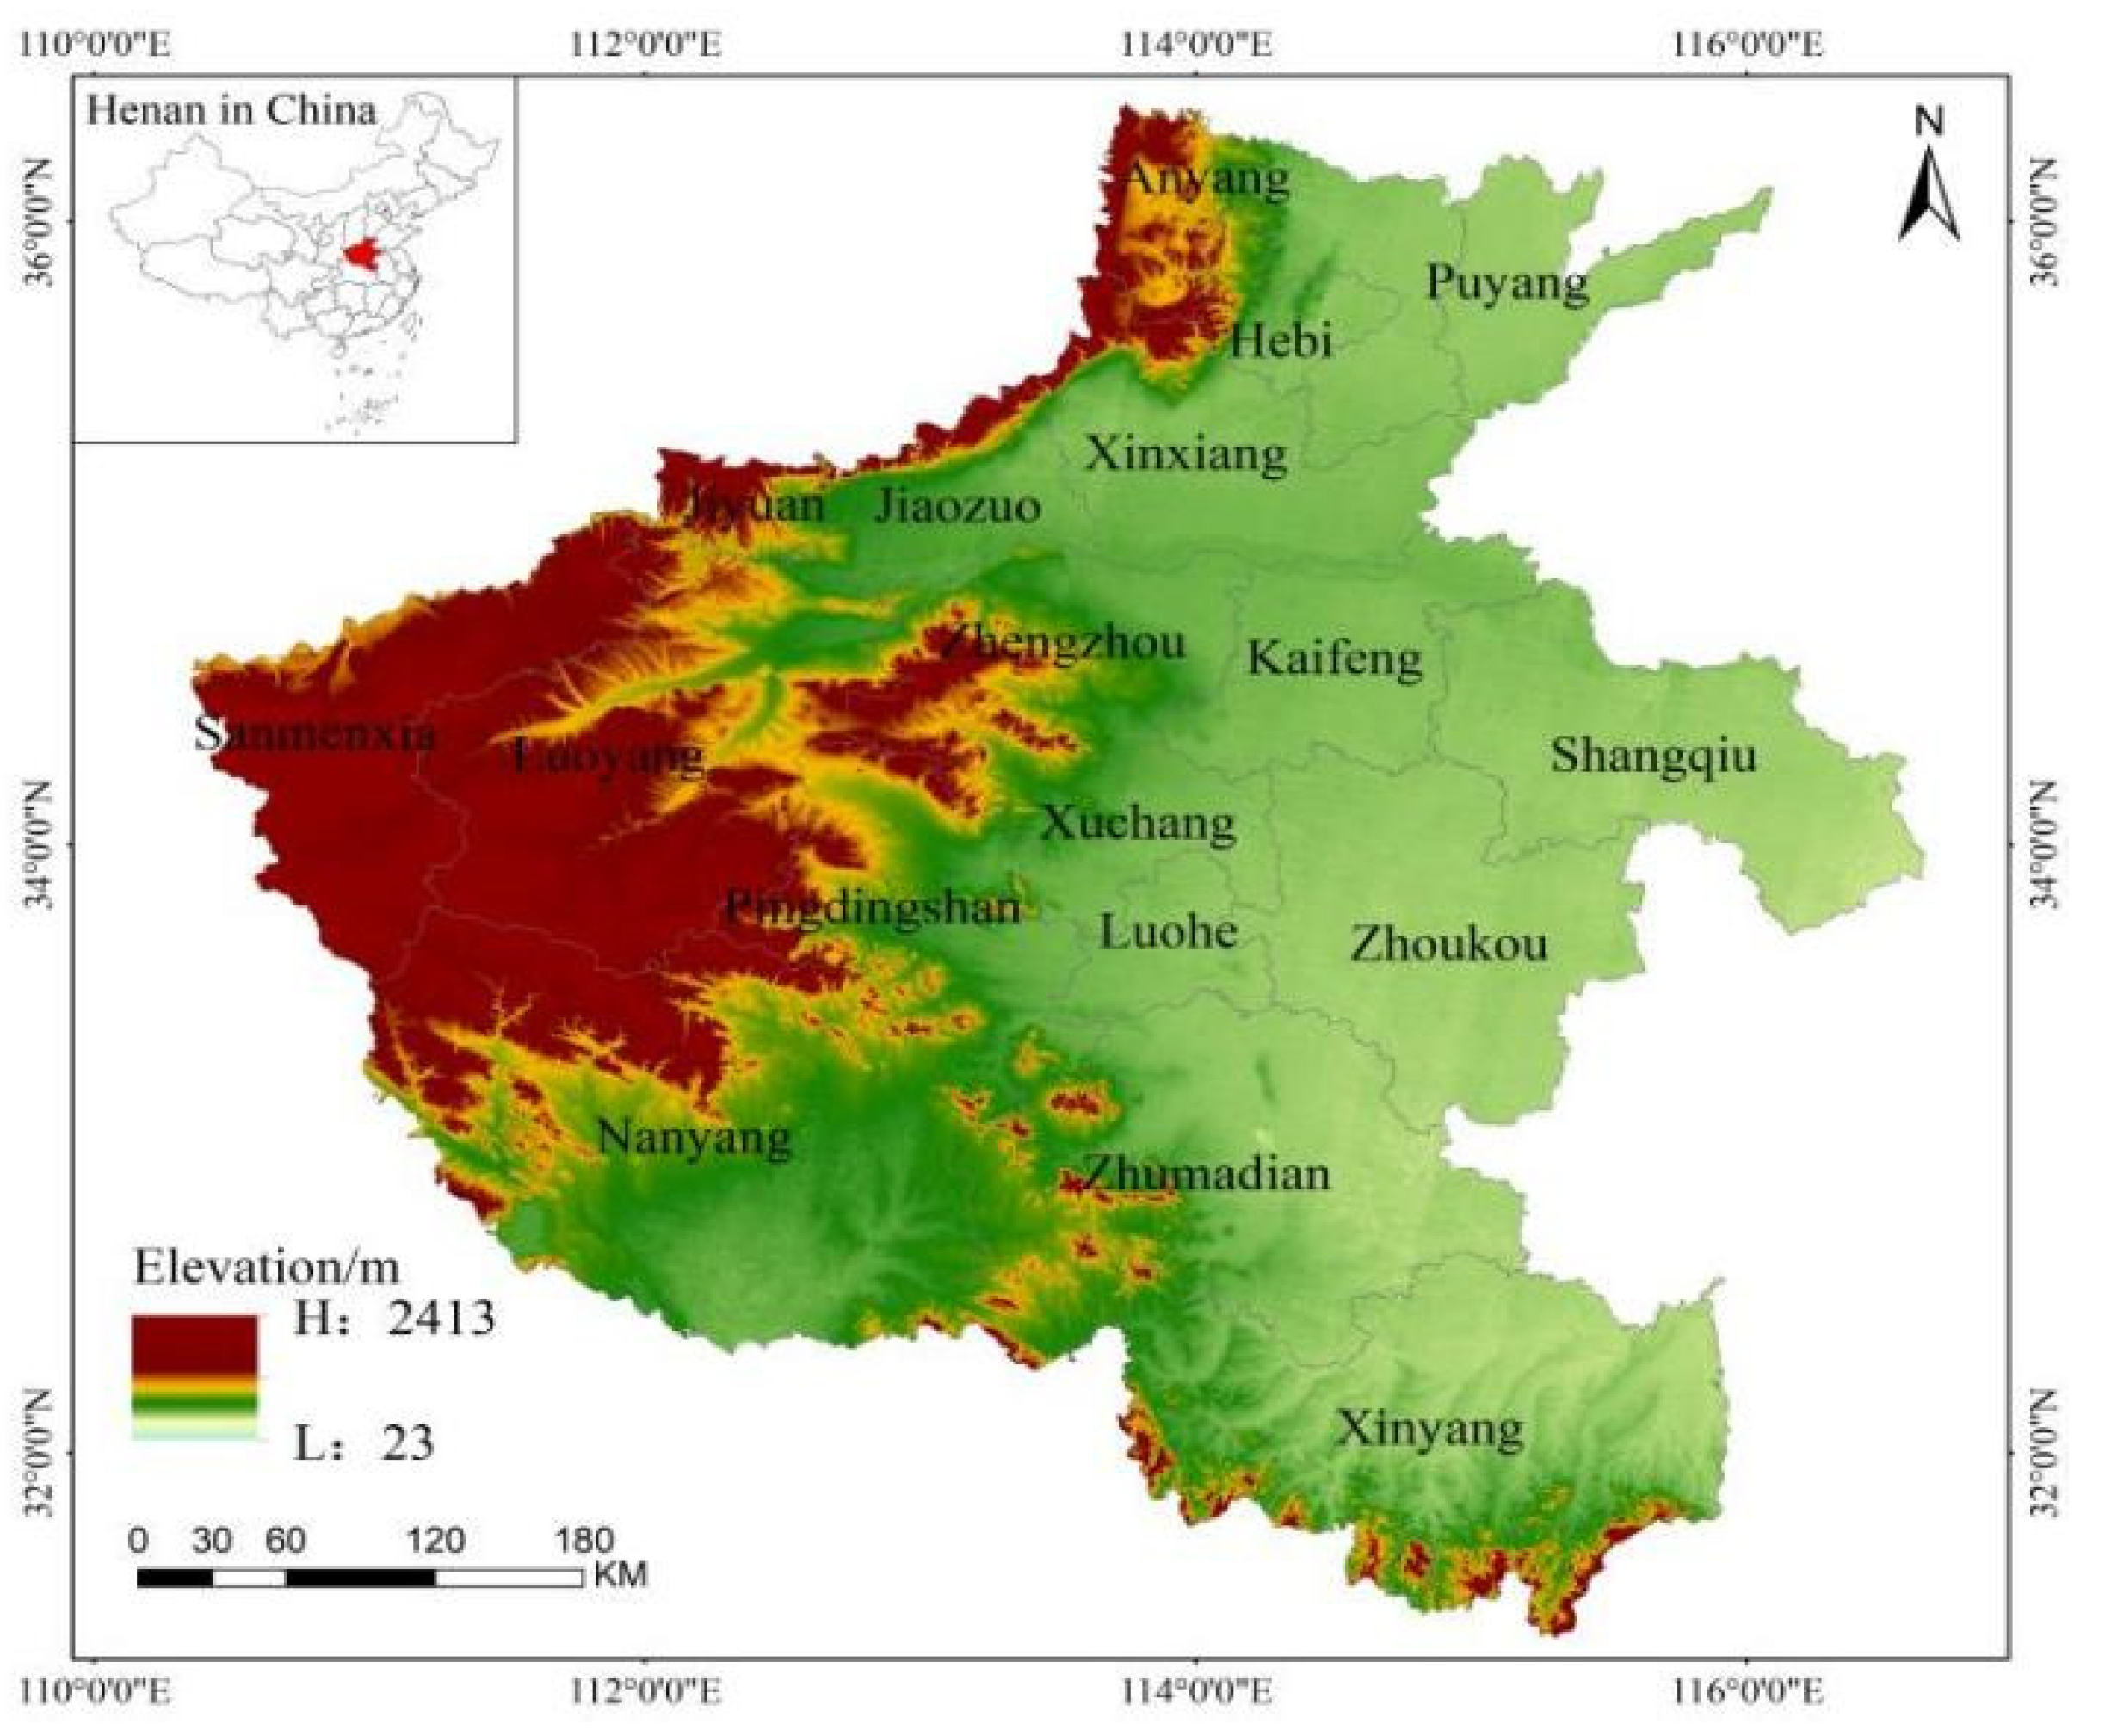
2.1. Overview of the Study Area

Henan Province occupies the middle and lower reaches of the Yellow River in central–east China, between latitudes 31°23′–36°22′ N and longitudes 110°21′–116°39′ E [28], as shown in Figure 1. The province is bordered by Anhui and Shandong to the east, Hebei and Shanxi to the north, Shaanxi to the west, and Hubei to the south. The total area of the province is 165,700 km2. Henan Province has a continental monsoon climate that transitions from the northern subtropical zone to the warm temperate zone. Henan Province experiences four distinct seasons, with simultaneous rain and heat in the summer. The complexity and diversity of the climate combine to create frequent meteorological disaster events. The terrain is high in the west and low in the east, with the Taihang Mountains, Funiu Mountains, Tongbai Mountains, and Dabie Mountains circling the province at its north, west, and south boundaries. The Yellow Huaihai Alluvial Plain is in the east–center of the province, and the Nanyang Basin is in the southwest. The total water resource of the province is 40.353 km3, or about 368 m3/person. This last figure is <20% of the national average, making Henan a province with a severe water shortage [28].
Henan Province is a major winter wheat-producing area in China. The national crop structure adjustment and increased market demand have expanded the winter wheat-planting area and production in the province. The published 2022 summer grain production data show that the total summer grain production in the province was 38.131 Gt, the planted area was 56,838 km2, and the unit area yield was 6708.7 kg/ha. These figures show that winter wheat production in Henan Province is of key importance to total grain production in both the province and the country. It is therefore important to determine the spatial distribution and patterns of change in drought vulnerability in Henan to analyze the effects on winter wheat.

2.2. Data Sources and Processing

2.2.1. Data Sources

The datasets used in this study include the Raster data and Statistical data (Table 1). (1) Percentage precipitation anomaly and drought frequency for 1990–2021 were derived from monthly precipitation data from 10 meteorological observation stations in Henan Province from 1990–2021; precipitation data were obtained from the Agro-meteorological Big Data platform. (2) Topographic data at 30 m intervals in Henan Province were sourced from the Geospatial Data Cloud. (3) Socio-economic data were sourced from the Henan Provincial Statistical Yearbooks (2011–2021), including winter wheat production data, winter wheat planted area data, average annual temperature, unit area fertilizer application, winter wheat production value, per capita GDP, total primary industry share of GDP, effective irrigated area, pesticide use, rural electricity consumption, total agricultural machinery power, net farm income, and other data. Data for average annual precipitation, surface water resources, and underground water resources were obtained from the Henan Provincial Water Resources Bulletin (2011–2020).

2.2.2. Data Normalization

Data normalization is used in cases where there are many factor indicators. Normalization makes the indicator data dimensionless, and the data are mapped onto the interval [0, 1] for subsequent calculations and analysis. We classified indicators as positive or negative, depending on their effect on drought vulnerability. Positive indicators were positively correlated with drought vulnerability and negative indicators were negatively correlated with drought vulnerability.
The equation for normalizing positive indicators is
D i j = A i j m i n i m a x i m i n i
The equation for normalizing negative indicators is
D i j = m a x i A i j m a x i m i n i
where j is the municipality; Dij is the normalized value of indicator I for municipality j; Aij is the value of indicator i for municipality j; and mini and maxi are the minimum and maximum values of indicator i, respectively.

3. Research Methodology

3.1. Drought Vulnerability Assessment Indicator System for Winter Wheat

3.1.1. Selection of Assessment Indicators

Research into drought, drought vulnerability, and drought assessment is growing, and methods of quantifying drought factors are improving. Current methods include the standardized precipitation index (SPI) based on precipitation variability, the percentage precipitation anomaly, the Palmer drought severity index (PDSI) based on water demand status, the Z index, and various drought indexes that are combined with remote sensing and GIS data [29,30,31,32]. The percentage precipitation anomaly (Pa) is a traditional drought monitoring index, which shows the long-term average or normal precipitation percentage [33]. It is a representation of drought caused by precipitation anomalies when only precipitation is considered and is therefore widely used in drought monitoring and assessment [34]. Compared to other drought indices, such as SPI, SPEI (standard precipitation evapotranspiration index), and PDSI, the percentage of precipitation anomalies has the advantage of requiring simple information for calculation, being easily accessible and easy to calculate, as well as providing a better description of the degree of drought.
(1)
Percentage precipitation anomaly
The difference between the precipitation in a particular year or month and the average for the year or month is known as the percentage precipitation anomaly (Pa). It is an important indicator of regional climate. A greater value of Pa indicates a greater deviation from the average for the year or month and thus a greater vulnerability to agricultural drought [28]. Pa is calculated by
P A = P P ¯ P ¯ × 100 %
where PA is the percentage precipitation anomaly for a given period, P is precipitation for the period (mm), and P ¯ is average precipitation for the same period (mm), which is calculated by
P ¯ = 1 n i = 1 n P i
where the time range n is generally chosen to be 30 d (or some number of months or years), with n = 31 in this study; and Pi is precipitation (mm) for day, month, or year i. The Pa (annual scale) classifications used in this paper, using the national meteorological rating standards, are shown in Table 2.
(2)
Frequency of drought
The frequency of drought occurrence in a given time period is the number of months of drought at a site in the time period as a percentage of the total number of months in the time period that is used to calculate Pa. The frequency is often used to quantify the extent of the impact of drought in a given time period. The calculation is
F i = N i M i × 100 %
where Fi is the total number of months or years in which a certain type of drought (light, moderate, severe, or extreme) occurred at weather station i, and Mi is the total number of months or years for which meteorological data was recorded at meteorological station i.

3.1.2. Indicator System

Winter wheat in Henan Province was the research object. We analyzed the spatial and temporal drought vulnerability of winter wheat in Henan Province in terms of severity using the percentage precipitation anomaly. Using drought vulnerability and drawing from related studies [13,14,15,16,17,18,19], we identified fifteen basic indicators of winter wheat vulnerability in Henan Province. The indicator selection process ensured the comprehensiveness, systematization, and operability of indicators, and selection was based on the analysis of indicator correlation with winter wheat growth characteristics along three dimensions (susceptibility to drought, environmental–economic sensitivity, and drought resistance). The fifteen indicators were as follows: area planted with winter wheat, yield of winter wheat, average annual temperature, average annual precipitation, fertilizer application per unit area, production value of winter wheat, per capita GDP, urbanization rate, total primary industry share of GDP, surface water resources, underground water resources, effective irrigation area, pesticide use, rural electricity consumption, total agricultural machinery power, and net farmer income. The indicator values were analyzed along the three dimensions, which were, in turn, each analyzed in terms of their spatial distribution and growth patterns of winter wheat in Henan Province. The fifteen indicators were weighted using the entropy weighting method in order to classify and analyze each dimension (Table 3).

3.1.3. Determination of Indicator Weights

Entropy weighting uses normalized data to determine the degree of dispersion of an indicator. A greater degree of dispersion indicates less entropy in the indicated information and therefore a greater influence of the indicator on the outcome. We present an improved method for weighting each indicator using entropy weighting and comprehensive fuzzy evaluation. A comprehensive fuzzy evaluation model was created and used to predict winter wheat in Henan Province. The results show that this method had high accuracy and great reliability, and it provides an objective method of determining drought vulnerability. The calculation process is as follows.
(1)
Calculate Qij using the normalized data:
Q i j = Y i j i = 1 x Y i j
where x is the number of samples, and Qij is the weight of sample i of indicator j.
(2)
Calculate the entropy value ej for indicator j:
e j = k i = 1 x Q i j l n Q i j
k = 1 l n x > 0
(3)
Calculate the utility of indicator Ej:
E j = 1 e j
(4)
Calculate the weight Wj for indicator j:
W j = E j j = 1 z E j
where z is the number of indicators.

3.2. Comprehensive Fuzzy Evaluation-Based Drought Vulnerability Assessment Model for Winter Wheat

A comprehensive fuzzy evaluation depends on the aggregation of indicators that contain uncertainty rather than meeting strict mathematical criteria. Fuzzy mathematics is widely used to evaluate systems, assess system effectiveness, and optimize systems. It combines qualitative and quantitative judgments [35,36,37]. The technical process of the model consisted of the following: firstly, determining the set of index factors and a total of 15 indicators according to the established drought vulnerability evaluation index system for winter wheat in Henan Province; secondly, ranking all indicators in order of importance by using the results of the weighting calculations; thirdly, using the fuzzy comprehensive evaluation method to determine the membership function and evaluation set; and, lastly, carrying out a normalization operation and comprehensive evaluation of the results.
The main steps of the comprehensive fuzzy evaluation process we used are as follows.
(1)
Determine the set of evaluation factors that form the basis of the evaluation, which is the set consisting of u1 (the susceptibility to drought of the drought-affected area), u2 (the environmental–economic sensitivity of the drought-affected environment), and u3 (the drought resistance of the affected area).
(2)
Determine the set of evaluative criteria or grades, which are the various nonobjective evaluative judgments that an evaluator may make about the factor being evaluated. For example, the evaluative criteria we used to classify their influence on drought susceptibility, sensitivity, and resistance were v1, mild; v2, average; v3, moderate; v4, severe; and v5, extreme.
(3)
Create the fuzzy matrix R m × n that consists of the fuzzy membership functions that map each evaluation factor (step 1) onto the set of evaluative grades (step 2):
R m × n = ( r i j ) = [ r 11 r 1 n r m 1 r m n ]
where rij is the membership degree of factor ui (i = 1, …, m) to the evaluative grade j (e.g., vj; j = 1, …, n). Each row of R therefore represents the (sub)set of degrees of membership of factor ui in the set of evaluative grades.
(4)
Determine the weight vector W, which consists of the set of evaluation factor weights and represents the weight that each factor accounts for. The weight assigned to a factor represents the importance of the factor in influencing the outcome and it therefore has a significant effect on the final assessment. The weights of the susceptibility, sensitivity, and resistance indicators are determined using the entropy method.
B = ( a 1 , a 1 , a n )
where a i (i = 1, …, m) is the weight of each evaluation factor value in the overall evaluation.
(5)
A fuzzy operator is selected, and the evaluations are calculated. We used the weighted average operator, and the comprehensive fuzzy evaluation is given by
B = W · R = ( b 1 , b 2 , b n )
where bi is the degree of membership of the evaluated object in a fuzzy subset of the set of all vj.
(6)
Analyze the comprehensive evaluation vector B. Determine the rank of the evaluation object according to the principle of maximum subordination.

3.3. Drought Vulnerability Model Testing for Winter Wheat

A greater risk of drought indicates a greater susceptibility index, which, in turn, indicates a greater likelihood of a reduction in winter wheat yield. To validate the winter wheat drought vulnerability model, we compared the average yield reduction of winter wheat due to drought in Henan Province from 2010 to 2020 with the average drought vulnerability index calculated by the model for the same period. Crop yields can be interpreted as trends in fluctuating yields, with technological advances and improvements in agricultural production techniques being the main reasons for annual increases in winter wheat yields, and uncertain conditions (mainly meteorological hazards) causing fluctuations in yields, i.e., the climate yield of the crop. The variation in winter wheat yield was used to represent the climate yield of winter wheat in Henan Province [38], and the data were normalized. The relative climate yield of winter wheat is calculated by
Y w = Y Y t
where Yw is the relative climate yield of winter wheat, Y is the actual yield for the year, and Yt is the linearly fitted yield calculated by linear fitting of the winter wheat yield for 2010–2020.

4. Results and Analysis

4.1. Assessment of the Characteristics of the Climate Drought Index for Winter Wheat in Henan Province

The 31 d Pa from 1991 to 2021 was calculated for each meteorological station in Henan Province using Equations (3) and (4). The frequency of drought occurrence for each meteorological station was calculated using the drought classification based on percentage precipitation anomaly (Table 2) using Equation (5). Pa was used to determine the type of drought for winter wheat in Henan Province in different years and to identify the characteristics of winter wheat drought. In order to ensure that the meteorological stations can scientifically reflect the meteorological situation in Henan Province, this paper selects an out-of-province meteorological station at the border of Henan Province in the eastern part of the province where meteorological stations are lacking (Figure 2). We used the drought frequency data from these ten meteorological stations as a basis and the inverse distance weighting method to spatially interpolate the missing cities to obtain a raster surface for Henan Province.
The frequency of the occurrence of light droughts varied significantly across space (Figure 3). Areas with high frequencies of light droughts (Figure 3a) were concentrated in northern and western Henan and southwestern Henan, where the frequency ranged from 17% to 29%. The maximum frequencies (29%) were in Anyang, Sanmenxia, and Zhumadian. In Shangqiu, parts of Nanyang, and Xinyang, the frequency ranged from 13–17%, and parts of Zhengzhou and Zhoukou also had a high frequency of light droughts. Figure 3b shows that areas with high values of moderate drought frequency were concentrated in northwest central and southeast Henan. Zhengzhou, Luoyang, Xinyang, and parts of Zhumadian had the highest frequencies (9.70%). In contrast, Anyang and Sanmenxia were areas of low incidence of moderate droughts with frequency 0–1.80%. Figure 3c shows that areas with high values for the frequency of severe and extreme droughts, with frequencies in the range 7–9.70%, were concentrated in and around Anyang, Zhengzhou, and Xinyang. The frequency of droughts in Sanmenxia, Luoyang, Nanyang, and Zhumadian was also high, showing an alternating distribution, but the frequency of severe and extreme droughts in other areas was low. In general, the frequency of light and severe droughts was greater in northern and southern Henan and less in central and eastern Henan; the frequency of medium droughts was greater in southwestern Henan and less in eastern and northern Henan.

4.2. Drought Susceptibility Assessment and Zoning for Winter Wheat in Henan Province

4.2.1. Susceptibility Analysis of Winter Wheat in Henan Province

The susceptibility of winter wheat to drought can be used to determine winter wheat yield reduction due to drought damage. Winter wheat planted area, winter wheat yield, average annual precipitation, and average annual temperature were selected as indicators of susceptibility. The natural breaks method of ArcGIS software was used to map susceptibility zonally.
There was no significant change in the distribution of high or higher susceptibility during 2011–2020 (Figure 4). Higher susceptibility areas were concentrated mainly in the southern and eastern regions of Henan, such as Nanyang, Zhumadian, Zhoukou, and Shangqiu, and areas of medium susceptibility were Xinyang and Kaifeng, Xinxiang, Anyang, and Jiyuan. Susceptibility was generally low in northern Henan. When rainfall and acreage indicators were taken into account, in plain areas such as Zhumadian, a greater winter wheat planted area and greater winter wheat yield indicated greater susceptibility to extreme precipitation and warming events. Figure 4b shows a significant change in susceptibility due to the severe drought that occurred in 2014. Yields were generally low in northern Henan. The region has high precipitation, and when extreme precipitation or drought events are frequent, winter wheat yields in areas of high winter wheat planting, such as Anyang and Pingdingshan, may experience severe yield reductions.

4.2.2. Sensitivity of Winter Wheat in Henan Province

Sensitivity represents the extent of a regional response to drought and expresses the degree of dependence on agriculture in the region. When an agricultural drought occurs, a greater dependence on agriculture will result in greater sensitivity and greater vulnerability to drought.
Figure 5 shows that during the period 2011–2020, sensitivity was generally high and showed a decreasing trend year by year. Zhengzhou had low sensitivity, as did Jiaozuo, Luoyang, and Jiyuan, but other regions had medium or high sensitivity. The northern, western, and southern parts of Henan are surrounded by the Taihang, Funiu, Tongbai, and Dabie mountains around the provincial boundary and are prone to droughts, so areas such as Xinxiang, Anyang, Sanmenxia, Xinyang, and Nanyang, which are in mountainous and hilly areas, have a greater sensitivity than other areas. Luoyang and Jiyuan are in hilly areas but occupy the middle and lower reaches of the Yellow River and contain well-developed river networks, so they have the lowest sensitivity. Puyang is in the alluvial plain of the Yellow River and has a well-developed water net system, so it has low sensitivity. Zhengzhou is the capital city of the province and has a more developed economy than the rest of the province such as a higher urbanization rate, a higher per capita GDP and abundant surface and groundwater resources. Its low percentage of total primary industry (GDP) makes it less dependent on agriculture and less sensitive to drought. The Pingdingshan, Xuchang, Luohe, Kaifeng, Shangqiu, Zhoukou, and Zhumadian regions are located in the plains and have a high percentage of total primary industry (GDP), i.e., they are more dependent on agricultural development. Moreover, the value of winter wheat production is high in these areas, but yield losses due to droughts are also high, so their sensitivity is also high.

4.2.3. Winter Wheat Drought Resistance

As research on drought has increased, resistance has become more closely linked to socio-economic concerns. Generally, greater resistance to drought in a region indicates less loss directly attributable to drought. Drought resistance is therefore inversely related to the risk of drought, and different equations are used to normalize resistance index data. Regions with lower resistance indexes are thus more likely to be resistant to disasters than regions with higher resistance indexes.
Figure 6 shows that drought resistance of winter wheat was generally high in Henan Province during 2011–2020. Drought resistance increased gradually over the period and showed an overall pattern of large areas of similar resistance and small areas of mixed resistance, but the resistance of plain areas was greater than that of hilly areas. Drought resistance was greater in Zhoukou, Shangqiu, Zhumadian, and Nanyang than in Hebi, Sanmenxia, Pingdingshan, Luohe, and Xinyang, where it was low. Zhengzhou is in a hilly area but has a high resistance, mainly because of its more developed economy and greater investment in agricultural irrigation facilities. In contrast, Hebi and Jiyuan are in the plain of the lower reaches of the Yellow River and have more developed water systems, so there is no need to greatly invest human and material resources into drought relief, which would lower the resistance to drought.

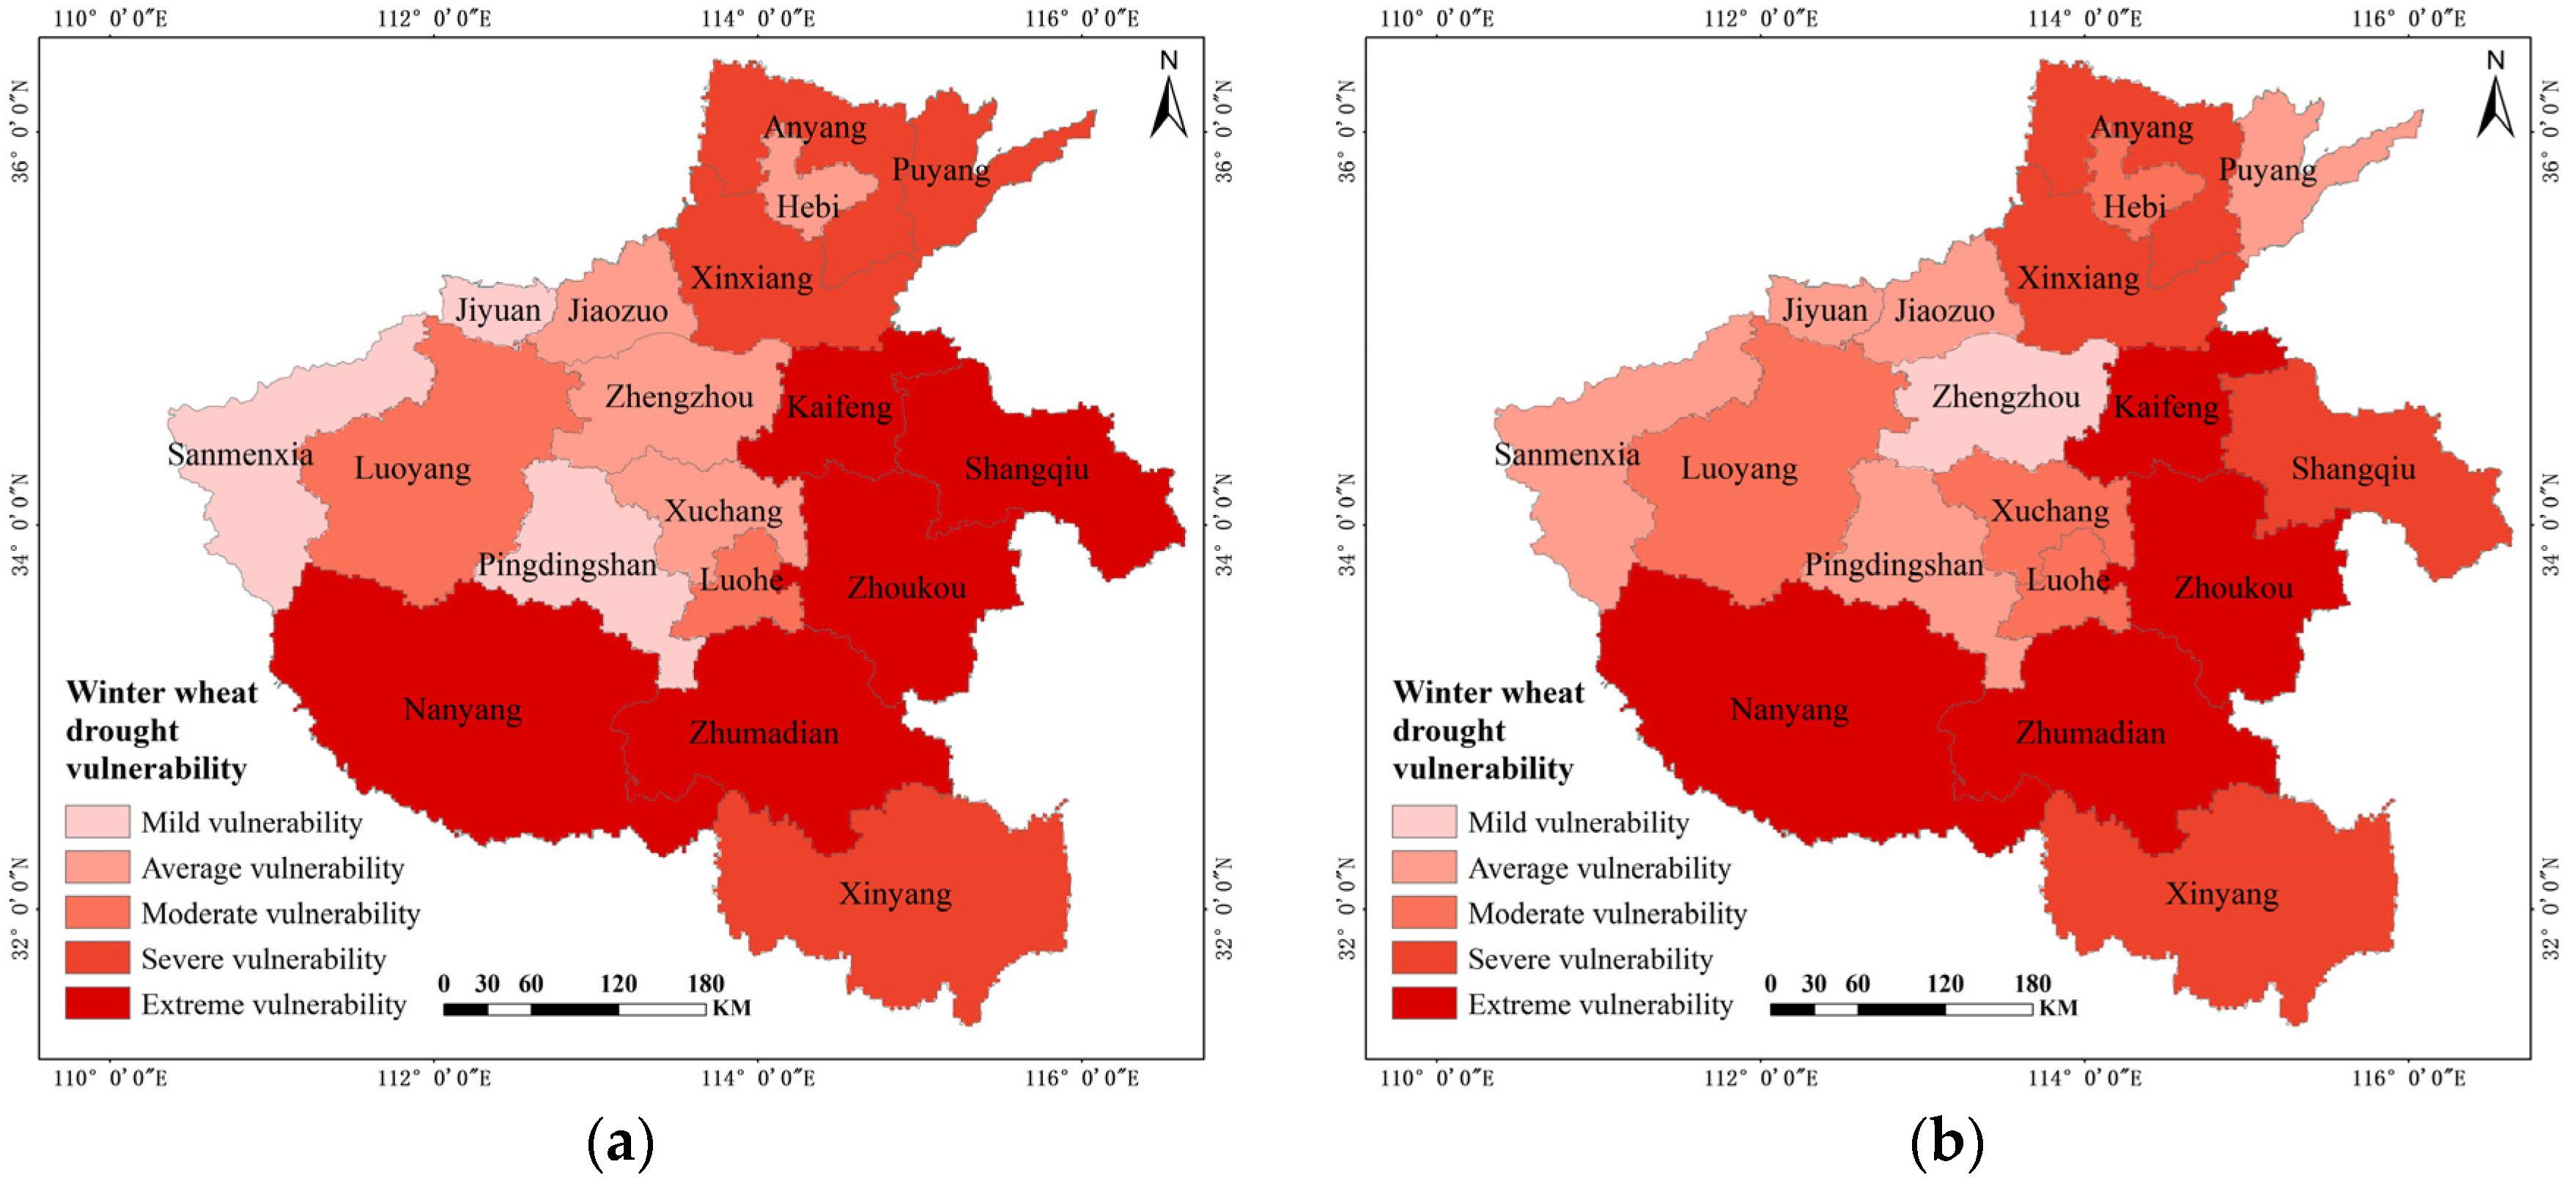
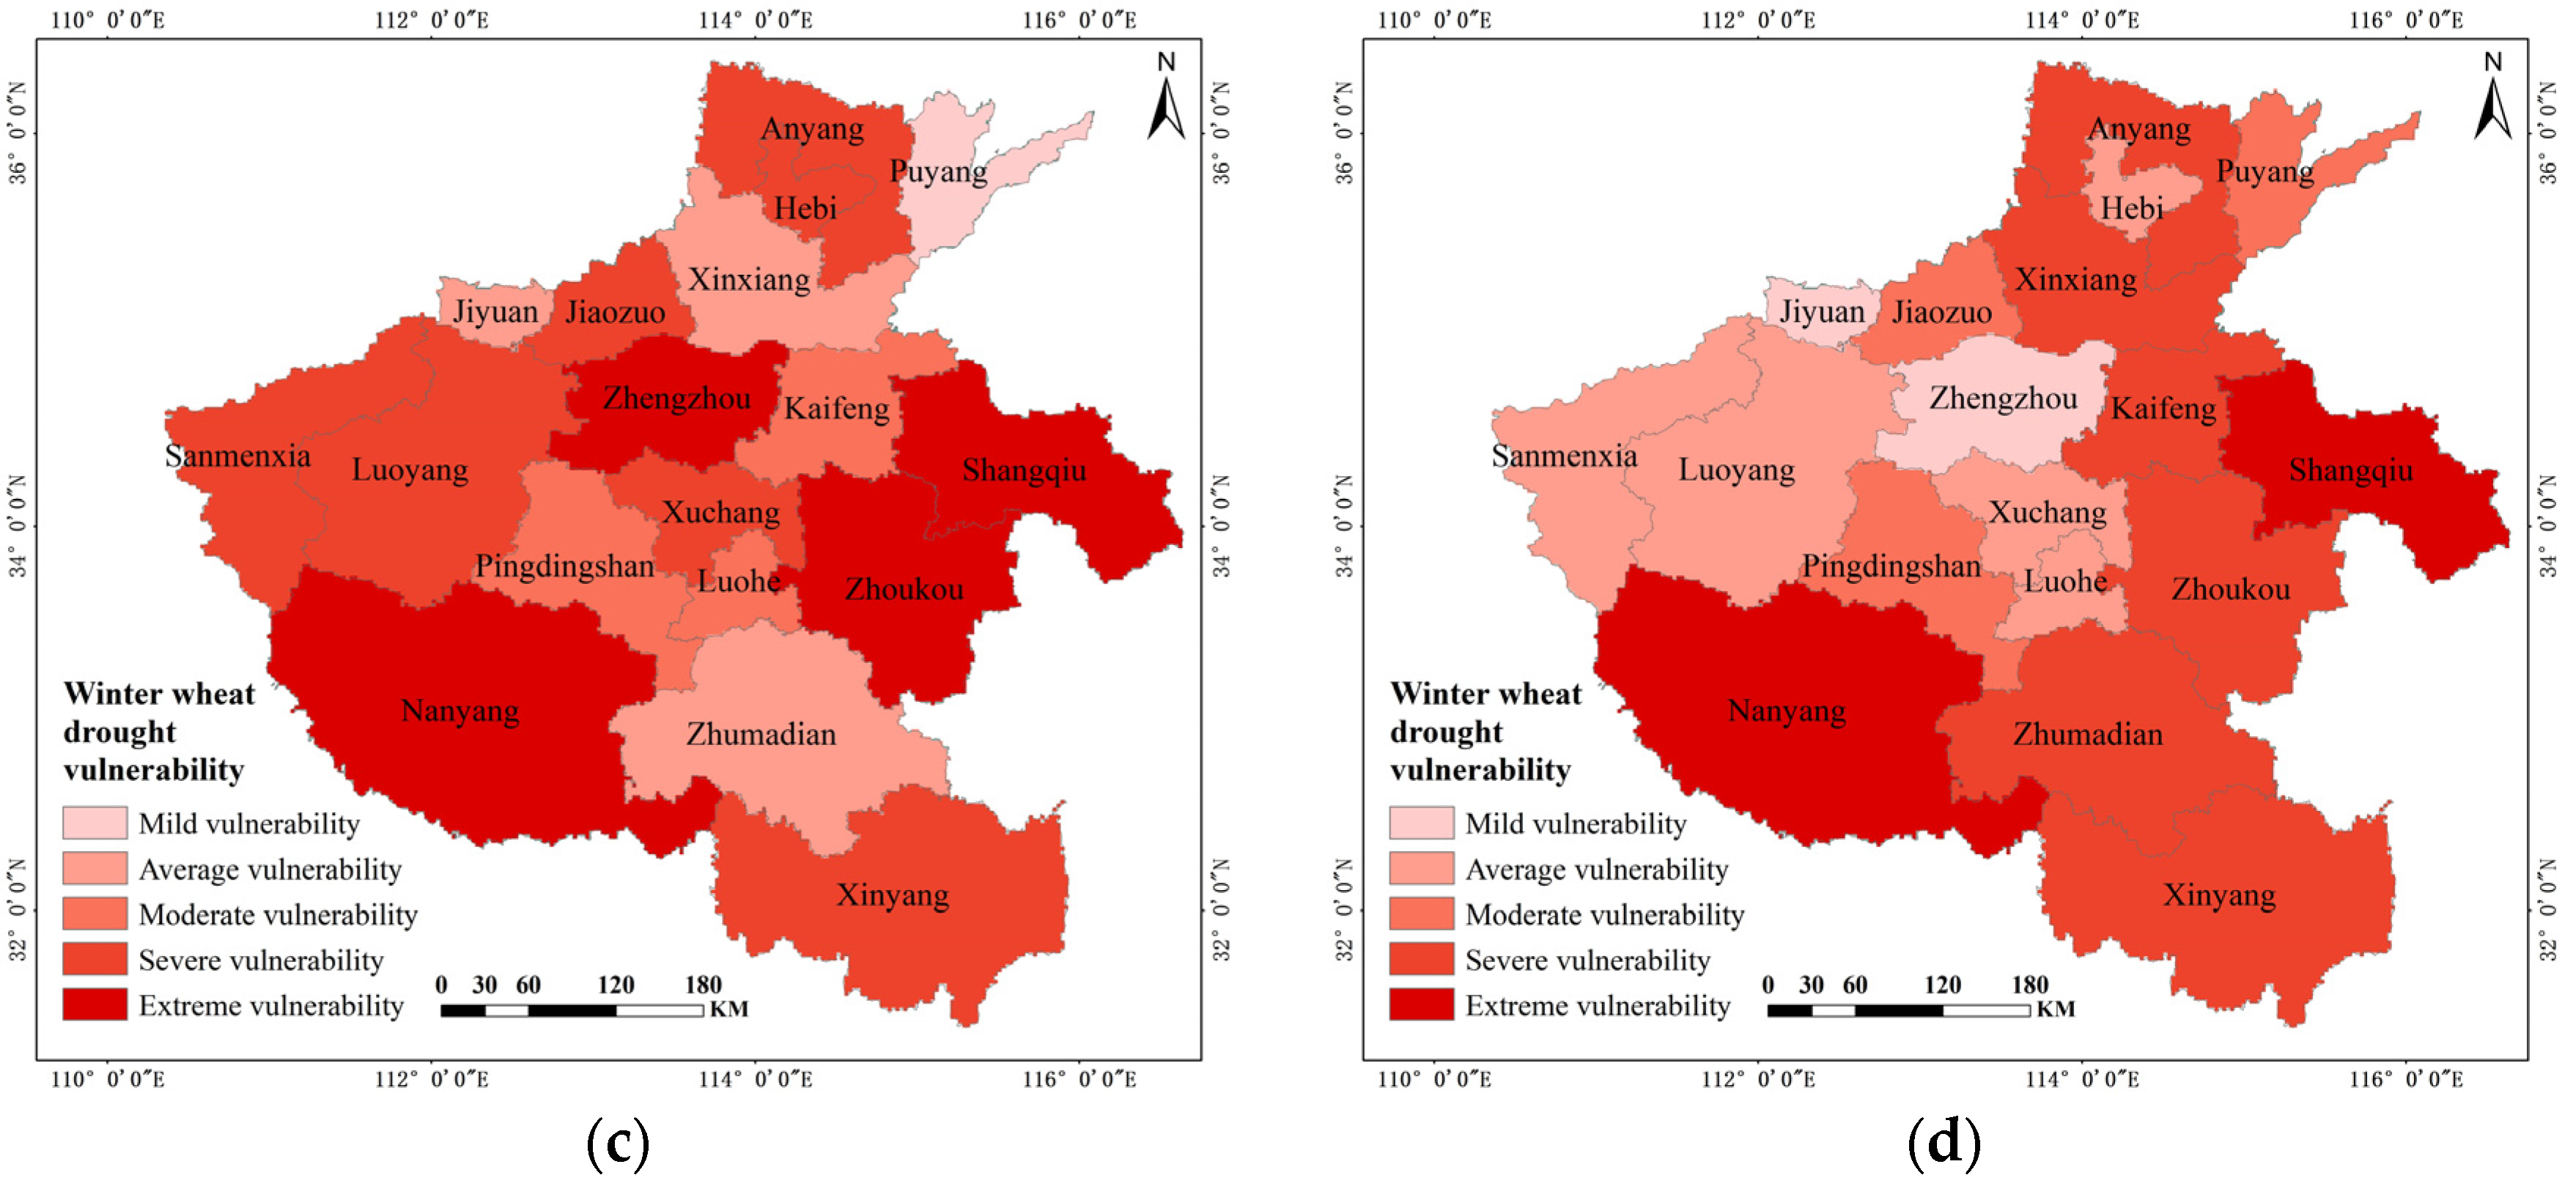
4.2.4. Classification of Drought Vulnerability of Winter Wheat in Henan Province

Data for the indicators shown in Table 3 were obtained, and the values of the vectors for indicator weights at the dimension level were calculated using the entropy weighting method. The fuzzy relationship matrix, weight vector, and fuzzy comprehensive evaluation were calculated using Equations (11)–(13), and the fuzzy transformation was used to predict the winter wheat drought vulnerability index in Henan Province from 2011 to 2020. The natural point interval method and reclassification functions of ArcGIS were used to weight the winter wheat drought vulnerability index of Henan Province.
The comprehensive fuzzy evaluation was conducted using SPSS software using the weighted mean type M(*,+) operator. The normalized weights of the degrees of membership of the three factor sets were obtained: 0.38, 0.36, and 0.26, as shown in Table 4. It can be seen from the table that the greatest weight was for susceptibility, indicating that susceptibility of an area to drought has the greatest influence on the winter wheat drought vulnerability index.
Table 5 shows the calculated area for each class of drought vulnerability of winter wheat in Henan Province between 2014 and 2017. In 2011, the cities with mild vulnerability to winter wheat drought in Henan Province were Pingdingshan, Sanmenxia, and Jiyan; the cities with average vulnerability were Zhengzhou, Hebi, Jiaozuo and Xuchang; the cities with moderate vulnerability were Luohe and Luoyang; the cities with severe vulnerability were Anyang, Xinxiang, Puyang, and Xinyang; and the cities with extreme vulnerability were Kaifeng, Shangqiu, Zhoukou, Zhumadian, and Nanyang. In 2014, the cities with mild vulnerability to winter wheat drought in Henan Province were Zhengzhou; cities with average vulnerability were Pingdingshan, Jiaozuo, Puyang, Sanmenxia, and Jiyuan; cities with moderate vulnerability were Luoyang, Hebi, Xuchang, and Luohe; cities with severe vulnerability were Anyang, Xinxiang, Shangqiu, and Xinyang; cities with extreme vulnerability were Kaifeng, Zhoukou, Zhumadian, and Nanyang. In 2017, the cities in Henan Province with mild vulnerability to winter wheat drought were Puyang; those with average vulnerability were Xinxiang, Zhumadian, and Jiyuan; those with moderate vulnerability were Kaifeng, Pingdingshan, and Luohe; those with severe vulnerability were Luoyang, Anyang, Hebi, Jiaozuo, Xuchang, Sanmenxia, and Xinyang; and those with extreme vulnerability were Zhengzhou, Shangqiu, Zhoukou, and Nanyang. In 2020, cities in Henan Province with mild vulnerability to winter wheat drought include Zhengzhou and Jiyuan; cities with average vulnerability include Luoyang, Hebi, Xuchang, Luohe, and Sanmenxia; cities with moderate vulnerability include Pingdingshan, Jiaozuo, and Puyang; cities with severe vulnerability include Kaifeng, Anyang, Xinxiang, Zhoukou, Zhumadian, and Xinyang; and cities with extreme vulnerability include Shangqiu and Nanyang.
The table shows that the overall area of areas at all levels of drought risk for winter wheat in Henan Province decreased year by year during the period 2014–2017. This indicates that the government is beginning to pay attention to the issue of drought vulnerability of winter wheat. Cities in areas of extreme vulnerability, such as Kaifeng, Zhoukou, and Zhumadian, gradually became cities in areas of severe vulnerability. This is shown by the area of extreme vulnerability decreasing to 37,213 km2 in 2020 and the total area of severe vulnerability increasing to 67,886 km2 in 2020. Cities in areas of moderate vulnerability gradually become cities in areas of average vulnerability, with the total area of moderate vulnerability decreasing to 16,224 km2, and the area of average vulnerability increased to 35,479 km2; cities in areas of average vulnerability gradually become cities in areas of mild vulnerability, with the area of mild vulnerability increasing from 4271 km2 in 2017 to 9498 km2 in 2020.
Figure 7 shows that the drought vulnerability index for winter wheat in Henan Province showed an annually increasing trend during the period 2011–2020. The category of vulnerability varied little, with most areas being average or moderate vulnerability. There was a real contiguity of vulnerability classes, as shown by Pingdingshan, Xuchang, and Luohe in central Henan and parts of Xinyang and Zhumadian in southern Henan. Severe and extremely vulnerable areas were scattered in hilly and plain areas, with the exception of Hebi and Puyang, and most such areas were in the hilly transition zone from the second to the third terraces. Mild vulnerability in southern Henan was due to the better-developed water system in the region and the warmer climate with abundant precipitation. The higher level of vulnerability in eastern Henan was due to the large area of winter wheat cultivation in the plains, in which vulnerability was mainly influenced by low drought resistance due to poor farmland infrastructure. The climate of northern Henan is drier and, although there are more natural water systems in that region, precipitation is lower, and there has been more investment in agricultural irrigation facilities to reduce the impact of drought on winter wheat yields.
The distribution of winter wheat drought vulnerability classes was compared with the distribution of the winter wheat susceptibility index, economic–environmental sensitivity index, and drought resistance index. We found that the distribution of winter wheat drought vulnerability classes and the distribution of the winter wheat susceptibility index were essentially consistent. This is the same as the analysis presented in Table 4, where the winter wheat susceptibility index has a direct effect on winter wheat drought vulnerability. This result is almost the same as the results shown in the drought sensitivity graph for winter wheat yield in Henan Province produced by Wu et al. [2].

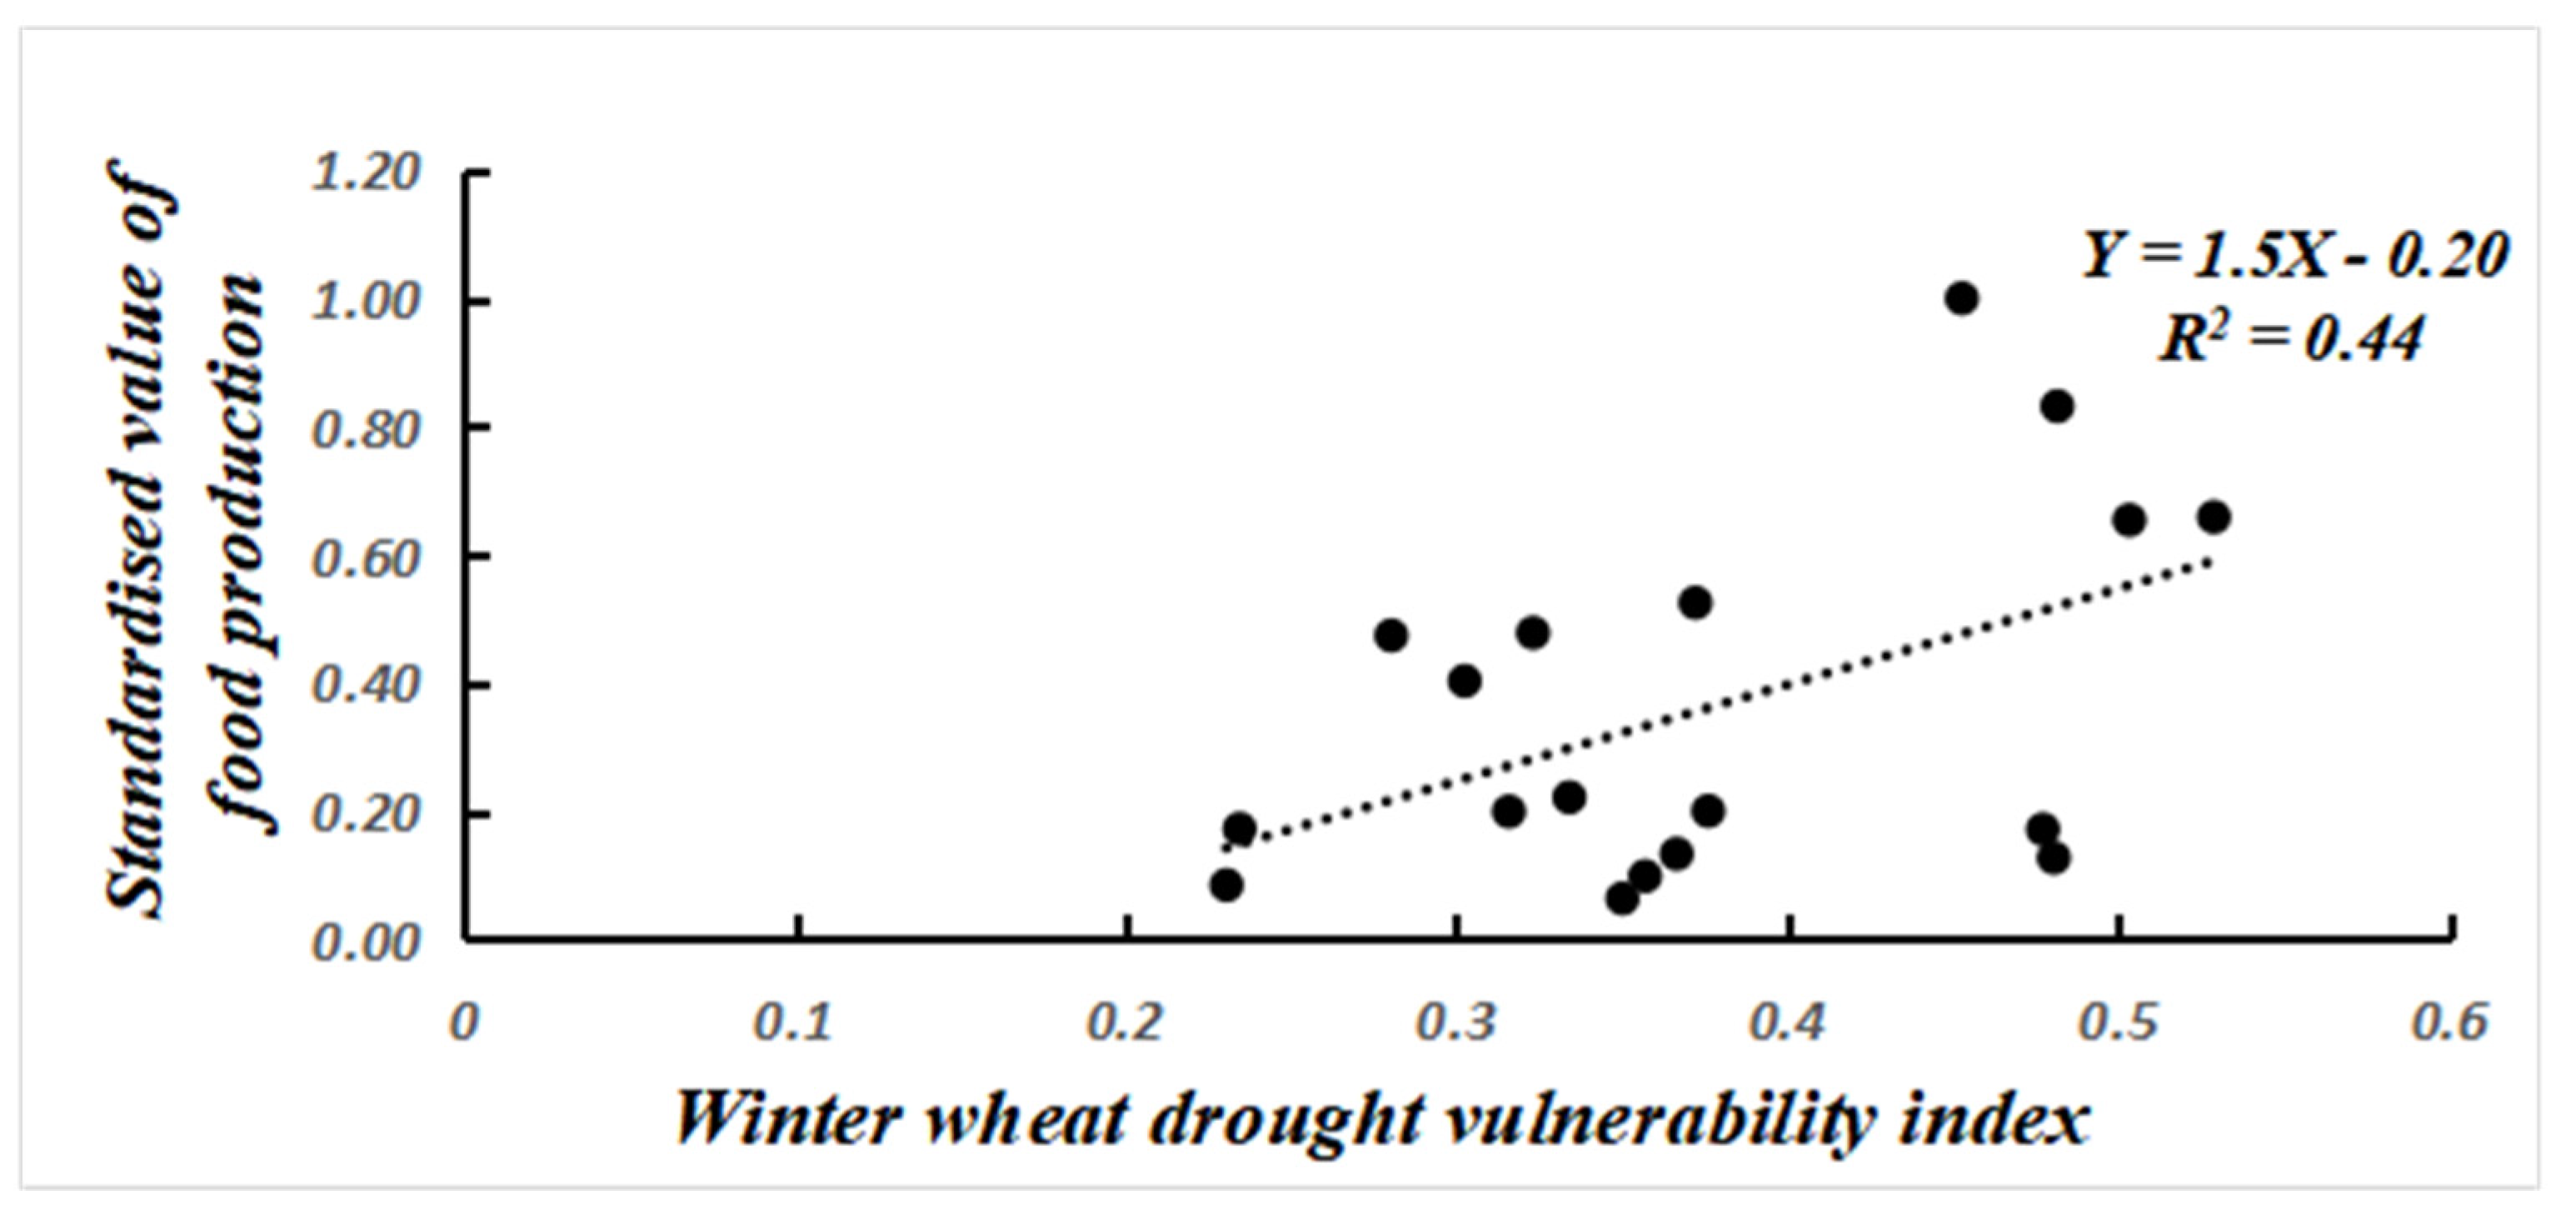
4.2.5. Validation of the Drought Vulnerability Model

The standardized values of the average winter wheat yield for 2010–2020 for each prefecture-level city in Henan Province were correlated with the average drought vulnerability index calculated by the drought vulnerability model and were then fitted using linear regression (Figure 8). The correlation coefficient R2 obtained based on the improved entropy–fuzzy evaluation method is 0.44, specifically the drought vulnerability index explains 44% of the fluctuating yield of winter wheat. In contrast, a correlation analysis and fitting based on the traditional fuzzy integrated evaluation method yielded an R2 of 0.26. The results show that the winter wheat drought vulnerability index in this study can effectively evaluate the drought vulnerability of winter wheat in Henan Province.

5. Conclusions

We used climate data, winter wheat production data, wheat cultivation area data, and socio-economic data of Henan Province to analyze the spatial and temporal variability of winter wheat drought vulnerability in Henan Province using the Pa index. We created a winter wheat drought vulnerability assessment model using the entropy method and comprehensive fuzzy evaluation for three dimensions of influence on winter wheat drought vulnerability: susceptibility to drought, economic–environmental sensitivity to drought, and drought resistance capacity. The principal conclusions are as follows.
(1)
The determination of Pa and analysis of the different degrees or levels of drought effects on winter wheat in Henan Province showed that the frequency of occurrence of different levels of drought varied significantly spatially. The frequency of mild droughts ranged from 9.70% to 29%, the frequency of moderate droughts ranged from 0 to 9.70%, and the frequency of severe or extreme droughts ranged from 3.20% to 9.70%. Droughts have become more frequent in Henan Province over the study period; mild and extreme droughts occurred more often in the north, while moderate and severe droughts occurred more often in the south.
(2)
The comprehensive fuzzy evaluation produced normalized weights of the susceptibility, sensitivity, and resistance dimensions that were, respectively, 0.38, 0.36, and 0.26. The susceptibility of winter wheat to drought has a large influence on the winter wheat drought vulnerability index. Areas of high susceptibility were concentrated in southern and eastern Henan, with susceptibility indices ranging from 0.59 to 0.80. Areas of high economic–environmental sensitivity were concentrated in parts of east, south, and west Henan, with sensitivity indices ranging from 0.52 to 0.70. High sensitivity was mainly due to the greater risk of drought in mountainous areas and the greater rate of winter wheat cultivation in the plain. Areas of higher drought resistance for winter wheat were concentrated around Zhengzhou and Hebi, with drought tolerance indices ranging from 0.44 to 0.62, due mainly to better conditions for agricultural production.
(3)
There were also temporal changes between 2011 and 2020. Areas in Henan Province that were severely or extremely vulnerable showed a scattered distribution in 2011 and 2014 that became more blocked in 2017 and 2020. The distribution of winter wheat drought vulnerability classes’ change indicated a trend towards a lower drought vulnerability index for winter wheat in Henan Province. The vulnerability to drought of winter wheat in Henan Province from 2011 to 2020 varied relatively little, with most areas showing average or moderate vulnerability, mainly due to local topography (higher elevations were more susceptible to drought), but well-developed farmland and water conservancy facilities with a well-developed social economy increased drought resistance, so the risk of drought remained low.
We have found that the actual drought losses are influenced by economic levels, irrigation facilities, and other conditions, and that there are significant regional or household differences. This provides basic theoretical support for the selection of wheat varieties, the development of disaster prevention and mitigation measures, and the risk zoning and control of winter wheat. The drought vulnerability model in this paper only selects some indicators to characterize drought exposure, sensitivity, and adaptation to winter wheat, which will result in a less precise zoning assessment. The next step is to further improve and optimize the assessment model by taking into account the physiological characteristics of winter wheat and specific on-farm production processes.

Author Contributions

Conceptualization, S.W.; data curation, L.G.; methodology, L.G. and S.W.; project administration, S.W.; data processing, B.Y.; writing—original draft, B.Y.; writing—review and editing, B.Y. All authors have read and agreed to the published version of the manuscript.

Funding

This research was jointly supported by the National Natural Science Foundation of China Key Projects (Grants No. U22A20620, Grants No. U21A20108) and the Natural Science Foundation of Henan Polytechnic University (Grant No. B2023-21).

Institutional Review Board Statement

Not applicable.

Informed Consent Statement

Not applicable.

Data Availability Statement

The data used in this study are available from the first author upon reasonable request.

Acknowledgments

The research was supported by the National Natural Science Foundation of China Key Projects (Grants: U22A20620, U21A20108), the Natural Science Foundation of Henan Polytechnic University (Grant: B2023-21). We would also like to express our respect and thanks to the anonymous reviewers and the editors for their helpful comments in improving the quality of this paper.

Conflicts of Interest

The authors declare no conflict of interest.

References

  1. Chai, L.; Zhu, H. Evolutionary Trends of Regional Centralization of Grain Production in China. J. Nat. Resour. 2016, 31, 908–919. [Google Scholar]
  2. Wu, H.; Guo, J.; Zheng, P. Drought Vulnerability of Winter Wheat in Henan Province. Areal Res. Dev. 2018, 37, 170–175. [Google Scholar]
  3. Veisi, K.; Bijani, M.; Abbasi, E. A human ecological analysis of water conflict in rural areas: Evidence from Iran. Glob. Ecol. Conserv. 2020, 23, e01050. [Google Scholar] [CrossRef]
  4. Sepulcre-Canto, G.; Horion SM, A.F.; Singleton, A.; Carrao, H.; Vogt, J. Development of a combined drought indicator to detect agricultural drought in Europe. Nat. Hazards Earth Syst. Sci. 2012, 12, 3519–3531. [Google Scholar] [CrossRef]
  5. Li, X.; Yang, Y.; Liu, Y.; Liu, H. Impacts and effects of government regulation on farmers’ responses to drought: A case study of North China Plain. Geogr. Sci. 2017, 27, 1481–1498. [Google Scholar] [CrossRef]
  6. Brant, S. Assessing Vulnerability to Drought in Ceara North-East Brazil; University of Michigan: Ann Arbor, MI, USA, 2007. [Google Scholar]
  7. Savari, M.; Damaneh, H.E.; Damaneh, H.E. Drought vulnerability assessment: Solution for risk alleviation and drought management among Iranian farmers. Int. J. Disaster Risk Reduct. 2022, 67, 102654. [Google Scholar] [CrossRef]
  8. Me-Bar, Y.; Valdez, F. On the vulnerability of the ancient Maya society to natural threats. J. Archaeol. Sci. 2005, 32, 813–825. [Google Scholar] [CrossRef]
  9. Cheng, J. A Study on Agricultural Drought Hazard Vulnerability and Risk Management: A Case of Xiaogan City in Hubei Province. Ph.D. Thesis, Huazhong Agricultural University, Wuhan, China, 2011. [Google Scholar]
  10. Xie, Q.; Zhao, C.; Wang, Z. Evaluation of social vulnerability to drought disaster of farmers with different livelihoods: Take Bijie City in Wumeng Mountains area as an example. J. Nat. Disasters 2022, 31, 208–218. [Google Scholar]
  11. Pei, H.; Wang, X.; Fang, S. Study on temporal-spatial evolution of agricultural drought vulnerability of China based on DEA model. J. Catastrophol. 2015, 30, 64–69. [Google Scholar]
  12. Wang, Y.; Wang, J.; Yao, Y.B.; Wang, J.S. Evaluation of Drought Vulnerability in Southern China Based on Principal Component Analysis. Ecol. Environ. Sci. 2014, 23, 1897–1904. [Google Scholar]
  13. Li, M.; Hui, Q.; Qiao, L. Evaluation of agricultural vulnerability to drought in Guanzhong Area. Resour. Sci. 2016, 38, 0166–0174. [Google Scholar]
  14. Pei, W. Research on Regional Agricultural Drought Assessment and Temporal and SPATIAL Variation: A Case of Heilongjiang Province. Ph.D. Thesis, Northeast Agricultural University, Harbin, China, 2017. [Google Scholar]
  15. Zarei, A.R.; Shabani, A.; Moghimi, M.M. Accuracy Assessment of the SPEI, RDI and SPI Drought Indices in Regions of Iran with Different Climate Conditions. Pure Appl. Geophys. 2021, 178, 1387–1403. [Google Scholar] [CrossRef]
  16. Jia, J.; Han, L.; Wang, X.; Liu, W. Risk and Regionalization of Drought for Winter Wheat in Gansu Province. Arid Zone Res. 2019, 36, 1478–1486. [Google Scholar]
  17. Yan, Y.; He, Z.; Zhu, K. Winter Wheat in Henan: Drought Index Characteristics and Risk Assessment. J. Agric. 2021, 11, 12–19. [Google Scholar]
  18. Schwartz, C.; Ellenburg, W.L.; Mishra, V.; Mayer, T.; Griffin, R.; Qamer, F.; Matin, M.; Tadesse, T. A statistical evaluation of Earth-observation-based composite drought indices for a localized assessment of agricultural drought in Pakistan. Int. J. Appl. Earth Obs. Geoinf. 2022, 106, 102646. [Google Scholar] [CrossRef]
  19. Mishra, A.K.; Desai, V.R. Drought forecasting using stochastic models. Stoch. Env. Res Risk Assess. 2005, 19, 326–339. [Google Scholar] [CrossRef]
  20. Hughes, N.; Soh, W.Y.; Boult, C.; Lawson, K. Defining drought from the perspective of Australian farmers. Clim. Risk Manag. 2022, 35, 100420. [Google Scholar] [CrossRef]
  21. Oyea, C.; Bja, B.; Amka, C. Global quantitative and qualitative assessment of drought research from 1861 to 2019. Int. J. Disaster Risk Reduct. 2022, 70, 102770. [Google Scholar]
  22. Arun Kumar, K.C.; Reddy GP, O.; Masilamani, P.; Sandeep, P. Indices-based assessment of vulnerability to agricultural drought in the tropical semi-arid ecosystem using time-series satellite and meteorological datasets. Arab. J. Geosci. 2022, 15, 1022. [Google Scholar] [CrossRef]
  23. Hoque MA, A.; Pradhan, B.; Ahmed, N.; Sohel, M.S.I. Agricultural drought risk assessment of Northern New South Wales, Australia using geospatial techniques. Sci. Total Environ. 2021, 756, 143600. [Google Scholar] [CrossRef]
  24. Kar, S.K.; Thomas, T.; Singh, R.M.; Patel, L. Integrated assessment of drought vulnerability using indicators for Dhasan basin in Bundelkhand region, Madhya Pradesh, India. Curr. Sci. A Fortn. J. Res. 2018, 115, 338–346. [Google Scholar] [CrossRef]
  25. Sahana, V.; Mondal, A.; Sreekumar, P. Drought vulnerability and risk assessment in India: Sensitivity analysis and comparison of aggregation techniques. J. Environ. Manag. 2021, 299, 113689. [Google Scholar] [CrossRef] [PubMed]
  26. Li, Z.; Wang, G.; Yang, D.; Lu, Y. Vulnerability Analysis of Agricultural Drought in Henan Province. Chin. Agric. Sci. Bull. 2021, 37, 101–106. [Google Scholar]
  27. Zhang, W.; Xu, L. Study on Drought Vulnerability of Summer Maize in Henan Province Based on ArcGIS. Res. Soil Water Conserv. 2018, 25, 228–234. [Google Scholar]
  28. The People’s Government of Henan Province. Available online: https://m.henan.gov.cn/2018/05-31/2408.html (accessed on 20 September 2022).
  29. Domínguez-Castro, F.; Vicente-Serrano, S.M.; Tomás-Burguera, M.; Peña-Gallardo, M.; Beguería, S.; El Kenawy, A.; Luna, Y.; Morata, A. High spatial resolution climatology of drought events for Spain: 1961–2014. Int. J. Climatol. 2019, 39, 5046–5062. [Google Scholar] [CrossRef]
  30. Dehghan, S.; Salehnia, N.; Sayari, N.; Bakhtiari, B. Prediction of meteorological drought in arid and semi-arid regions using PDSI and SDSM: A case study in Fars Province, Iran. J. Arid Land 2020, 12, 318–330. [Google Scholar] [CrossRef]
  31. Ren, Y.; Liu, J.; Shalamzari, M.J.; Arshad, A.; Liu, S.; Liu, T.; Tao, H. Monitoring Recent Changes in Drought and Wetness in the Source Region of the Yellow River Basin, China. Water 2022, 14, 861. [Google Scholar] [CrossRef]
  32. Kumar, S.A.; Meenu, R.; Kumar, P.R. Changes in drought characteristics based on rainfall pattern drought index and the CMIP6 multi-model ensemble. Agric. Water Manag. 2022, 266, 107568. [Google Scholar]
  33. Yang, S.E.; Wu, B.F. Calculation of monthly precipitation anomaly percentage using web-serviced remote sensing data. In Proceedings of the 2010 2nd International Conference on Advanced Computer Control, Shenyang, China, 27–29 March 2010; IEEE: Washington, DC, USA, 2010; pp. 621–625. [Google Scholar]
  34. Li, X.; Zhao, J.; Xu, J. An Analysis of Drought Characteristics in Anhui Province during the Past 50 Years Based on Precipitation Anomaly Percentage. China Rural Water Hydropower 2018, 431, 133–136+143. [Google Scholar]
  35. Wang, Q. Construction and application of evaluation index system of social and economic carrying capacity in Xiong’an New Area. J. Environ. Eng. Technol. 2022, 12, 1272–1279. [Google Scholar]
  36. Li, S.; Zhang, H.; Wang, L.; Zheng, G.; Guo, Y.; Gao, J. Winter Wheat Agrometeorological Drought Zoning and Analysis in Henan Province Based on Grid and Fuzzy Clustering Algorithm. J. Henan Agric. Sci. 2020, 49, 172–180. [Google Scholar]
  37. Saha, S.; Kundu, B.; Paul, G.C.; Mukherjee, K.; Pradhan, B.; Dikshit, A.; Maulud, K.N.A. Spatial assessment of drought vulnerability using fuzzy-analytical hierarchical process: A case study at the Indian state of Odisha. Geomat. Nat. Hazards Risk 2021, 12, 123–153. [Google Scholar] [CrossRef]
  38. Wang, C. Impact Assessment and Risk Evaluation of Agricultural Meteorological Hazards; Meteorological Publishing House: Beijing, China, 2010; pp. 82–86. [Google Scholar]
Figure 1. Map of the study area.
Atmosphere 14 00779 g001
Figure 2. Map of meteorological stations.
Atmosphere 14 00779 g002
Figure 3. Frequency distribution of winter wheat drought in Henan Province. (a) Frequency of light drought. (b) Frequency of moderate drought. (c) Frequency of severe and extreme drought.
Atmosphere 14 00779 g003
Figure 4. Distribution of winter wheat susceptibility in Henan Province. (a) Winter wheat susceptibility in 2011. (b) Winter wheat susceptibility in 2014. (c) Winter wheat susceptibility in 2017. (d) Winter wheat susceptibility in 2020.
Atmosphere 14 00779 g004
Figure 5. Distribution of winter wheat sensitivity in Henan Province. (a) Sensitivity of winter wheat in 2011. (b) Sensitivity of winter wheat in 2014. (c) Sensitivity of winter wheat in 2017. (d) Sensitivity of winter wheat in 2020.
Atmosphere 14 00779 g005
Figure 6. Distribution of drought resistance of winter wheat in Henan Province. (a) Drought resistance in winter wheat in 2011. (b) Drought resistance in winter wheat in 2014. (c) Drought resistance in winter wheat in 2017. (d) Drought resistance in winter wheat in 2020.
Atmosphere 14 00779 g006
Figure 7. Distribution of levels of winter wheat drought vulnerability in Henan Province. (a) Winter wheat drought vulnerability in 2011. (b) Winter wheat drought vulnerability in 2014. (c) Winter wheat drought vulnerability in 2017. (d) Winter wheat drought vulnerability in 2020.
Atmosphere 14 00779 g007aAtmosphere 14 00779 g007b
Figure 8. Relationship between average climate yield and average drought vulnerability index for winter wheat in Henan Province 2010–2020.
Atmosphere 14 00779 g008
Table 1. Data sources.
Data TypeData NameYearsSource
Raster dataTopographic data of Henan Province at 30 m intervals2021Geospatial Data Cloud
Statistical dataSocio-economic data2011, 2014, 2017, 2020Statistical Yearbook of Henan Province
Average annual precipitation; surface water resources; groundwater resources2011, 2014, 2017, 2020Water Resources Bulletin of Henan Province
Monthly precipitation data1991–2021Agro-meteorological big data platform
Table 2. Drought classification based on percentage precipitation anomaly.
ClassDrought TypePercentage Precipitation Anomaly Range (%)
(Annual Scale)
1No drought>−15
2Light drought−15–−30
3Moderate drought−30–−40
4Severe drought−40–−45
5Extreme drought<−45
Table 3. Drought vulnerability index system for winter wheat in Henan Province.
Target LevelDimensionIndicatorCharacteristic
Drought vulnerabilityU1. Degree of susceptibility, or exposure, of the drought-affected areaWheat planted area+
Wheat yield+
Average annual temperature+
Average annual precipitation
U2. Environmental–economic sensitivity of the drought-affected areaWinter wheat production value+
Per capita GDP
Urbanization rate
Percentage of total primary industry (GDP)+
U3. Drought resistance of the affected areaSurface water resources
Amount of underground water resources
Effective irrigated area
Amount of pesticide use
Rural electricity consumption
Total power of agricultural machinery
Net farmer income+
Note: + is a positive indicator, − is a negative indicator.
Table 4. Weights of drought vulnerability evaluation indicators for winter wheat in Henan Province.
Guideline LevelWeight
Susceptibility to drought0.38
Environmental–economic sensitivity0.36
Drought resistance0.26
Table 5. Winter wheat drought vulnerability by area in Henan Province (km2).
YearAreas of Mild VulnerabilityAreas of Average VulnerabilityAreas of Moderate VulnerabilityAreas of Severe VulnerabilityAreas of Extreme Vulnerability
201120,30918,77417,84738,84970,521
2014756728,65124,98364,37859,817
2017427125,26316,76563,26256,739
2020949835,47916,22467,88637,213
Disclaimer/Publisher’s Note: The statements, opinions and data contained in all publications are solely those of the individual author(s) and contributor(s) and not of MDPI and/or the editor(s). MDPI and/or the editor(s) disclaim responsibility for any injury to people or property resulting from any ideas, methods, instructions or products referred to in the content.

