Article

Characters of Particulate Matter and Their Relationship with Meteorological Factors during Winter Nanyang 2021–2022

1
Academy of Remote Sensing Technology and Application, Nanyang Normal University, Wolong Road No. 1638, Nanyang 473061, China
2
Key Laboratory of Natural Disaster and Remote Sensing of Henan Province, Nanyang Normal University, Wolong Road No. 1638, Nanyang 473061, China
3
Engineering Research Center of Environmental Laser Remote Sensing Technology and Application of Henan Province, Nanyang Normal University, Wolong Road No. 1638, Nanyang 473061, China
4
Teacher Education College, Beijing Language and Culture University, Xueyuan Road No. 15, Beijing 100083, China
5
School of Surveying and Land Information Engineering, Henan Polytechnic University, Jiaozuo 454000, China
*
Authors to whom correspondence should be addressed.
Atmosphere 2023, 14(1), 137; https://doi.org/10.3390/atmos14010137
Submission received: 11 December 2022 / Revised: 30 December 2022 / Accepted: 4 January 2023 / Published: 8 January 2023
(This article belongs to the Special Issue Novel Techniques for Measuring Greenhouse Gases (2nd Edition))

Abstract

:
The purpose of this study is to investigate the air quality levels of Nanyang city according to Chinese air quality standards. Therefore, in this study, fine particulate matter (PM2.5), coarse particulate matter (PM10), and total suspended particulate (TSP) were analyzed from 19 November 2021 to 19 March 2022 in Nanyang city. The results show that the average concentrations of PM2.5, PM10, and TSP were 106.47 µg/m3, 137.32 µg/m3, and 283.40 µg/m3, respectively. The numbers of days that meet the national secondary air quality standard of 24-h average concentrations were 29.75% for PM2.5, 63.64% for PM10, and 63.64% for TSP, indicating that most of the time, the air quality of Nanyang city remains polluted in winter, especially with more contributions of PM2.5 compared to PM10 and TSP. The higher concentrations were observed between 07:00 and 08:00, suggesting that vehicular emissions can be a major cause of air pollution in Nanyang city. The results also show a significant positive correlation between particulate matter and relative humidity, and a weak correlation with temperature and wind speed, which suggests that higher relative humidity increases the formation of particulate matter. This study can provide theoretical support for the local government to formulate air pollution prevention and control policies for Nanyang city.

1. Introduction

Aerosols are suspended systems of liquid or solid particles in the atmosphere [1,2]. The aerodynamic diameter of aerosol particles usually ranges from 0.01 to 100 μm, and their shapes can be subspherical, flaky, needle-like, or irregular [3]. Aerosols affect climate mainly through several mechanisms: first, atmospheric aerosols directly affect climate by scattering and absorbing short-wave and long-wave radiation [4,5,6,7]; second, aerosols can act as cloud condensation nuclei and ice nucleating particles affecting cloud microphysical characteristics, and cloud droplet number density, cloud phase, and cloud life cycle indirectly affect the climate system [8,9]; third, aerosol particles indirectly influence atmospheric chemical processes, thus changing other atmospheric components such as greenhouse gases [10,11,12,13,14,15]. Aerosols affect the climate as well as the surrounding ecological environment and human health [16]. With the advancement of scientific research, aerosols are closely related to many environmental problems such as haze and smog events [17,18]. The fine particulate matter PM2.5 (particle aerodynamic diameter is less than 2.5 μm) and PM10 (particle aerodynamic diameter is less than 10 μm) are considered as the main pollutants of air pollution and play an important role in regional and urban pollution space [19]. The increase of PM2.5 and PM10 in mass concentration can increase the extinction coefficient of the atmosphere and reduce the visibility through the atmosphere, leading to the occurrence of smog events, and harm the environment and human health, thus more and more attention has been paid to the study of particulate matters on hazy days [20,21,22,23,24].
The observation study of aerosols is a prerequisite for haze pollution management and prevention. In China, the rapid development of the economy and urbanization construction has led to a large number of anthropogenic pollutant emissions and several haze pollution episodes in recent decades. Scientists have conducted a large number of experimental studies on haze and have achieved many pioneering research results. PM2.5 concentrations during smog in Wuhan are 9.9 times higher than those during non-smog periods (333 versus 34 μg·m−3), which showed that the degree of haze pollution was very serious [25]. Li et al. studied the temporal and spatial distribution of PM2.5 and PM10 in Shen-yang, Northeast China. The relationship between PM and meteorological factors is discussed [26]. Li et al. used trajectory clustering potential source contribution function (PSCF) and concentration-weighted trajectories (CWT) methods to study transmission paths and potential sources of PM2.5 and PM10 in each season in Beijing [27]. Tao et al. found that increasing relative humidity can increase PM2.5 particle size, increase its extinction characteristics, and reduce visibility. At the same time, increased relative humidity also contributes to PM2.5 production [28]. At present, the haze in China is mainly distributed in the Beijing-Tianjin-Hebei region [29,30], the Yangtze River Delta region [31], and the Pearl River Delta region [28,32]; where the economy is developed and the level of anthropogenic pollutants emission is high, haze is responsible for a long-lasting wide range of highly concentrated aerosols.
In recent years, the Central Plains region of China has also experienced rapid economic development and urbanization, and air pollution events have been occurring. Located in Central China, Nanyang is a more developed city in southwestern Henan province and a strategic water source for the Chinese South-North Water Transfer Project. The city, located in the Nanyang Basin, has seen rapid economic development and frequent air pollution incidents in recent years. However, relatively few studies have been conducted on atmospheric particulate matter in Nanyang. Therefore, this study selects Nanyang as the experimental area and focuses on the concentration characteristics of PM2.5, PM10, and TSP, and the causes of and the relationship between particulate matter and meteorological factors during winter from 19 November 2021 to 19 March 2022.

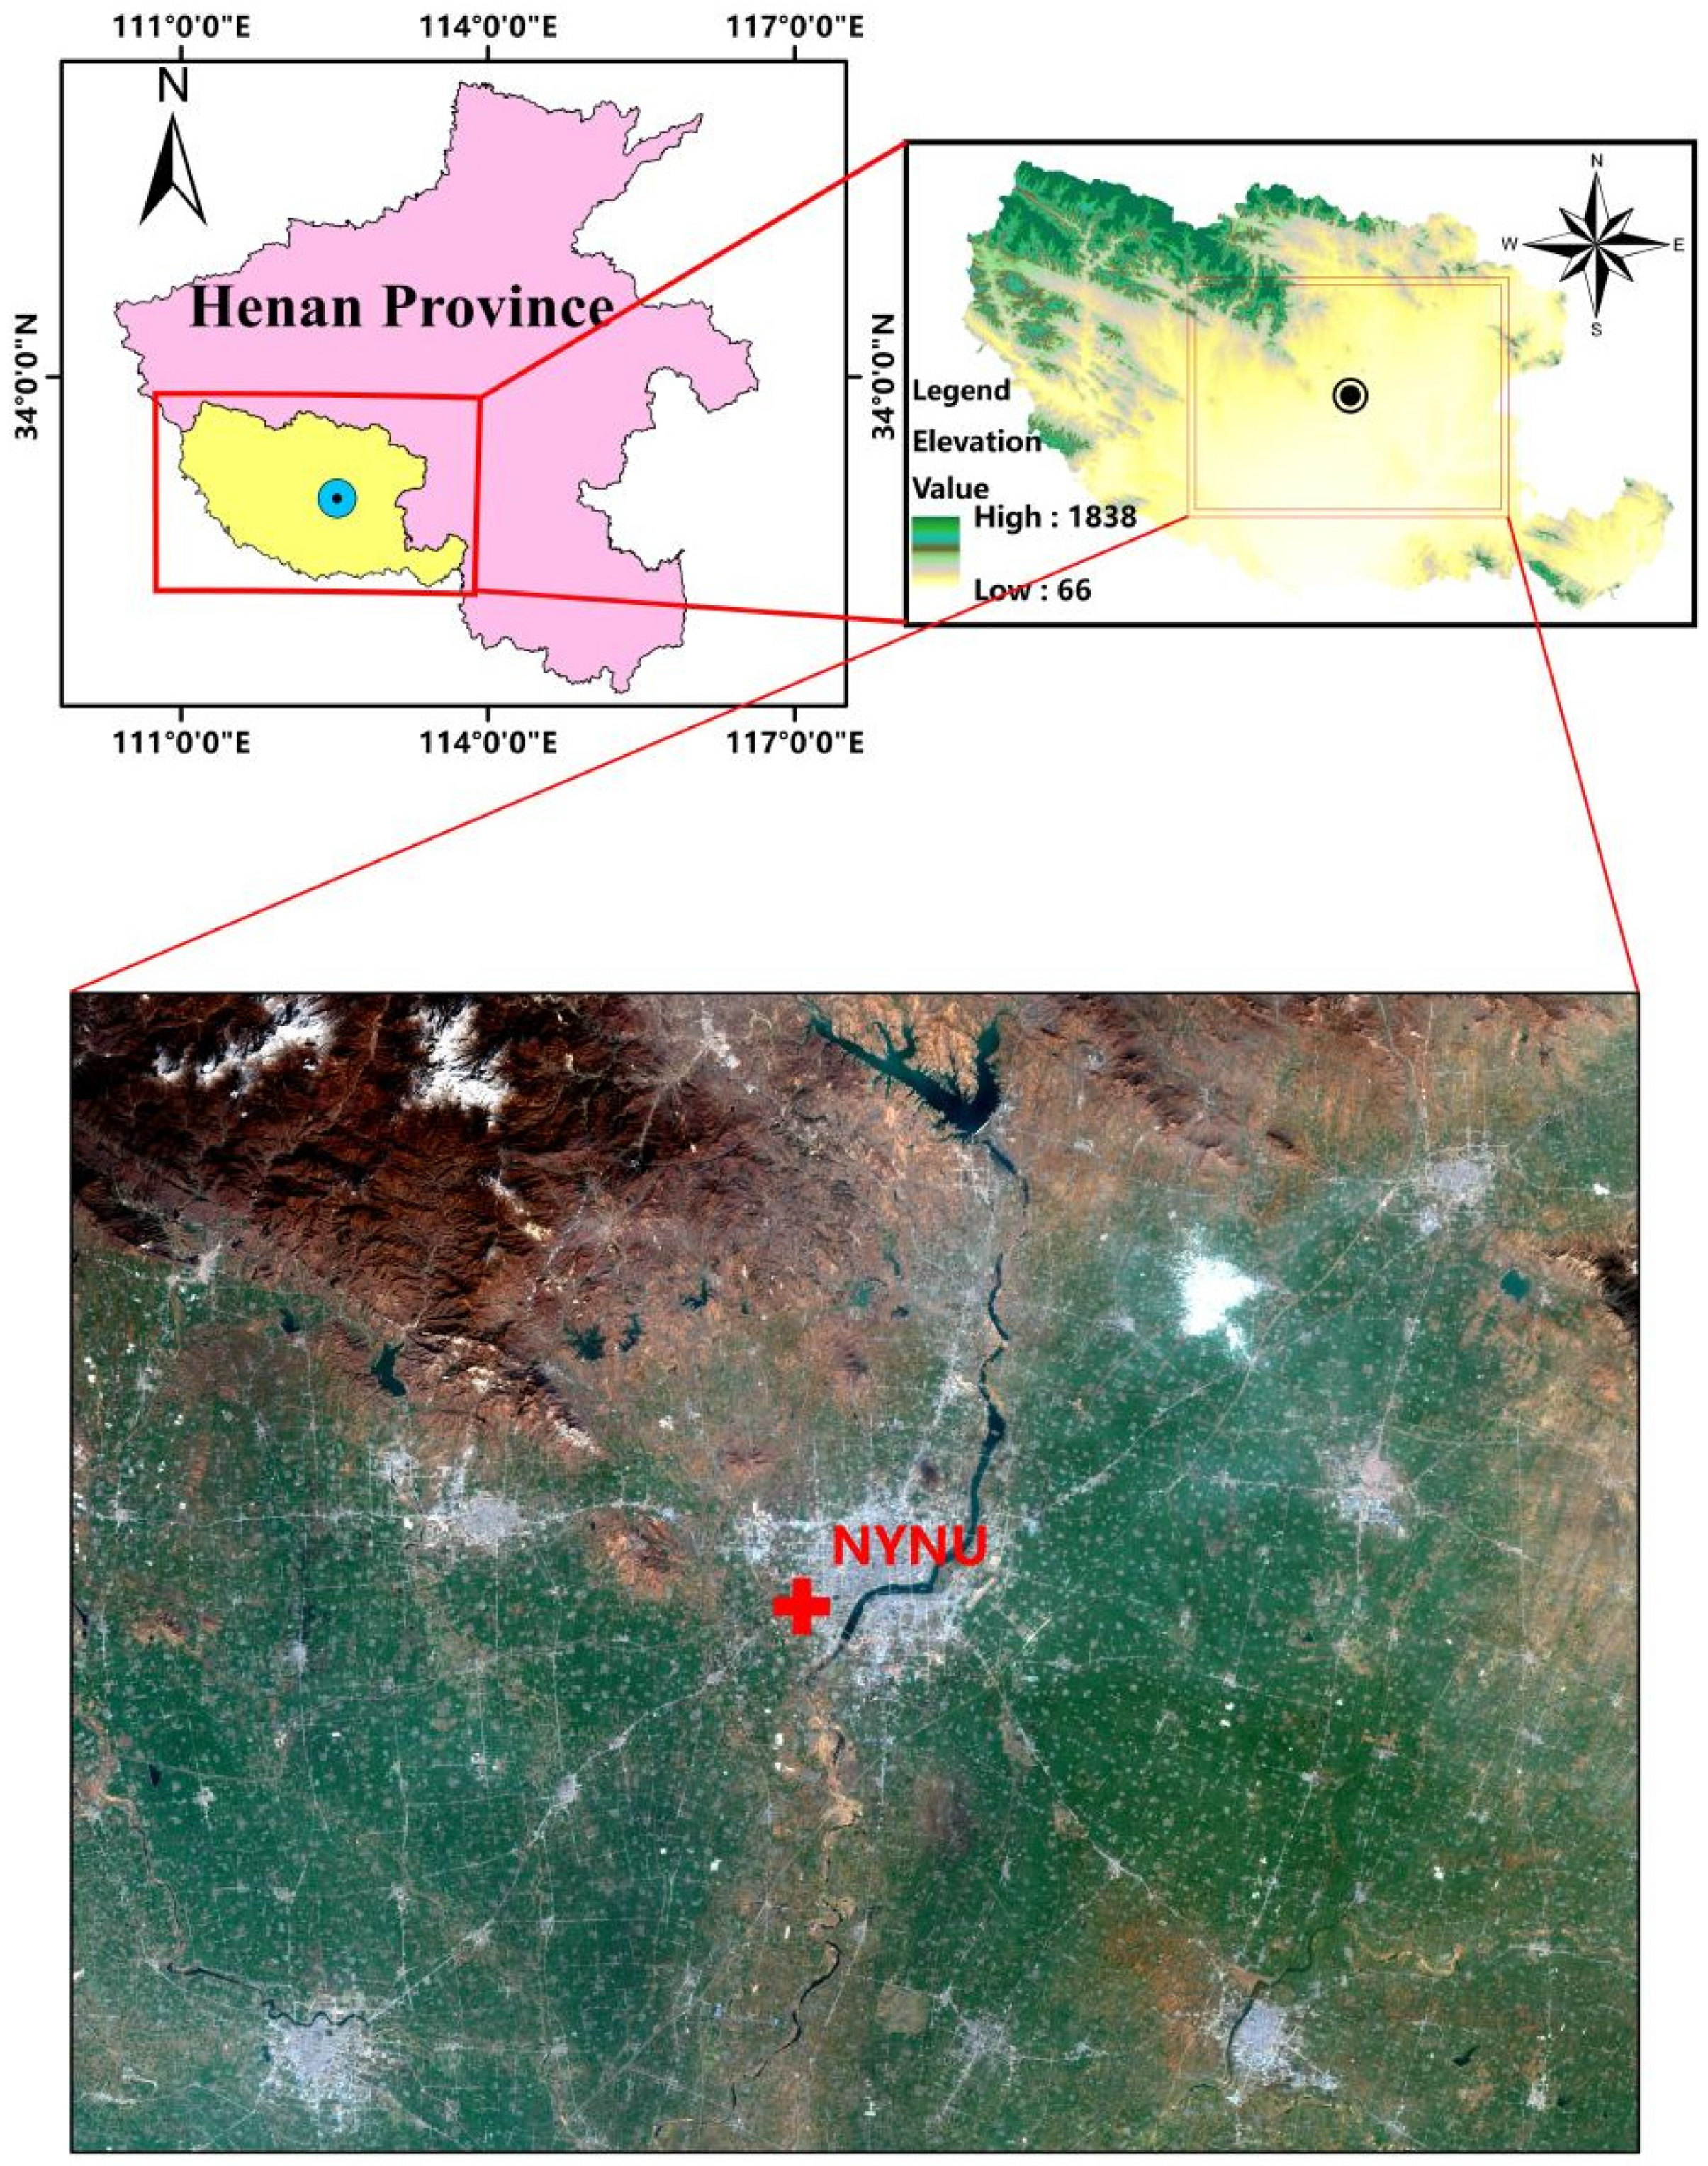
2. Materials and Methods

The air quality monitoring station is located in Nanyang, a city with an area of approximately 26,000 km2 and with a population of approximately 9,713,100 [33] in the southwest of Henan Province. It is at the intersection of the three provinces of Hubei, Henan, and Shanxi as well as the core of the geographic region formed by the three provincial capitals, i.e., Wuhan, Zhengzhou, and Xi’an. The climate is generally moderate and is a four-season humid subtropical climate, with strong monsoon influences: winters are cool but dry, and summers are hot and humid. Spring and autumn provide transitions of reasonable length.
The Nanyang Normal University Station (NYNU) was selected as the experimental site, which is located in the southwest suburb of Nanyang and the left bank area of the Baihe River (Figure 1). The air quality monitoring station comprises a particulate matter monitoring module and a meteorological element monitoring module. The particle monitoring module consists of a 2.5 μm sampling head and a 10 μm sampling head, which can continuously provide real-time measurements of TSP, PM2.5, and PM10 concentrations using the light scattering method, and data transmission to the background computer for storage. The measuring range of the data is 0–1000 μg/m3, and the minimum monitoring limit is ≤1 μg/m3. The meteorological element module includes five sensors that can provide real-time measurements of temperature, relative humidity, wind direction, wind speed, and air pressure. The measuring accuracy and range are given in Table 1.
The experimental period is from 19 November 2021 to 19 March 2022, which coincides with the high incidence of haze during winter in Nanyang and is conducive to the in-depth exploration of haze characteristics. In the study, we first used statistical methods to analyze the overall characteristics of PM2.5, PM10, TSP, and the meteorological factors (wind speed, wind direction, temperature, and relative humidity) in winter in Nanyang. Then, the characteristics of the day-to-day variation of these variables are studied, and the relationship between PM2.5, PM10, TSP, and the meteorological factors is discussed.

3. Results and Discussion

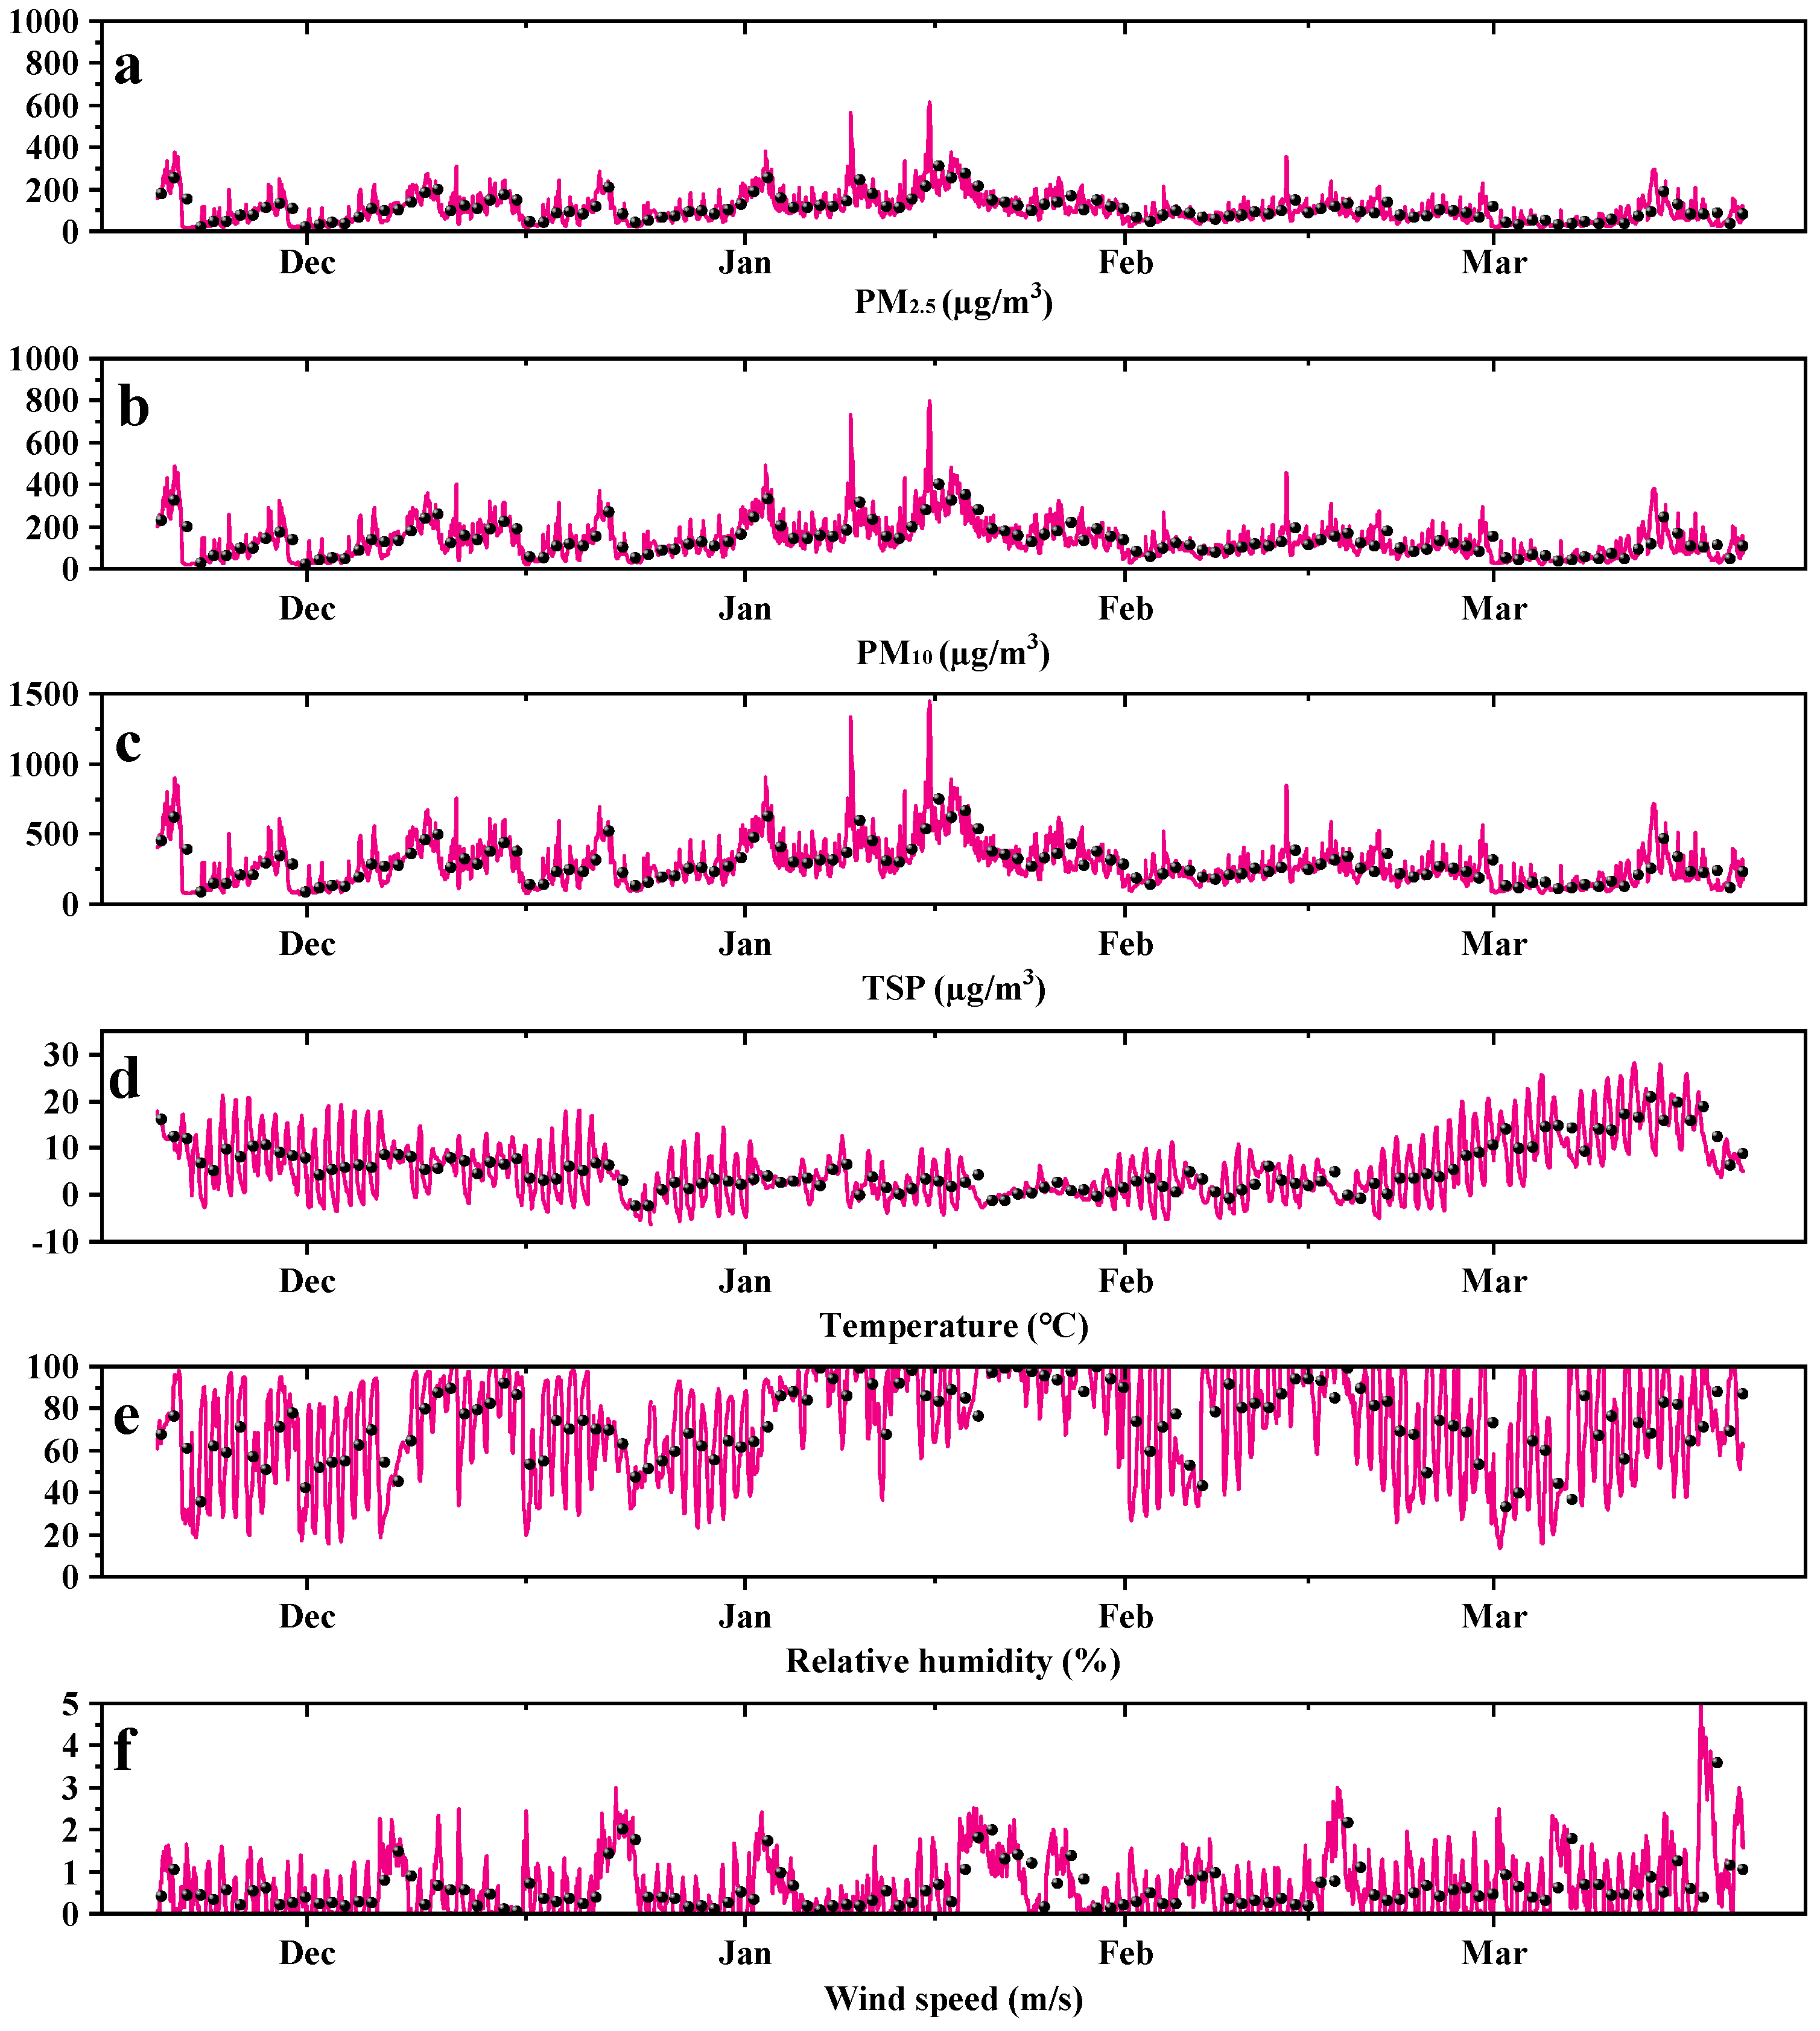
3.1. Temporal Behavior of Particulate Matters and Meteorological Factors

The temporal behaviors of PM2.5, PM10, TSP, temperature, relative humidity, and wind speed are shown in Figure 2, and the statistical information of the corresponding parameters is given in Table 2. In general, all six physical variables had certain daily cycle features; the features of PM2.5, PM10, and TSP were the same, and the mean concentrations of PM2.5, PM10, and TSP were 106 µg/m3, 137 µg/m3, and 283 µg/m3, respectively, indicating that concentrations of particulate matter were higher than the Chinese ambient air quality secondary standard (100 µg/m3 annual mean for PM10, 35 µg/m3 annual mean for PM2.5). The standard deviations of PM2.5, PM10, and TSP were 57 µg/m3, 74 µg/m3, and 131 µg/m3, respectively, indicating that concentrations of particulate matter had more dramatic changes during the observation period. In January 2018, the mean PM2.5 mass concentration in Wuhan was 170 µg/m3 during polluted weather, which was higher than the four-month mean PM2.5 mass concentration observed in this study [34]. At the NYNU site, a heavy pollution event occurred from 16 to 20 January 2022, and the maximum concentrations of PM2.5, PM10, and TSP were 309 µg/m3, 399 µg/m3, and 747 µg/m3, respectively, which were 2.9, 2.9, and 2.6 times, respectively, that of the average concentrations throughout the winter season. This indicates that the mean particulate matter concentrations in the Nanyang area during the severe winter haze were very high. This severe haze event was similar to what was experienced in Wuhan in June 2012, when the PM2.5 concentrations reached 333 µg/m3, which was 9.9 times higher than the PM2.5 mass concentration during normal days [25].
Nanyang is located on the dividing line of the zero degrees isotherm in January in China, with an average temperature of 6 °C and average relative humidity of 73% in winter. This indicates that the winter temperature in Nanyang is relatively low and the relative humidity is relatively high. The lower temperature is not conducive to atmospheric convection, resulting in a lower atmospheric boundary layer height and an increase in particulate matter concentration [35]. The higher relative humidity is conducive to the hygroscopic growth of aerosols, which increases concentration. The higher relative humidity is also conducive to the occurrence of optical secondary reactions of polluting gases and the formation of new aerosol particles, which also increases the particulate matter mass concentration and aggravates the air pollution level. At the same time, the average wind speed (WS) was lower (1 m/s), and the main prevailing wind direction was southeast (26% relative frequency) and east (22.5% relative frequency) (Figure 3). This could be related to the topography of Nanyang as it belongs to the basin terrain, surrounded by mountains on three sides (Qinling mountain range in the northwest, Fuyu mountain range in the north, and fewer mountains in the southwest). Low wind speed is not conducive to the transport and dispersion of pollutants, which might contribute to haze pollution events. Therefore, the meteorological and topographical factors of Nanyang could be one of the triggers for the local haze pollution events.
Figure 4 shows the relative frequency and cumulative frequency distribution of each variable of particulate matter and meteorology during the experimental period. Skewness is a measure of the direction and degree of skewness of the data distribution, indicating the degree of asymmetry of the density curve of the probability distribution relative to the mean, which intuitively appears to be the relative length of the tail of the density function curve. The normal distribution has a skewness of zero; there is a positive skewness if the data distribution is skewed to the left, and a negative skewness if the data distribution is skewed to the right. As given in Table 2, skewness values of PM2.5, PM10, TSP, WS, T, and RH were 1.10, 1.09, 1.09, 2.34, 0.98, −0.32, respectively, indicating that distributions of all variables are skewed to the left, except for the relative humidity, which is skewed to the right. As shown in Figure 5, concentrations of PM2.5 were mainly concentrated in the range of 25~150 μg/m³, with a relative frequency of 75%; concentrations of PM10 were mainly concentrated in the range of 25~200 μg/m³, with a relative frequency of 79%; concentrations of TSP were mainly concentrated in the range of 100~375 μg/m³, with a relative frequency of 79%. The distribution of T (°C) was mainly concentrated between −2.5~10 °C, with a relative frequency of 86%; RH (%) is mainly concentrated between 80%~100%, with a relative frequency of 54%, indicating that the relative humidity is high during winter. WS (m/s) is mainly concentrated between 0~0.5 m/s, with a relative frequency of 56%, indicating a low wind speed value during winter.
Table 3 presents PM2.5 and PM10 concentrations observed at several stations in China, including urban and rural stations. The mean and standard deviation of PM2.5 and PM10 in winter at the NYNU site were 106 ± 57μg/m3 and 137 ± 74 μg/m3, respectively. As mentioned, PM2.5 and PM10 concentrations exceeded the Chinese national secondary standard, which was nearly equivalent to the concentrations in Beijing (108 μg/m3 for PM2.5, 172 μg/m3 for PM10) [32], but was lower than other major cities during periods of haze pollution, such as Wuhan (170 μg/m3 for PM2.5) [34] and Nanjing (222 μg/m3 for PM2.5, 316 μg/m3 for PM10) [36]. This suggests that the air pollution level in Nanyang city was comparably moderate. The mean PM2.5/PM10 ratio of 0.77 indicates the presence of mainly PM2.5 compared to PM10, and this result is consistent with the findings of Zhang et al. [33]. The mean value of PM2.5/PM10 in mainland Chinese cities was 0.67, which is also similar to our result [37].

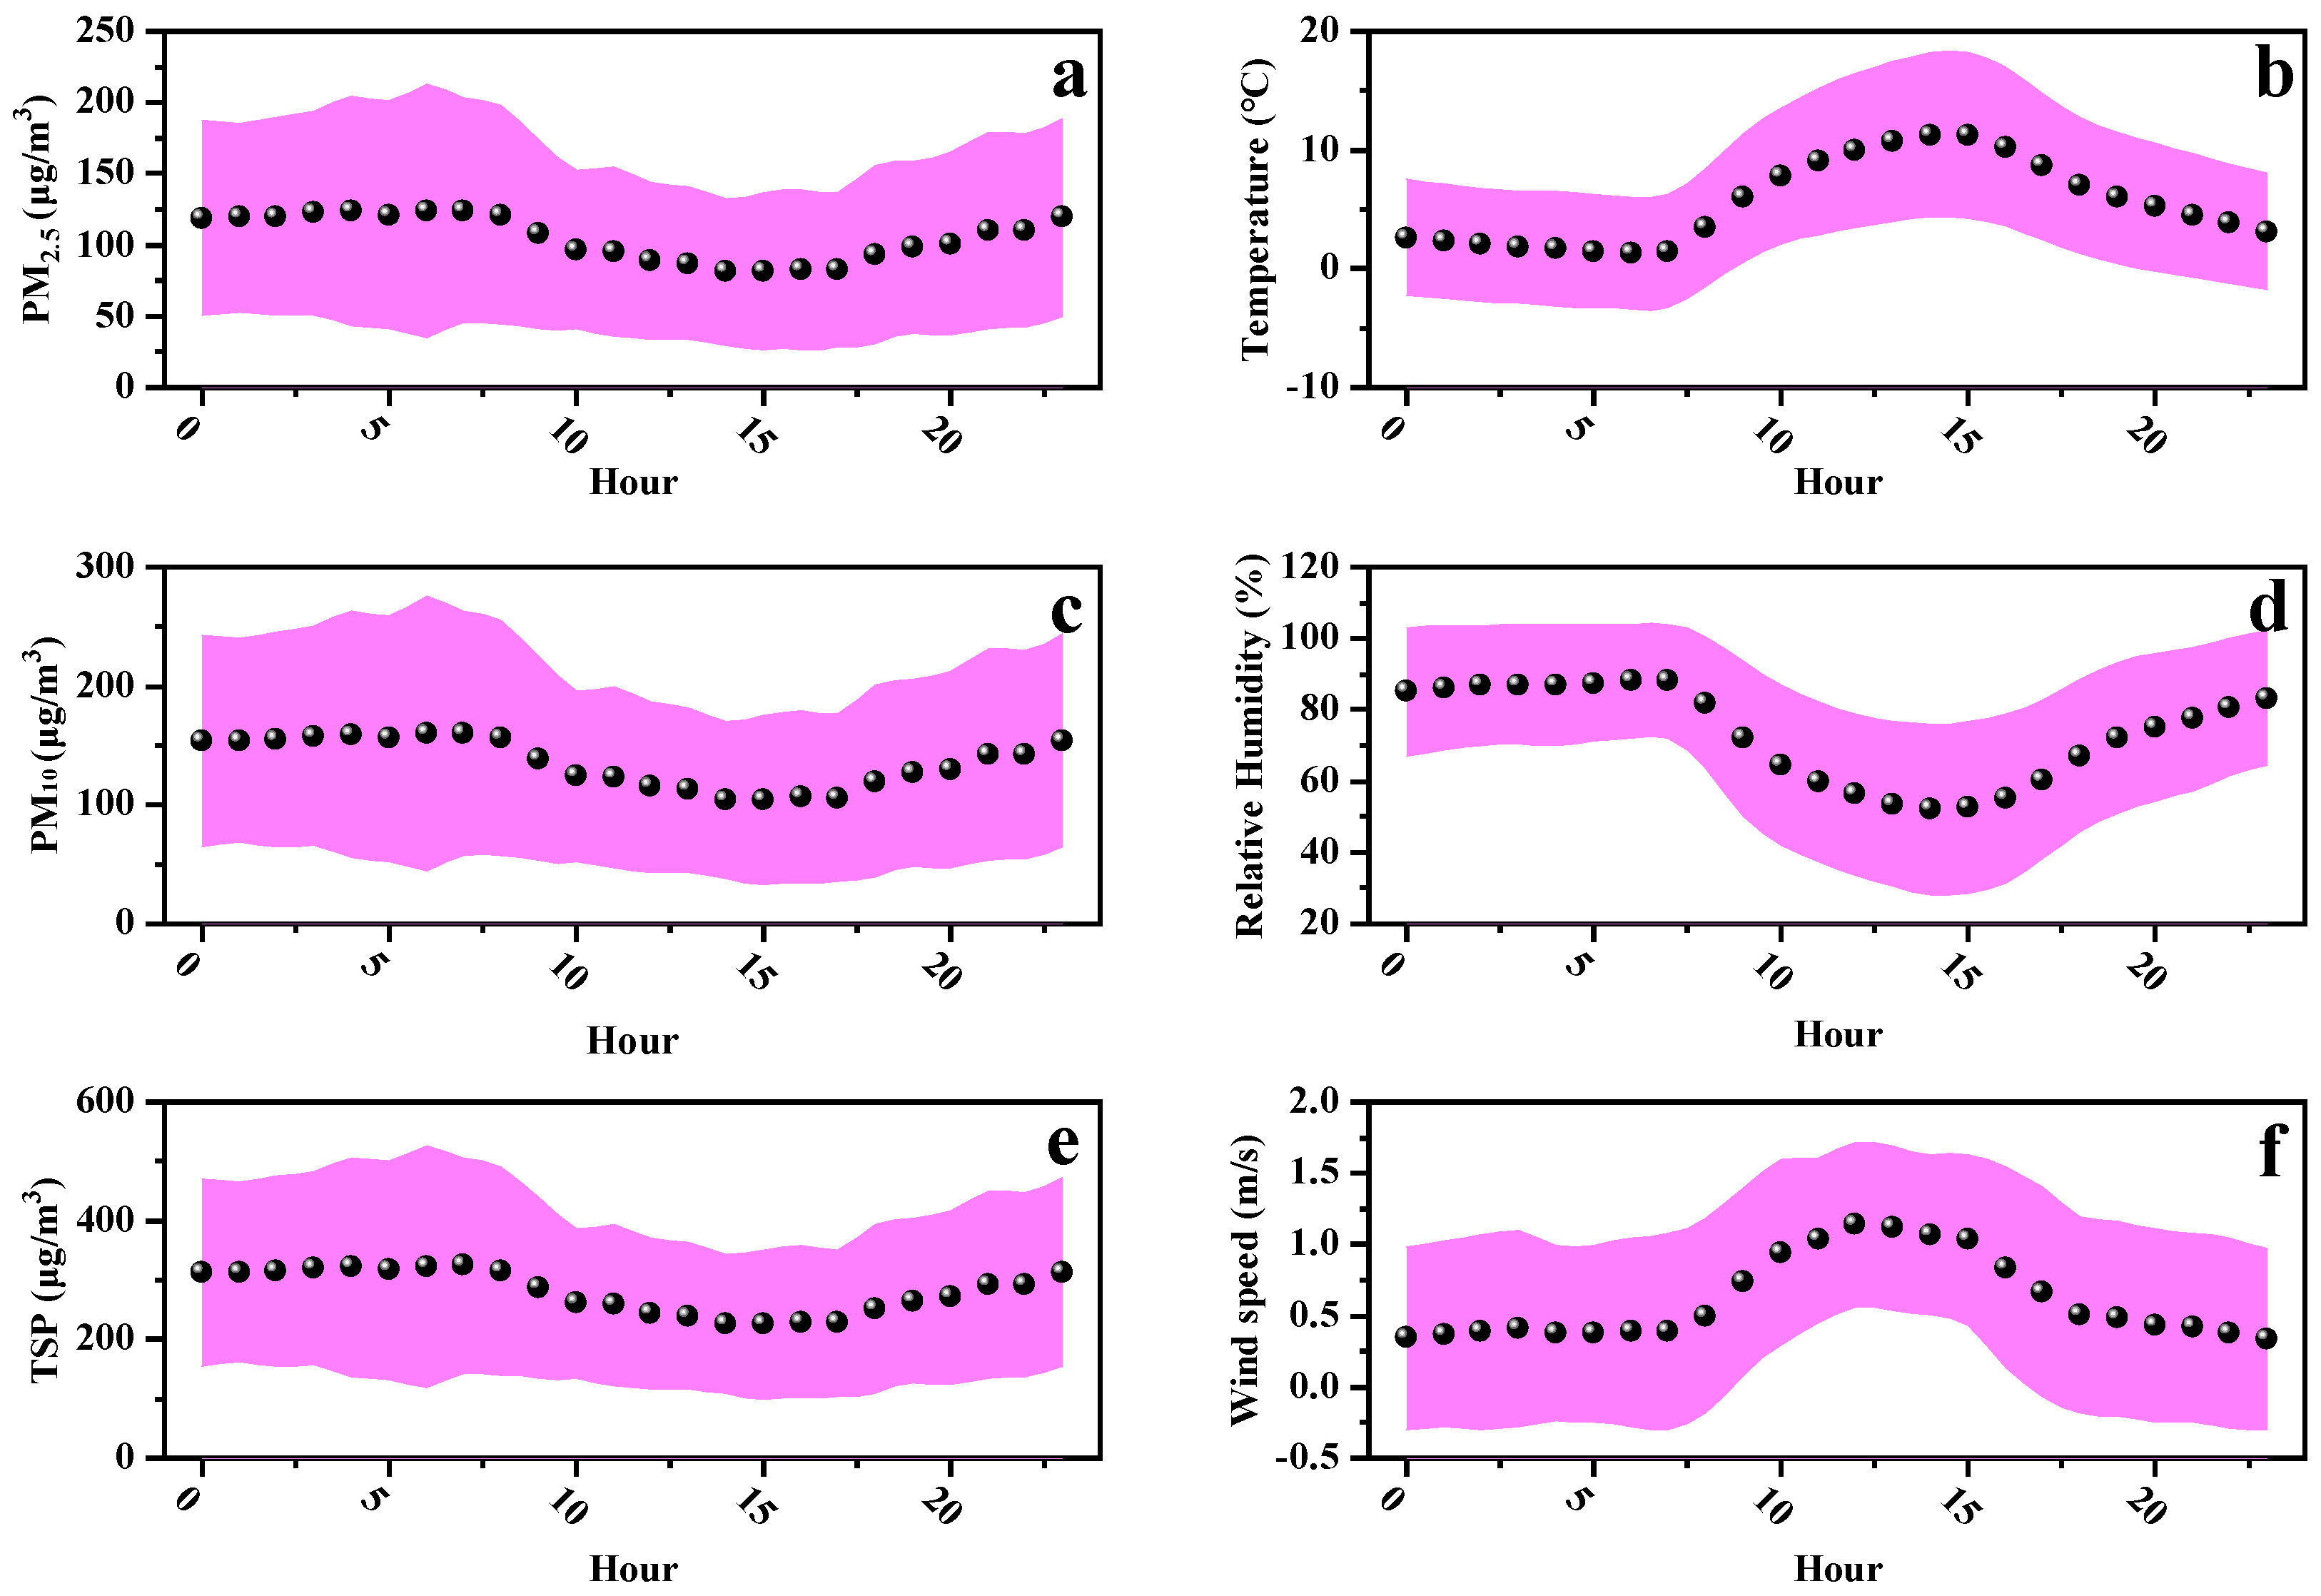
3.2. Diurnal Variation of Particle Concentrations and Meteorological Factors

Figure 5 shows the daily variability of each variable at the NYNU monitoring station during the experimental period. From Figure 5a,c,e, it can be seen that the concentrations of PM2.5, PM10, and TSP peaked from 7:00 a.m. to 8:00 a.m. with 124 μg/m3, 160 μg/m3, and 324 μg/m3, respectively. The NYNU monitoring station was located near the commercial area of Wolong Road, and staff would come to work on campus from 7:00 a.m. to 8:00 a.m. The morning rush hour and enhanced commercial activities led to the discharge of pollutants in the morning [41]. In addition, relative humidity also reaches the maximum value (88%) during the morning (7:00 a.m. to 8:00 a.m.). The increase in relative humidity might be responsible for photochemical reactions and the generation of secondary aerosol particulate matter, which could also increase aerosol concentrations. At the same time, the low wind speed (~0.5 m/s) in the morning causes a continuous accumulation of particulate matter. PM2.5, PM10, and TSP begin to decrease after the morning peak and reach the lowest value level of 81 μg/m3, 105 μg/m3, and 226 μg/m3, respectively, at 14:00–18:00 local time. The reason could mainly be that the temperature rises from 14:00–18:00 and the wind speed accelerates, which leads to the atmospheric boundary layer being lifted, diluting the concentration of particulate matter [27]; similarly, particulate matter was also blown away by the increased wind speed. The relative humidity also reached the minimum of the day (52%) from 14:00 to 18:00, the secondary aerosol production efficiency decreased, and the mass concentration of particulate matter decreased. At 18:00–24:00, the concentration of particulate matter gradually increased, and was maintained at a very high level from 0:00 to 8:00 a.m., which was mainly due to the lower temperature and lower altitude of the atmospheric boundary layer at night, leading aerosols to gather in the lower space. At the same time, during the night time, the wind speed also gradually weakened, which was not conducive to the dispersion of particulate matter, increasing particulate matter concentrations.

3.3. Relationship between Particulate Matter Concentrations and Meteorological Parameters

The relationships between mass concentrations of PM2.5, PM10, TSP, and temperature, relative humidity, and wind speed are shown in Figure 6. By studying the relationship between the concentration of particulate matter and meteorological factors, we can identify the main influencing factors that affect the mass concentration of particulate matter in the atmosphere. As shown in Figure 6, each small red dot on the graph represents the daily average value of each variable. In Figure 6, the correlation coefficients (R) of temperature, humidity, and wind speed with PM2.5, PM10, and TSP are −0.17, −0.17, −0.17, 0.53, 0.53, 0.53, and 0.10, 0.10, 0.10, respectively, indicating that the values of PM2.5, PM10, and TSP show a weak negative correlation with temperature, a relatively strong positive correlation with humidity, and a weak positive correlation with wind speed. Therefore, relative humidity is the most important influencing factor on the mass concentration of particulate matter during winter for the NYNU site. The increase in relative humidity could induce photochemical reactions and produce secondary aerosol particulate matter in the atmosphere. In winter, the temperature and wind speed at NYNU were always low, so the temperature and wind speed have little influence on PM mass concentrations. In the study of Bai et al., when RH reached 90–100% high values, the aerosol scattering coefficient, absorption coefficient, extinction coefficient, and SSA are also at high values, indicating that high relative humidity can promote the formation of PM [34]. Similarly, in the study of Zhang et al., a high correlation was found between relative humidity and PM mass concentration at the TC suburban site, which is mainly due to the high relative humidity that accelerated the photochemical reaction in the atmosphere, generating secondary aerosols in winter [33]. Similar results were also found in other cities, such as Beijing [27,42], Shanghai [40,43], and Guangzhou [28,44].

4. Conclusions

To investigate the characteristics of winter aerosols in Nanyang (China) and their influencing factors, we conducted a four-month observation experiment at the NYNU station of Nanyang Normal University to deeply investigate the relationship between winter aerosols and meteorological parameters. This study can provide theoretical support and valuable data support for government decision-makers as well as related researchers. The relevant conclusions are as follows:
(1) During the whole experimental cycle, the overall concentrations of PM2.5, PM10, and TSP monitored at this site were 106 (μg/m3), 137 (μg/m3), and 283 (μg/m3), respectively, on average. The number of days that meet the national secondary standard 24-h average mass concentration of PM2.5 accounts for approximately 30%, PM10 accounts for approximately 64%, and TSP accounts for approximately 64%. The sources and distribution of aerosols in Nanyang are mainly determined by anthropogenic emissions, such as dust from industrial and agricultural production, waste gas from fossil fuel combustion, and vehicle exhaust from transportation.
(2) The mass concentrations of PM2.5, PM10, and TSP at NYNU station are mainly due to commercial activities and vehicle emissions. At the NYNU station, the type of particulate matter is dominated by fine particulate matter (PM2.5). Meanwhile, the mass concentrations of PM2.5, PM10, and TSP at NYNU station are mainly concentrated in the morning from 7:00 to 8:00 a.m. LT due to the increase of pollutant emissions in the morning rush hour.
(3) The mass concentrations of PM2.5, PM10, and TSP in Nanyang in winter showed significant positive correlations with relative humidity and weak correlations with temperature and wind speed. This suggests that higher relative humidity in Nanyang in winter could increase the formation of particulate matter.

Author Contributions

Conceptualization, M.Z.; methodology, M.Z. and S.C.; software, S.G., F.Z. and Y.W.; validation, J.C., X.Z. and P.Q.; formal analysis, M.Z.; investigation, M.Z. and M.B.; resources, M.Z.; data curation, M.Z.; writing—original draft preparation, M.Z.; writing—review and editing, M.B. and M.C.; visualization, M.Z.; supervision, F.L.; project administration, M.Z.; funding acquisition, M.Z. All authors have read and agreed to the published version of the manuscript.

Funding

This research was funded by the Key Scientific Research Project of Henan institutions of higher learning, grant number 22B170004; the Nanyang Normal University Scientific Research Project, grant number 2020QN033.

Institutional Review Board Statement

Not applicable.

Informed Consent Statement

Not applicable.

Data Availability Statement

Not applicable.

Acknowledgments

We thank the editors for assisting in the linguistic refinement of this manuscript.

Conflicts of Interest

The authors declare no conflict of interest.

References

  1. Kaufman, Y.J.; Tanré, D.; Boucher, O. A satellite view of aerosols in the climate system. Nature 2002, 419, 215–223. [Google Scholar] [CrossRef]
  2. Ramanathan, V.; Crutzen, P.J.; Kiehl, J.T.; Rosenfeld, D. Aerosols, Climate, and the Hydrological Cycle. Science 2001, 294, 2119–2124. [Google Scholar] [CrossRef] [Green Version]
  3. Jocelyn, K.; Granmar, M. Mounting Evidence Indicts Fine-Particle Pollution. Science 2005, 307, 1858–1861. [Google Scholar]
  4. Jacobson, M.Z. Strong radiative heating due to the mixing state of black carbon in atmospheric aerosols. Nature 2001, 409, 695–697. [Google Scholar] [CrossRef]
  5. Edenhofer, O. Climate Change 2014: Mitigation of Climate Change: Working Group Iii Contribution to the Fifth Assessment Report of the Intergovernmental Panel on Climate Change; Cambridge University Press: Cambridge, UK, 2014. [Google Scholar]
  6. Cappa, C.D.; Onasch, T.B.; Massoli, P.; Worsnop, D.R.; Bates, T.S.; Cross, E.S.; Davidovits, P.; Hakala, J.; Hayden, K.L.; Jobson, B.T.; et al. Radiative Absorption Enhancements Due to the Mixing State of Atmospheric Black Carbon. Science 2012, 337, 1078. [Google Scholar] [CrossRef] [PubMed] [Green Version]
  7. Kulmala, M.; Kontkanen, J.; Junninen, H.; Lehtipalo, K.; Manninen, H.E.; Nieminen, T.; Petäjä, T.; Sipilä, M.; Schobesberger, S.; Rantala, P.; et al. Direct Observations of Atmospheric Aerosol Nucleation. Science 2013, 339, 943–946. [Google Scholar] [CrossRef]
  8. Ackerman, A.S.; Kirkpatrick, M.P.; Stevens, D.E.; Toon, O.B. The impact of humidity above stratiform clouds on indirect aerosol climate forcing. Nature 2004, 432, 1014–1017. [Google Scholar] [CrossRef] [PubMed] [Green Version]
  9. Albrecht, B.A. Aerosols, Cloud Microphysics, and Fractional Cloudiness. Science 1989, 245, 1227–1230. [Google Scholar] [CrossRef]
  10. Crutzen, P.J.; Andreae, M.O. Biomass Burning in the Tropics: Impact on Atmospheric Chemistry and Biogeochemical Cycles. Science 1990, 250, 1669–1678. [Google Scholar] [CrossRef] [PubMed]
  11. Meng, Z.; Dabdub, D.; Seinfeld, J.H. Chemical Coupling Between Atmospheric Ozone and Particulate Matter. Science 1997, 277, 116–119. [Google Scholar] [CrossRef] [Green Version]
  12. Shi, T.; Han, G.; Ma, X.; Gong, W.; Chen, W.; Liu, J.; Zhang, X.; Pei, Z.; Gou, H.; Bu, L. Quantifying CO2 Uptakes Over Oceans Using LIDAR: A Tentative Experiment in Bohai Bay. Geophys. Res. Lett. 2021, 48, e2020GL091160. [Google Scholar] [CrossRef]
  13. Shi, T.; Han, G.; Ma, X.; Zhang, M.; Pei, Z.; Xu, H.; Qiu, R.; Zhang, H.; Gong, W. An inversion method for estimating strong point carbon dioxide emissions using a differential absorption Lidar. J. Clean. Prod. 2020, 271, 122434. [Google Scholar] [CrossRef]
  14. Pei, Z.; Han, G.; Ma, X.; Shi, T.; Gong, W. A Method for Estimating the Background Column Concentration of CO2 Using the Lagrangian Approach. IEEE Trans. Geosci. Remote Sens. 2022, 60, 1–12. [Google Scholar] [CrossRef]
  15. Qiu, R.; Li, X.; Han, G.; Xiao, J.; Ma, X.; Gong, W. Monitoring drought impacts on crop productivity of the U.S. Midwest with solar-induced fluorescence: GOSIF outperforms GOME-2 SIF and MODIS NDVI, EVI, and NIRv. Agric. For. Meteorol. 2022, 323, 109038. [Google Scholar] [CrossRef]
  16. Kaiser, J. How Dirty Air Hurts the Heart. Science 2005, 307, 1858–1859. [Google Scholar] [CrossRef]
  17. Huang, R.J.; Zhang, Y.; Bozzetti, C.; Ho, K.F.; Cao, J.J.; Han, Y.; Daellenbach, K.R.; Slowik, J.G.; Platt, S.M.; Canonaco, F.; et al. High secondary aerosol contribution to particulate pollution during haze events in China. Nature 2014, 514, 218–222. [Google Scholar] [CrossRef] [Green Version]
  18. Zhang, Q.; Jiang, X.; Tong, D.; Davis, S.J.; Zhao, H.; Geng, G.; Feng, T.; Zheng, B.; Lu, Z.; Streets, D.G.; et al. Transboundary health impacts of transported global air pollution and international trade. Nature 2017, 543, 705–709. [Google Scholar] [CrossRef] [Green Version]
  19. Ambade, B. Characterization of PM10 over Urban and Rural Sites of Rajnandgaon, Central India. Nat. Hazards 2016, 80, 589–604. [Google Scholar] [CrossRef]
  20. Ding, A.; Huang, X.; Nie, W.; Chi, X.; Xu, Z.; Zheng, L.; Xu, Z.; Xie, Y.; Qi, X.; Shen, Y.; et al. Significant Reduction of PM2.5 in Eastern China Due to Regional-Scale Emission Control: Evidences from the Sorpes Station, 2011–2018. Atmos. Chem. Phys. 2019, 19, 11791–11801. [Google Scholar] [CrossRef] [Green Version]
  21. Cao, J.; Xu, H.; Xu, Q.; Chen, B.; Kan, H. Fine Particulate Matter Constituents and Cardiopulmonary Mortality in a Heavily Polluted Chinese City. Environ. Health Perspect. 2012, 120, 373–378. [Google Scholar] [CrossRef] [Green Version]
  22. Ding, A.; Nie, W.; Huang, X.; Chi, X.; Sun, J.; Kerminen, V.-M.; Xu, Z.; Guo, W.; Petäjä, T.; Yang, X.; et al. Long-term observation of air pollution-weather/climate interactions at the SORPES station: A review and outlook. Front. Environ. Sci. Eng. 2016, 10, 15. [Google Scholar] [CrossRef]
  23. Wang, R.K.; Pathak, W.S.; Wu, T. Summertime PM2.5 Ionic Species in Four Major Cities of China: Nitrate Formation in an Ammonia-Deficient Atmosphere. Atmos. Chem. Phys. 2009, 9, 1711–1722. [Google Scholar]
  24. Basant, S.; Balram, A. Review on Composition, Emission Sources of Rspm, Tspm, Heavy Metals and Ions with Effect on Environment and Health. Res. J. Chem. Environ. 2016, 20, 31–43. [Google Scholar]
  25. Zhang, M.; Ma, Y.; Gong, W.; Zhu, Z. Aerosol Optical Properties of a Haze Episode in Wuhan Based on Ground-Based and Satellite Observations. Atmosphere 2014, 5, 699–719. [Google Scholar] [CrossRef] [Green Version]
  26. Li, X.; Ma, Y.; Wang, Y.; Liu, N.; Hong, Y. Temporal and spatial analyses of particulate matter (PM10 and PM2.5) and its relationship with meteorological parameters over an urban city in northeast China. Atmos. Res. 2017, 198, 185–193. [Google Scholar] [CrossRef]
  27. Li, D.; Cheng, Y.; Liu, J.; Zhang, J.; Gui, H.; Du, P.; Yu, T.; Wang, J.; Lu, Y.; Liu, W. Identification of Long-Range Transport Pathways and Potential Sources of PM2.5 and PM10 in Beijing from 2014 to 2015. J. Environ. Sci. 2017, 56, 214–229. [Google Scholar] [CrossRef]
  28. Tao, J.; Zhang, L.; Zhang, Z.; Huang, R.; Wu, Y.; Zhang, R.; Cao, J.; Zhang, Y. Control of PM2.5 in Guangzhou during the 16th Asian Games period: Implication for hazy weather prevention. Sci. Total. Environ. 2015, 508, 57–66. [Google Scholar] [CrossRef]
  29. He, K.; Yang, F.; Ma, Y.; Zhang, Q.; Yao, X.; Chan, C.K.; Cadle, S.; Chan, T.; Mulawa, P. The Characteristics of PM2.5 in Beijing, China. Atmos. Environ. 2001, 35, 4959–4970. [Google Scholar] [CrossRef]
  30. Lang, J.; Zhang, Y.; Zhou, Y.; Cheng, S.; Chen, D.; Guo, X.; Chen, S.; Li, X.; Xing, X.; Wang, H. Trends of PM2.5 and Chemical Composition in Beijing, 2000–2015. Aerosol Air Qual. Res. 2017, 17, 412–425. [Google Scholar] [CrossRef] [Green Version]
  31. Ding, A.J.; Fu, C.B.; Yang, X.Q.; Sun, J.N.; Zheng, L.F.; Xie, Y.N.; Herrmann, E.; Nie, W.; Petäjä, T.; Kerminen, V.-M.; et al. Ozone and fine particle in the western Yangtze River Delta: An overview of 1 yr data at the SORPES station. Atmospheric Meas. Tech. 2013, 13, 5813–5830. [Google Scholar] [CrossRef] [Green Version]
  32. Zhang, H.; Wang, Y.; Hu, J.; Ying, Q.; Hu, X.-M. Relationships between meteorological parameters and criteria air pollutants in three megacities in China. Environ. Res. 2015, 140, 242–254. [Google Scholar] [CrossRef] [PubMed]
  33. Zhang, M.; Wu, D.; Su, B.; Bilal, M.; Li, Y.; Li, B.L. Spatio-Temporal Characteristics of PM2.5, PM10, and Aod over Canal Head Taocha Station, Henan Province. Remote Sens. 2020, 12, 3432. [Google Scholar] [CrossRef]
  34. Bai, D.; Wang, H.; Tan, Y.; Yin, Y.; Wu, Z.; Guo, S.; Shen, L.; Zhu, B.; Wang, J.; Kong, X. Optical Properties of Aerosols and Chemical Composition Apportionment under Different Pollution Levels in Wuhan during January 2018. Atmosphere 2019, 11, 17. [Google Scholar] [CrossRef]
  35. Bilal, M.; Mhawish, A.; Nichol, J.E.; Qiu, Z.; Nazeer, M.; Ali, M.A.; de Leeuw, G.; Levy, R.C.; Wang, Y.; Chen, Y.; et al. Air Pollution Scenario over Pakistan: Characterization and Ranking of Extremely Polluted Cities Using Long-Term Concentrations of Aerosols and Trace Gases. Remote Sens. Environ. 2021, 264, 112617. [Google Scholar] [CrossRef]
  36. Wang, G.; Wang, H.; Yu, Y.; Gao, S.; Feng, J.; Gao, S.; Wang, L. Chemical Characterization of Water-Soluble Components of PM10 and PM2.5 Atmospheric Aerosols in Five Locations of Nanjing, China. Atmos. Environ. 2003, 37, 2893–2902. [Google Scholar] [CrossRef]
  37. Ma, Y.; Wang, Z.; Tan, Y.; Xu, S.; Kong, S.; Wu, G.; Wu, X.; Li, H. Comparison of Inorganic Chemical Compositions of Atmospheric Tsp, PM10 and PM2.5 in Northern and Southern Chinese Coastal Cities. J. Environ. Sci. 2017, 55, 339–353. [Google Scholar] [CrossRef] [PubMed]
  38. Li, Y.; Chen, Q.; Zhao, H.; Wang, L.; Tao, R. Variations in PM10, PM2.5 and PM1.0 in an Urban Area of the Sichuan Basin and Their Relation to Meteorological Factors. Atmosphere 2015, 6, 150–163. [Google Scholar] [CrossRef] [Green Version]
  39. Ho, K.F.; Lee, S.C.; Chan, C.K.; Jimmy, C.Y.; Chow, J.C.; Yao, X.H. Characterization of Chemical Species in PM2.5 and PM10 Aerosols in Hong Kong. Atmos. Environ. 2003, 37, 31–39. [Google Scholar] [CrossRef]
  40. Chen, J.; Tan, M.; Li, Y.; Zheng, J.; Zhang, Y.; Shan, Z.; Zhang, G.; Li, Y. Characteristics of Trace Elements and Lead Isotope Ratios in PM2.5 from Four Sites in Shanghai. J. Hazard. Mater. 2008, 156, 36–43. [Google Scholar] [CrossRef]
  41. Gong, W.; Zhang, M.; Han, G.; Ma, X.; Zhu, Z. An Investigation of Aerosol Scattering and Absorption Properties in Wuhan, Central China. Atmosphere 2015, 6, 503–520. [Google Scholar] [CrossRef] [Green Version]
  42. Wang, Y.; Yu, M.; Wang, Y.; Tang, G.; Song, T.; Zhou, P.; Liu, Z.; Hu, B.; Ji, D.; Wang, L.; et al. Rapid formation of intense haze episodes via aerosol–boundary layer feedback in Beijing. Atmospheric Meas. Tech. 2020, 20, 45–53. [Google Scholar] [CrossRef] [Green Version]
  43. Xu, J.; Tao, J.; Zhang, R.; Cheng, T.; Leng, C.; Chen, J.; Huang, G.; Li, X.; Zhu, Z. Measurements of surface aerosol optical properties in winter of Shanghai. Atmospheric Res. 2012, 109–110, 25–35. [Google Scholar] [CrossRef]
  44. Andreae, M.O.; Schmid, O.; Yang, H.; Chand, D.; Yu, J.Z.; Zeng, L.-M.; Zhang, Y.-H. Optical properties and chemical composition of the atmospheric aerosol in urban Guangzhou, China. Atmospheric Environ. 2008, 42, 6335–6350. [Google Scholar] [CrossRef]
Figure 1. Location of the air quality monitoring station (Latitude: 32°17′ N–33°48′ N; Longitude: 110°58′ E–113°49′ E).
Atmosphere 14 00137 g001
Figure 2. Time series of each variable over the whole experimental period (red line), black dots indicate the daily average of the parameters: (a) PM2.5 (µg/m3); (b) PM10 (µg/m3); (c) TSP (µg/m3); (d) Temperature (°C); (e) Humidity (%); (f) Windspeed (m/s).
Atmosphere 14 00137 g002
Figure 3. Wind speed and direction rises at the NYNU site in Nanyang from 19 November 2021 to 19 March 2022.
Atmosphere 14 00137 g003
Figure 4. Relative and cumulative frequency distributions of the variables over the entire experimental period: (a) PM2.5; (b) Temperature; (c) PM10; (d) Relative Humidity; (e) TSP; (f) Wind speed.
Atmosphere 14 00137 g004
Figure 5. Daily trends of each variable at the NYNU station during the experimental cycle. Black dots represent the mean and red areas represent the standard deviation of (a) PM2.5 (μg/m3); (b) Temperature (°C); (c) PM10 (μg/m3); (d) Humidity (%); (e) Total suspended particulate matter TSP (μg/m3); (f) Windspeed (m/s).
Atmosphere 14 00137 g005
Figure 6. Correlation analysis of PM2.5, PM10, TSP, and meteorological elements during the experimental cycle: (a) PM2.5 and temperature; (b) PM2.5 and humidity; (c) PM2.5 and wind speed; (d) PM10 and temperature; (e) PM10 and humidity; (f) PM10 and wind speed; (g) TSP and temperature; (h) TSP and humidity; (i) TSP and wind speed.
Atmosphere 14 00137 g006
Table 1. The measuring accuracy and range of parameters in the NYNU site.
ParametersUnitAccuracyRange
PM2.5(μg/m³)≤10~1000
PM10(μg/m³)≤10~1000
TSP(μg/m³)≤10~1000
WS(m·s−1)±0.30~30
T(°C)±0.3−30–70
RH(%)±50~100
Table 2. Statistics of each variable of particulate matter and meteorology parameters during the experimental period.
ParametersUnitMeanSDNumberSkewnessPercentiles
10%25%50%75%90%
PM2.5(μg/m³)106.4757.3528881.1039.6069.1496.85101.90131.77
PM10(μg/m³)137.3274.2028881.0950.7689.06125.27170.23236.35
TSP(μg/m³)283.40131.2828881.09130.27198.04262.10341.61458.63
WS(m·s−1)0.610.5328882.340.180.260.440.751.30
T(°C)5.595.0428880.980.382.214.188.3013.98
RH(%)73.3116.542888−0.3251.6261.9673.4186.5693.97
Table 3. Comparison of particulate matter mass concentration between NYNU station and other regional stations.
SITETYPEPERIODSEASONPM2.5
(μg/m3)
PM10
(μg/m3)
Reference
NYNU (China)urbanNovember 2021–March 2022Winter106 ± 57137 ± 74This work
Taocha (China)ruralOctober 2018–September 2019Annual 51 ± 2257 ± 25[33]
Wuhan (China)urban18–21 January 2018Winter170——[34]
Shenyang (China)urban2014–2015Annual72118[26]
Nanjing (China)urban2001Annual222316[36]
Chengdu (China)urban2009–2011Annual6071[38]
Hongkong (China)urbanJanuary 2000–December 2001Winter50.278.9[39]
Shanghai (China)urbanJanuary 2004–December 2005Winter68118[40]
Beijing (China)urbanSeptember 2017–August 2019Annual108172[32]
Guangzhou (China)urbanMarch 2013–February 2014Annual5273[32]
Disclaimer/Publisher’s Note: The statements, opinions and data contained in all publications are solely those of the individual author(s) and contributor(s) and not of MDPI and/or the editor(s). MDPI and/or the editor(s) disclaim responsibility for any injury to people or property resulting from any ideas, methods, instructions or products referred to in the content.

