
Results of Field Experiments for the Creation of Artificial Updrafts and Clouds
 ,
,  , , ,
, , , 
Abstract
:1. Introduction
- The ancient method of causing rain during drought, involving the creation of artificial fires in the prairies and savannas, used in South America and Equatorial Africa.
- Cloud creation using meteotrons that are artificial heat sources warming the surface air by the heat released during the combustion of petroleum products.
- ii.1.
- ii.2.
- The meteotron of the Institute of Geology and Geophysics of the Siberian branch of the Russian Academy of Sciences had 60 jet flamethrowers placed around the perimeter of the octagon with a side of 53 m and developed a capacity of 5000–6000 MW, spending about 430 tons/h of diesel fuel. Updrafts and black smoke in some of the eight experiments rose to 3 km [29].
- ii.3.
- Meteotron of the Institute of Applied Geophysics of USSR Hydrometeorological Service with four and ten jet engines, designed to study the possibility of creating artificial clouds and precipitation, had power of 200 and 500 MW, and “supermeteotron”, built on the shore of the alpine lake Sevan in Armenia in the hope of replenishing the water level in it, contained six engines with a total power of 500 MW [29].
- ii.4.
- Meteotrons of Chelyabinsk Polytechnic Institute (eight variants) were designed for the ventilation of coal mines, creating clouds and fog dispersion. They contained from 10 to 100 centrifugal injectors with a diesel fuel consumption of seven to 30 tons/h, and developed a capacity of 80 to 400 MW. Fine spray of diesel fuel in combination with various nozzles provided complete combustion of fuel and resulted in a smokeless jet [30,31]. The experiments showed that a meteotron with power of about 1000 MW can create an updraft reaching a height of 100–1000 m or enhance existing clouds, and under favorable conditions, noted the development of a small convective cloud.
- ii.5.
- NASA Mississippi Space Center tested the super heavy rocket engine RS-68 and demonstrated the generation of an artificial cloud that produced light rain (from open Internet sources). This was facilitated by the intense release of hot water vapor, which cools by raising and condenses as the cloud.
- Proposals to stimulate the development of clouds with solar meteotrons are also known:
- iii.1.
- The simplest solar meteotron is the area of earth’s surface covered with asphalt, black cloth, or other materials that absorb solar radiation.
- iii.2.
- Oranovsky solar meteotron [32] consisted of a blackened screen raised over the ground and surrounding mirrors, focusing on the additional solar energy generated by the screen.
- iii.3.
- Methods that reduce the albedo of the underlying surface by planting greenery and other bio-geoengineering methods. Branch and Wulfmeyer [33] believe that a viable ecological perspective to solve the problem of increasing precipitation in arid and semi-arid regions is agroforestry. Brenig et al. [34] believe that the air over a surface with a low albedo, more heated by the sun’s rays, rises and leads to the rise of the sea breeze. This contributes to the development of clouds and increased rain on the leeward side through 25–30 km inland.
- iii.4.
- Method of creating an artificial aerosol layer in the near-ground atmosphere that absorbs solar radiation and can lead to the heating of local air volumes and initiate thermal convection by using highly efficient smoke compositions [35]. The disadvantages of these methods are the following:
- The method of burning the vegetation of the prairie and savanna is not acceptable due to their limited availability and adverse effects on flora and fauna.
- Torchlight and fire meteotron requires a large expenditure of fuel, which generates drastic environmental pollution.
- Coating of asphalt and black materials with a low albedo of large areas is not cost-effective, and their efficiency reduces energy loss due to leakage into the soil.
- Method of Oranovsky reduces heat losses due to rising of the blackened screen from soil on special supports. However, its practical realization is overly complicated due to the excessively large dimensions of blackened screen and mirrors involved (several km2).
- Solar meteotron absorption screens in the form of asphalt, fabric, and other black coatings with small areas is not effective, and the creation of screens having an area of about 2–6 km2 or more is very expensive and still at the conceptual level.
- Creation of artificial aerosol layer over land area 1–10 km2 for at least 30 min requires consumption of several tens of tons of pyrotechnic composition and is applicable only away from populated areas and under specific weather conditions.
- None of these methods of creating ascending streams has successfully initiated the development of artificial clouds of practical importance.
- This work attempts to answer whether it is possible to overcome the limitations of these methods by energetically feeding the upward flow created by a vertically directed jet of an aircraft engine, due to the heat of condensation of water vapor on a hygroscopic aerosol introduced into the jet.
2. Method for Creating Artificial Updrafts and Clouds
3. Experimental Equipment
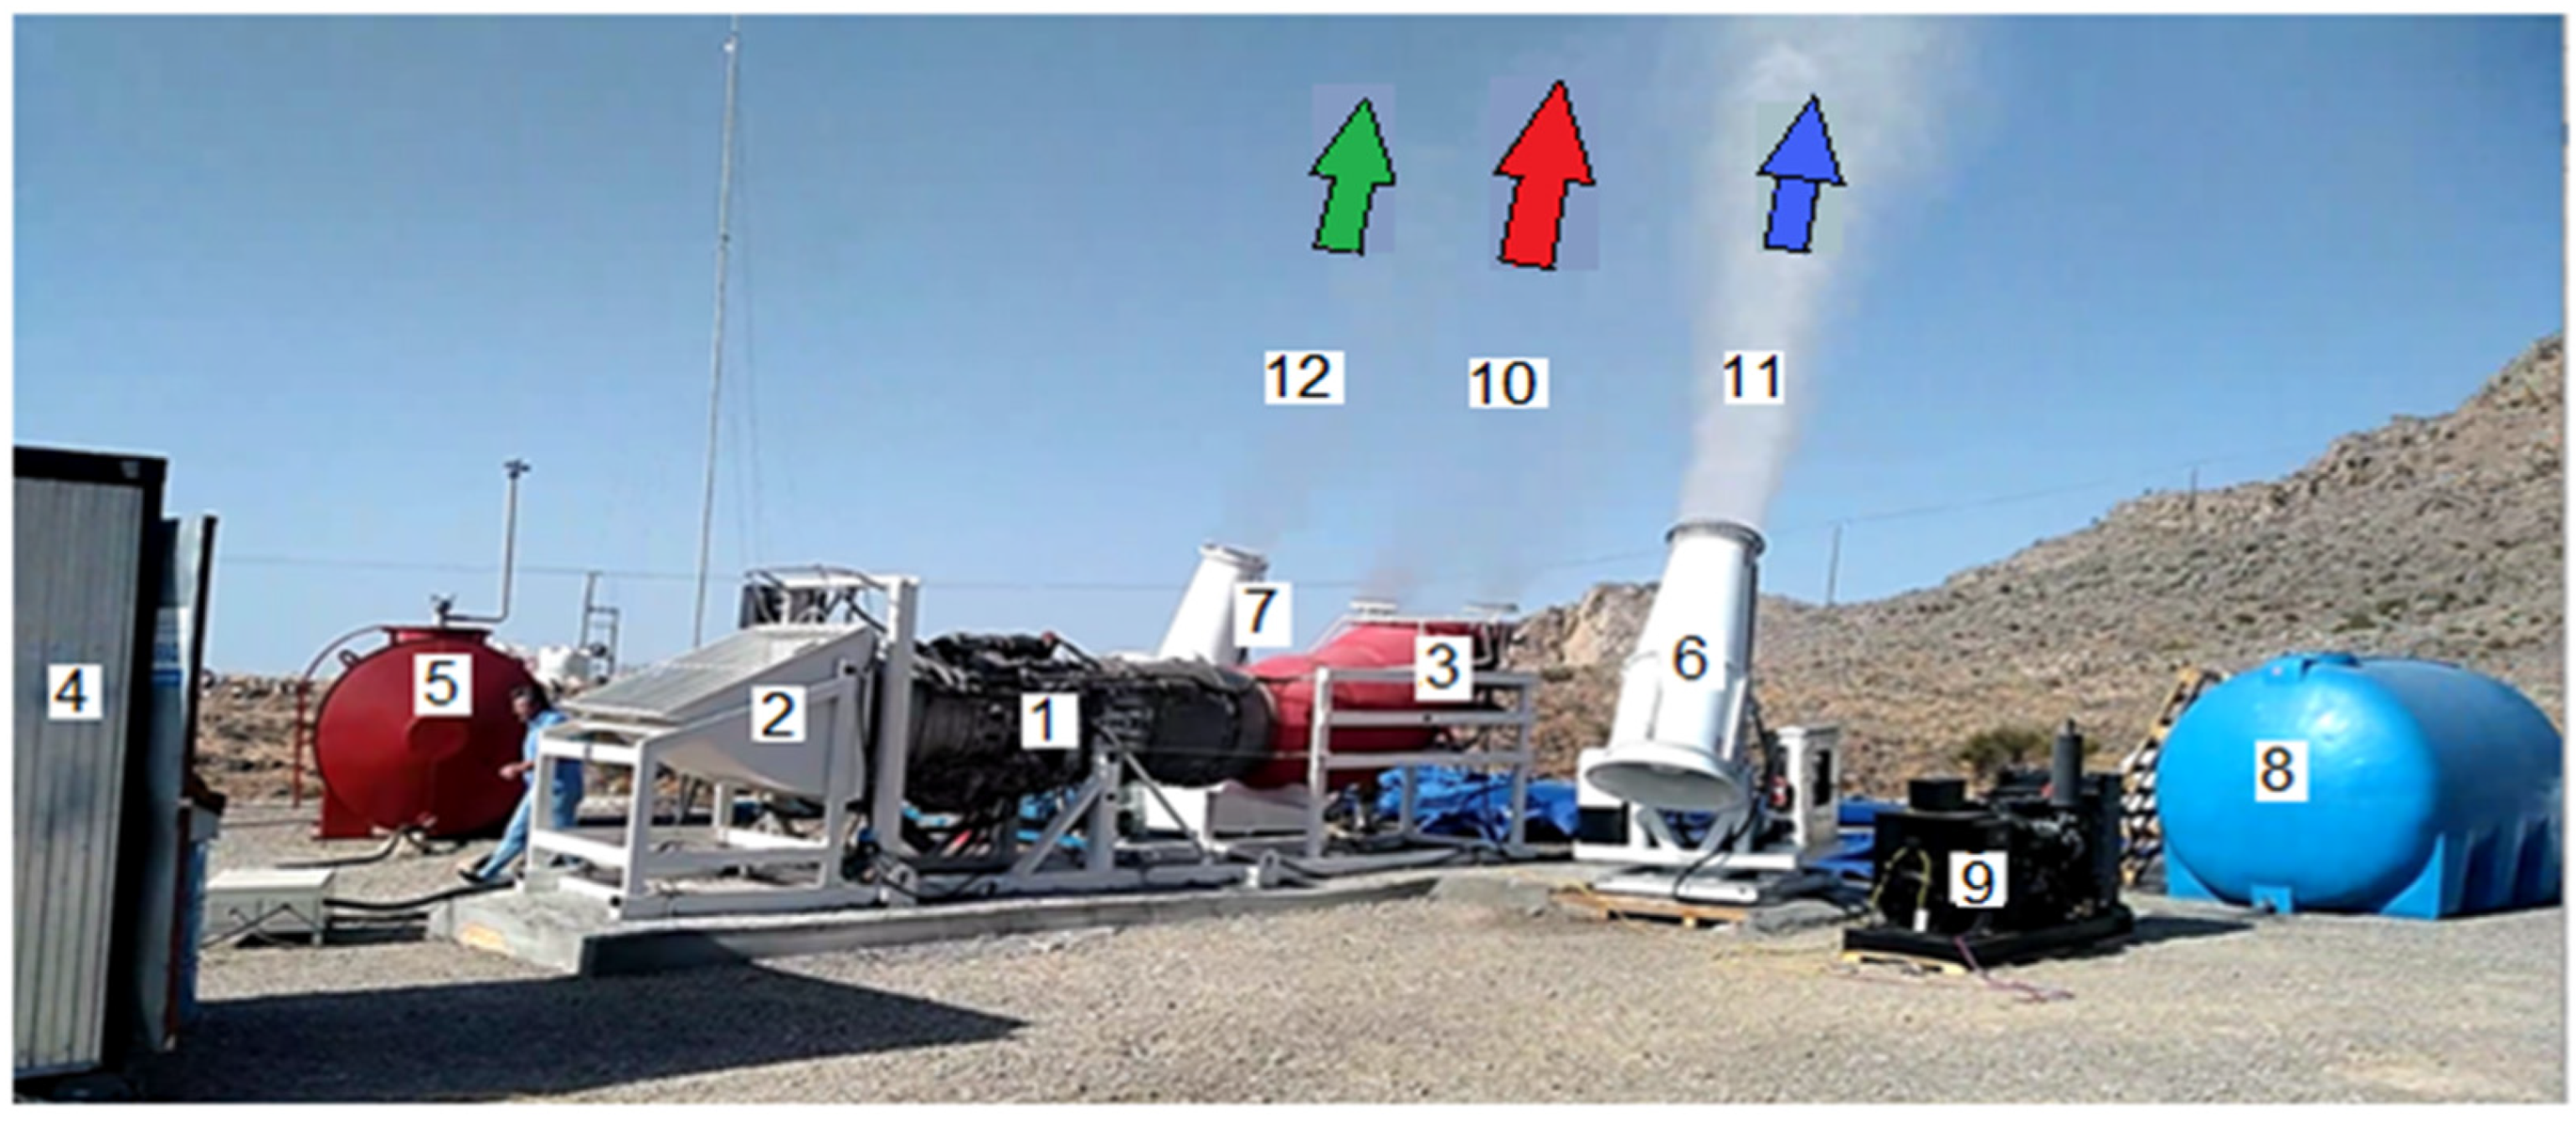
- D-30 turbojet aircraft engine (1), air intake (2), elbow nozzle (3), launch/control system (4), fuel system (5);
- Aqueous solution-spraying system of the first type, which is a system of nozzles installed along the perimeter of the jet turning device;
- Two Fog Cannons (6 and 7) for spraying aerosols of the second and third types with fans having power of at least 20 kW, autonomous control, and power supply systems;
- System for the preparation and storage of aqueous solutions of hygroscopic substances, consisting of a mixer with a capacity of 1 m3 and three tanks with a capacity of 3 and 6 m3 (8);
- Mill for grinding granules of hygroscopic substances (not shown in the figure);
- Set of instruments for monitoring the results of field experiments.
- Mixer with a capacity of 1 m3 for the preparation of highly concentrated aqueous solutions of these substances;
- Water tank with a capacity of 20 m3;
- Three tanks for aqueous solutions of three different hygroscopic substances.

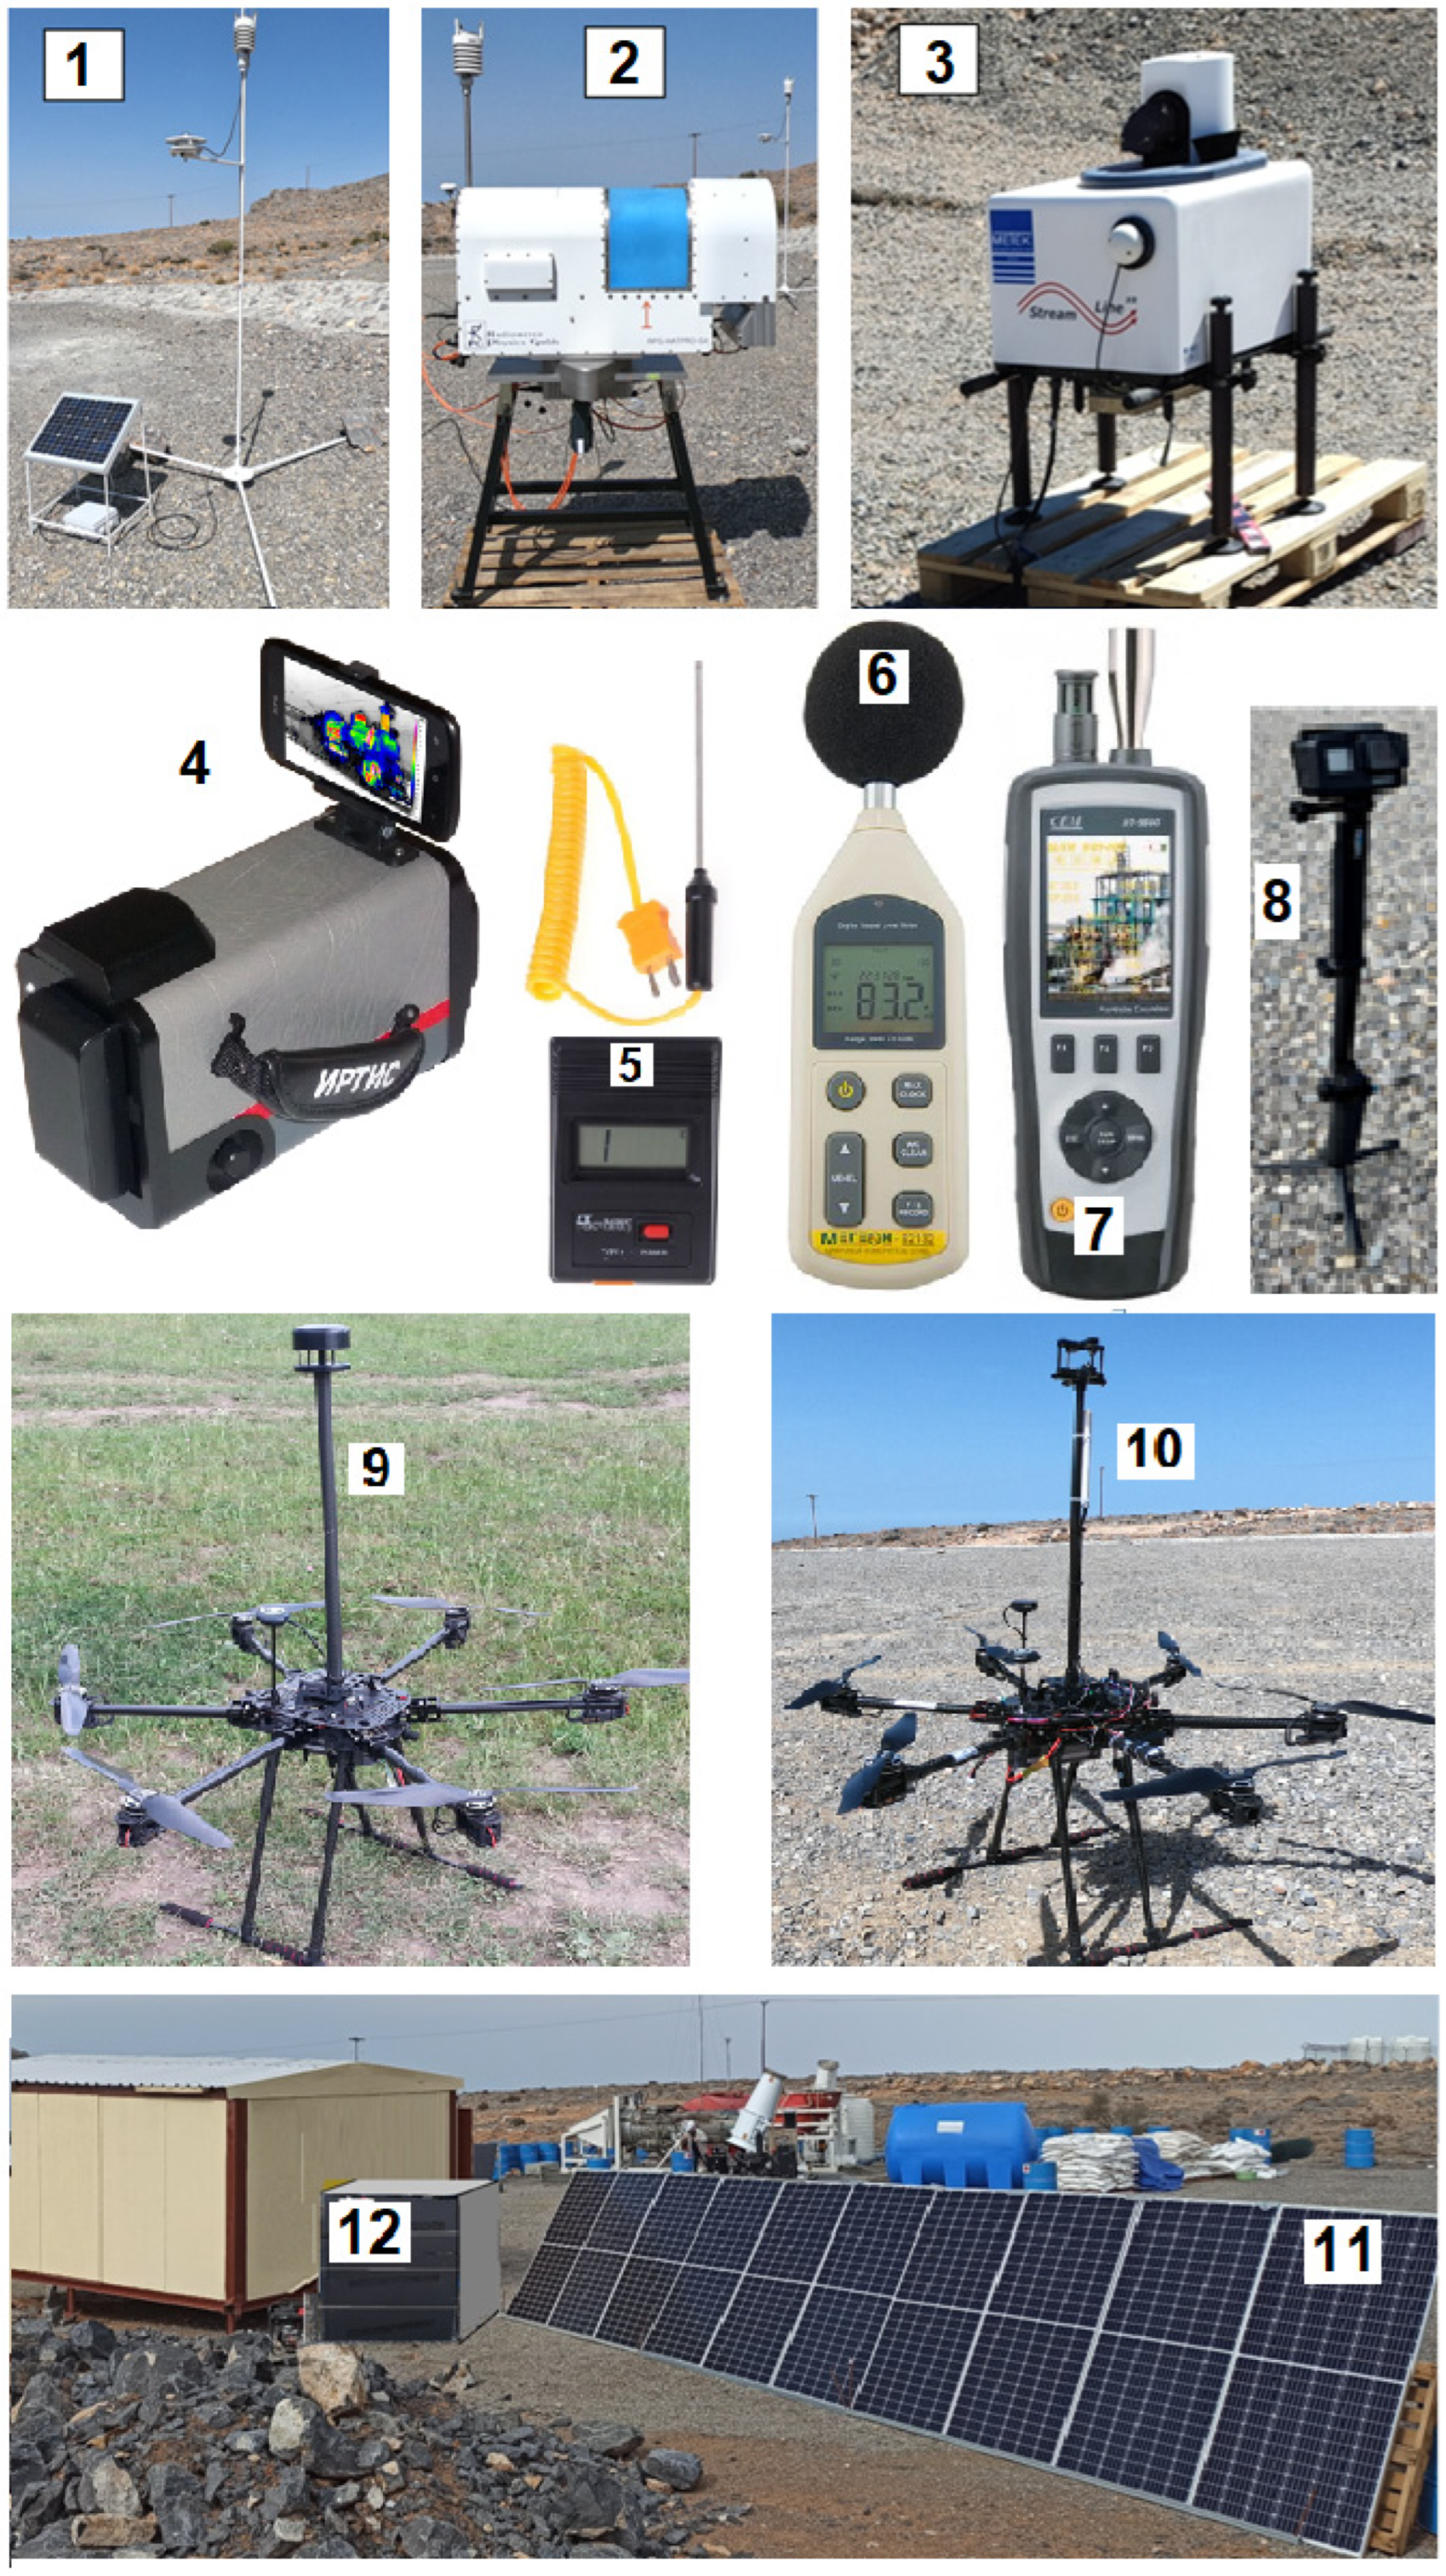
| Name | Measured Parameters |
|---|---|
| Weather station WXT-536, Vaisala, Vantaa, Finland | Temperature, pressure, humidity, precipitation, and wind at the ground |
| Multi-microwave radiometer RPG HATRO G4 PRO, RPG Radiometer Physics GmbH, Meckenheim, Germany | Vertical profiles of humidity, air temperature, vertically integrated liquid water, and vapor |
| Doppler pulse wind Lidar Halo Photonics Streamline XR | Doppler wind components and profiles of horizontal wind speed and wind direction (each 5 min) |
| Thermograph IRTIS-2000 C, IRTIS Ltd., Moscow, Russia | Measurement and visualization of temperature field deformations created by turbojet engine flow. Spectral range 3–5 µm, accuracy 1 °C, temperature range −50 to +500 °C. |
| Pyranometer RK200-03, Rika-Sensor, Changsha, China | Solar radiation flux |
| Digital thermometer TM902C | Jet temperature |
| GEM DT-9880, Shenzhen Everbest Machinery Industry Co. Ltd., Shenzhen, China | Aerosol concentration in six ranges: 0.3; 0.5; 1; 2.5; 5; 10 μm |
| Noise meter MEGEON 92131 | Jet noise level |
| Hexacopter weather drones, HSRC Antigrad, Nalchik, Russia | Air temperature, humidity, and pressure; 3D wind speed and direction, aerosol concentration |
| Laser distance meter Extend LRS | Height and rate of rise of the cloud top |
| C-band weather radars | Radar parameters of artificial clouds and rain |
| Meteorological satellites Meteosat-10 | Visible and infrared imageries of clouds |
| Abu-Dhabi airport air sounding data http://weather.uwyo.edu (accessed on 21 January 2022) | Thermodynamic parameters of the atmosphere at altitudes from ground level to 35–40 km |
4. Organization of Field Experiments
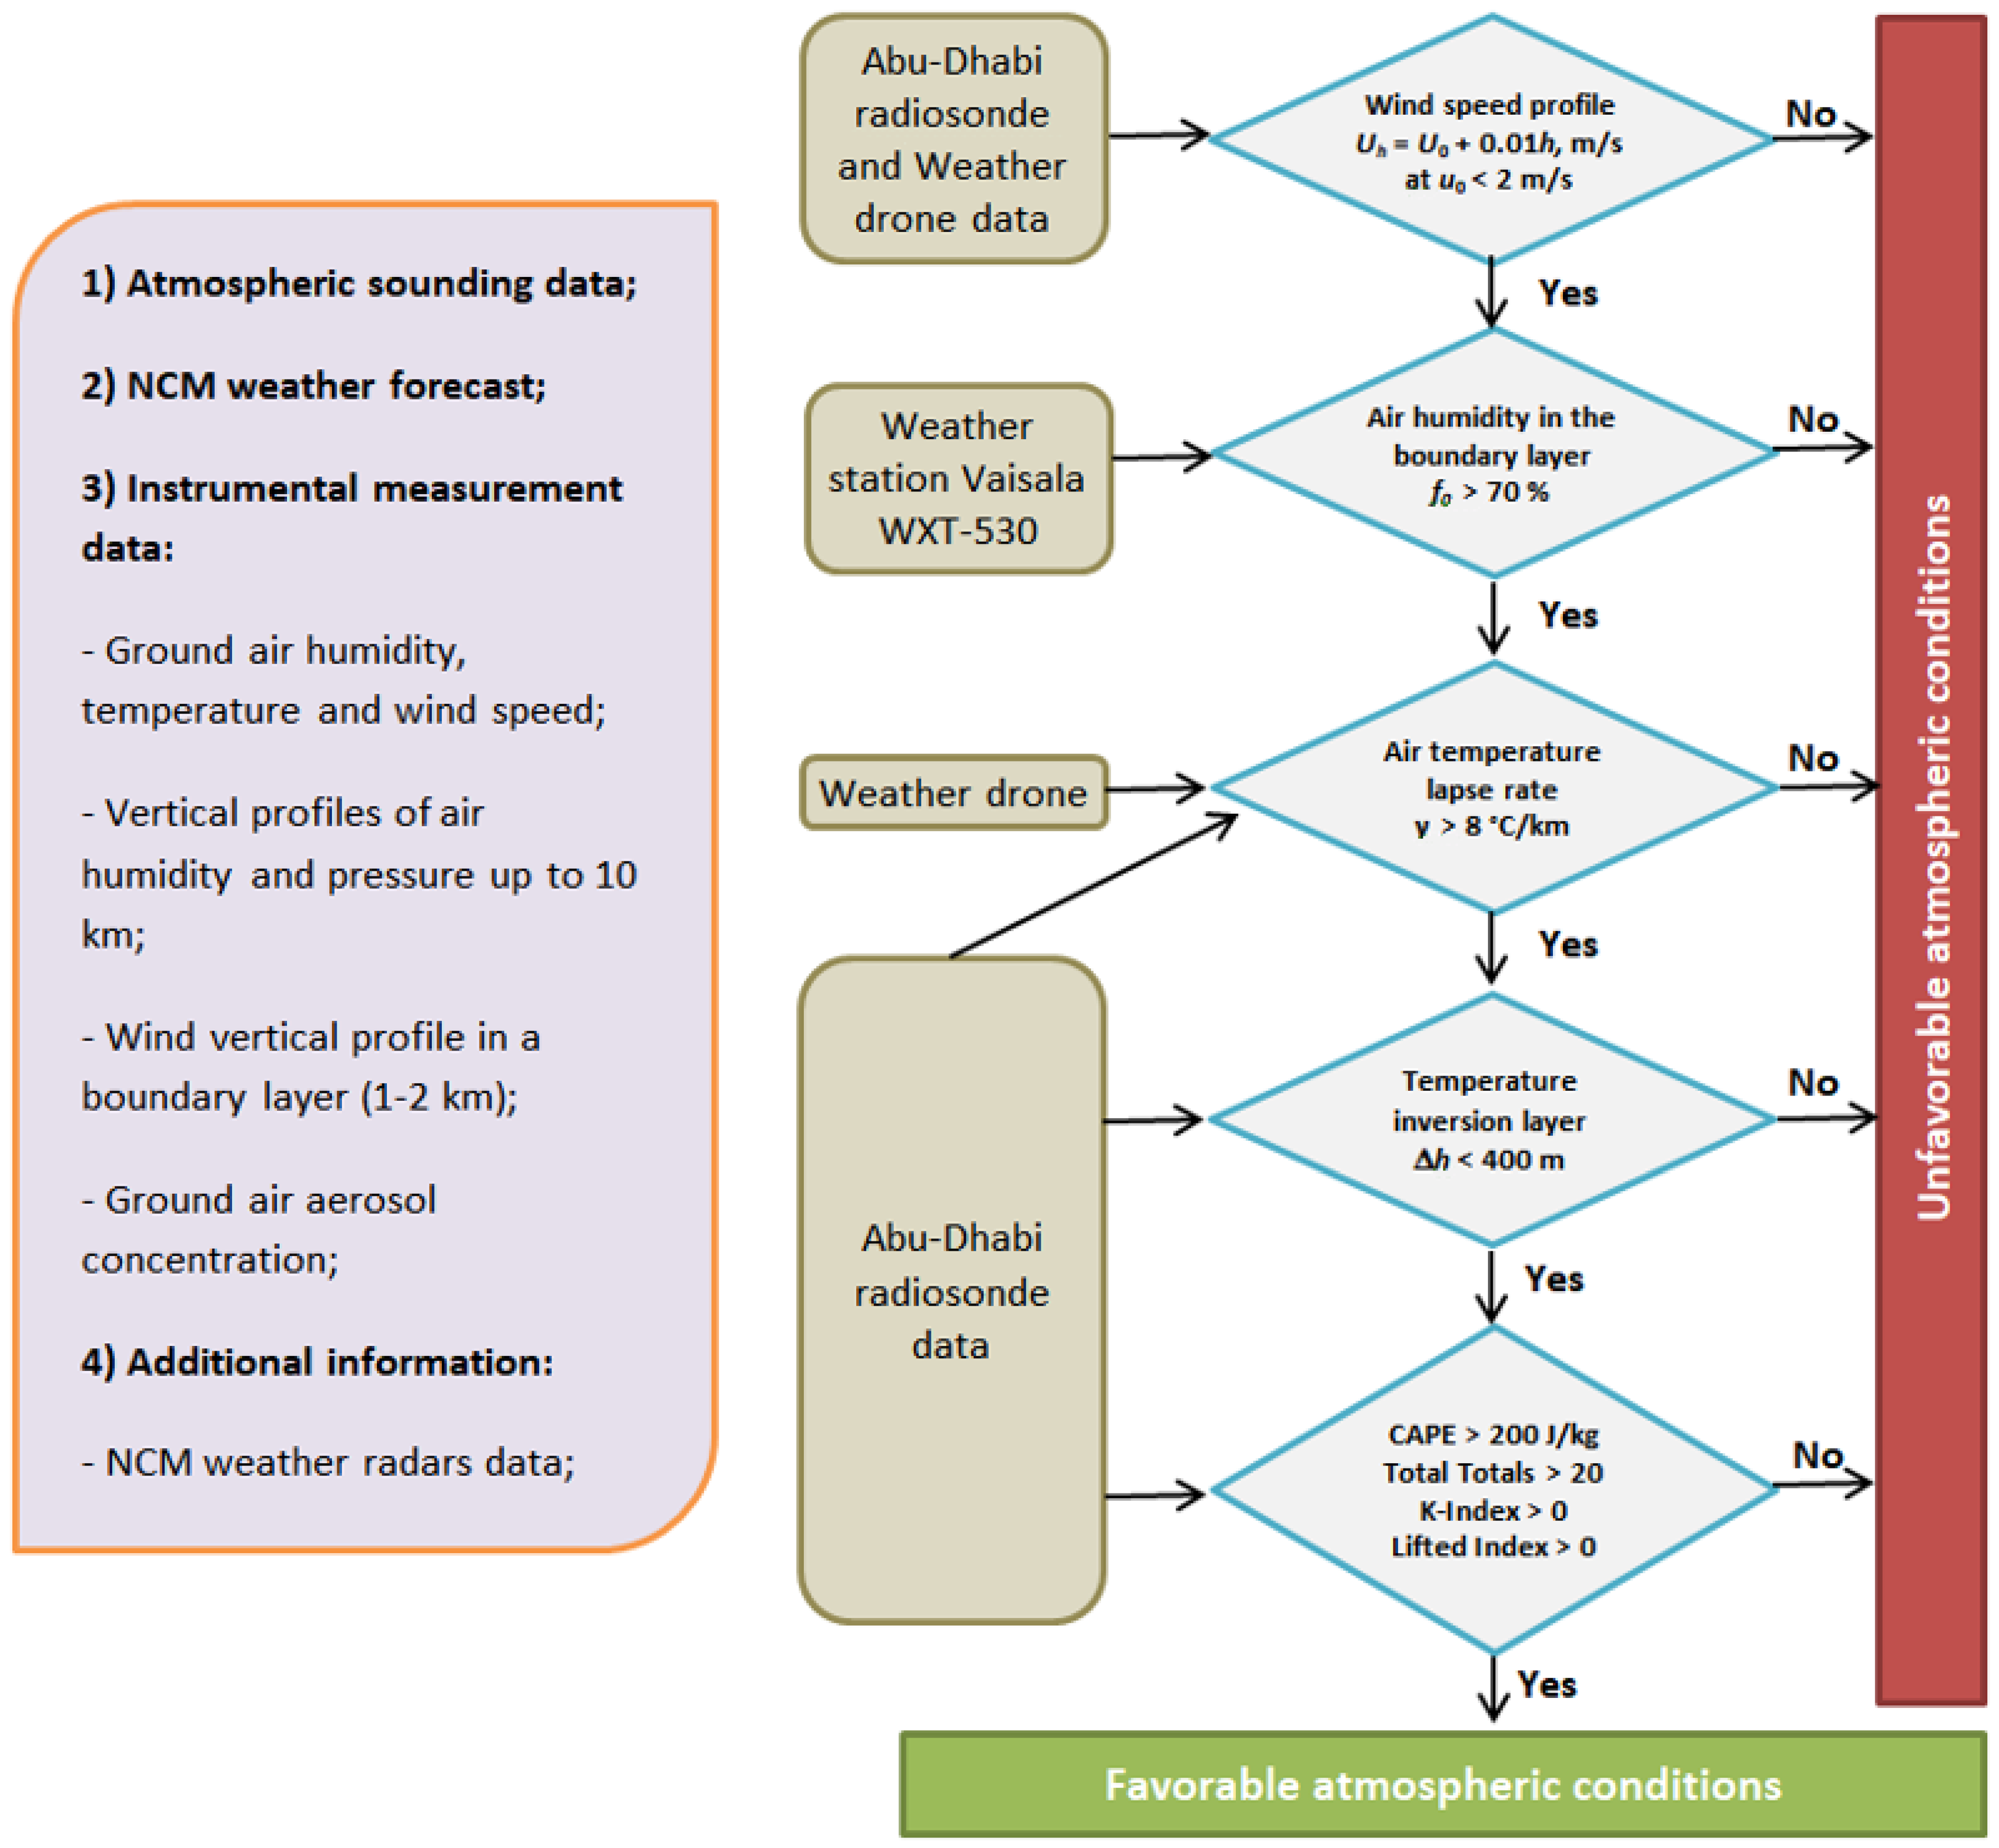
4.1. Selection of Days and Times of Day with Favorable Atmospheric Conditions
- Surface wind speed U ≤ 2 m/s and wind shear dU/dh ≤ 0.005 h;
- Temperature lapse rate γ ≥ 7.5 °C/km;
- Air humidity f > 66%;
- Absence of powerful temperature inversion layers;
- CAPE > 200 J/kg.
- (a)
- Vertical profiles of wind speed and direction by Doppler Lidar Streamline XR and weather hexacopter drones with kit of sensors;
- (b)
- Vertical profiles of air temperature and humidity over the experimental position by microwave radiometer RPG HATRO PRO;
- (c)
- Wind speed, air temperature, and humidity at the site level by weather station Vaisala WXT-536.
4.2. Experiments Methodology
| No | Date, Time, Duration of Experiment (min) | Weather Conditions | Surface Atmosphere Parameters | Atmospheric Instability Indices | Seeding Materials Injected into Jet | Results |
|---|---|---|---|---|---|---|
| 1 | 15 March 2021 152–1516, 14 | Cirrus-Stratus clouds 25% to the East | T0 = 26.1 °C, f0 = 14.5%, U0 = 1–3 m/s | LI = 6.12; SWEAT = 33; KI = −28.5.5; VT = 27.9; TTI = 16.8; CAPEuvt = 0; Hcond = 1700 m | Solutions of CaCl2 1.5 L/s; NaCl 0.6 L/s; Carbamide 0.8 L/s. | Translucent plume in the sky |
| 2 | 17 March 2021 1515–1530, 15 | Clear sky | T0 = 23.7 °C, f0 = 17.00%, U0 = 3–4 m/s | LI = 4.13; SWEAT = 51.98; KI = 9.5; VT = 32.9; TTI = 42.8; CAPEuvt = 0; Hcond = 3700 m | Same solutions | Translucent plume in the sky |
| 3 | 23 March 2021 1542–1456, 14 | Clear sky, haze on the horizon | T0 = 25.9 °C, f0 = 36.8%, U0 = 2–3 m/s | LI = 10.49; SWEAT = 64.02; KI = 8.3; VT = 28.7; TTI = 30.4; CAPEuvt = 0; Hcond = 3900 m | Same solutions | Translucent plume in the sky |
| 4 | 24 March 2021 1551–1558, 9 | Clear sky | T0 = 29.5 °C, f0 = 18.8%, U0 = 3–4 m/s | LI = 10.49; SWEAT = 64.002; KI = 8.3; VT = 28.7; TTI = 30.4; CAPEuvt = 0; Hcond = 2900 m | Same solutions | Translucent plume in the sky |
| 5 | 25 December 2021 155–1514, 10 | Clear sky over site, high-level St-Cu near site | T0 = 15 °C, f0 = 70%, U0 = 2–4 m/s | LI = 3; SWEAT = 116; KI = 10.5; VT = 3.5; TTI = 37; CAPEuvt = 15.36; Hcond = 1300 m | Same solutions | Translucent plume in the sky |
| 6 | 25 December 2021 1610–1618, 13 | Cu Fr clouds over and near site | T0 = 14 °C, f0 = 68%, U0 = 2–3 m/s | Same | Same solutions | Translucent plume in the sky |
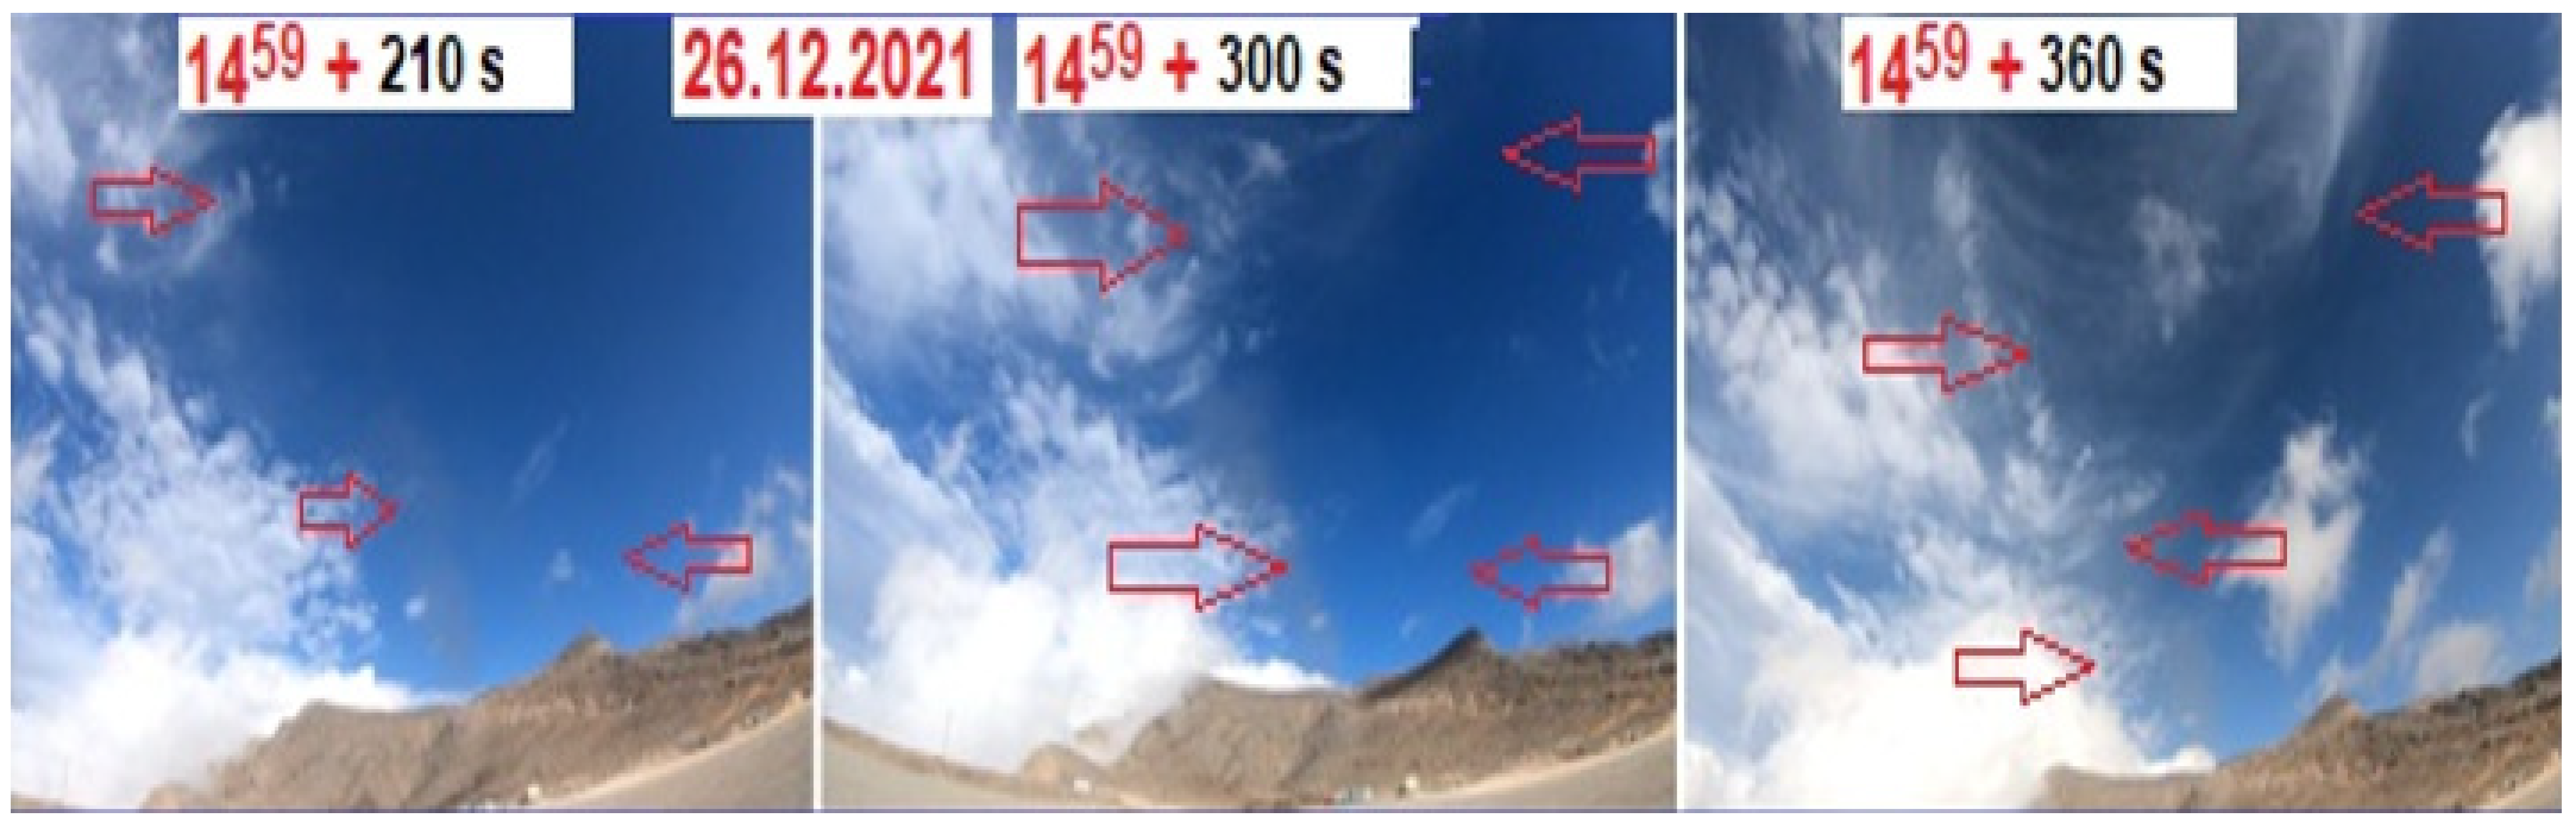
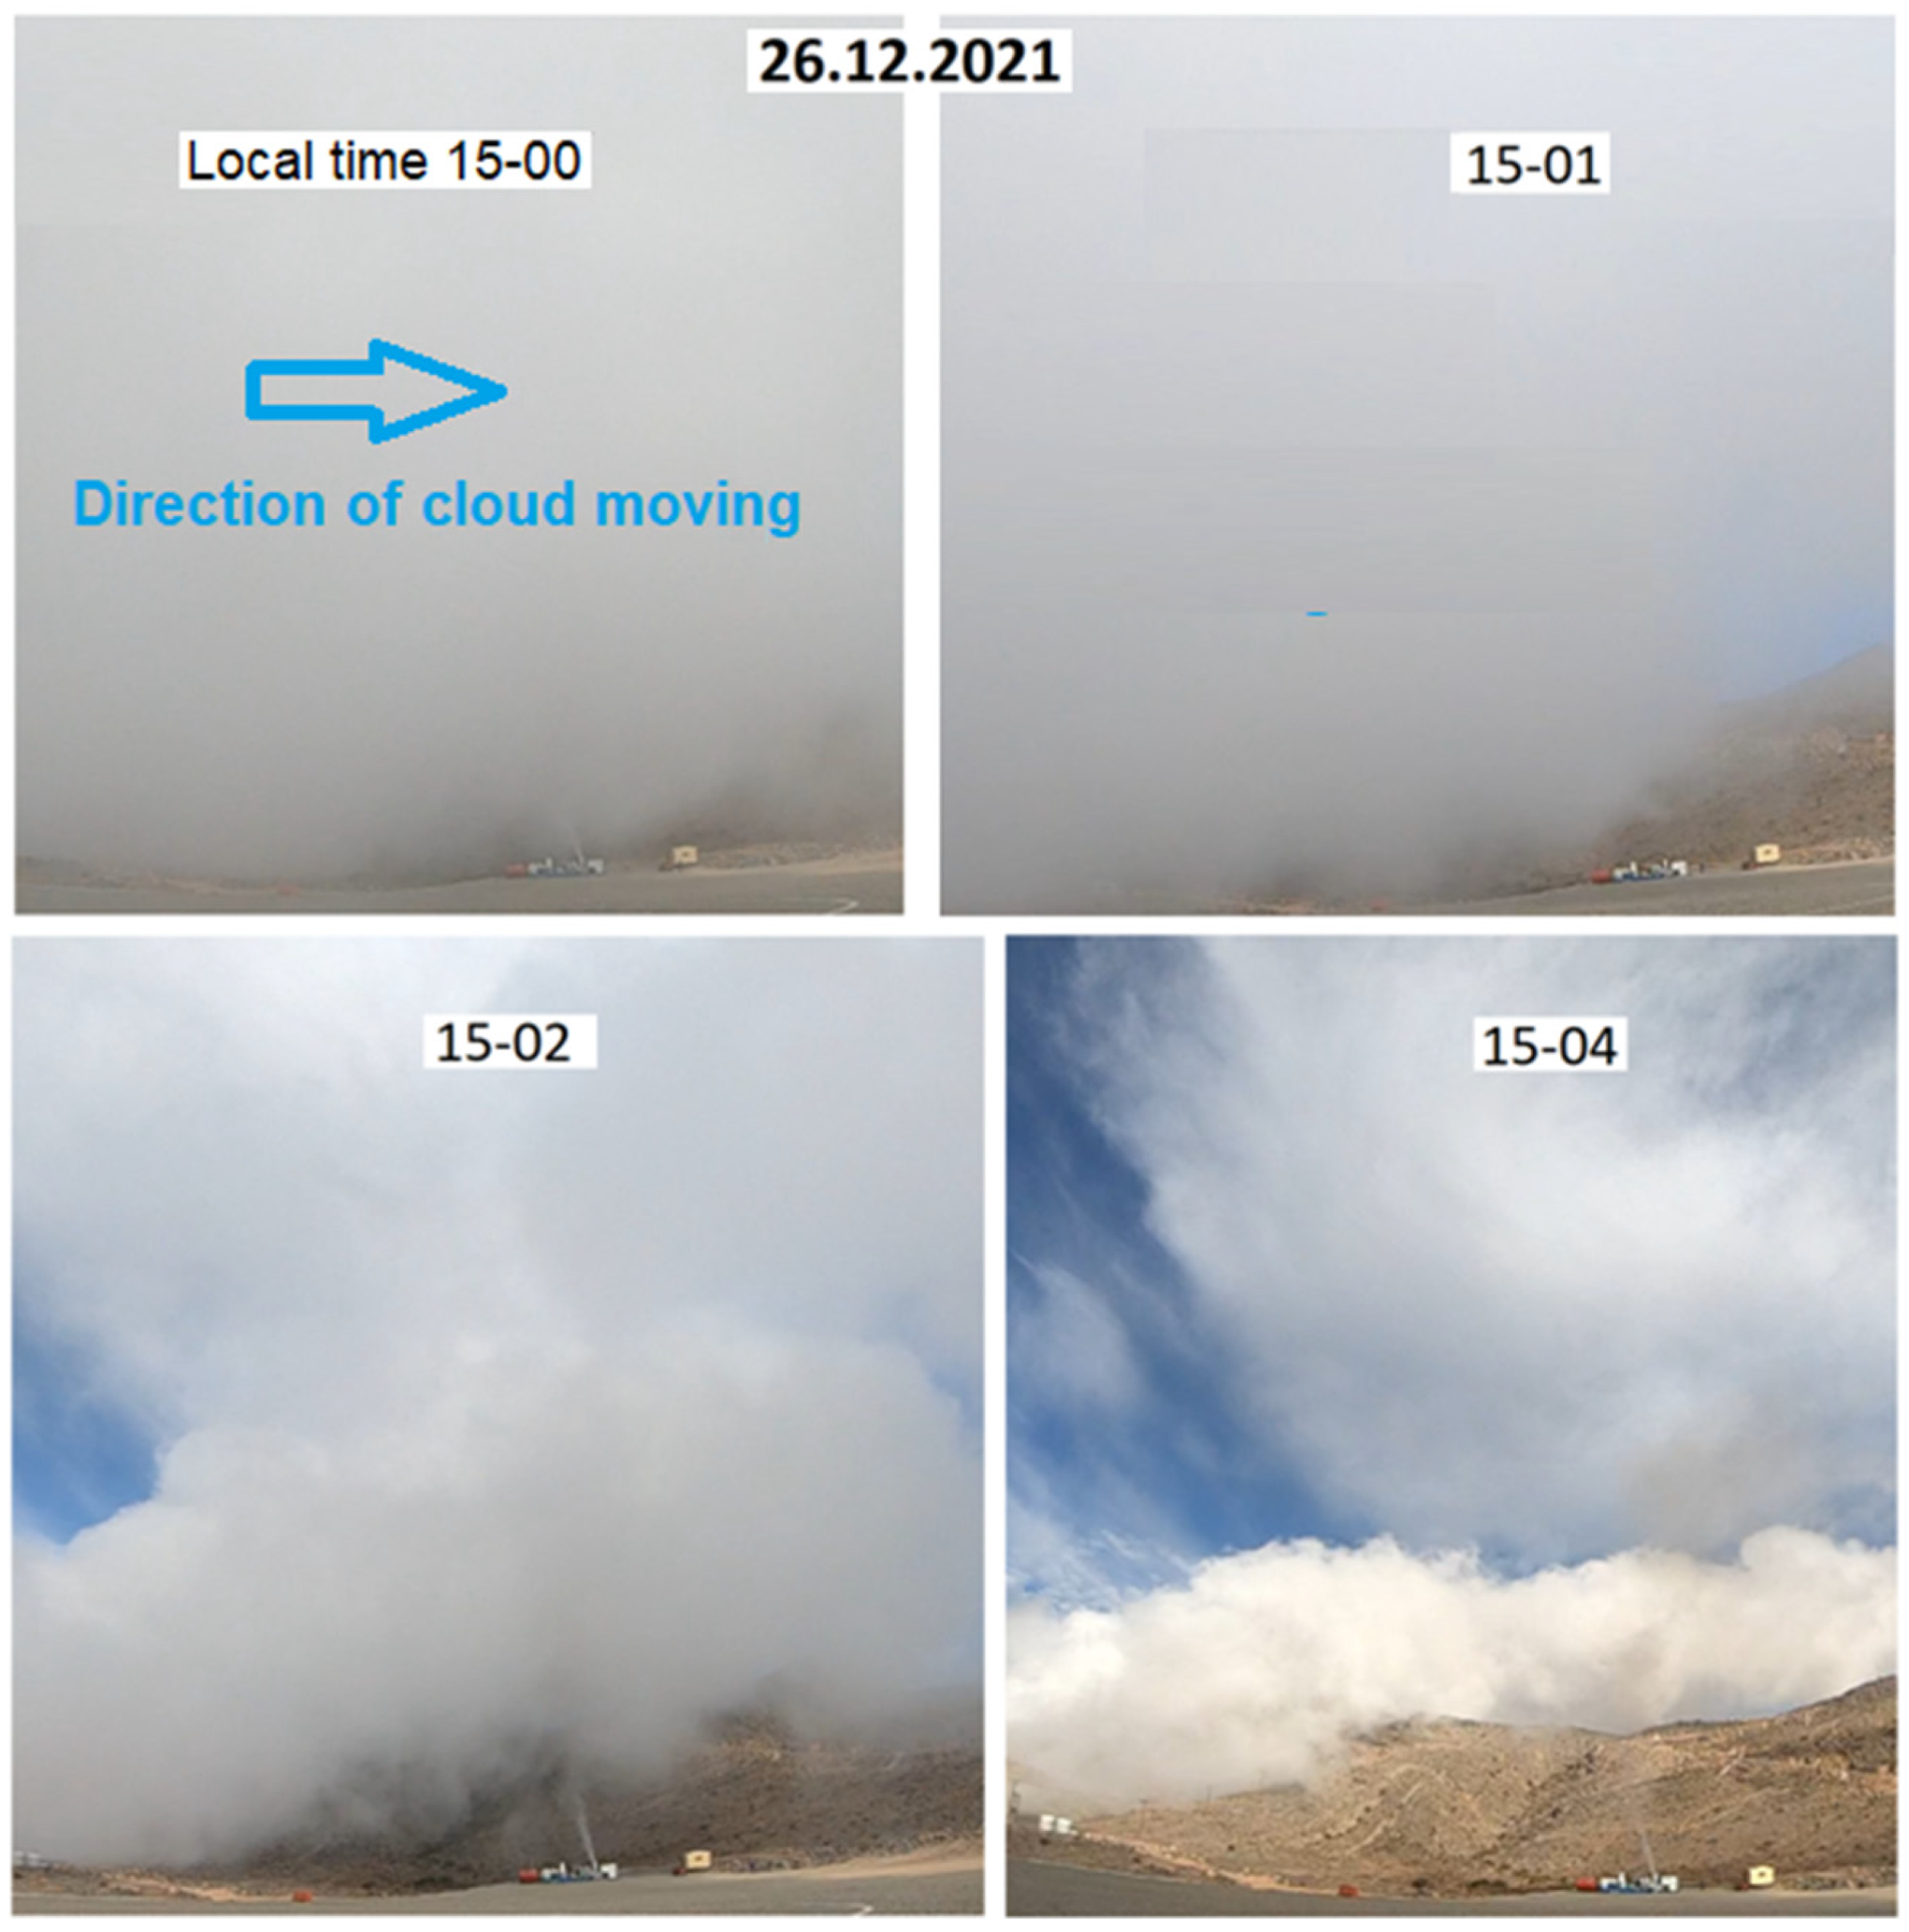
| 7 | 26 December 2021 1459–159, 11 | Clear sky over site, Cu and high-level St-Cu near site | T0 = 13.5 °C, f0 = 69%, U0 = 3 m/s | Li = 1.5; SWEAT = 118; Ki = 27; VT = 27.3; TTi = 44.6; CAPEuvt = 0.00; Hcond = 1200 m | Same solutions | Plume in the sky. Convergence of surrounding clouds toward the jet |
| 8 | 26 December 2021 1536–1548, 12 | Cu cloud passing over site. The jet is injected directly into cloud | T0 = 13 °C, f0 = 69.7%, U0 = 2–3 m/s | Same | Same solutions | The cloud evaporated as it passed |
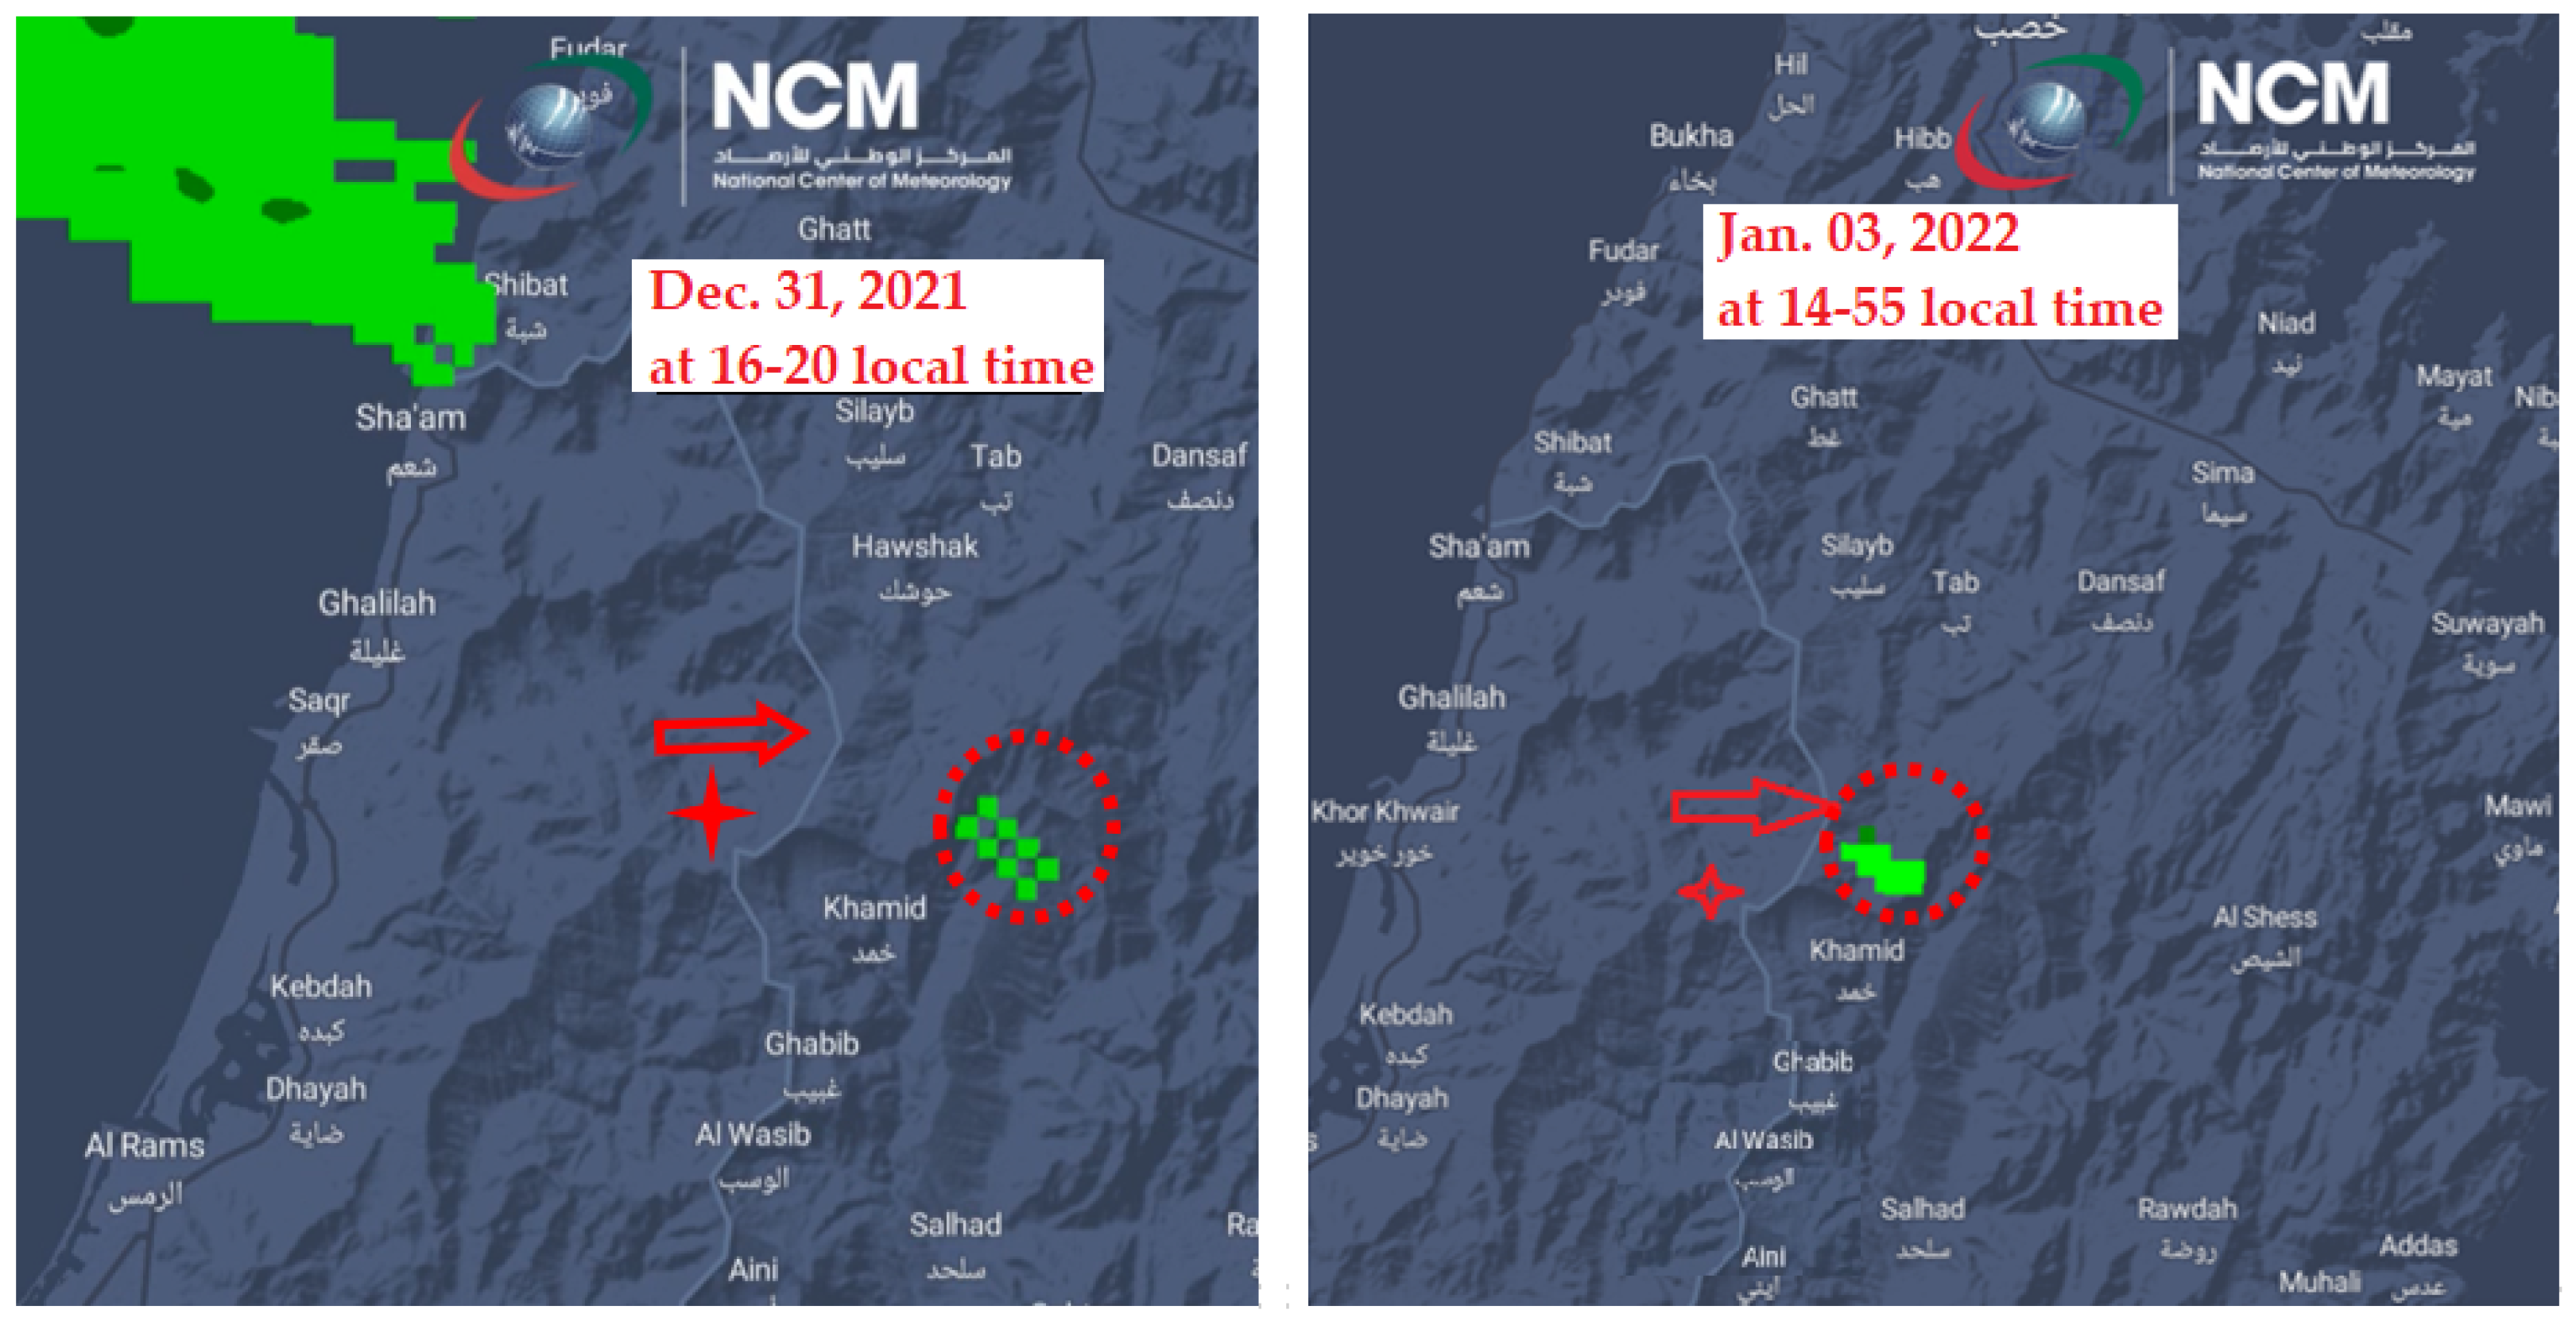
| 9 | 29 December 20211532–1542, 10 | St-Cu cloud over site, Cu clouds at North and East | T0 = 13.5 °C, f0 = 68%, U0 = 2–3 m/s | LI = 4.51; SWEAT = 55.01; KI = 18.5; VT = 23.1; TTI = 32.2; CAPEuvt = 5.27; Hcond = 1350 m. | Same solutions and 20 kg of powder NaCl/TiO2 | Formation of a gap among the ridge of St-Cu clouds |
| 10 | 30 December 2021 1611–1620, 9 | Clear sky over site. Cb cloud in the South and over Gulf of Oman | T0 = 12.2 °C, f0 = 73.7%, U0 = 2.7 m/s | LI = 3.81; SWEAT = 205.82; KI = 29.4; VT = 25.5; TTI = 48.9; CAPEuvt = 1.77; Hcond = 2200 m | Same solutions and 50 kg powder of CaCl2 and 20 kg of powder NaCl/NiO2 | Translucent plume in the sky |
| 11 | 31 December 2021 1116–1132, 16 | Low-level St-Cu on site, moving to West. Cb in South and East. Rain on site 1155-1205 | T0 = 11.0 °C, f0 = 88.7%, U0 = 1.8 m/s J = 99 mm/h | LI = 1.07; SWEAT = 229.7; KI = 30.8; VT = 25.5; TTI = 51.3; CAPEuvt = 137.43; Hcond = 1600 m | Same solutions and powders of CaCl2 and 20 kg of powder NaCl/NiO2 | Compaction of the seeded cloud volume (visually observed) |
| 12 | 31 December 2021 1555–1604, 10 | Cu cloud over site, moving to South-West | T0 = 12.3 °C, f0 = 82.0%, U0 = 0.8 m/s | Same | Same solutions and powders | Formation of 15 dBZ radar echo band at 1620–1625 |
| 13 | 3 January 2022 1425–1436, 11 | Low-level St-Cu cloud on site, moving to East | T0 = 9.0 °C, f0 = 91%, U0 = 4.2 m/s | LI = 3.56.1; SWEAT = 372.9; KI = 36.4; VT = 27.3; TTI = 52.3; CAPEuvt = 449.6; Hcond = 1050 m | Same solutions and 20 kg of powder NaCl/NiO2 | Small radar echo in 1435–1455 in the moving direction of the seeded cloud |
| 14 | 5 January 2022 1421–1432, 11 | Low-level St-Cu cloud on site, moving to East | T0 = 7.7 °C, f0 = 93.8%, U0 = 2.8 m/s | LI = 4.53; SWEAT = 108.09; KI = -14.1; VT = 20.9; TTI = 39.6; CAPEuvt = 12.16; Hcond = 1200 m | Same solutions and 50 kg powder of CaCl2 and 20 kg of powder NaCl/NiO2 | Drizzling rain at position and spot of radar echo in the direction of moving of the cloud |
| 15 | 5 January 2022 1525–1534, 9 | Low-level St-Cu cloud on site, moving to East | T0 = 9.7 °C, f0 = 92% | Same | Same solutions and 20 kg of powder NaCl/NiO2 | Compaction of the seeded cloud volume |
| 16 | 7 January 2022 1050–1059, 9 | Clear sky over site | T0 = 7.3 °C, f0 = 79%, U0 = 2.5 m/s | LI = 9.49; SWEAT = 76.78; KI = −5.4; VT = 19.7; TTI = 36.1; CAPEuvt = 0; Hcond = 1800 m. | Powder of NaCl/NiO2 20 kg | Formation of a translucent cloud over the jet |
| 17 | 7 January 2022 1219–1227, 9 | Clear sky over site, small Cu hum near site above 1500 m | T0 = 28.7 °C, f0 = 38%, U0 = 4.5 m/s | Same | Same solutions | Convergence of clouds toward jet |
| 18 | 15 January 2022 1329–1343, 14 | Clear sky over site | T0 = 29.3 °C, f0 = 33%, U0 = 3.7 m/s | LI = 5.19; SWEAT = 63.41; KI = −19.9; VT = 24.7; TTI = 37.4; CAPEuvt = 0; Hcond = 1700 m. | Solutions of CaCl2 and NaCl | Formation of a translucent cloud over the jet |
| 19 | 15 January 2022 1736–1803, 24 | High-level St-Cu clouds over sky | T0 = 30.5 °C, f0 = 31%, U0 = 4.0 m/s | LI = 6.12; SWEAT = 33.0; KI = −28.5; VT = 27.9; TTI = 16.8; CAPEuvt = 0; Hcond = 1830 m. | Solutions of CaCl2, NaCl and powder of CaCl2 40 kg | A gap in the cloud and its transfer downwind |
| Hygroscopic Substance | Solution Flow Rate in Experiments, (g/s) | Substance Mass Flow Rate, M (g/s) | Aerosol Diameter, da (μm) | Aerosol Mass, ma (g) | Aerosol Flow Rate, N (Pcs./s) |
|---|---|---|---|---|---|
| NaCl | 600 | 215.3 | 10 | 1.13 × 10⁻⁹ | 1.90 × 10¹¹ |
| CaCl2 | 1500 | 538 | 10 | 1.13 × 10⁻⁹ | 4.78 × 10¹¹ |
| (NH2)2CO | 800 | 672 | 10 | 6.99 × 10⁻¹⁰ | 5.32 × 10¹¹ |
| NaCl/TiO2 powder | - | 230 | 5 | 1.41 × 10⁻¹⁰ | 1.62 × 10¹² |
| CaCl2 powder | - | 476 | 50 | 1.41 × 10⁻⁷ | 3.35 × 10⁹ |
| Hygroscopic Substance | Growth Factor of Mass k1 = md/ma | Water Vapor Mass Condensed on One Particle, mw = k1 × ma (g) | Total Mass of Condensed Water Vapor Mw (kg/s) | Latent Heat of Condensation PC (MW) | |
| NaCl | 5.86 | 6.62 × 10⁻⁹ | 1.26 | 2.89 | |
| CaCl2 | 1.67 | 1.87 × 10⁻⁹ | 0.90 | 2.07 | |
| (NH2)2CO | 3.08 | 2.15 × 10⁻⁹ | 1.15 | 2.63 | |
| NaCl/TiO2 powder | 19.4 | 2.74 × 10⁻⁹ | 4.43 | 10.20 | |
| CaCl2 powder | 1.67 | 2.35 × 10⁻⁷ | 0.79 | 1.81 | |
4.3. Atmospheric Situations during the Days of Experiments
4.3.1. First Field Campaign
- On 15 March, according to atmospheric sounding data in Abu Dhabi at 12:00 UTC, the presence of high humidity in the 3.5–7 km layer (60–80%) led to the formation of cirrus clouds.
- On 17 March, the surface air humidity was 18–21%. In layers 4.0–4.5; 5.5–6.0; 8.5–10 km, humidity reached 59–71%. However, during the day it was cloudless.
- On 23 March, Meteosat-10 data showed the nearest cloudy zones located over the territory of Iran, in the zone of the low-pressure trough from Transcaucasia through the Caspian Sea. The weather in the region was partly cloudy.
- On 24 March, the humidity of the atmosphere dropped even lower. According to the microwave radiometer observations, the humidity of the surface layer was 20–30%, and 50% at a height of 9–10 km. The nearest cloud fields were also only observed over the territory of Iran.
4.3.2. Second Field Campaign
5. Experimental Results
5.1. Parameters of Artificial Updrafts
- (a)
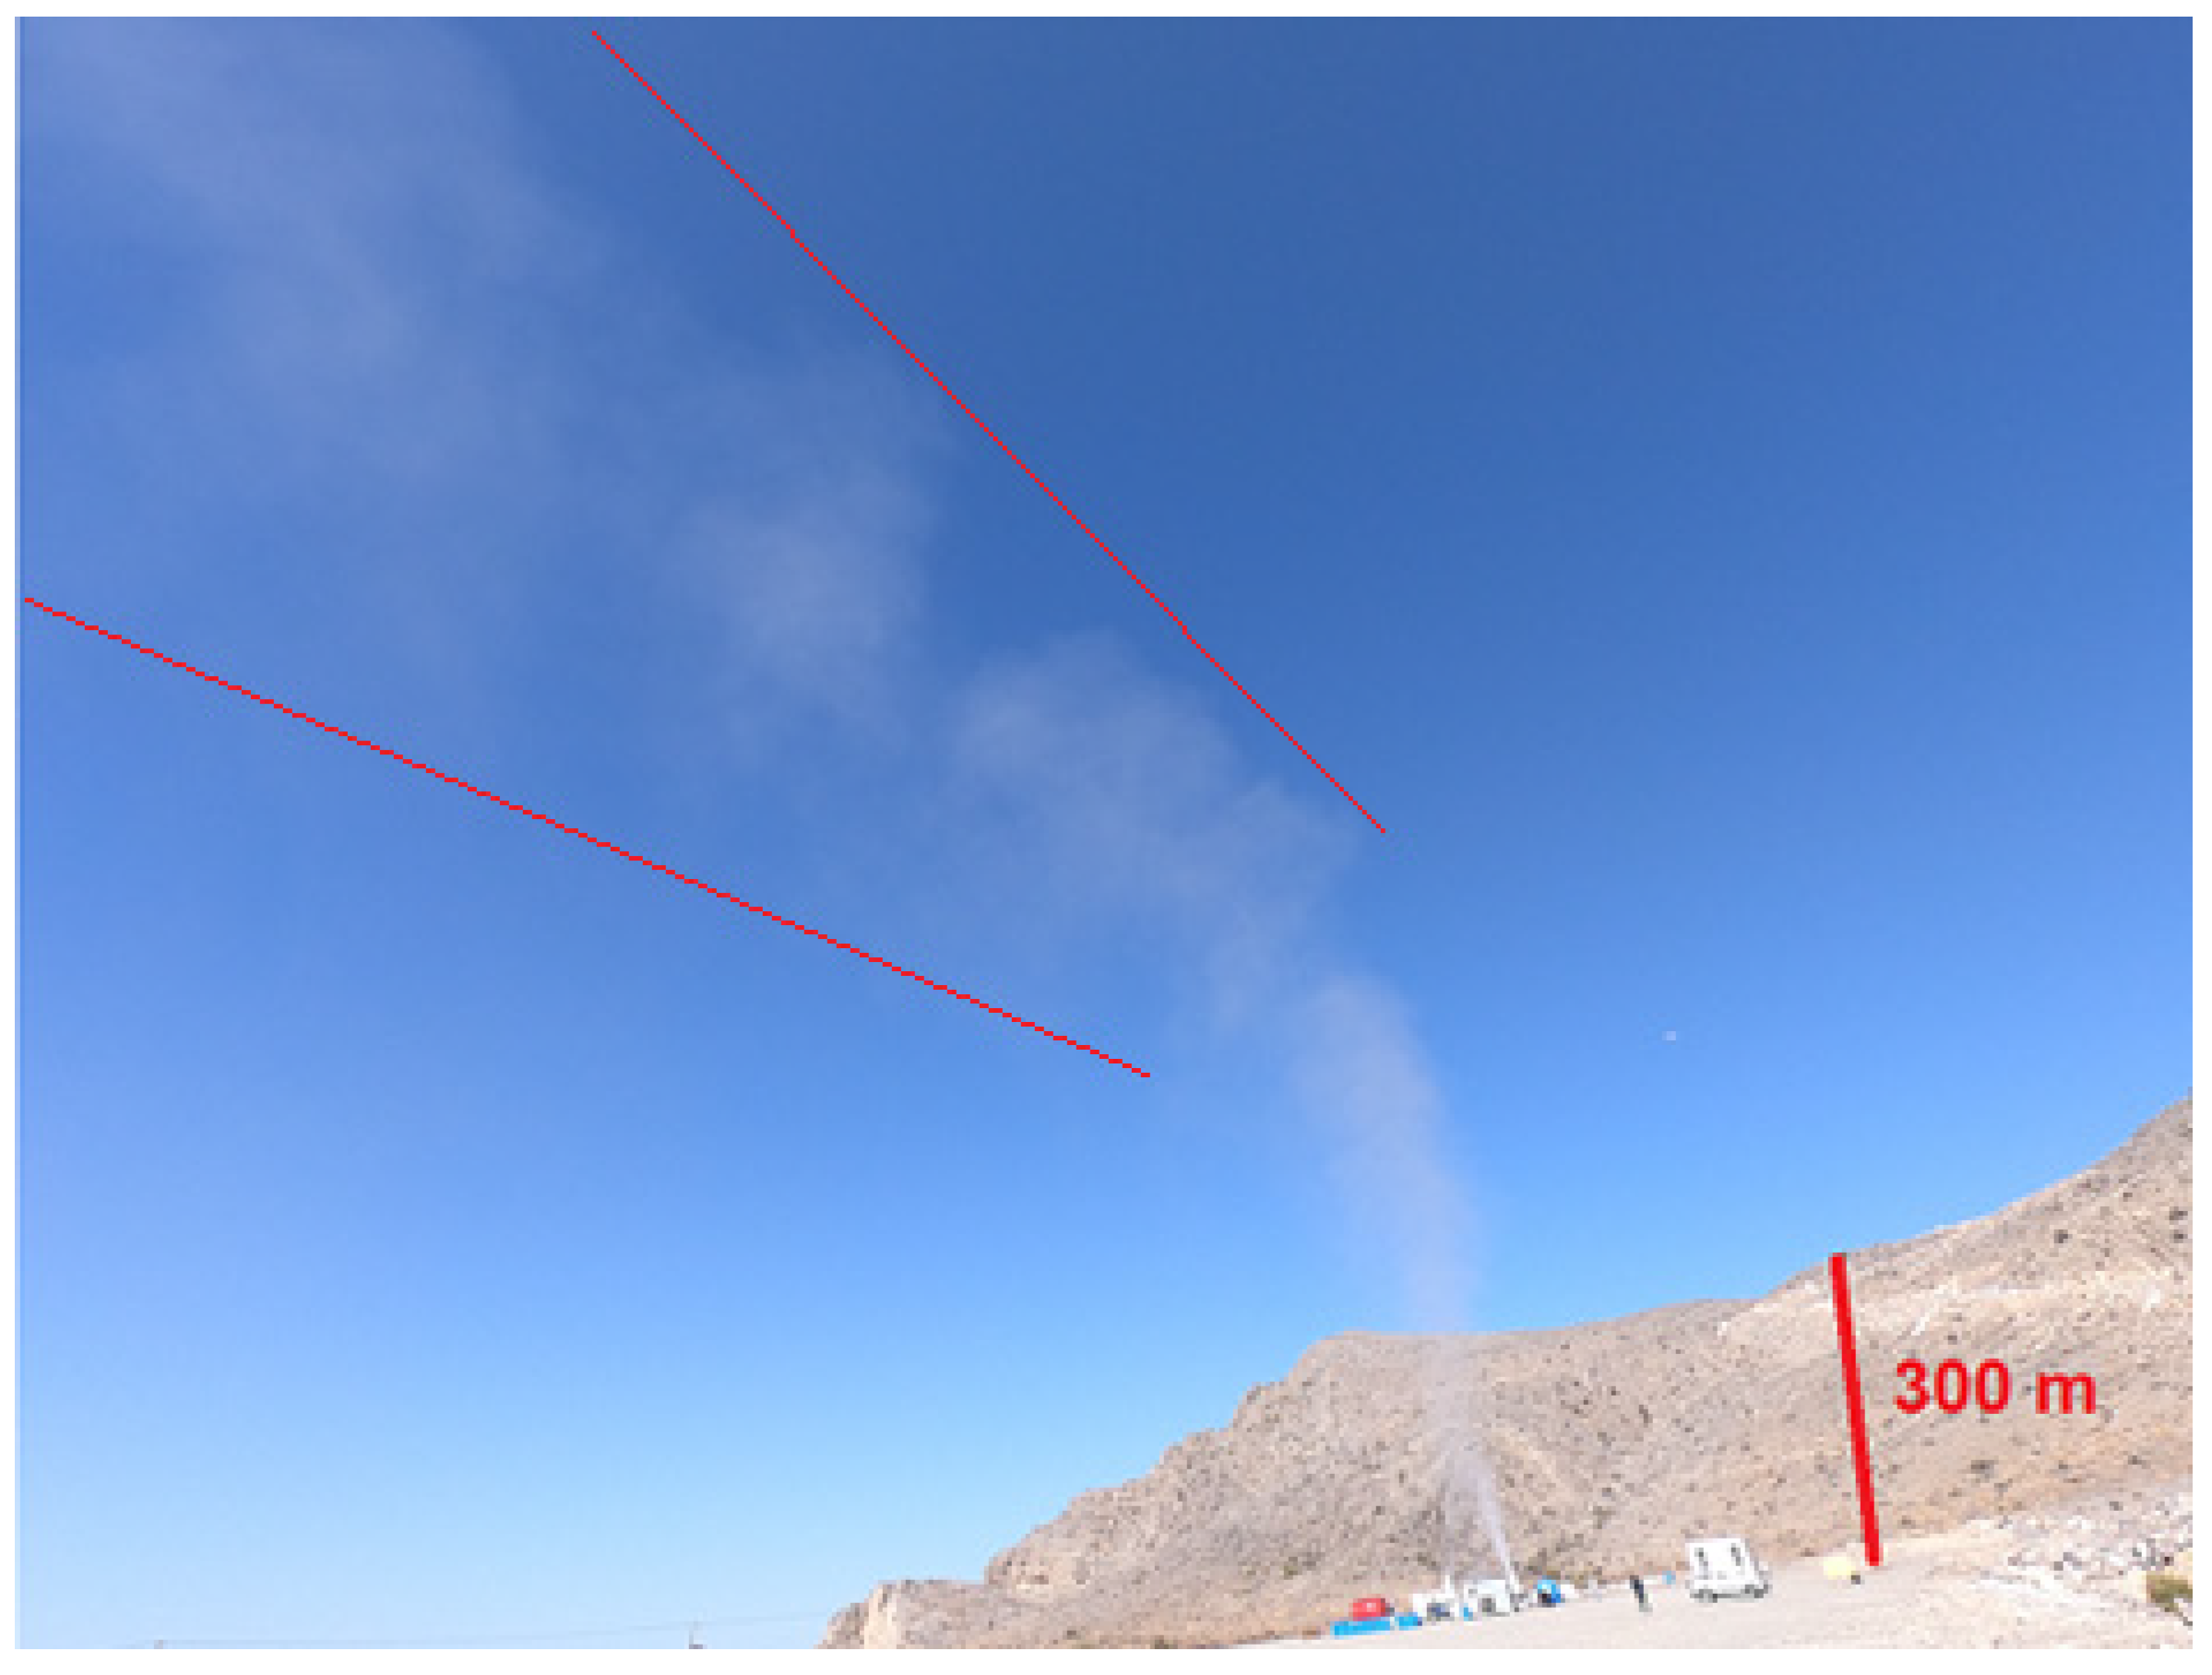
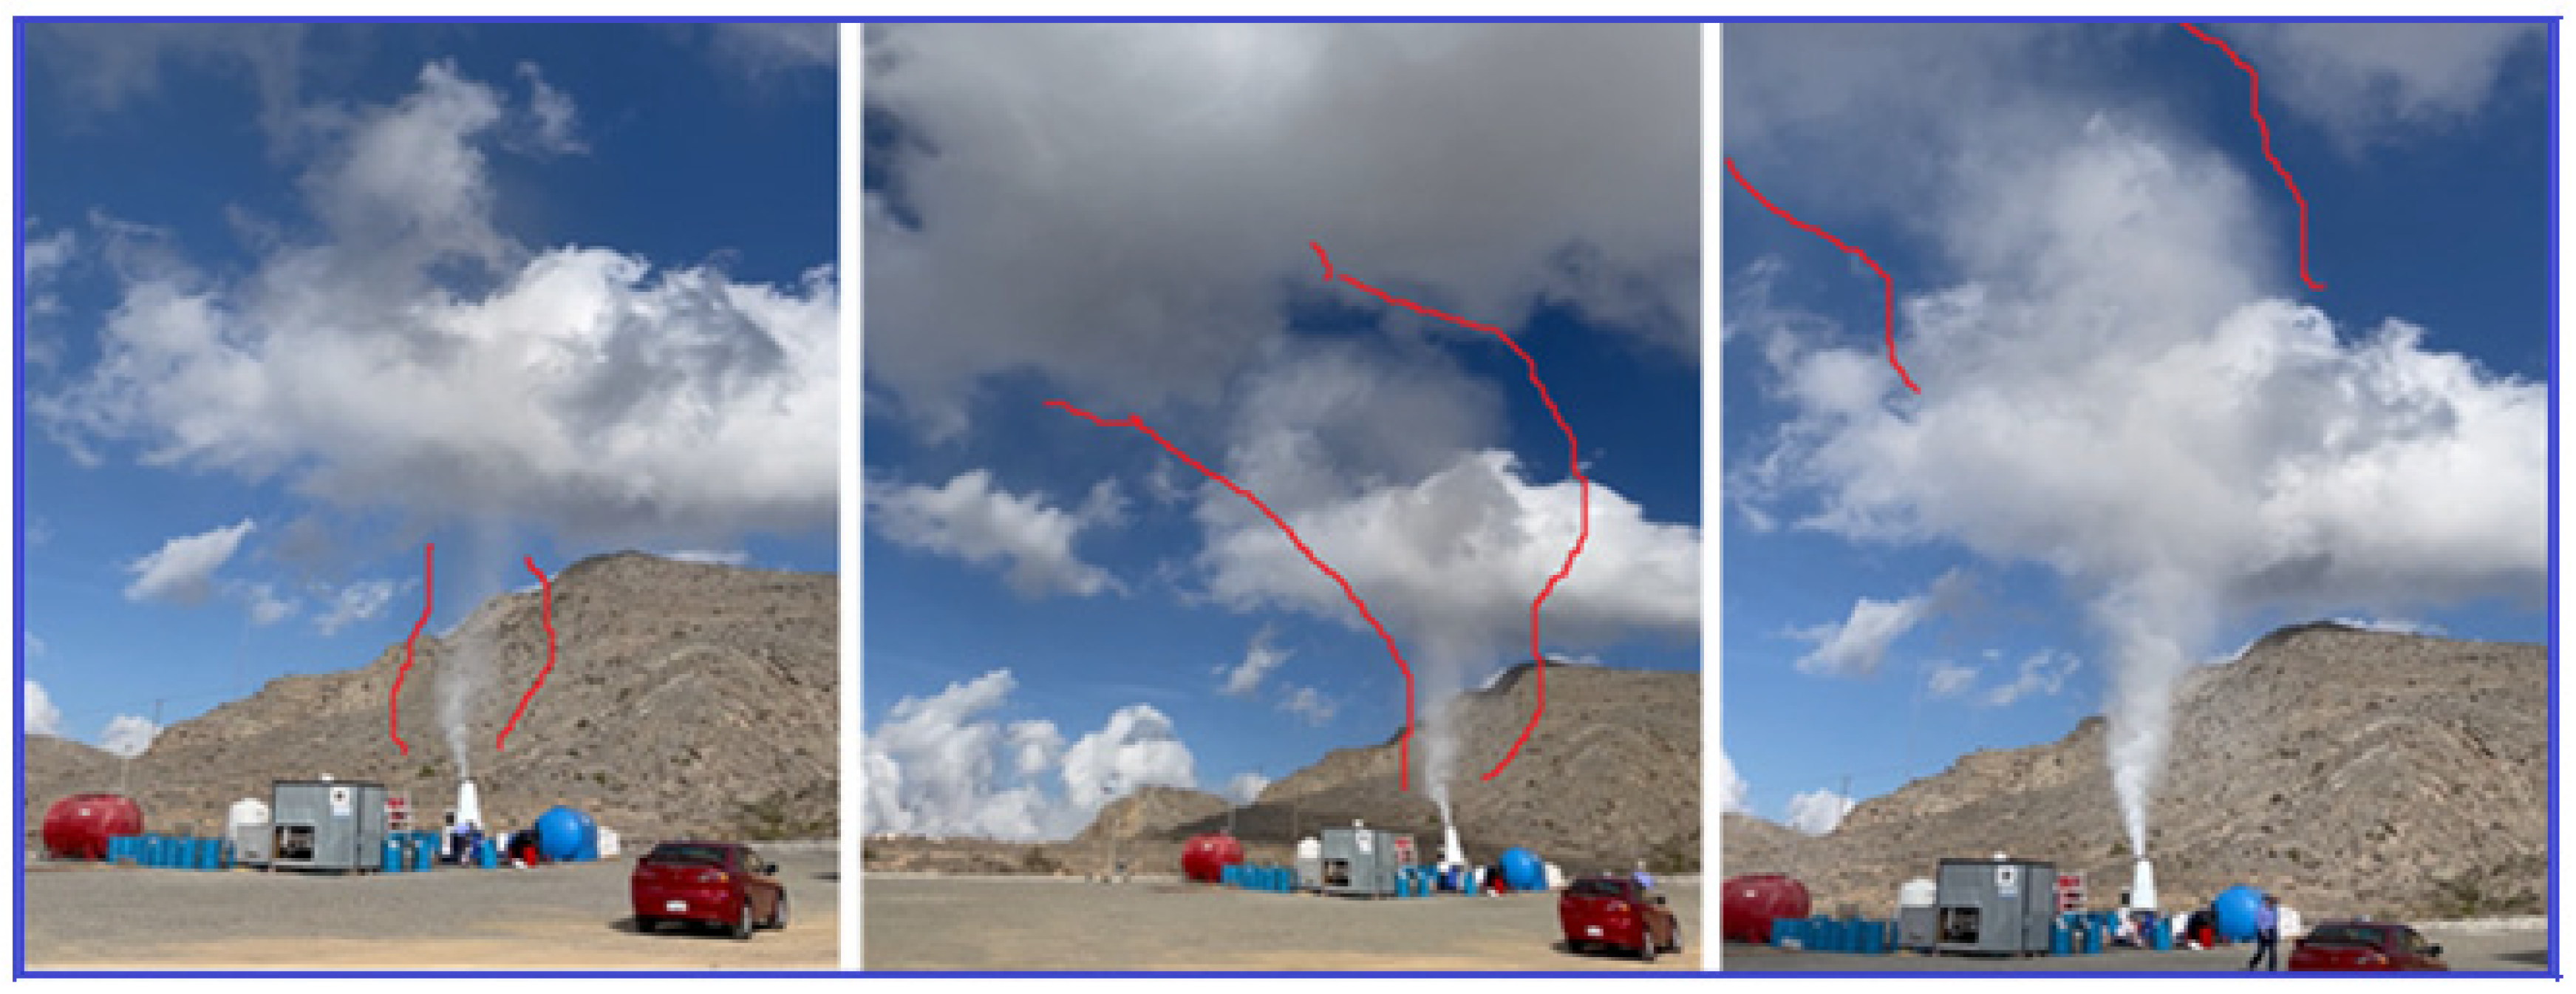
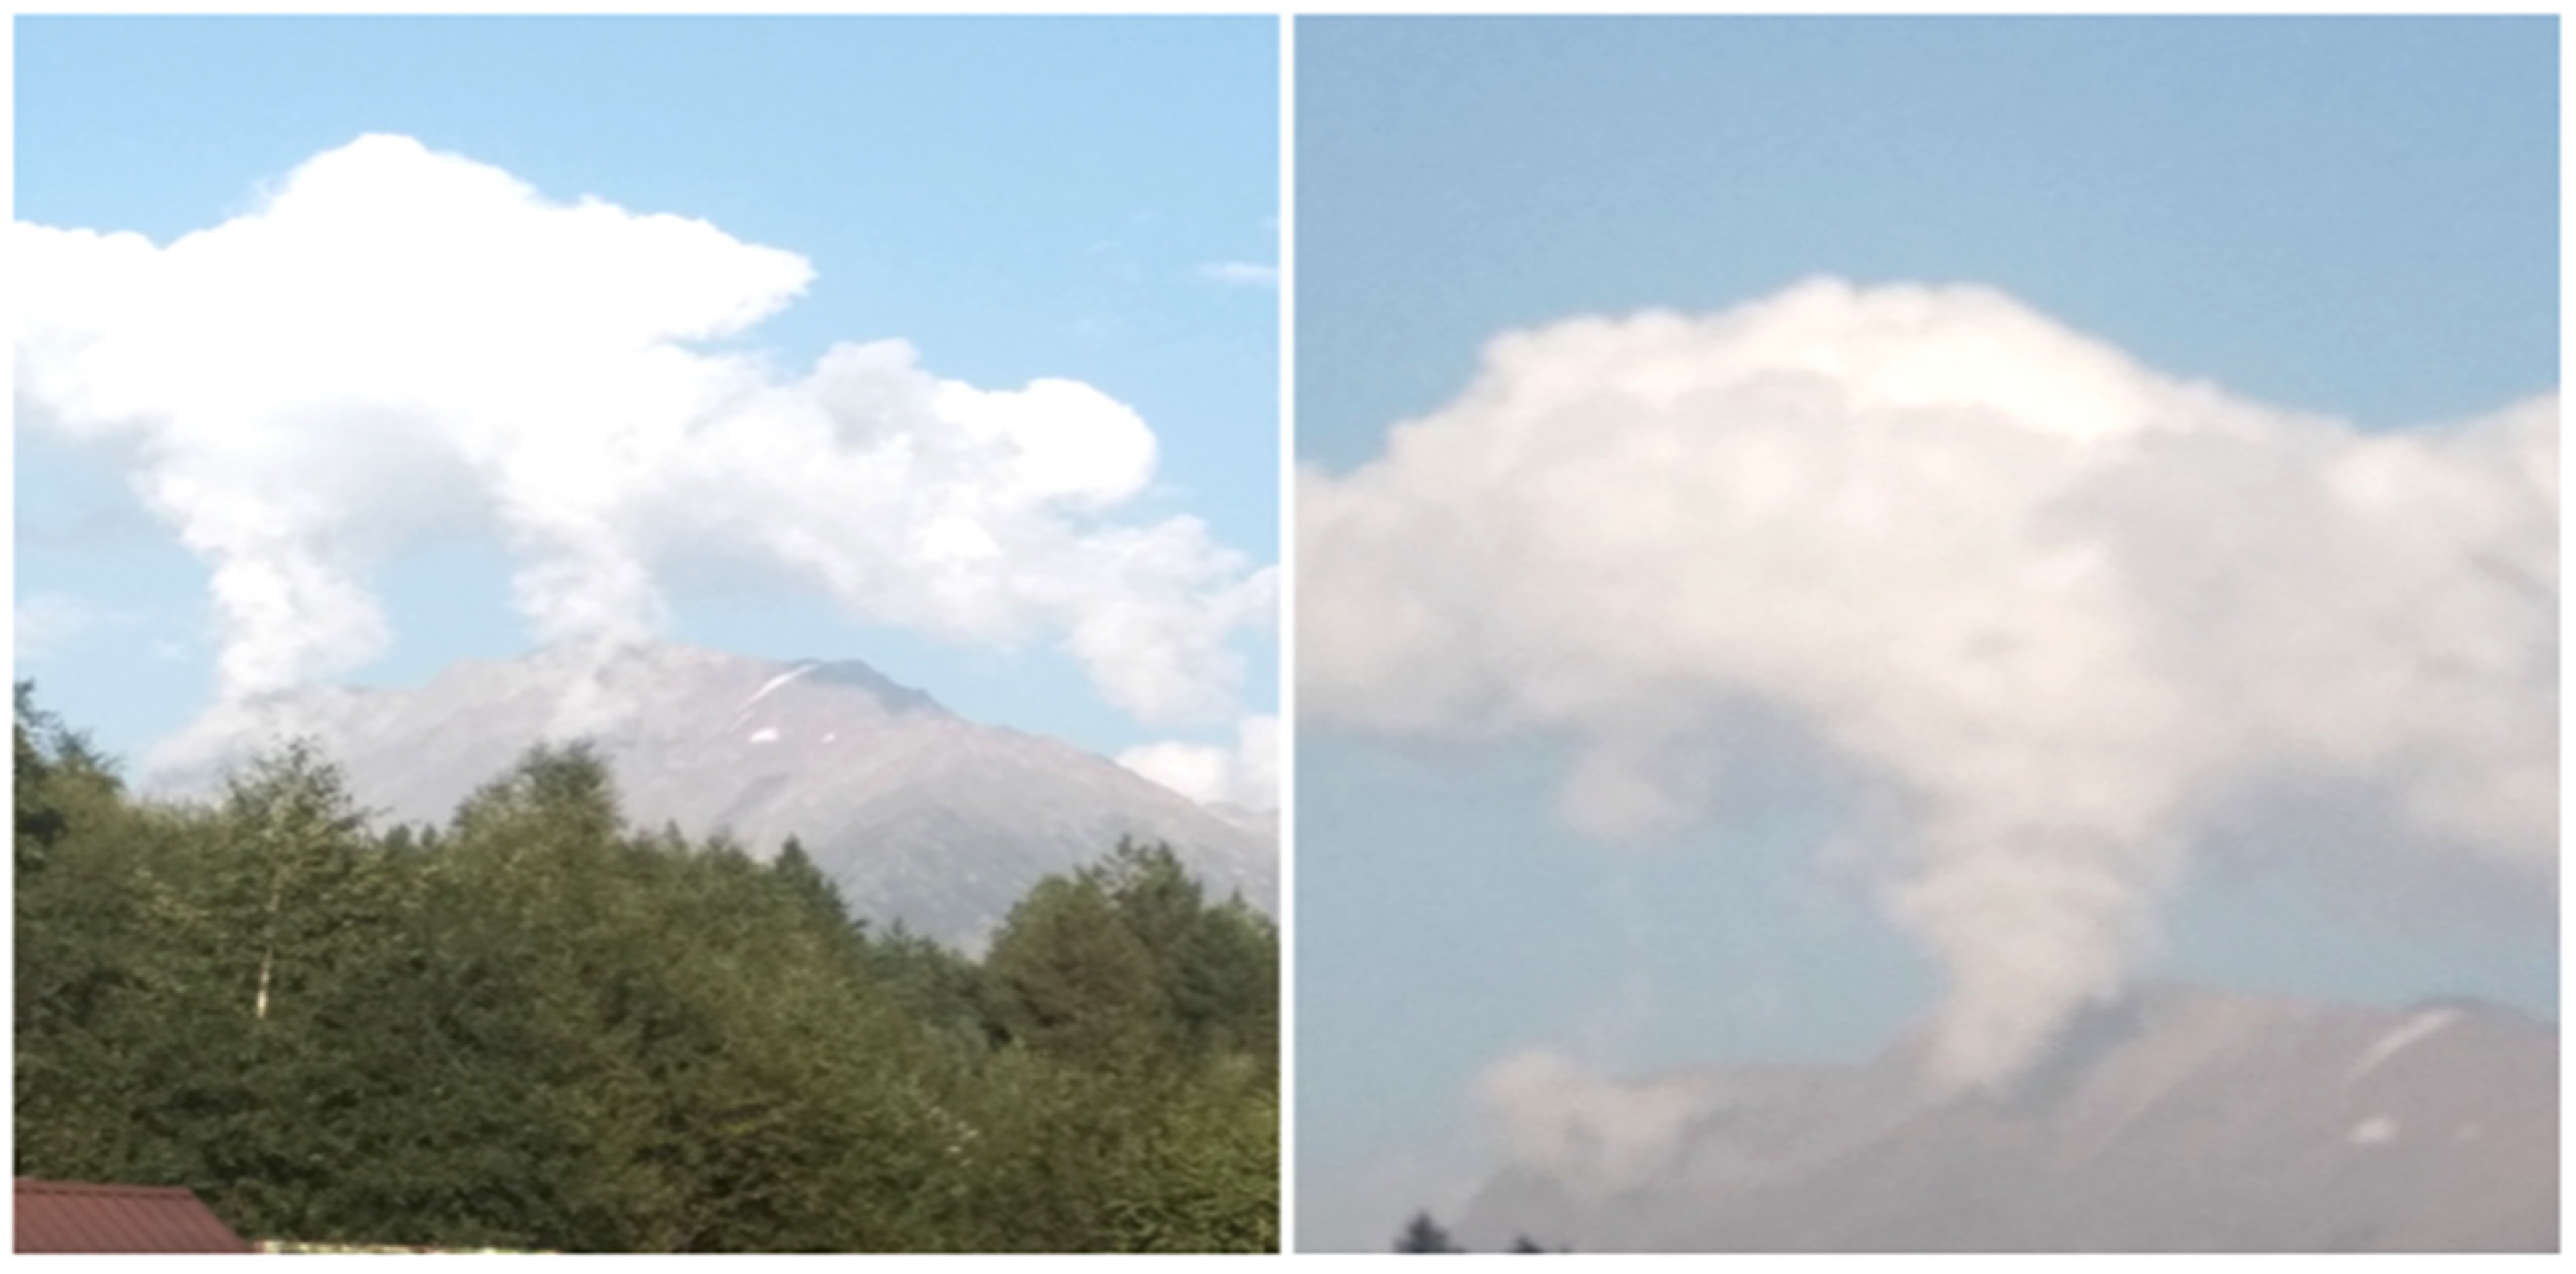
- An artificial updraft jet injected into a cloudless space was usually observed against a blue sky as a translucent light plume, which was almost vertical near the ground, and deviated in the direction of the wind as the height increased (see Figure 5).
- (b)
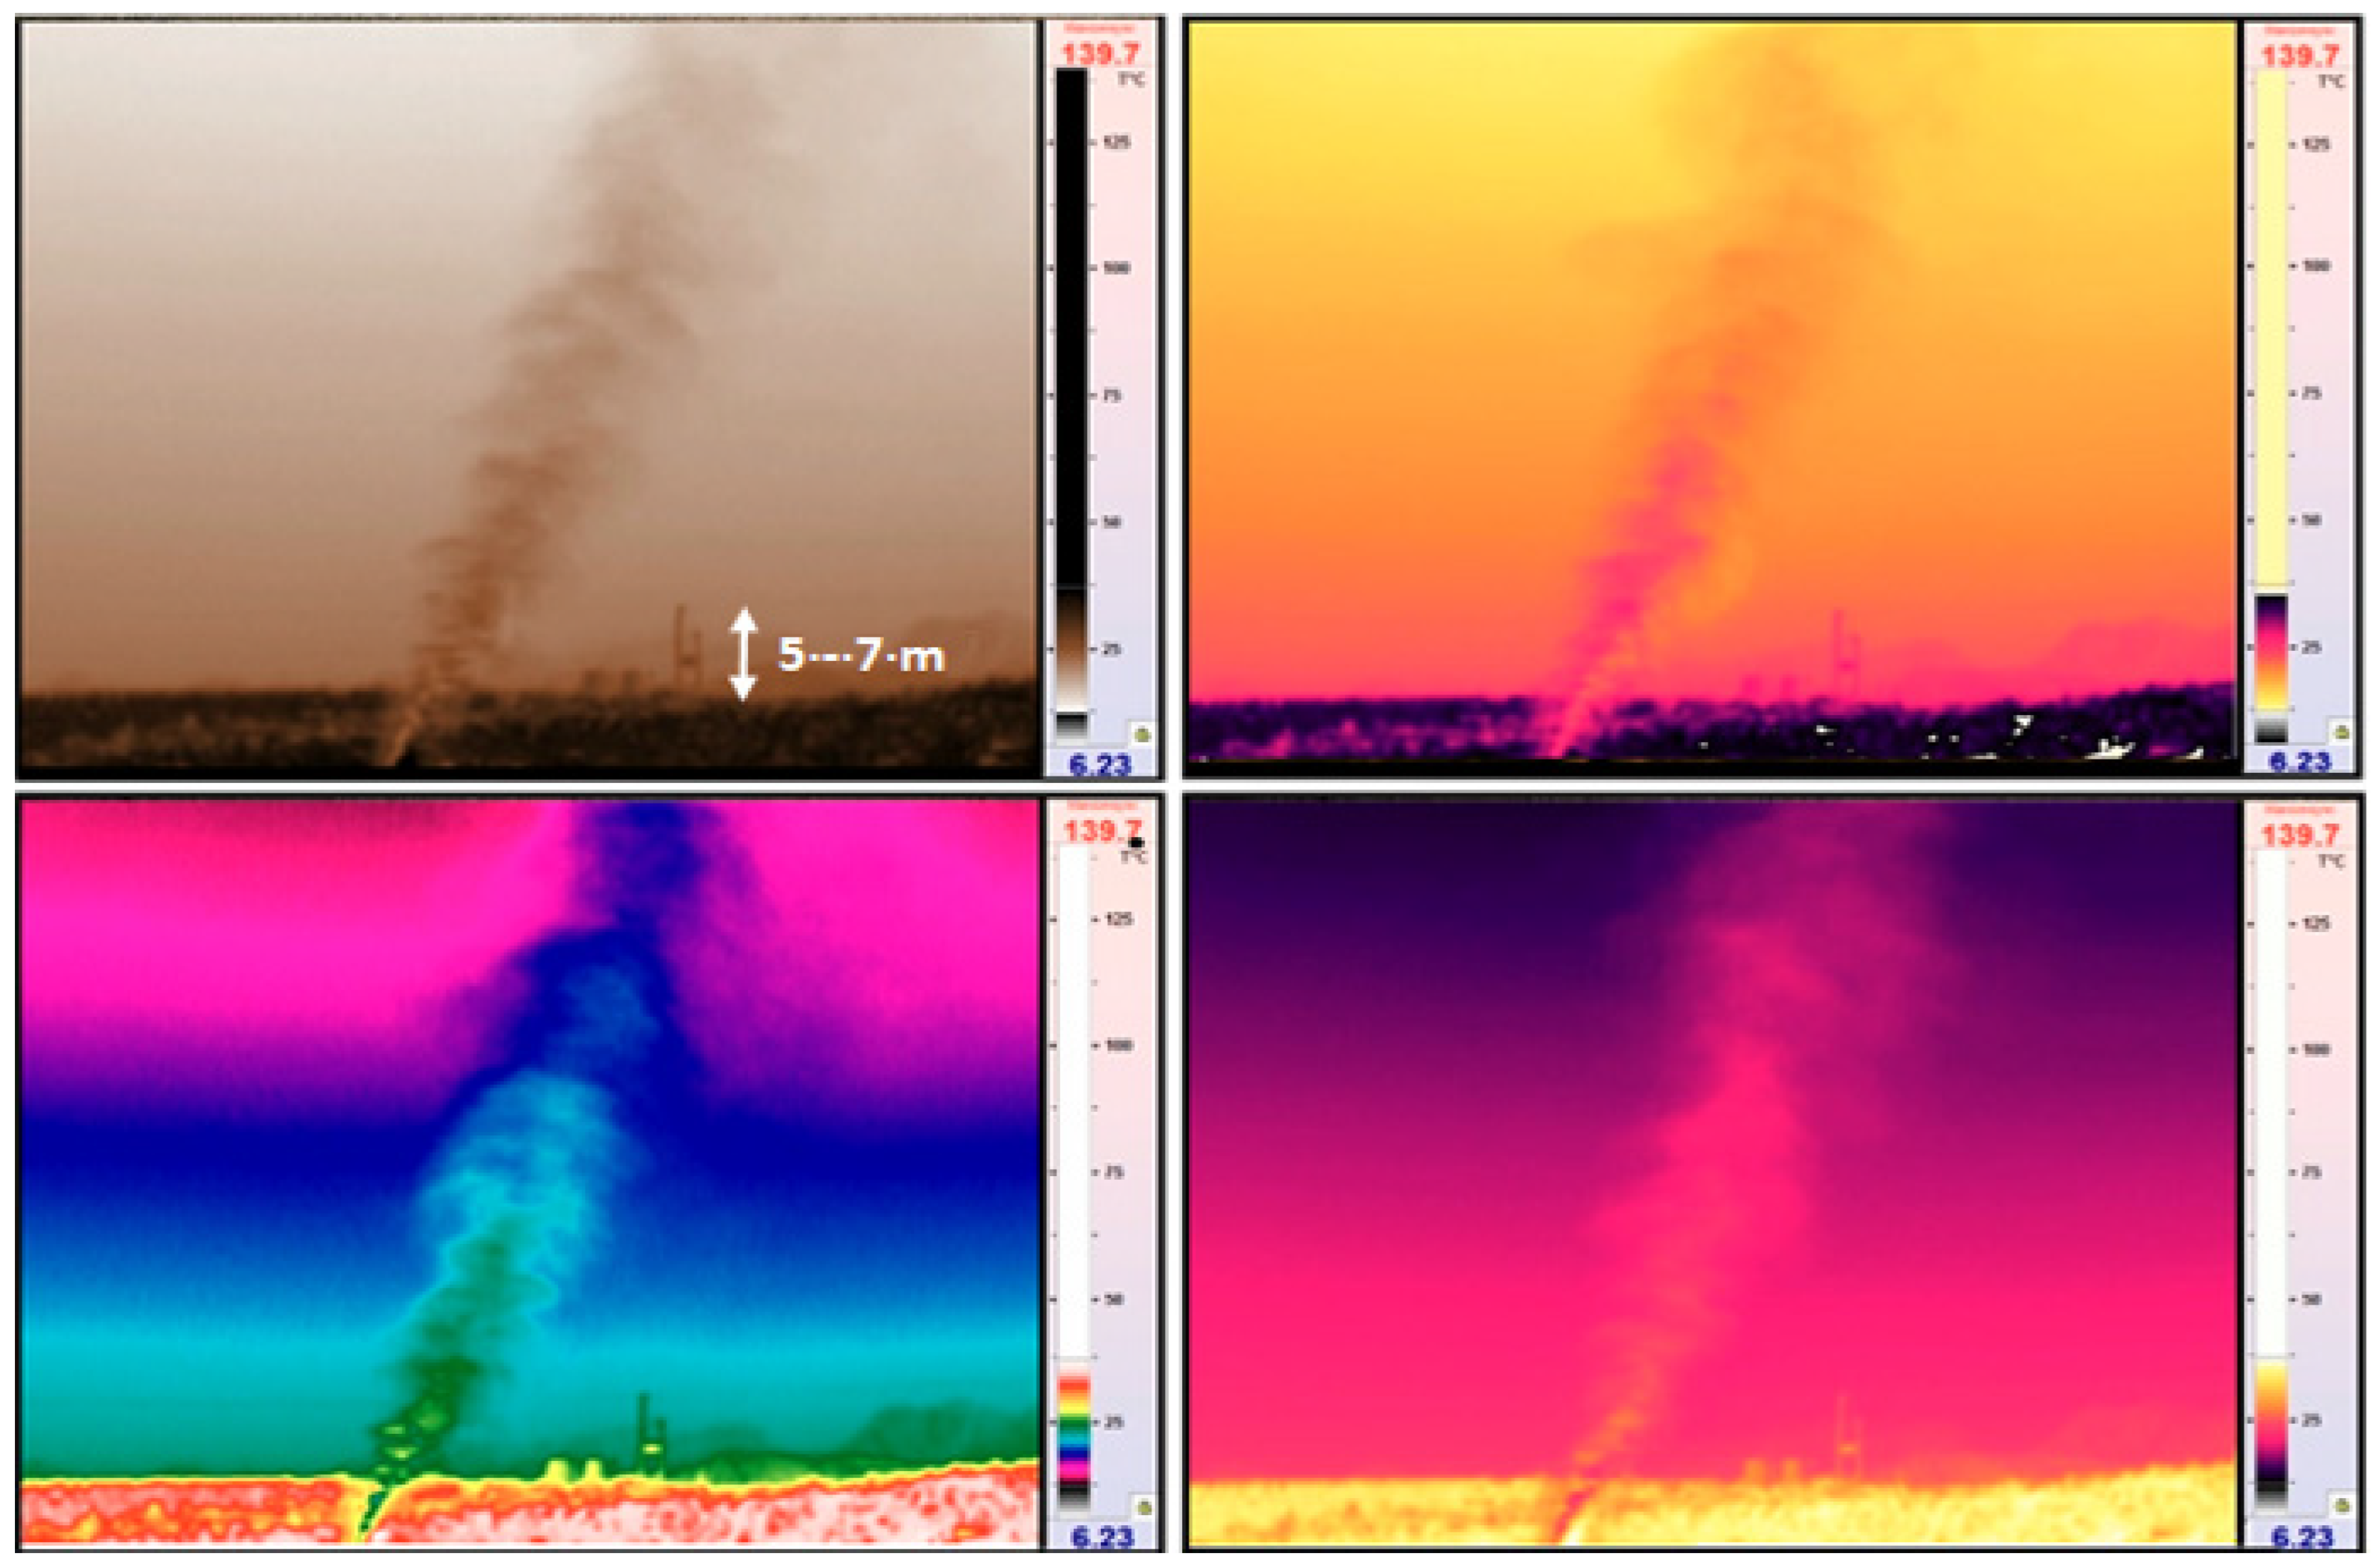
- The temperature of the jet at its edge when entering the atmosphere, according to the Digital Thermometer (TM902C), reached 275–300 °C. It was not possible to measure the temperature within the center of the jet flow.
- (c)
- (d)
- (e)
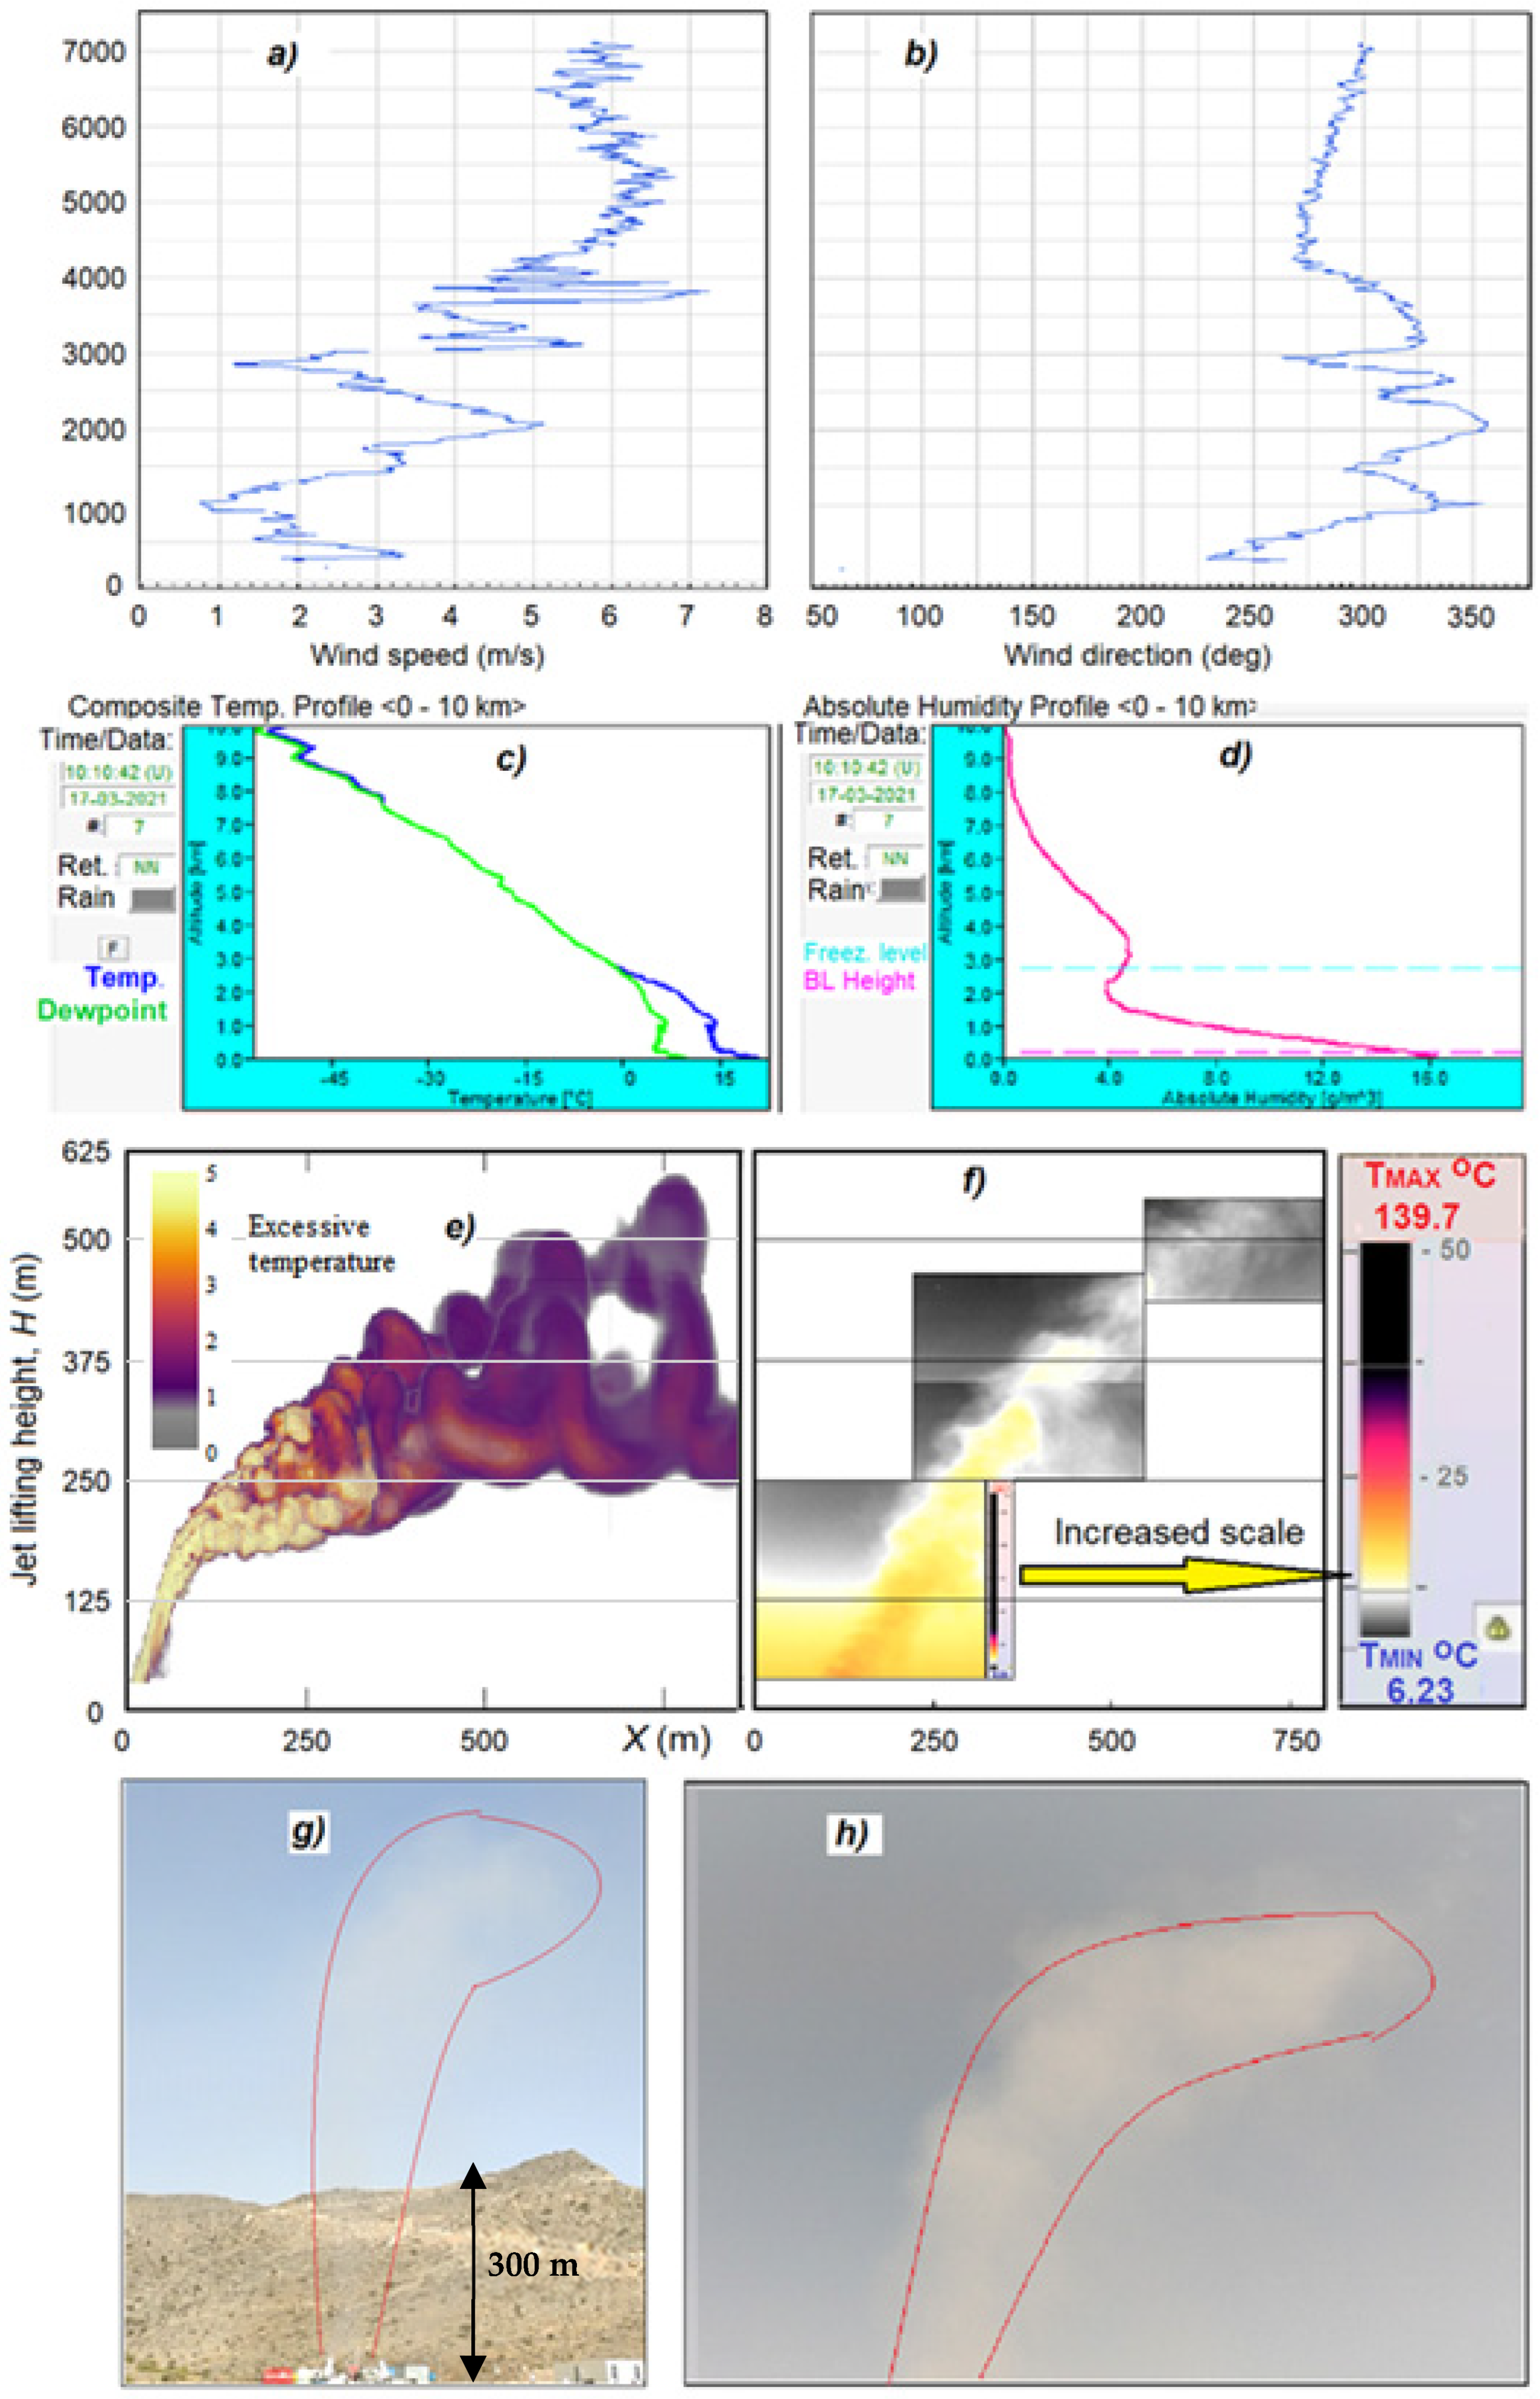
- The updraft velocity at 400 m was as high as 3 m/s according to the UAV meteorological drone (see Figure 8).
- (f)
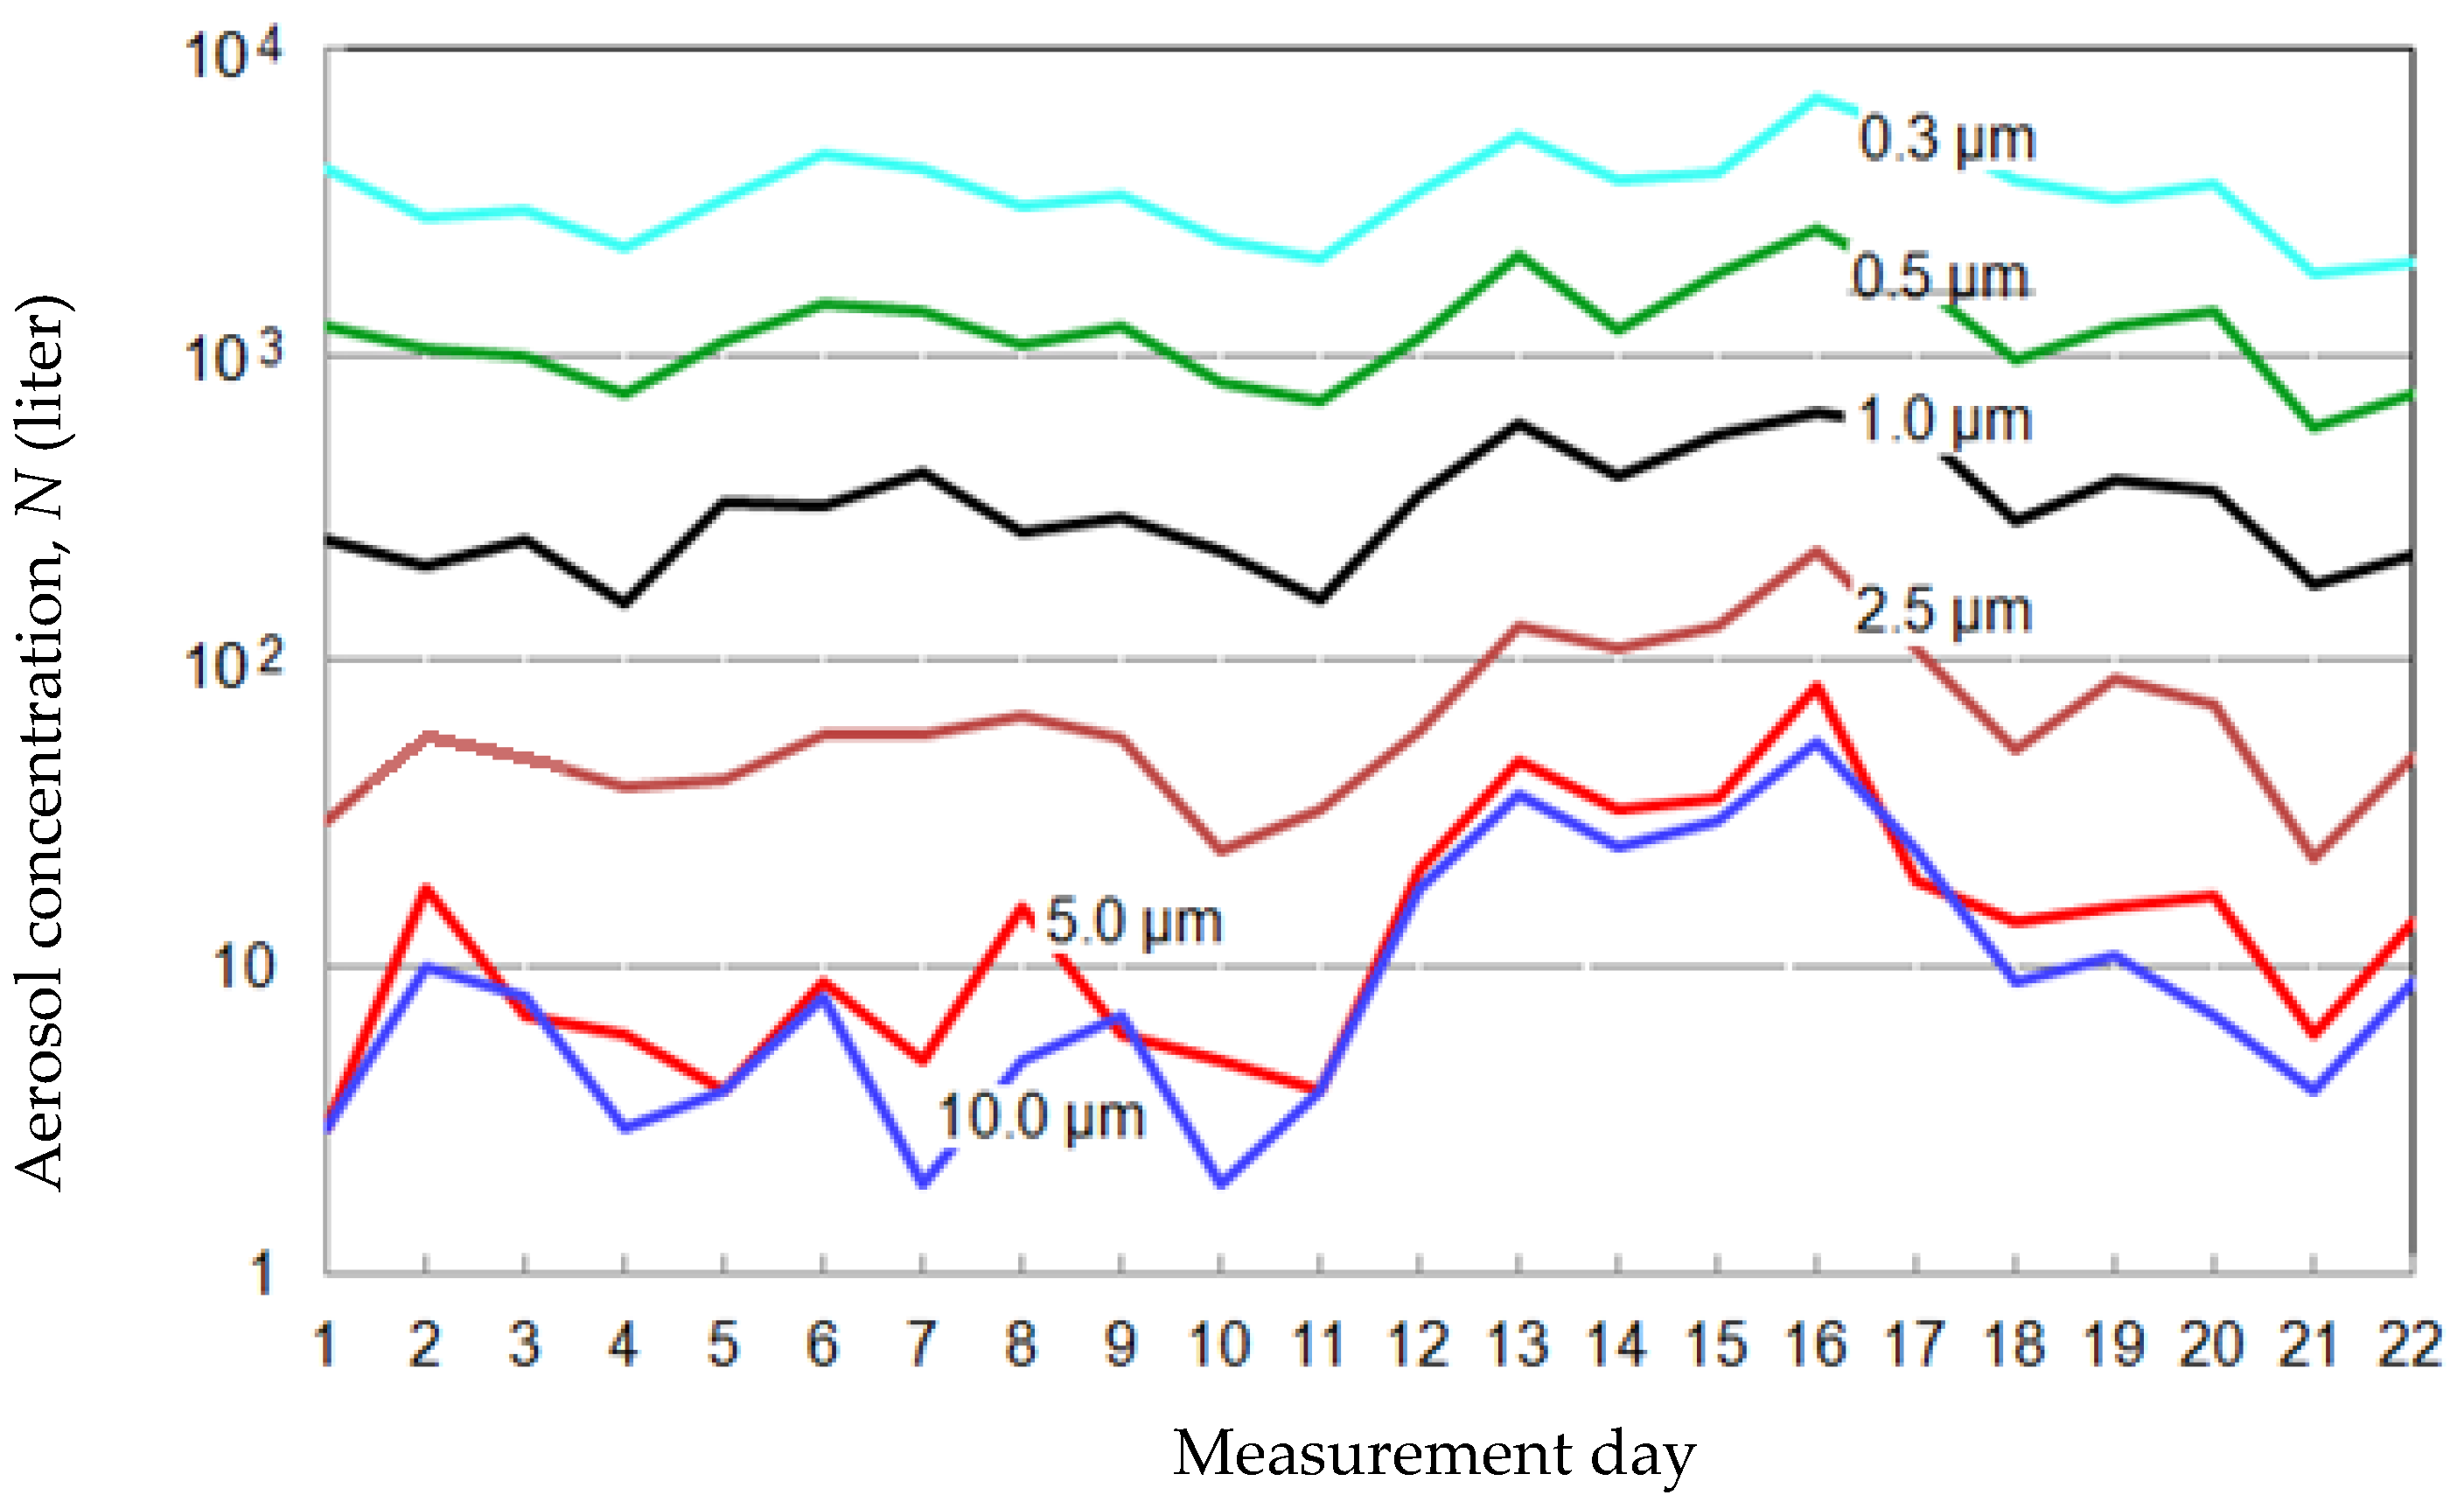
- The concentration of natural aerosol over the site in the afternoon in the size ranges of 0.3, 0.5, 1.0, 2.5, 5, 10 µm averaged about 3496, 1235, 335, 71, 18, and 12 in liter, respectively (see Figure 9). This concentration increased up to two times at high wind speed on 16–17 March.
- (g)
- According to the PK200-03 pyranometer, the solar flux on a flat surface varied on different days within the range of 0.85–1.0 kW/m2.
- (h)
- The noise level of the experimental setup, according to noise meter MEGEON 92131, reached 132 dB of sound-pressure level with a maximum of 135 dB at maximum engine speed.
5.2. Effects Discovered as a Result of Experiments
6. Discussion of Experimental Results
- 13 cases with a cloudless sky—the formation of a jet plume in the form of almost transparent aerosol cloud;
- three cases—compaction and further formation of the enlightenment zone of clouds into which a jet saturated with hygroscopic aerosols was injected;
- three cases—the appearance of a radar echo spot on the downwind side 15–20 min after the start of the jet-producing device. Perhaps this was due to the action of the jet directly on clouds like Cu Hum (two cases) and St (one case);
- two cases—convergence of small clouds (Cu Hum type) in the direction of the jet (but this may be due to wind convergence);
- one case—scattering of a cumulus cloud as it passed over the jet.
7. Conclusions and Recommendation
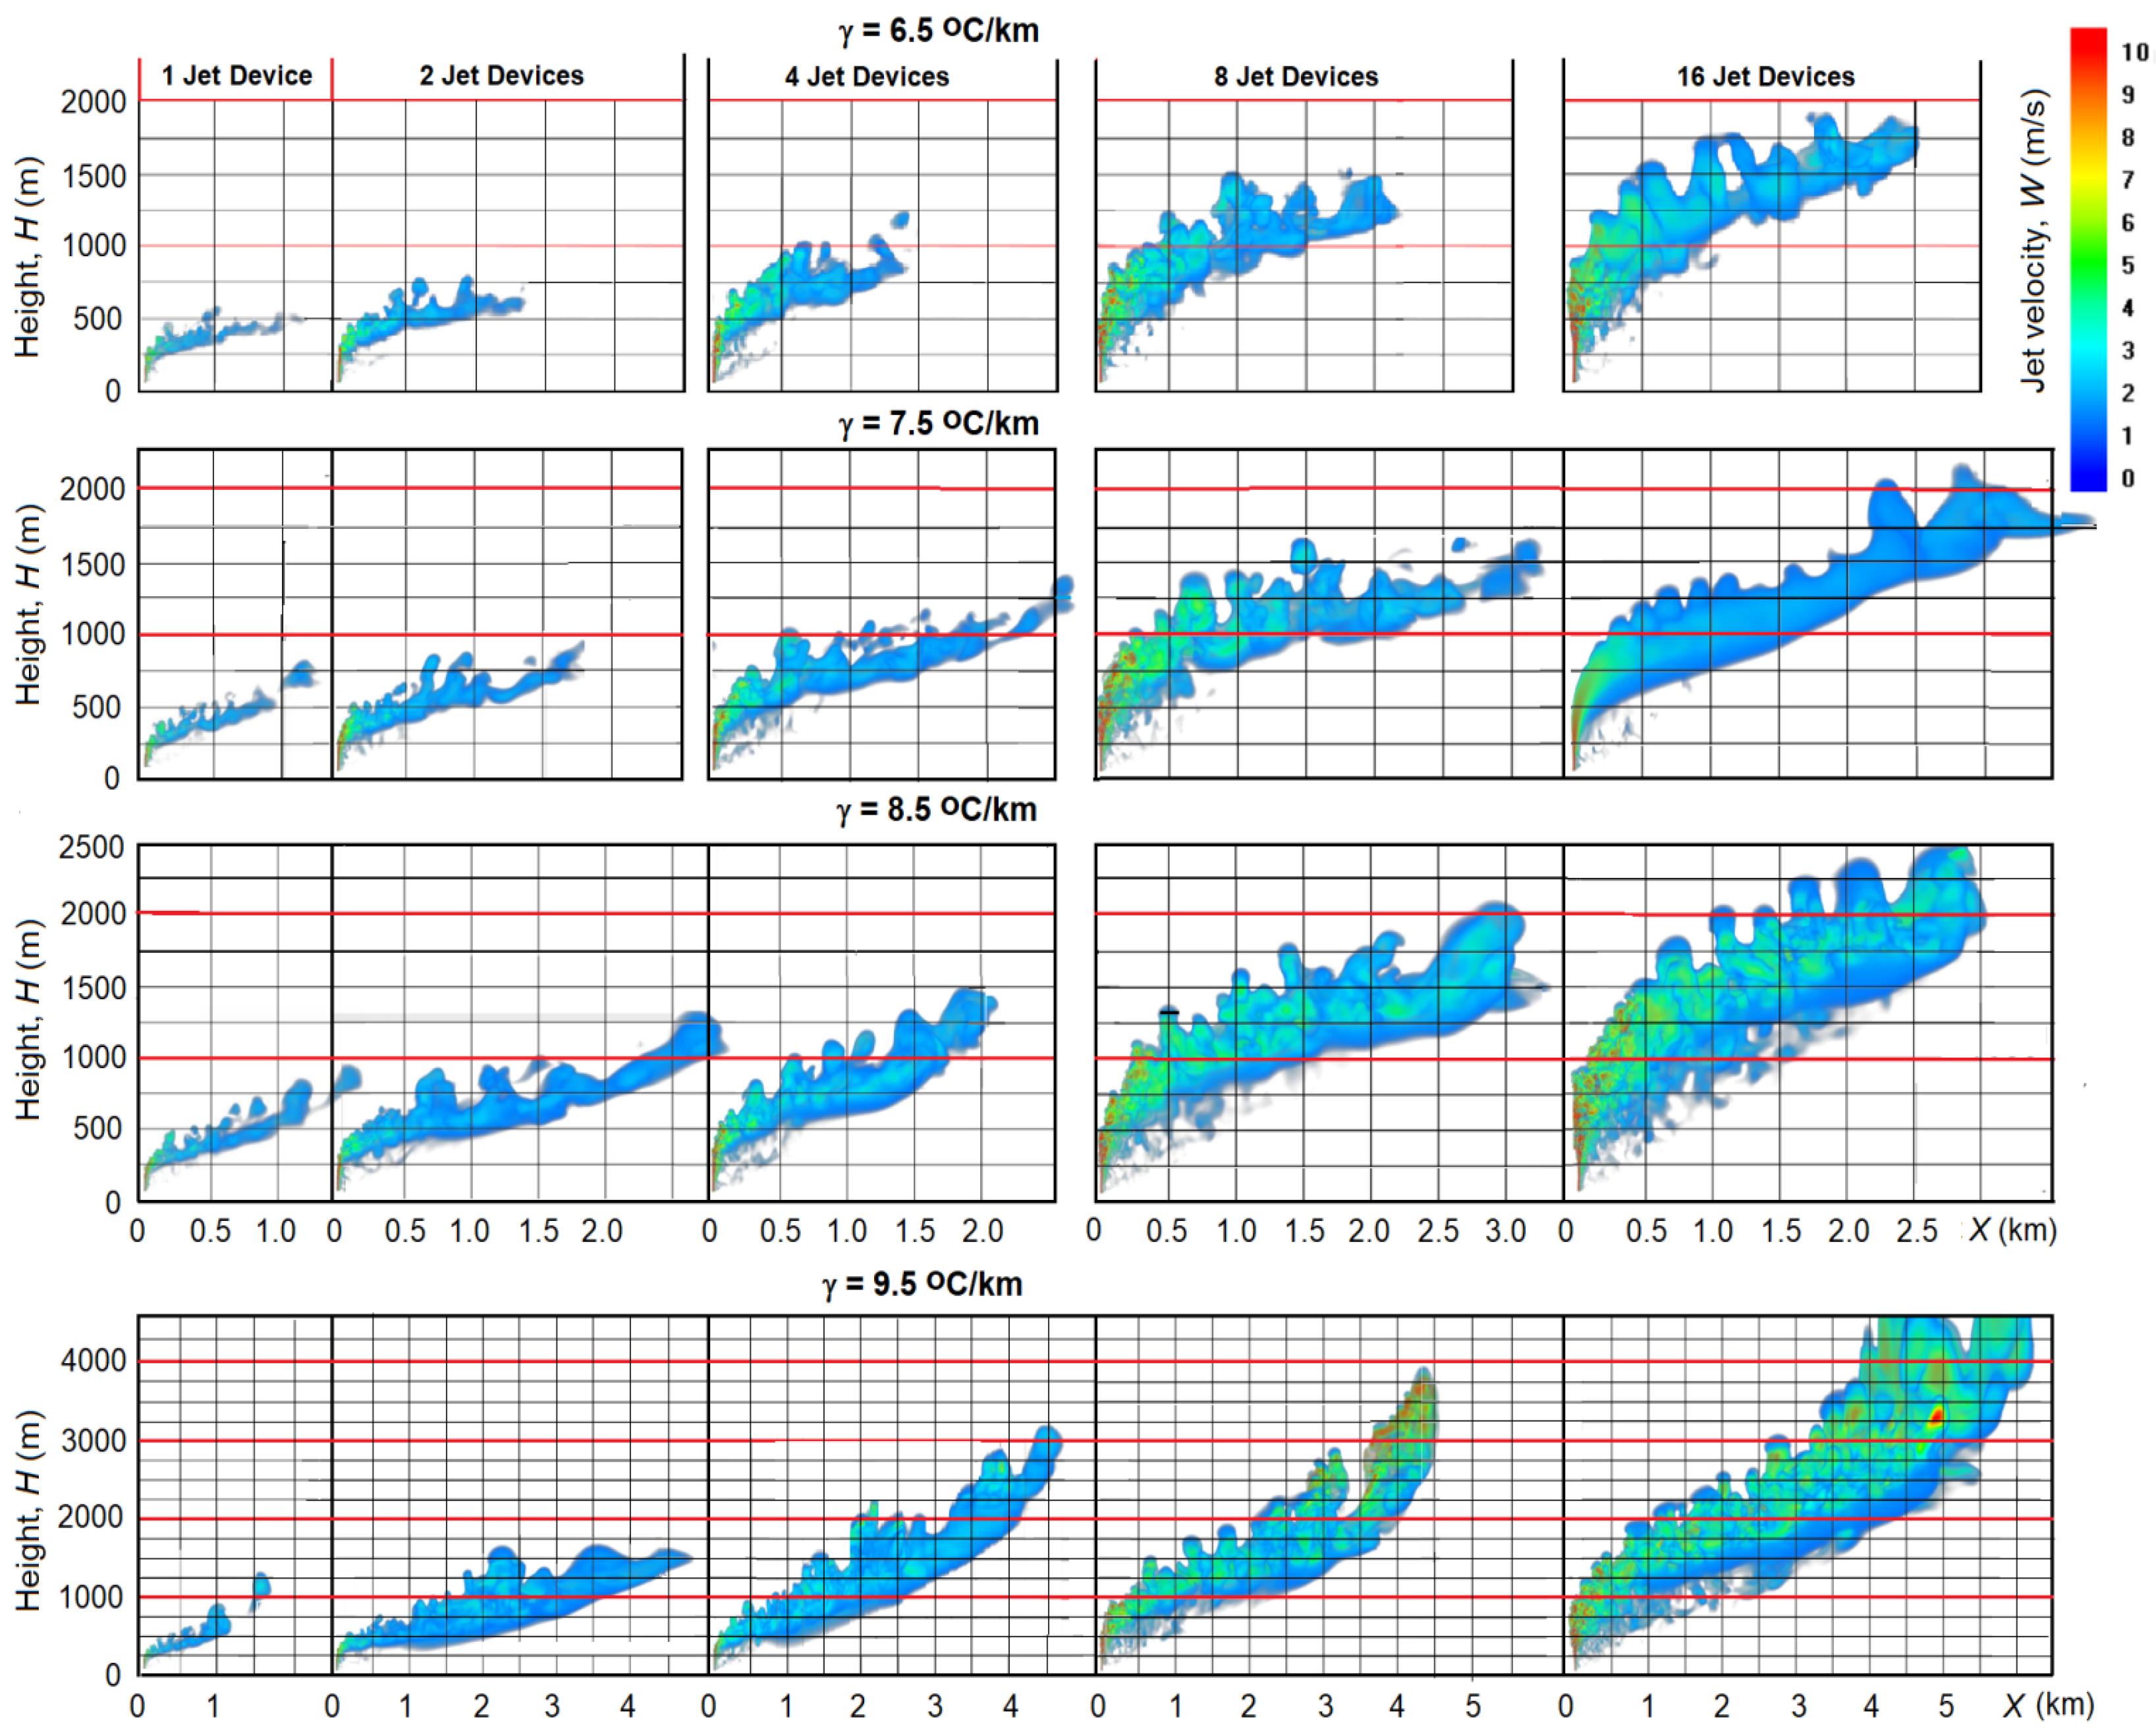
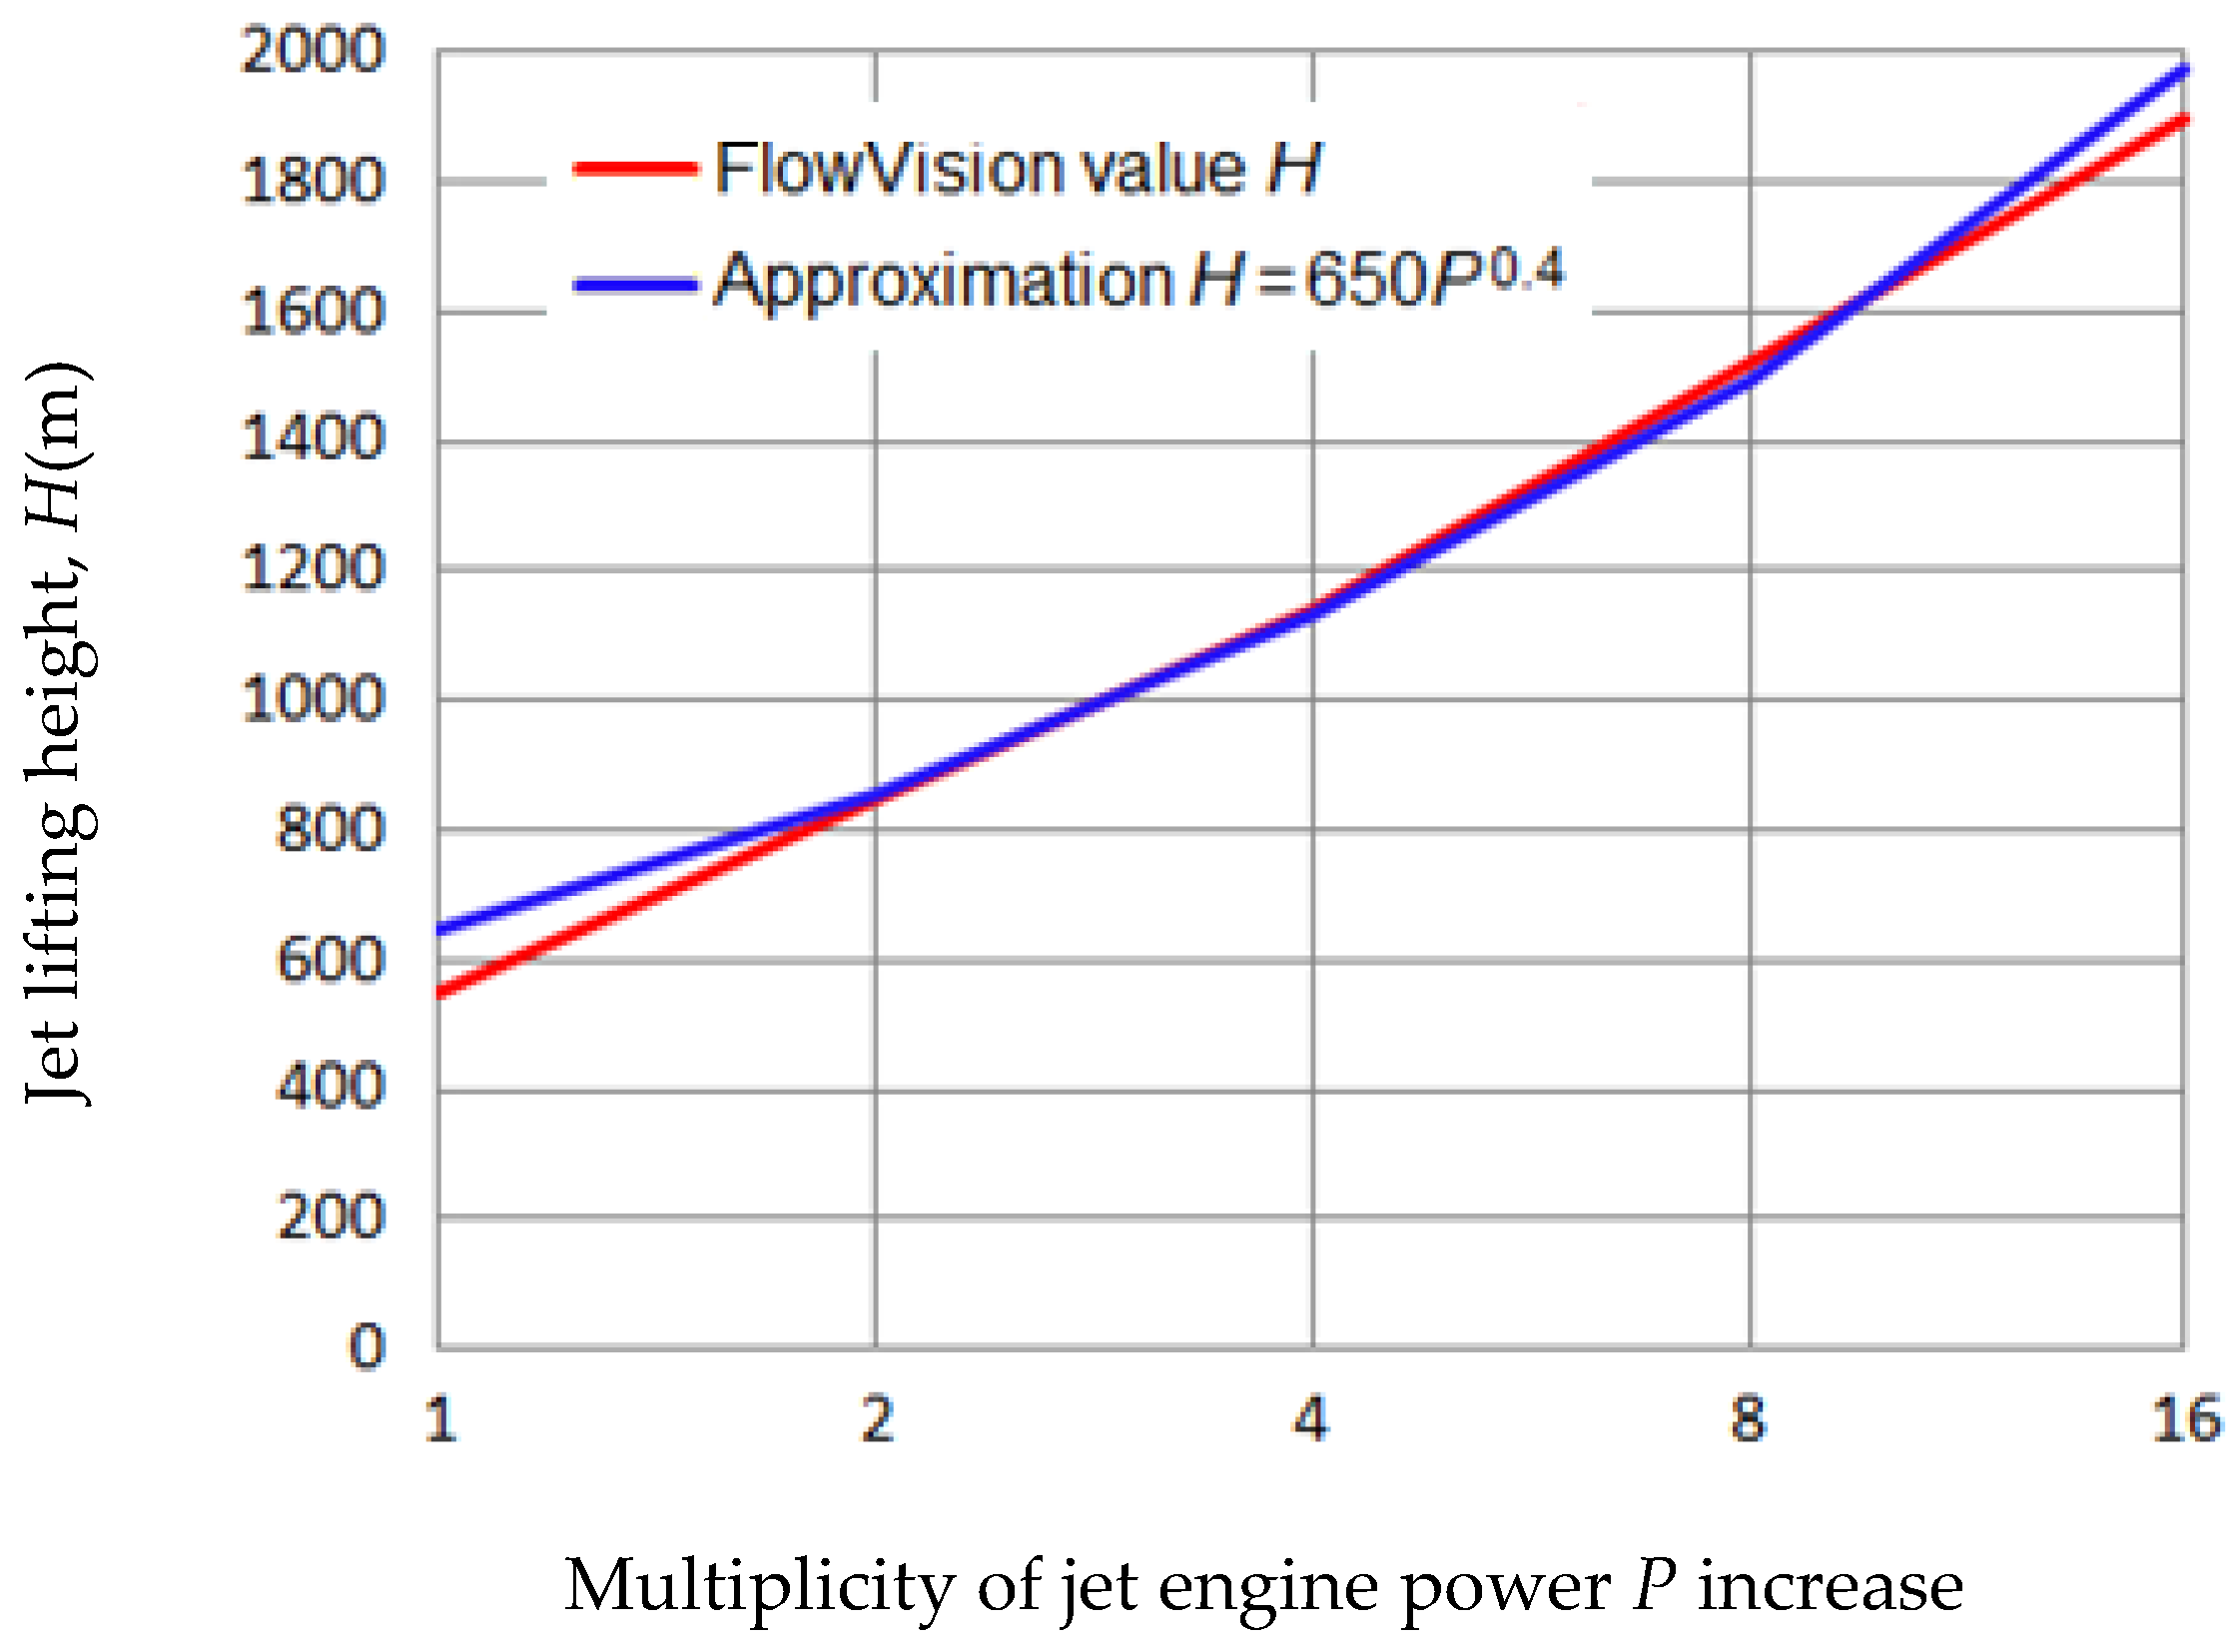
- Create an experimental device consisting of several and more powerful aircraft engines arranged to create a powerful updraft over an area comparable to the size of natural thermals.
- Develop a new hygroscopic aerosol that can provide: faster condensation of water vapor when the jet rises (i.e., in 5–10 s); water vapor condensation at air humidity less than fo < 40%; and condensation of water vapor, many times its mass, for example, by further improving the core/shell NaCl/TiO2 aerosol.
Author Contributions
Funding
Institutional Review Board Statement
Informed Consent Statement
Data Availability Statement
Conflicts of Interest
References
- Li, J.; Song, S.; Ayantobo, O.O.; Wang, H.; Liang, J.; Zhang, B. Coordinated allocation of conventional and unconventional water resources considering uncertainty and different stakeholders. J. Hydrol. 2022, 605, 127293. [Google Scholar] [CrossRef]
- Qadir, M. UN-Water Analytical Brief on Unconventional Water Resources, Geneva, Switzerland, 59p. Available online: https://www.unwater.org/app/uploads/2020/08/UN-Water-Analytical-Brief-on-Unconventional-Water-Resources.pdf (accessed on 17 December 2022). [CrossRef]
- Qadir, M.; Smakhtin, V.; Koo-Oshima, S.; Guenther, E. (Eds.) Unconventional Water Resources; Springer Nature: Cham, Switzerland, 2022; Available online: https://link.springer.com/book/9783030901455#aboutBook (accessed on 10 December 2022).
- Flossmann, A.; Manton, M.; Abshaev, A.; Bruintjes, R.; Murakami, M.; Prabha, T.; Yao, Z. Review of Advances in Precipitation Enhancement Research. Bull. Am. Meteorol. Soc. 2019, 100, 1465–1480. [Google Scholar] [CrossRef]
- Abshaev, A.M.; Flossmann, A.; Siems, S.T.; Prabhakaran, T.; Yao, Z.; Tessendorf, S. Rain Enhancement Through Cloud Seeding. In Unconventional Water Resources; Springer: Cham, Switzerland, 2022. [Google Scholar] [CrossRef]
- Danelyan, B.G.; Kovalyov, N.A.; Sazhin, I.B.; Sementin, V.L.; Stolpichenko, O.A. Suppression of Wildfires by Means of Artificial Callings of Rainfall. Condition of the Question and Preliminary Results. Proc. All-Russ. Conf. Clouds and Weather Modification. 2017; 228–236. [Google Scholar]
- Wehbe, Y.; Temimi, M.A. Remote Sensing-Based Assessment of Water Resources in the Arabian Peninsula. Remote Sens. 2021, 13, 247. [Google Scholar] [CrossRef]
- Wehbe, Y.; Temimi, M.; Ghebreyesus, D.T.; Milewski, A.; Norouzi, H.; Ibrahim, E. Consistency of precipitation products over the Arabian Peninsula and interactions with soil moisture and water storage. Hydrol. Sci. J. 2018, 63, 408–425. [Google Scholar] [CrossRef]
- Al Mazroui, A. Advancing the Science, Technology and Implementation of Rain Enhancement; Project of Water Security Solutions in Arid and Semi-Arid Regions and Beyond; UAE Research Program for Rain Enhancement Science: Abu Dhabi, United Arab Emirates, 2017. [Google Scholar] [CrossRef]
- Cunningham, P.; Reeder, M.J. Severe convective storms initiated by intense wildfires: Numerical simulations of pyro-convection and pyro-tornado genesis. Geophys. Res. Lett. 2009, 36, L12812. [Google Scholar] [CrossRef]
- Ebert, C.H.V. The meteorological factor in the Hamburg fire storm. Weather-Wise 1963, 16, 70–75. [Google Scholar] [CrossRef]
- Fromm, M.; Bevilacqua, R.; Servranckx, J.; Rosen, J.; Thayer, J.; Herman, J.; Larko, D. Pyro-cumulonimbus injection of smoke to the stratosphere: Observations and impact of a super blowup in northwestern Canada on 3–4 August 1998. J. Geophys. Res. 2005, 110, D08205. [Google Scholar] [CrossRef]
- Atkinson, B.W. The Mechanical Effect of an Urban Area on Convective Precipitation; Occasional Paper 3; Department of Geography, Queen Mary College, University of London: London, UK, 1975; p. 27. [Google Scholar]
- Dessens, H. Transfert vertical d’aerosols par convection artificielle. Geofis. Pura Appl. 1961, 50, 183. [Google Scholar] [CrossRef]
- Dessens, H.; Dessens, J. Experiences avec le meteotrone an Centre de Recherches atmospheriques. J. Rech. Atmos. 1964, 1, 158–162. [Google Scholar]
- Chandler, T.J. Urban Climatology and Its Relevance to Urban Design; WMO—No. 438; WMO: Geneva, Switzerland, 1976; ISBN 92-63-10438-7. [Google Scholar]
- Varentsov, M.D.; Wouters, H.; Platonov, V.; Konstantinov, P. Megacity-Induced Mesoclimatic Effects in the Lower Atmosphere: A Modeling Study for Multiple Summers over Moscow, Russia. Atmosphere 2018, 9, 50. [Google Scholar] [CrossRef] [Green Version]
- Khemani, L.T.; Ramana-Murty, B.V. Rainfall Variations in an Urban Industrial Region. J. Appl. Meteorol. 1973, 12, 187–194. [Google Scholar] [CrossRef]
- Goldreieh, Y.; Manes, A. Urban Effects on Precipitation Patterns in the Greater Tel-Aviv Area. Arch. Met. Geophys. Biokl. SeE B 1979, 27, 213–224. [Google Scholar] [CrossRef]
- Lindsey, D.T.; Fromm, M. Evidence of the cloud lifetime effect from wildfire-induced thunderstorms. Geophys. Res. Lett. 2008, 35, L22809. [Google Scholar] [CrossRef] [Green Version]
- Changnon, S.A. Urban effects on thunderstorm and hailstorm frequencies. In Proceedings of the 2nd Conference on Biometeorology, Philadelphia, PA, USA, 31 October–2 November 1972; pp. 177–184. [Google Scholar]
- Changnon, S.A.; Semonin, R.G.; Huff, F.A. A Hypothesis for Urban Rainfall Anomalies. J. Appl. Meteorol. 1976, 15, 544–560. [Google Scholar] [CrossRef]
- Goddard Space Flight Center. NASA Satellite Confirms Urban Heat Islands Increase Rainfall Around Cities. National Aeronautics and Space Administration, 12 June 2008. [Google Scholar]
- Shepherd, J.M.; Pierce, H.; Negri, A.J. Rainfall modification by major urban areas: Observations from spaceborne rain radar on the TRMM satellite. J. Appl. Meteorol. 2002, 41, 689–701. [Google Scholar] [CrossRef]
- Fuchs, D. Spain goes hi-tech to beat drought. The Guardian, 28 June 2005. [Google Scholar]
- Cook-Anderson, G. Urban Heat Islands Make Cities Greener; NASA: Washington, DC, USA, 2004. [Google Scholar]
- Mattes, F.C. Nuclear Power and Climate Change; Heinrich Böll Foundation: Saxonwold, South Africa, 2005; p. 53. [Google Scholar]
- Rosenfeld, D.; Fromm, M.; Trentmann, J.; Luderer, G.; Andrea, M.O.; Servranckx, R. The Chisholm firestorm: Observed microstructure, precipitation and lightning activity of a pyro-cumulonimbus. Atmos. Chem. Phys. 2007, 7, 645–659. [Google Scholar] [CrossRef] [Green Version]
- Vulfson, N.I.; Levin, L.M. Meteotron as the Means of Influence on the Atmosphere; Gidrometeoizdat: Moscow, Russia, 1987; 129p. [Google Scholar]
- Kuznetsov, A.A.; Konopasov, N.G. The Meteotron; Book No. 1. The Research Complexes; Publishing House of Vladimir State University: Vladimir, Russia, 2014; 167p. [Google Scholar]
- Kuznetsov, A.A.; Konopasov, N.G. The Meteotron; Book No. 2. Experiments. Observations. Assessments. Registrations; Publishing House of Vladimir State University: Vladimir, Russia, 2015; 232p. [Google Scholar]
- Oranovsky, V.V. Method of Causing Precipitation. Patent RF 2071243, 11 August 1994. [Google Scholar]
- Branch, O.; Wulfmeyer, V. Deliberate enhancement of rainfall using desert plantations. Proc. Natl. Acad. Sci. USA 2019, 116, 18841–18847. [Google Scholar] [CrossRef] [Green Version]
- Brenig, L.; Zaady, E.; Vigo-Agular, J.; Karnieli, A.; Fovell, R.; Arbel, S.; Al Baz, I.; Offer, Z.Y. Cloud formation and rainfalls induced by artificial solar setting: A weather engineering project for fighting aridity. Forum Geogr. 2008, 7, 67–82. [Google Scholar]
- Abshaev, M.T.; Abshaev, A.M.; Aksenov, A.A.; Fisher, J.V.; Shchelyaev, A.E.; Mandous, A.A.; Wehbe, Y.; El-Khazali, R. Study of the Possibility of Stimulating Cloud Convection by Solar Radiation Energy Absorbed in an Artificial Aerosol Layer. Atmosphere 2023, 14, 86. [Google Scholar] [CrossRef]
- Abshaev, M.T.; Abshaev, A.M.; Aksenov, A.A.; Fisher, I.V.; Shchelyaev, A.E.; Mandous, A.; Wehbe, Y.; El-Khazali, R. CFD simulation of updrafts initiated by a vertically directed jet fed by the heat of water vapor condensation. Sci. Rep. 2022, 12, 9356. [Google Scholar] [CrossRef]
- Abshaev, M.T.; Abshaev, A.M.; Zakinyan, R.G.; Zakinyan, A.R.; Wehbe, Y.; Yousef, L.; Farrah, S.; Mandous, A.A. Investigating the feasibility of artificial convective cloud creation. Atmos. Res. 2020, 243, 104998. [Google Scholar] [CrossRef]
- Abshaev, M.T.; Zakinyan, R.G.; Abshaev, A.M.; Zakinyan, A.R.; Ryzhkov, R.D.; Wehbe, Y.; Mandous, A.A. Atmospheric conditions favorable for the creation of artificial clouds by a jet saturated with hygroscopic aerosol. Atmos. Res. 2022, 277, 106323. [Google Scholar] [CrossRef]
- Abshaev, A.M.; Abshaev, M.T.; Mandous, A.A. Method and Device for Creating Artificial Clouds and Precipitation. Patent RU No 2738479, 14 July 2020. (In Russian). [Google Scholar]
- Tereshchenko, A.G. Deliquescence: Hygroscopicity of water-soluble crystalline solids. J. Pharm. Sci. 2015, 104, 3639–3652. [Google Scholar] [CrossRef]
- Alshawa, A.; Dopfer, O.; Harmon, C.W.; Nizkorodov, S.A.; Underwood, J.S. Hygroscopic growth and deliquescence of NaCl nanoparticles coated with surfactant. AOT J. Phys. Chem. A 2009, 113, 7678–7686. [Google Scholar] [CrossRef] [Green Version]
- Haoran, L.; Abshaev, M.T.; Abshaev, A.M.; Huchunaev, B.M.; Griffiths, S.; Zou, L. Water vapor harvesting nanostructures through bioinspired gradient-driven mechanism. Chem. Phys. Lett. 2019, 728, 167–173. [Google Scholar] [CrossRef]
- Tai, Y.; Haoran, L.; Hadri, N.; Abshaev, A.; Huchunaev, B.; Griffiths, S.; Jouaid, M.; Zou, L. Core/Shell Microstructure Induced Synergistic Effect for Efficient Water-Droplet Formation and Cloud-Seeding Application. ACS Nano 2017, 11, 12318–12325. [Google Scholar] [CrossRef] [PubMed]
- Köhler, H. The nucleus in and the growth of hygroscopic droplets. Trans. Faraday Soc. 1936, 32, 1152–1161. [Google Scholar] [CrossRef]
- Gysel, M. Hygroscopic Properties of Aerosols. Studies of Particles from Jet Engines and the Free Troposphere. Ph.D. Thesis, Swiss Federal Institute of Technology Zurich, Zurich, Switzerland, 2003. [Google Scholar]
- Gysel, M.; McFiggans, H.C. Inversion of Tandem Differential Mobility Analyser (TDMA) measurements. J. Aerosol Sci. 2009, 40, 134–151. [Google Scholar] [CrossRef]
- Bermeo, M.; Hadri, N.; Ravaux, F.; Zaki, A.; Zou, L.; Jouiad, M. Adsorption Capacities of Hygroscopic Materials Based on NaCl-TiO2 and NaCl-SiO2 Core/Shell Particles. J. Nanotechnol. 2020, 2020, 3683629. [Google Scholar] [CrossRef]
- Company TESIS. FlowVision. User’s Guide. 3 December 2002. [Google Scholar]
- FlowVision. Boussinesq’s. FlowVision/FlowVision Technical Support Portal. 2017. Available online: https://flowvision.ru/ru/support-menu-header-ru/blog-ru/priblizhenie-bussineska-vo-flowvision (accessed on 17 December 2022).
- Benech, B. Experimental study of an artificial convective plume initiated from the ground. J. Appl. Meteorol. 1976, 15, 127–137. [Google Scholar] [CrossRef]
- Abshaev, M.T.; Abshaev, A.M.; Barekova, M.V.; Malkarova, A.M. Manual on Organization and Execution of Hail Suppression Projects; Pechatniy Dvor: Nalchik, Russia, 2014; 508p. (In Russian) [Google Scholar]
- Abramovich, G.N. The Theory of Turbulent Jets; Scientific Press: Moscow, Russia, 1984. [Google Scholar]
- Zeldovich, Y.B. Limit Laws of Free Convective Flows. Dokl. Akad. Nauk SSSR 1937, 7, 1466. [Google Scholar]


| Author | Da (μm) | Ratio Dd/Da | Ratio Vd/Va | Ratio k1 = md/ma | Droplet Density, ρd (g/cm3) |
|---|---|---|---|---|---|
| Köller’s theory [43] | 1 | 2.98 | 26.46 | 12.76 | 1.085 |
| Equation (1) Abshaev et al. [36] | 1 | 2.97 | 26.2 | 12.47 | 1.09 |
| Gysel’s experiments [45] | 0.1 | 2.35 | 12.98 | 6.53 | 1.09 |
| Experiments by Bermeo et al. [46] | 0.8 | 2.26 | 11.54 | 5.86 | 1.10 |
| NaCl/TiO2 aerosol growth factor at RH ≥ 90%. | |||||
| Experiments by Bermeo et al. [46] | 0.6 | 3.44 | 40.71 | 19.14 | 1.02 |
Disclaimer/Publisher’s Note: The statements, opinions and data contained in all publications are solely those of the individual author(s) and contributor(s) and not of MDPI and/or the editor(s). MDPI and/or the editor(s) disclaim responsibility for any injury to people or property resulting from any ideas, methods, instructions or products referred to in the content. |
© 2023 by the authors. Licensee MDPI, Basel, Switzerland. This article is an open access article distributed under the terms and conditions of the Creative Commons Attribution (CC BY) license (https://creativecommons.org/licenses/by/4.0/).
Share and Cite
Abshaev, M.T.; Abshaev, A.M.; Aksenov, A.A.; Fisher, J.V.; Shchelyaev, A.E.; Al Mandous, A.; Al Yazeedi, O.; Wehbe, Y.; Sîrbu, E.; Sîrbu, D.A.; et al. Results of Field Experiments for the Creation of Artificial Updrafts and Clouds. Atmosphere 2023, 14, 136. https://doi.org/10.3390/atmos14010136
Abshaev MT, Abshaev AM, Aksenov AA, Fisher JV, Shchelyaev AE, Al Mandous A, Al Yazeedi O, Wehbe Y, Sîrbu E, Sîrbu DA, et al. Results of Field Experiments for the Creation of Artificial Updrafts and Clouds. Atmosphere. 2023; 14(1):136. https://doi.org/10.3390/atmos14010136
Chicago/Turabian StyleAbshaev, Magomet T., Ali M. Abshaev, Andrey A. Aksenov, Julia V. Fisher, Alexander E. Shchelyaev, Abdulla Al Mandous, Omar Al Yazeedi, Youssef Wehbe, Emil Sîrbu, Dragoș Andrei Sîrbu, and et al. 2023. "Results of Field Experiments for the Creation of Artificial Updrafts and Clouds" Atmosphere 14, no. 1: 136. https://doi.org/10.3390/atmos14010136