1. Introduction
Global surface temperature has increased faster since 1970 than in any other 50-year period over at least the last 2000 years. It is extremely likely that human-induced greenhouse gas (GHG) forcing is the main driver of this recent warming [
1,
2,
3]. Atmospheric CO
2 concentrations in 2019 were higher than at any time in at least 2 million years. The aviation sector is also estimated to lead to a net surface warming at 20- and 100-year horizons following a one-year pulse emission [
1]. Aviation has long been referenced as contributing to the causes of climate change [
4,
5]. The converse, adaptation to the climate warming, has been a challenge to the aviation sector.
Climate change is already affecting aviation by atmospheric circulation adjustments. The IPCC AR5 reported a likely poleward shift of jet streams since the 1970s [
1,
6]. The jet streams become more meandering due to rapid Arctic warming [
7], which can influence the flight time and fuel consumption, as the eastbound transatlantic flights are often routed to take advantage of the strong tailwinds in the jet stream [
8,
9]. Jet streams are also associated with clear-air turbulence, a well-known hazard to aviation causing numerous injuries and costing airlines tens of millions of dollars [
10]. Williams and Joshi suggested that the increasing concentration of CO
2 in the atmosphere would lead to bumpier transatlantic flights by the middle of this century [
11]. Adaptation challenges are often accentuated in the face of more frequent weather extreme events with climate warming. For example, heavy precipitation can result in flight disruptions and delays. The accompanied lightning strikes may cause damage to the aircraft structure. The hazards of turbulence, wind shear, and ice formation linked with cumulonimbus clouds are much greater than the threat of lightning. The action of strong upward and downward air currents can significantly affect the stability of the aircraft. For the effects of climate change on aviation, existing studies are primarily confined to thunderstorms, wind shear, ice formation, turbulence, and travel time [
8,
11,
12,
13]. In addition, the effect of hot extremes on aviation recently came into focus due to the observed increase in the frequency of extreme temperature events.
A warming trend (0.244 ± 0.021 °C decade
−1) of the surface air temperature was also detected in China from 1951 to 2015 [
14]. It is likely that heat events have occurred more frequently and widely in China, especially since the late 1990s [
15]. The China Meteorological Administration issued high-temperature warnings for 33 consecutive days in summer 2018 [
16]. It is urgent and crucial to understand the effects of increasing temperature on the complicated and comprehensive performances of aircraft. As air warms, it becomes less dense. Low-density air conditions further lead to reduced lifts for aircrafts, which significantly influences the maximum takeoff weight (MTOW) of an aircraft. Coffel and Horton [
17] found that the number of summer days necessitating weight restriction had increased in the United States since 1980 along with the observed increase in surface temperature. Utilizing the direct proportionality of near-surface air density to MTOW, Ren et al. [
18] concluded that the reduction in MTOW was generally greater than 1% for the busy North Atlantic Corridor. Meanwhile, high temperature can influence the takeoff distance, as the reduction in air density conditions decreases the air intake quantity of engines, causing aircraft to accelerate slowly. Zhou et al. [
19] estimated the takeoff distance changes from the product of the takeoff distance at sea level under standard atmospheric conditions and the takeoff distance factor at 30 major international airports, showing that it would require an additional 3.5−168.7 m takeoff distance in 2071−2100. However, these results were obtained using the barometric formula. The real operational environment should be considered to get a better performance estimate.
The manufacturer-specified MTOW is essentially a consequence of structural characteristics, climb performance factor, and some external factors, such as runway length and temperature [
20]. In the absence of access to industry specifications, the conclusions of most previous studies are based on the calculation of theoretical formulas [
18,
19,
21,
22]. Considering the real operation, we use Boeing Performance Software (BPS) for calculating airplane performance data in this study. During the takeoff stage, the high temperature can not only affect the MTOW but also the takeoff distance for an aircraft. However, the influence of increasing temperature on the MTOW or the takeoff distance was usually considered individually in different previous studies [
19,
23]. In this paper, the comprehensive influence of these two aspects is evaluated. The commercial aircraft type chosen for analysis is the Boeing 737-800, which is one of the most popular narrow-body aircrafts in the world, and also one of the commonly used short-to-medium range aircraft types at present [
17]. In addition, most references about the impact of global warming on aviation so far are focused on developed countries in North America and Europe [
5,
24]. Here, we quantify the influence of increasing temperature on aircraft performance in the context of the Chinese aviation sector. This paper is organized as follows: the methodology and data are described in
Section 2.
Section 3 shows the main results, including the effect of temperature changes on the MTOW and takeoff distance, respectively. Finally, a summary and discussion are provided in
Section 4.
2. Methodology and Data
A fully coupled global climate model, the Community Earth System Model version 1 (CESM1) is used in this study, which can simulate the climate of the Earth in the past, present, and future [
25]. The CESM1 consists of one coupler (CPL7) and the following parts: the Community Atmosphere Model (CAM5, 30 vertical levels), Parallel Ocean Program (POP2, 60 vertical levels), Community Land Model (CLM4), and Los Alamos Sea Ice Model (CICE) [
26]. The atmosphere model is the finite volume nominal 0.9° × 1.25° in the horizontal direction. All other component models were run at approximately 1° horizontal resolution. Experiments analyzed in this study include a historical run under historical forcing from 1920 to 2005 and a run under representative concentration pathway 8.5 (RCP8.5) forcing from 2006 to 2080. By comparing the historical run and RCP8.5 run, we focus on summertime (June–August) in two decades, 1991−2000 and 2071−2080, to investigate the effect of global warming with increasing GHG concentrations on aircraft takeoff performance. The high-emission scenario is used in this study for a stronger signal-to-noise ratio and it is easy to apply our results to a less warming scenario in proportion to the increasing temperature [
23]. The observations of summer daily maximum surface air temperature from the China Meteorological Administration (China Surface Daily Data Set V3.0) are used for historical verification.
The aircraft takeoff performance is limited by temperature, wind field, runway length, obstacle overtaking, climb gradient, and many other factors. BPS is a Window software for calculating airplane performance data for takeoff, landing, enroute (including enroute climb, cruise and holding, driftdown, descent, and altitude capability), and airplane performance monitoring [
27,
28]. Here we use BPS to calculate the MTOW and takeoff distance at the chosen airports under the historical and RCP8.5 scenarios.
Considering the elevation, traffic loads, and temperature changes, eight airports in China are selected to perform a detailed analysis: Harbin Taiping International Airport (HRB), Beijing Capital International Airport (PEK), Jinan Yaoqiang International Airport (TNA), Shanghai Hongqiao International Airport (SHA), Guangzhou Baiyun International Airport (CAN), Kunming Changshui International Airport (KMG), Lhasa Kongga International Airport (LXA), and Urumqi Diwopu International Airport (URC). The information of these chosen airports is shown in
Table 1. The elevation of the selected airports spans from 3.0 m to 3569.6 m. Resulting from the low surface air density, the maximum runway lengths are longer at the high-elevation airports (KMG: 4500 m and LXA: 4000 m) than that at other airports. Apart from the high-elevation airport KMG and LXA, the altitude of URC (647.9 m) is the third highest among the chosen airports. As the elevation of KMG, LXA, and URC is much higher than other selected airports, we define these 3 aerodromes as the high-altitude aerodromes. Meanwhile, URC is chosen for its extremely high summer temperatures. Hot days also appear frequently at TNA. HRB is selected because it is the transportation center of northeastern China. The rest of the airports are picked due to their high traffic loads or significant temperature change.
3. Results
Though the utility of CESM1 has been illustrated for studying extreme climate phenomena [
29,
30], considerable biases still exist in simulating daily maximum surface air temperature, particularly in the high-elevation regions [
24,
31]. We first inspect the performance of the CESM1 simulation of summer daily maximum surface air temperature at the chosen airports (left panel in
Figure 1 and
Figure 2). Using the method of Coffel and Horton [
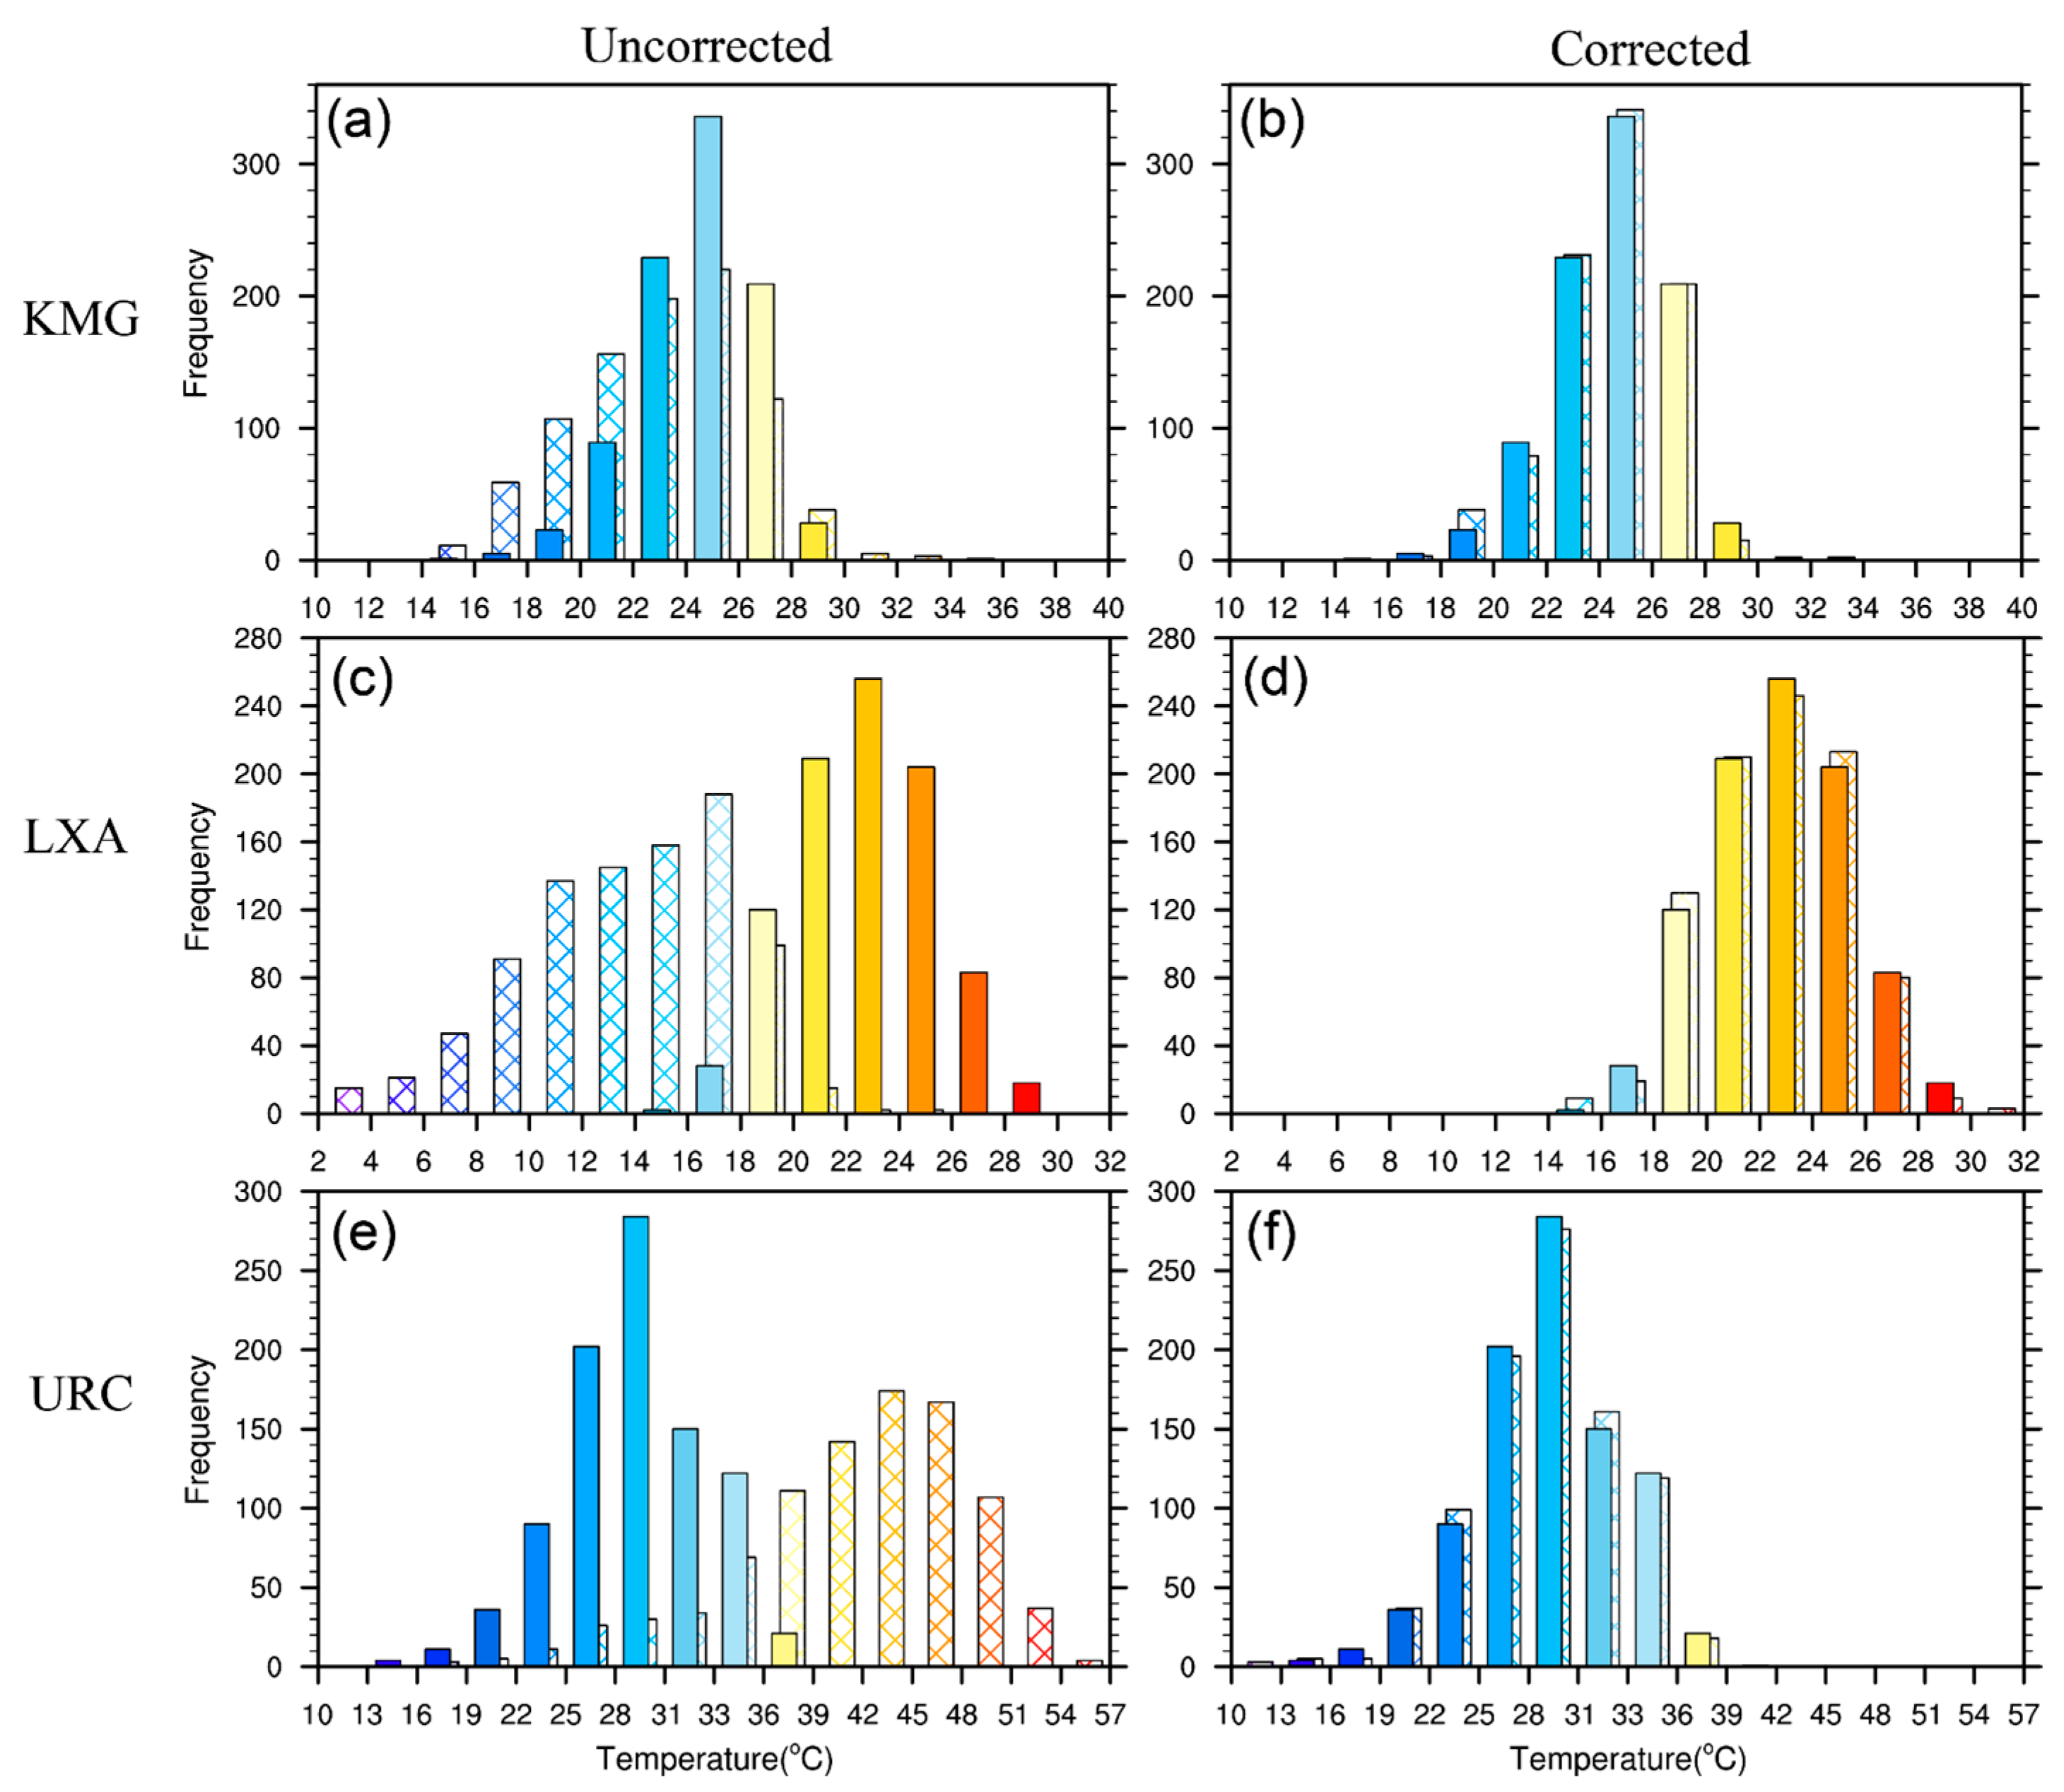
17], the observed and model temperature distributions are separated into 20 five-percentile bins at each airport. The shape and range of the distributions are matched very well in the CESM1 simulation and observation at SHA and are basically consistent at other airports (
Figure 1 and
Figure 2) except for LXA and URC. However, the days of low (high) temperature simulated are more (less) than the observed, which means that the magnitude of the warming will be underestimated without the bias correction. The biases are significantly evident at LXA and URC, resulting from the uncertainty associated with the treatment of complex topography in climate models. The simulated summer daily maximum surface air temperature is far lower (higher) than the observation at LXA (URC). The bias-correction procedure is applied to each airport. The correction method is performed in two steps. Firstly, the biases between the model temperatures and observations are calculated for each percentile bin. The biases are different in different temperature percentile bins for every airport site (
Figure S1). Secondly, the bias is subtracted from each of the 20 five-percentile bins in the model data including the historical run and RCP8.5 run. After the bias correction, the shape and scale of the model temperature distributions are seen to closely match the observed distributions at all the airports (right panel in
Figure 1 and
Figure 2). More details of the bias-correction method can be found in [
17].
With the increasing GHG concentrations, significant warming happens across China during the period 2071−2080 under the RCP8.5 scenario compared to the historical period (1991−2000) (
Figure 3). The values are statistically significant at the 95% confidence level in the stippling regions. The changes in mean summer daily maximum surface air temperature enhance from north to south. The strongest warming happens in Hebei, Shandong, and Henan. The warming reaches up to 9 °C in Shandong. The temperature change is 3−3.5 °C in Guangdong. The minimum warming appears in Qinghai, western Yunnan and eastern Xizang. Among the selected airports, not only do the days of high temperature increase, but also the temperature range becomes wider during 2071−2080 than that during 1991−2000 at TNA, SHA, LXA, and URC, which means the variation in temperature is larger in the future than that in the past. The mean values of summer daily maximum surface air temperature shift to higher temperature obviously at the rest of the airports (
Figure 4).
Theoretically, the aircraft takeoff performance is also limited by the wind field through the changing lift. However, the changes in surface wind at the selected airports are quite small due to the increasing greenhouse gas concentrations (
Figure S2). Considering that the BPS can only identify the value greater than or equal to 1 kt (about 0.514 m/s) of wind changes, we focus on the influence of extreme high temperature on the aircraft MTOW and takeoff distance using climatological wind at each airport to be closer to reality.
3.1. Effect of Temperature Changes on the MTOW
At constant pressure, air becomes less dense as it warms. The lift produced by this thinner air will decrease. As a result, the airplane must be weight-restricted, which means the aircraft has to carry less cargo or fewer passengers to take off safely. According to the fiducial temperature of each airport, there is a theoretical MTOW for the given aircraft type at every airport. In order to evaluate the impact of high temperature on aircraft performance quantitatively, the temperature thresholds are calculated, which will cause a 1000 lb level and 5000 lb level of weight reduction on the available runway for each airport in comparison to no restriction. A weight restriction of 5000 lb denotes approximately 10% of the aircraft’s payload capacity. Any day when the daily maximum temperature matches or exceeds the temperature threshold is considered a weight-restriction day [
23]. A 737-800 can typically seat 160−184 passengers. According to the current Federal Aviation Administration (FAA) [
32], the summertime passenger weight including carry-on baggage (a checked bag and a planeside loaded bag) is about 234 lb (~106 kg) on the average. Therefore, the 1000 lb (~454 kg) and 5000 lb (~2268 kg) restrictions can cause 5 and 22 passengers being unable to travel, respectively, which can cost airlines millions of dollars each year in lost revenue. For different elevations, runway lengths, obstacle overtakings, etc., the MTOW varies at the chosen airports. As a result, the thresholds of temperature that will result in 1000 lb or 5000 lb levels of weight restriction are different. As shown in
Table 2, the higher the altitude, the lower the temperature threshold at these airports. Owing to the warmer air leading to more weight restriction, the temperature threshold increases 2−5 °C at the 5000 lb level of weight restriction compared to that at the 1000 lb level of weight restriction across the selected airports.
The weight-restriction days increase obviously due to warming at all the chosen airports (
Figure 5). The largest increase in the number of 1000 lb restriction days appears at KMG, changing from 2 days to 48 days, which is due to the high elevation and temperature increment. Similarly, the corresponding number goes from 2 (3) days to 40 (34) days at URC (LXA). The number of 1000 lb restriction days rises at TNA and PEK for significant warming. Though there are no restriction days at HRB, SHA, and CAN for the historical period (1991−2000), the number of 1000 lb restriction days reaches 19, 15, and 10 days per summer at these airports in 2071−2080 with the increasing GHG concentrations. When the summer daily maximum temperature rises further, the aircrafts’ takeoff weights will be restricted more. There are no 5000 lb restriction days at all selected airports during 1991−2000. However, the number of 5000 lb restriction days grows to varying degrees at these airports during 2071−2080. Resulting from stronger warming, the low-altitude aerodromes (TNA, PEK, HRB, and SHA) are affected more heavily than the high-altitude aerodromes (KMG and LXA), as the traffic loads of the low-altitude aerodromes are relatively high, which may significantly influence airlines’ economic benefit in the future.
3.2. Effect of Temperature Changes on Takeoff Distance
Following the results of BPS calculation, the takeoff distance increases from the historical period to the late-century due to climate warming across the examined airports except KMG, LXA, and URC. Because of the high elevation and temperature change, the MTOW decreases significantly at KMG, LXA, and URC. Consequently, the takeoff distance in summer decreases slightly ranging from 0.7% (KMG) to 1.4% (URC). However, the takeoff distance increases evidently ranging from 4.4% (CAN) to 8.7% (PEK) at the low-altitude aerodromes, with the average change being about 6.2% (
Figure 6). It will call for an additional 113−222 m takeoff distance in future summers. The takeoff distance changes are larger at PEK and TNA than that at the HRB and CAN, indicating that the amplitude of the increasing takeoff distance is consistent with the warming amplitude across the low-altitude airports.
Considering the MTOW remain constant (174,000 lb), the takeoff distance increases with temperature for a given runway length, airport elevation, and aircraft type. According to
Figure 7, the higher temperature leads to a stronger increase in the takeoff distance. For HRB, the takeoff distance change is about 8.9 m/°C (33.5 m/°C) when the temperature is lower (higher) than 29 °C. The temperature turning point is higher for the airports at lower altitudes, which is 30 °C for PEK, TNA, CAN, and SHA. More precisely, the takeoff distance change is about 9.2 m/°C (35.2 m/°C) when the temperature is lower (higher) than 30 °C at these airports. For the high-altitude airport (URC), the temperature turning point is 26 °C, which is much lower than the chosen low-altitude airports.
Figure 7 also shows that the takeoff distance increases with elevation when the temperature and MTOW are constant. The takeoff distance is 2821 m at URC, which is 385 m longer than that at SHA at 22 °C. As a result, though the warming amplitude is relatively small at the high-altitude airports, the challenge of the climate warming is still big, considering that the takeoff distance at high-altitude airports is more sensitive to high temperature and temperature changes.
4. Conclusions and Discussion
As the GHG concentrations increase, significant warming happens across China. Using the fully coupled climate model CESM1 and BPS software, the effect of extreme high temperature on aircrafts’ MTOW and takeoff distance is evaluated quantitatively. By comparing the historical run (1991−2000) and RCP8.5 run (2071−2080), the greatest change in mean summer daily maximum temperature is located in the central and eastern regions of China. The warming reaches up to 9 °C in Shandong, while the minimum warming appears in Qinghai, western Yunnan, and eastern Xizang. Eight airports in China are selected due to the elevation, high traffic loads, or significant temperature changes for the detailed analysis. The mean value of summer daily maximum temperature shifts to higher temperature obviously at all the airports and the variation in temperature is larger in the late century (2071−2080) than that in the historical period (1991−2000) at TNA, SHA, LXA, and URC. When the air gets warmer and thinner, the lift will decrease and the MTOW must be reduced. According to our results, the weight-restriction days all increase at the chosen airports. More precisely, the 1000 lb restriction days increase 50% (from 2 days to 48 days) per summer at KMG, which is the greatest change among the chosen airports. The number rises 34% (from 3 days to 34 days) at LXA. In this regard, global warming increases the risk of high-elevation airports’ operation. The average change at all the selected airports is about 29%. However, the low-altitude aerodromes (TNA, PEK, HRB, and SHA) are limited more than the high-altitude aerodromes (KMG and LXA) on the level of 5000 lb weight restriction for more warming, which may highly influence airlines’ revenue owing to the high traffic loads.
Meanwhile, high temperature brings about aircrafts accelerating more slowly down the runway resulting from low-density air. The takeoff distance increases about 6.2% on average during 2071−2080 compared to 1991−2000 for the low-altitude airports, calling for an additional 113−222 m takeoff distance in future summers. Our results also reveal that the takeoff distance does not change linearly with temperature, but shows a stronger increase with higher temperature. Remarkably, the takeoff distance at high-altitude airports is more sensitive to high temperature and temperature changes because of the thin air on the plateau.
Though there are only eight airports selected to perform a detailed analysis, they are representative references elucidating the important effect of climate warming on civil aviation and helping airlines for planning future flight operations. For example, flights with heavy loads may need to be rescheduled to avoid the extreme hot weather. It may be necessary for airports to construct longer runways or extend the current ones. The conclusions drawn here may be subject to model limitations. To what extent our results depend on the particular model warrants further investigation. Studies using observations and different models would be helpful for determining the robustness of this work. The investigation could be extended to all Chinese airports in the near future.


 ,
, 


