Article

The Performance of S2S Models on Predicting the 21.7 Extreme Rainfall Event in Henan China

1
Changshu Institute of Technology, College of Electronic and Information Engineering, Suzhou 215556, China
2
College of Atmospheric Sciences, Lanzhou University, Lanzhou 730000, China
3
Collaborative Innovation Center on Forecast and Evaluation of Meteorological Disaster, Nanjing University of Information Science and Technology, Nanjing 211544, China
4
Complex Systems Research Center, Shanxi University, Taiyuan 030006, China
5
Laboratory for Climate Studies, National Climate Research Center CMA, Beijing 100081, China
*
Authors to whom correspondence should be addressed.
Atmosphere 2022, 13(9), 1516; https://doi.org/10.3390/atmos13091516
Submission received: 20 July 2022 / Revised: 27 August 2022 / Accepted: 31 August 2022 / Published: 17 September 2022
(This article belongs to the Special Issue Climate Extremes in China)

Abstract

:
Extreme rainfall may cause meteorological disasters and has tremendous impact on societies and economics. Assessing the capability of current dynamic models for rainfall prediction, especially extreme rainfall event prediction, at sub-seasonal to seasonal (S2S) scale and diagnosing the probable reasons are quite important topics in the current climate study field. This study analyzes the formation mechanisms of the extreme rainfall event during 18–22 July 2021 in Henan Province and introduces the Tanimoto Coefficient (TC) to evaluate the prediction performance of S2S models. The results show that confrontation between low-latitude typhoon “In-Fa” and subtropical highs leads to sufficient water vapor transporting to Henan, and that remarkable upward air motion causes strong convergence of water vapor, thereby providing atmospheric conditions for this extreme rainfall event. Furthermore, five S2S models showed limited capability in predicting this extreme rainfall event 20 days in advance with the TCs of four models being below 0.1. Models could capture this event signal 6 days ahead with most TCs above 0.2. The performances of model prediction for this extreme rainfall event were closely related to the fact that the water vapor convergence, vertical movements, relative vorticity, and geopotential height predicted by the NCEP model 20 days ahead were close to the actual situation, in contrast to the other four models 6 days in advance. This study implies that S2S model predictions for this extreme rainfall event show obvious differences, and the application of S2S models in the prediction of extreme events needs to fully consider their prediction uncertainties. The capability of the models to properly reproduce local water vapor convergence and vertical motions is also shown to be crucial for correctly simulating the extreme event, which might provide some hints for the further amelioration of models.

1. Introduction

Continuous extreme rainfall tends to cause severe flooding, impacting the social and economic development and safety of people’s lives. One of the most destructive climate events in China is the extreme precipitation during the summer monsoon season [1], such as the Beijing extreme rainfall of 21 July 2012 [2,3]. Extreme rainfall monitoring and prediction have attracted great attention from meteorologists, the public, and the assessment reports of the Intergovernmental Panel on Climate Change (IPCC). In recent decades, various methods have been developed for extreme rainfall forecast and prediction, using the artificial neural network model [4], statistical downscaling approach [5], and preceding predictor-based empirical model [6]. For example, statistical prediction models for the summer extreme precipitation frequency in the middle and lower reaches of the Yangtze River valley based on the winter sea surface temperature in the southern Indian Ocean and the spring sea-ice concentration in the Beaufort Sea were established using the year-to-year increment method [7]. The prediction of extreme rainfall especially at the sub-seasonal scale has high uncertainty, which needs to be fully considered with regard to the ability of different models in predicting normal and record-breaking events [8]. Therefore, under the background of global warming, extreme precipitation prediction is a crucial topic in the meteorological field facing new challenges, which deserve more attention from meteorologists [9,10,11].
Previous studies pointed out that variation trends in extreme rainfall over China have an obvious increase feature [12,13,14]. Extreme rainfall events with serious hazards continue to increase; thus, it is crucial to analyze the possible causes. The extreme rainfall in China has a close relationship with water moisture transportation from the low latitude [15,16], the northwest Pacific subtropical high and atmospheric teleconnection [17], the middle latitude circulation system [18], and vertical air motion [19,20], which need to be fully considered during both event diagnosing and model prediction assessment.
During the period of 18–22 July, Henan Province experienced a heavy rainfall event. The observed 24 h rainfall of Zhengzhou station reached 624.1 mm, exceeding its yearly rainfall (509.5 mm), and more than 10 stations broke their historical record of daily rainfall. This extreme rainfall event caused 302 deaths and 50 disappearances, with direct economic loss of 114.269 billion CNY (https://www.henan.gov.cn/2021/08-02/2194036.html, accessed on 2 August 2021). Therefore, this event, called “the 21.7 Extreme Rainfall Event in Henan (21.7 event in short)”, deserves attention from the public and meteorologists. Studies have analyzed the causes for this event. For example, Zhang et al. [21] demonstrated that the flood range corresponding to the extreme rainfall event, retrieved using the Cyclone Global Navigation Satellite System (CYGNSS) L1 data, agreed with that retrieved using the Soil Moisture Active Passive (SMAP) mission. Ran, Li, and Zhou [22] demonstrated that the extreme rainstorm was affected by two troughs and one ridge at 200 hPa, a continental high, the western extension and northern lifting of subtropical highs, the westward movement of Typhoon In-Fa, and the inverted trough of Typhoon Cempaka. Nie and Sun [23] used a Lagrangian approach showing that moisture was transported to Henan along three routes driven by the western Pacific subtropical high (WPSH), the tropical cyclone In-Fa, and the tropical cyclone Cempaka. Yin, Gu, and Liang [24] successfully reproduced circulation anomalies based on the WRF model: (i) major synoptic-scale weather systems (i.e., the western Pacific subtropical high, the Tibetan high, two typhoons, and the Huang-Huai cyclone); (ii) convective initiation along the east to north edge of the Songshan Mountain, where orographic lifting is obvious; (iii) subsequent formation of the convective storm producing the extreme rainfall in Zhengzhou. It should be noted that these studies did not clarified the performance of current operational climate models in predicting this event, which deserves attention from meteorologists.
Furthermore, it is particularly important to correctly forecast extreme rainfall events in time. However, a weather timescale of about 10 days is on the brink of the limit of predictability, whereby daily weather forecast becomes extremely complicated [25]. In order to bridge the gap between weather forecasting and seasonal prediction, as well as meet the needs of various user communities, the World Weather Research Program (WWRP) and the World Climate Research Program (WCRP) launched an extensive database project in 2013, with a focus on S2S forecasts and reforecasts (https://public.wmo.int/en/projects/subseasonal-seasonal-prediction-project, accessed on 4 September 2022). This S2S project aims to accurately predict the climate process of rainfall a few weeks in advance [26,27,28,29]. Currently, the S2S project has established a database, containing re-prediction and near-real-time prediction from 11 operational centers. This S2S project offers the research community the opportunity to assess and improve the performance of operational model systems at S2S scales [30]. Studies have indicated that state-of-the-art models are able to simulate the seasonal variability of the East Asian monsoon [31,32]. It is also necessary to assess their performance in predicting the extreme rainfall events, especially for record-breaking cases, by evaluating the hindcasts or near-real-time prediction of S2S models. However, the predictive ability of the current major S2S models for extreme rainfall in China was not fully assessed in previous studies.
Accordingly, this paper studies the rainfall of 18–22 July and its corresponding circulation anomalies during the extreme rainfall event, as well as evaluates the prediction ability of major S2S models for this event. The results may help researchers (1) better understand the atmospheric process, water vapor divergence, and vertical motion for this extreme rainfall event, and (2) understand the capability of current S2S models in predicting the extreme rainfall event under the global warming background and the reason for various model having quite different performances. Furthermore, a comprehensive assessment of S2S models in predicting extreme cases of rainfall may help forecasters to achieve better model selection for output in real-time operation predictions. Assessing the capability of current dynamic models in extreme rainfall event prediction and diagnosing the probable reasons may provide meteorologists with suggestions for model prediction modification. Section 2 of this paper describes the analysis data, the method, and the S2S models. The extreme rainfall process and its corresponding circulation anomalies are presented in Section 3. In Section 4, the prediction assessment of S2S models for the extreme rainfall event is discussed. The summary and discussion are given in the last section.

2. Data and Methods

The daily rainfall data at 106 stations in Henan Province were obtained from the national daily rainfall dataset developed by the National Meteorological Information Center, China Meteorological Administration (http://data.cma.cn, accessed on 4 September 2022). To analyze the circulation anomalies corresponding to this extreme rainfall, the 850 hPa horizontal wind field and relative vorticity, the 500 hPa vertical velocity and geopotential height, and the whole-layer water vapor fluxes (1000–300 hPa) of NCEP/NCAR Reanalysis 1 were also used in this paper (https://psl.noaa.gov/data/gridded/data.ncep.reanalysis.html, accessed on 4 September 2022). Five S2S models, namely, the China Meteorological Administration (CMA), the European Center for Medium-Range Weather Forecasts (ECMWF), the Korea Meteorology Administration (KMA), the National Centers for Environment Prediction (NCEP), and the United Kingdom Meteorological Office (UKMO), were evaluated for their prediction ability with respect to extreme rainfall and circulation fields. Table 1 provides the basic information of the five models. The CMA model predicts the next 61 days on Thursday and Sunday, while the ECMWF predicts the next 47 days on Monday and Thursday. Because of the differences in real-time prediction range, the common predictions starting on 28 June, 5 July, 12 July, and 15 July (corresponding to 20 days, 13 days, 6 days, and 3 days ahead of the “21.7 event”, respectively) and the period for 18–22 July 2021 were selected for prediction performance assessment. Because of the different grids of the five models, the grid resolution was unified when downloading data, with the grid resolution of rainfall at 0.05° × 0.05°, and that of other circulation fields at 1° × 1°. In this paper, the anomalies of rainfall and circulation were studied, and the duration of the selected climate average state was 1981–2010.
Since the anomaly correlation coefficient is not quite suitable to assess the ability of the model in the daily forecast of the rainfall value field, the Tanimoto coefficient (TC) was applied in this paper. TC, E(A, B), can be calculated using Equation (1), representing one of the metrics used to compare the similarity and diversity of sample sets, as well as measure the spatial similarity of two variable fields [33].
E ( A , B ) = A · B A 2 + B 2 A · B ,
where A and B represent two spatial vectors, respectively. TC is equal to zero if there are no intersecting values and equal to one if all elements intersect between two fields.

3. Result

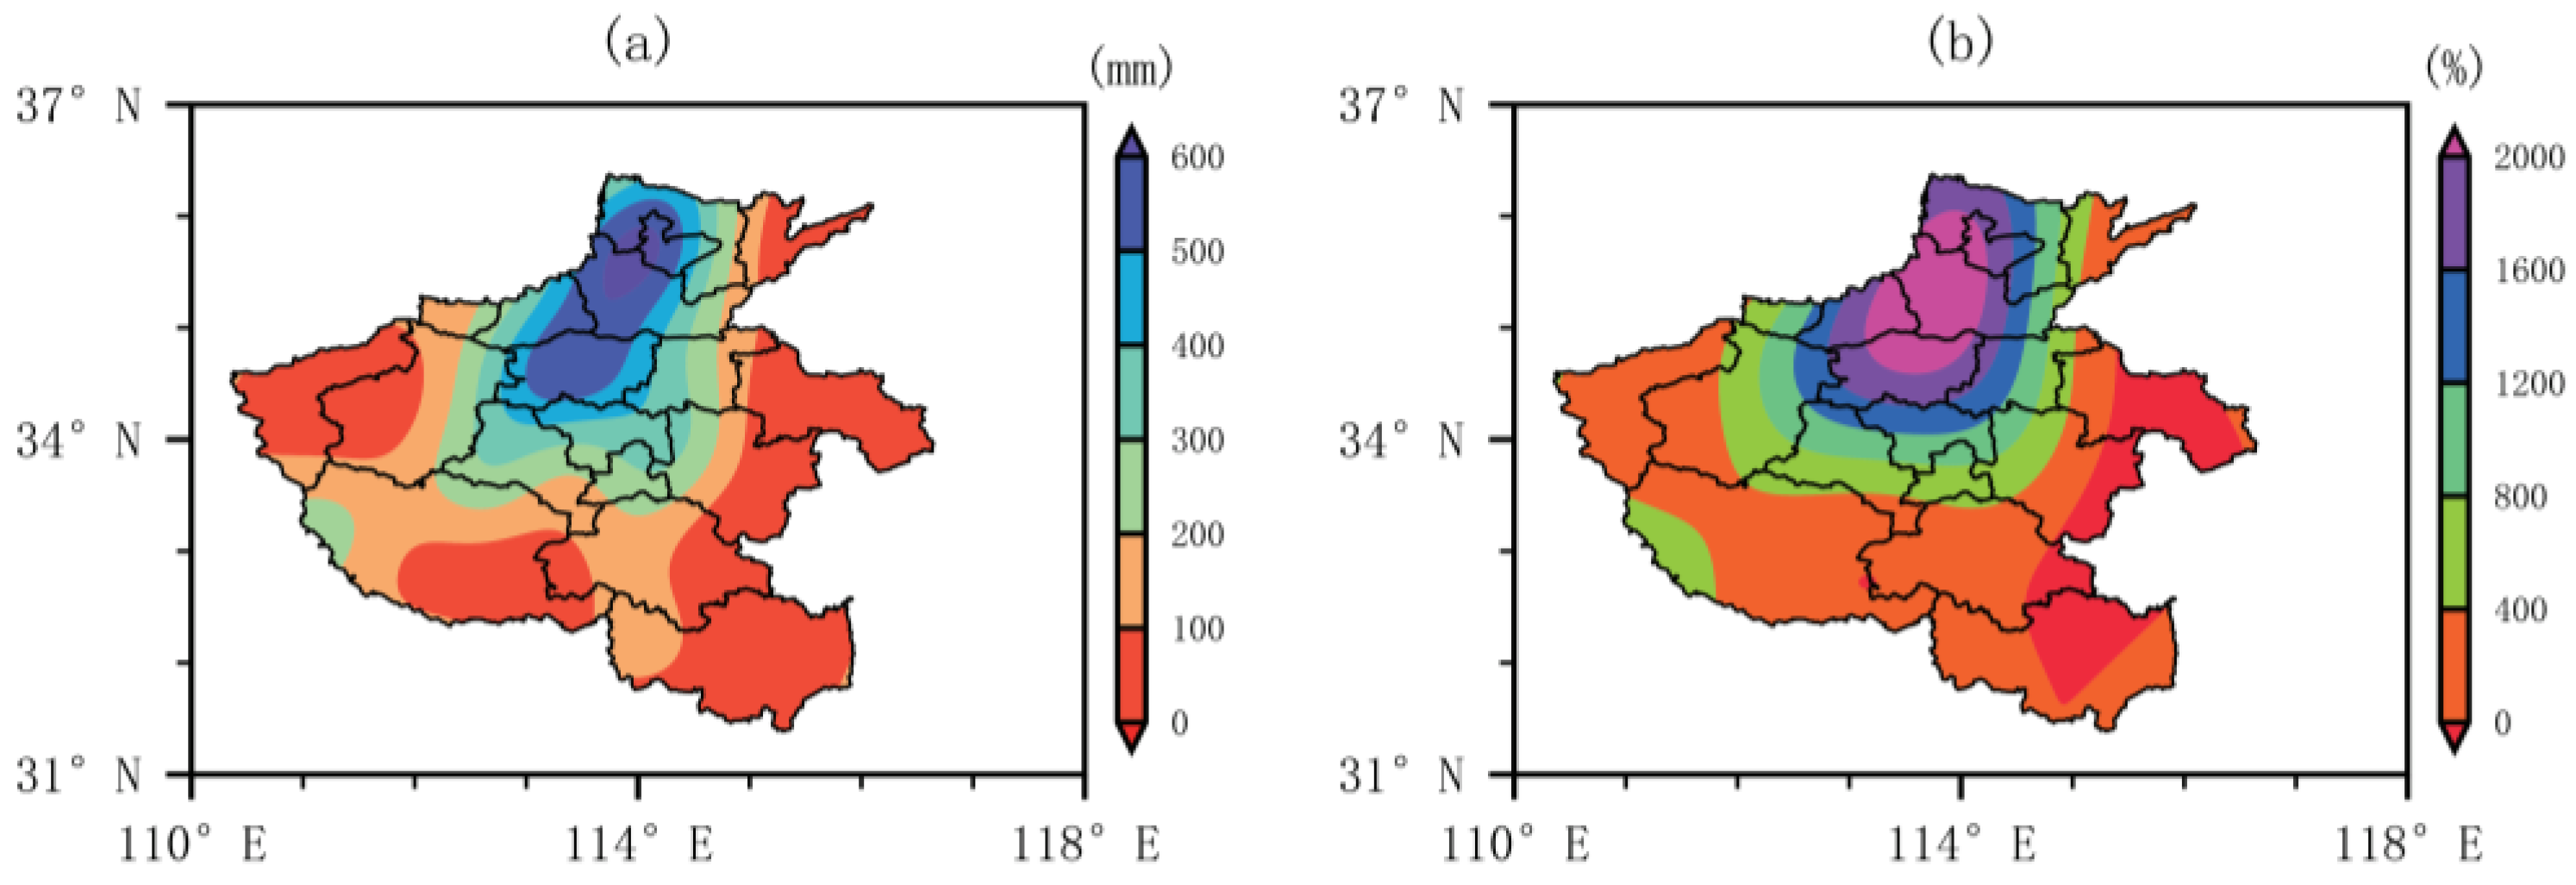
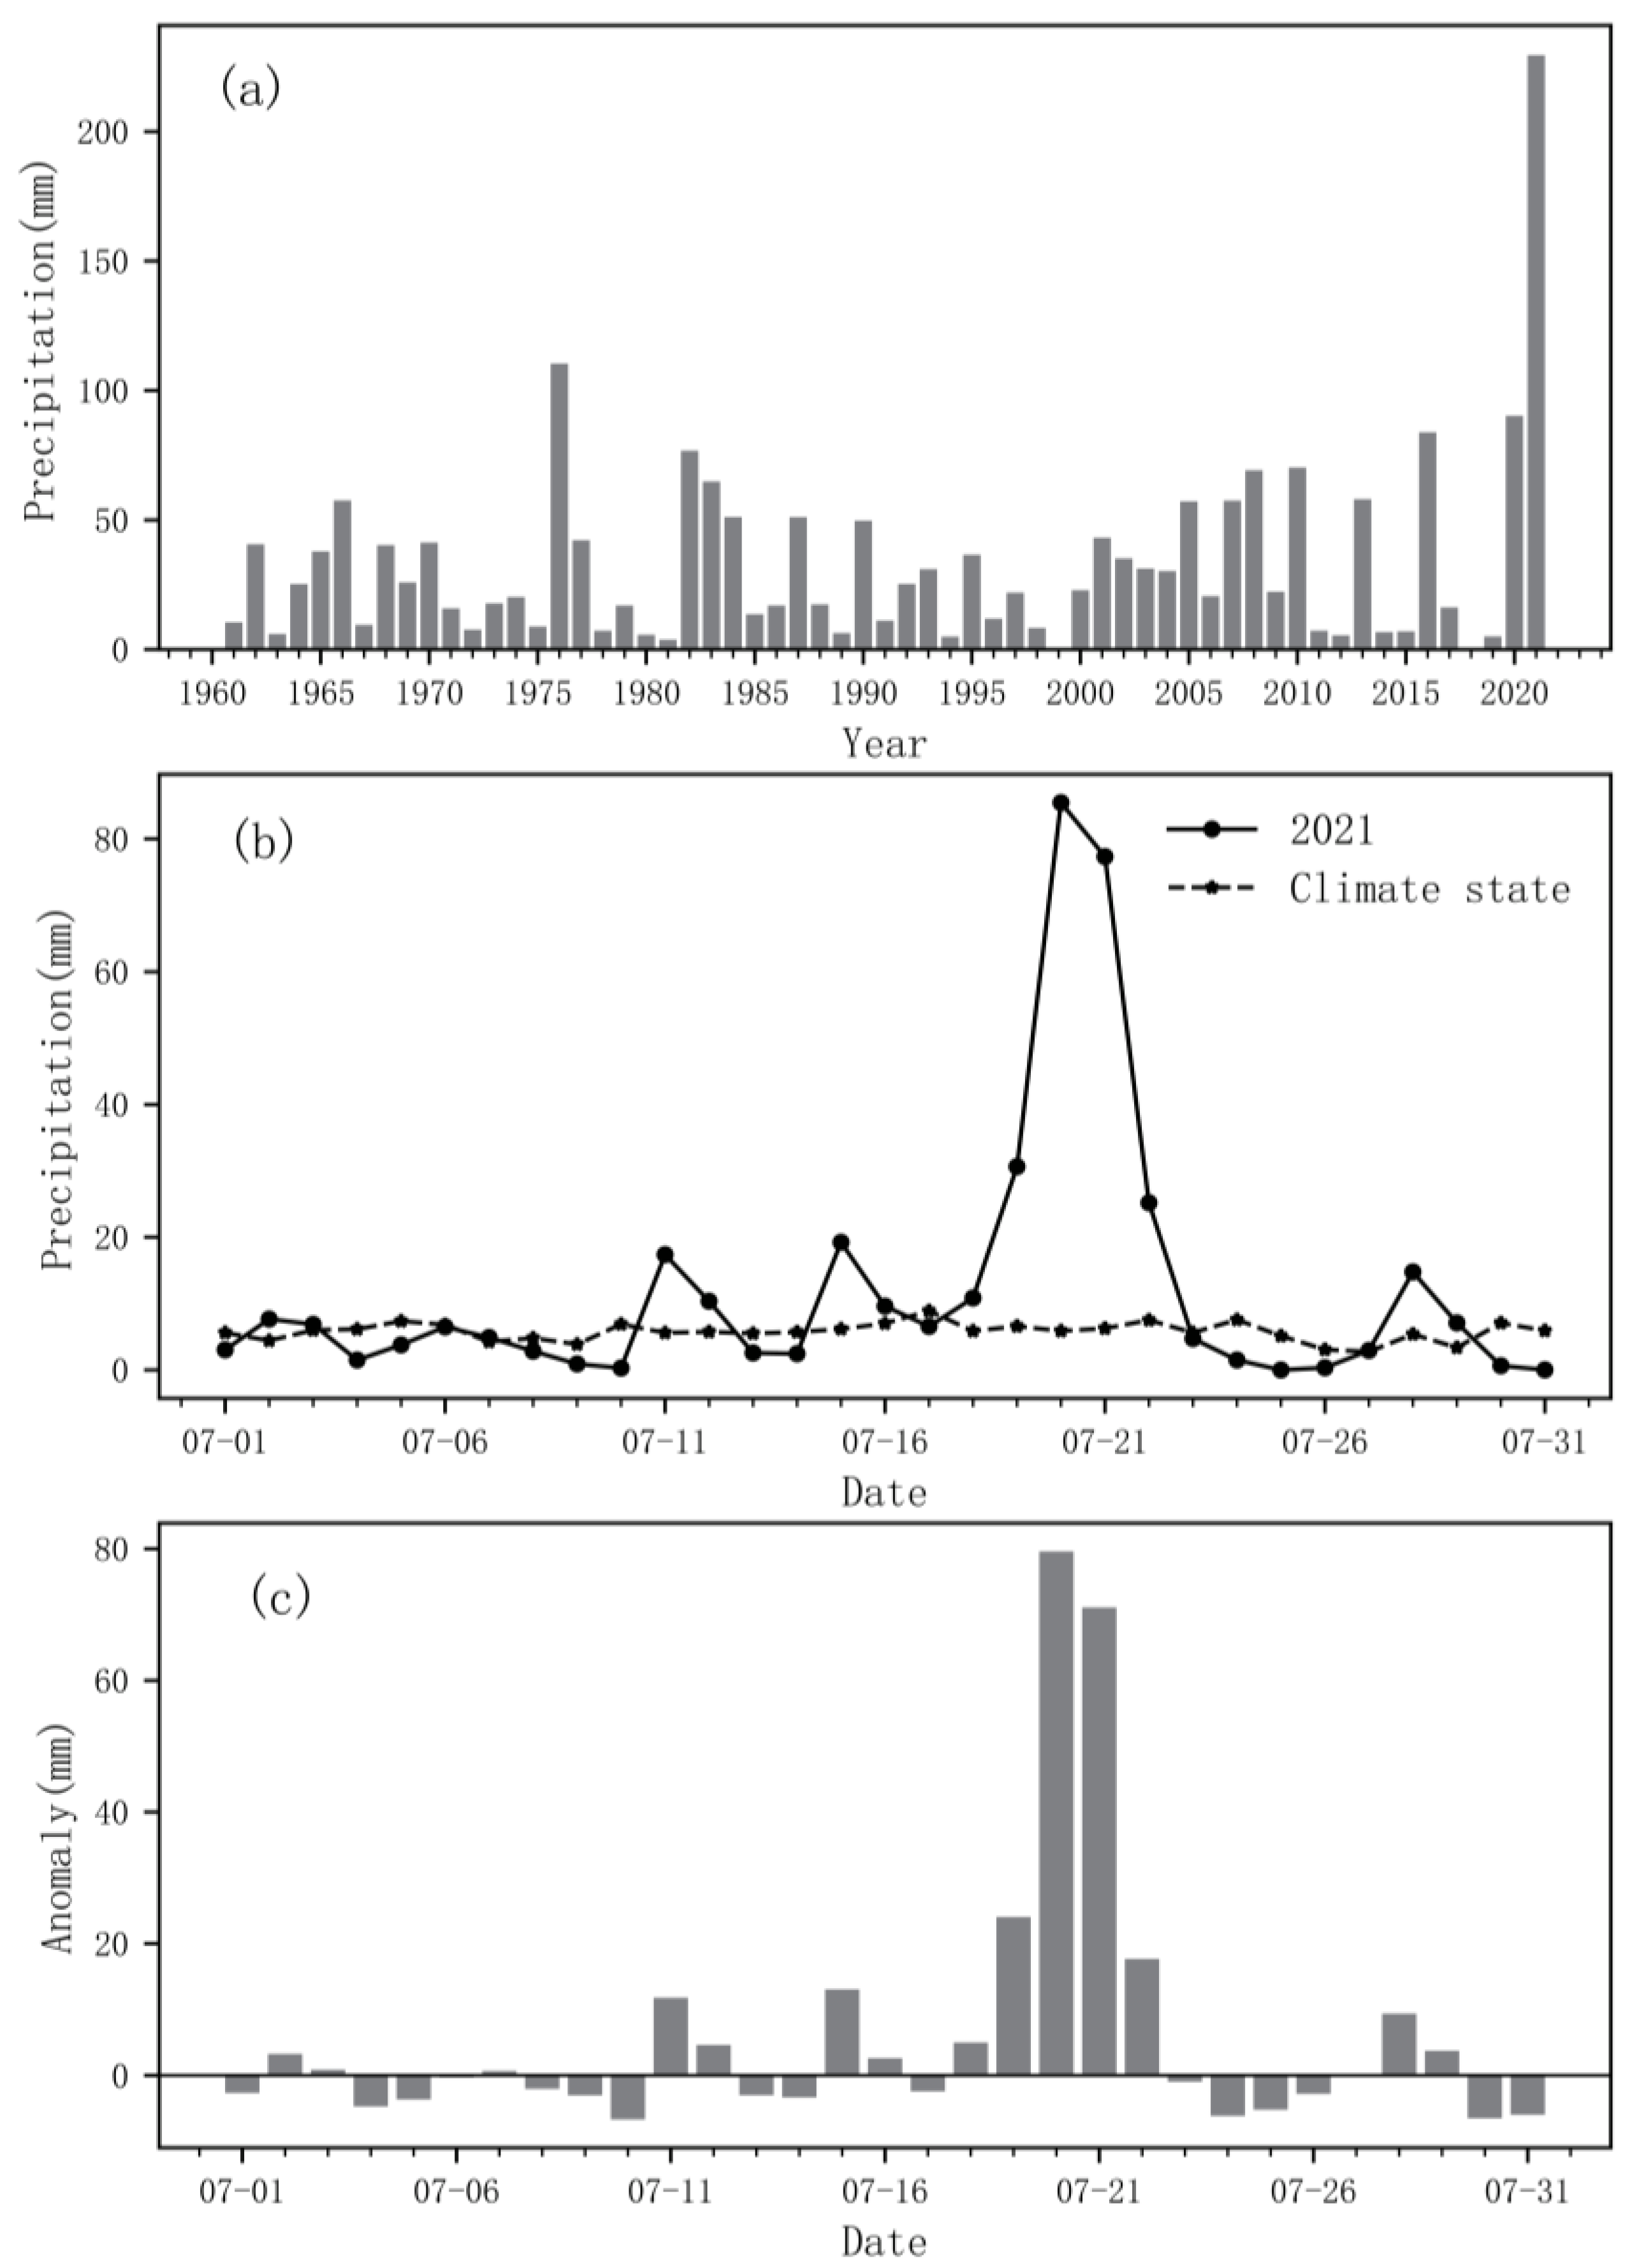
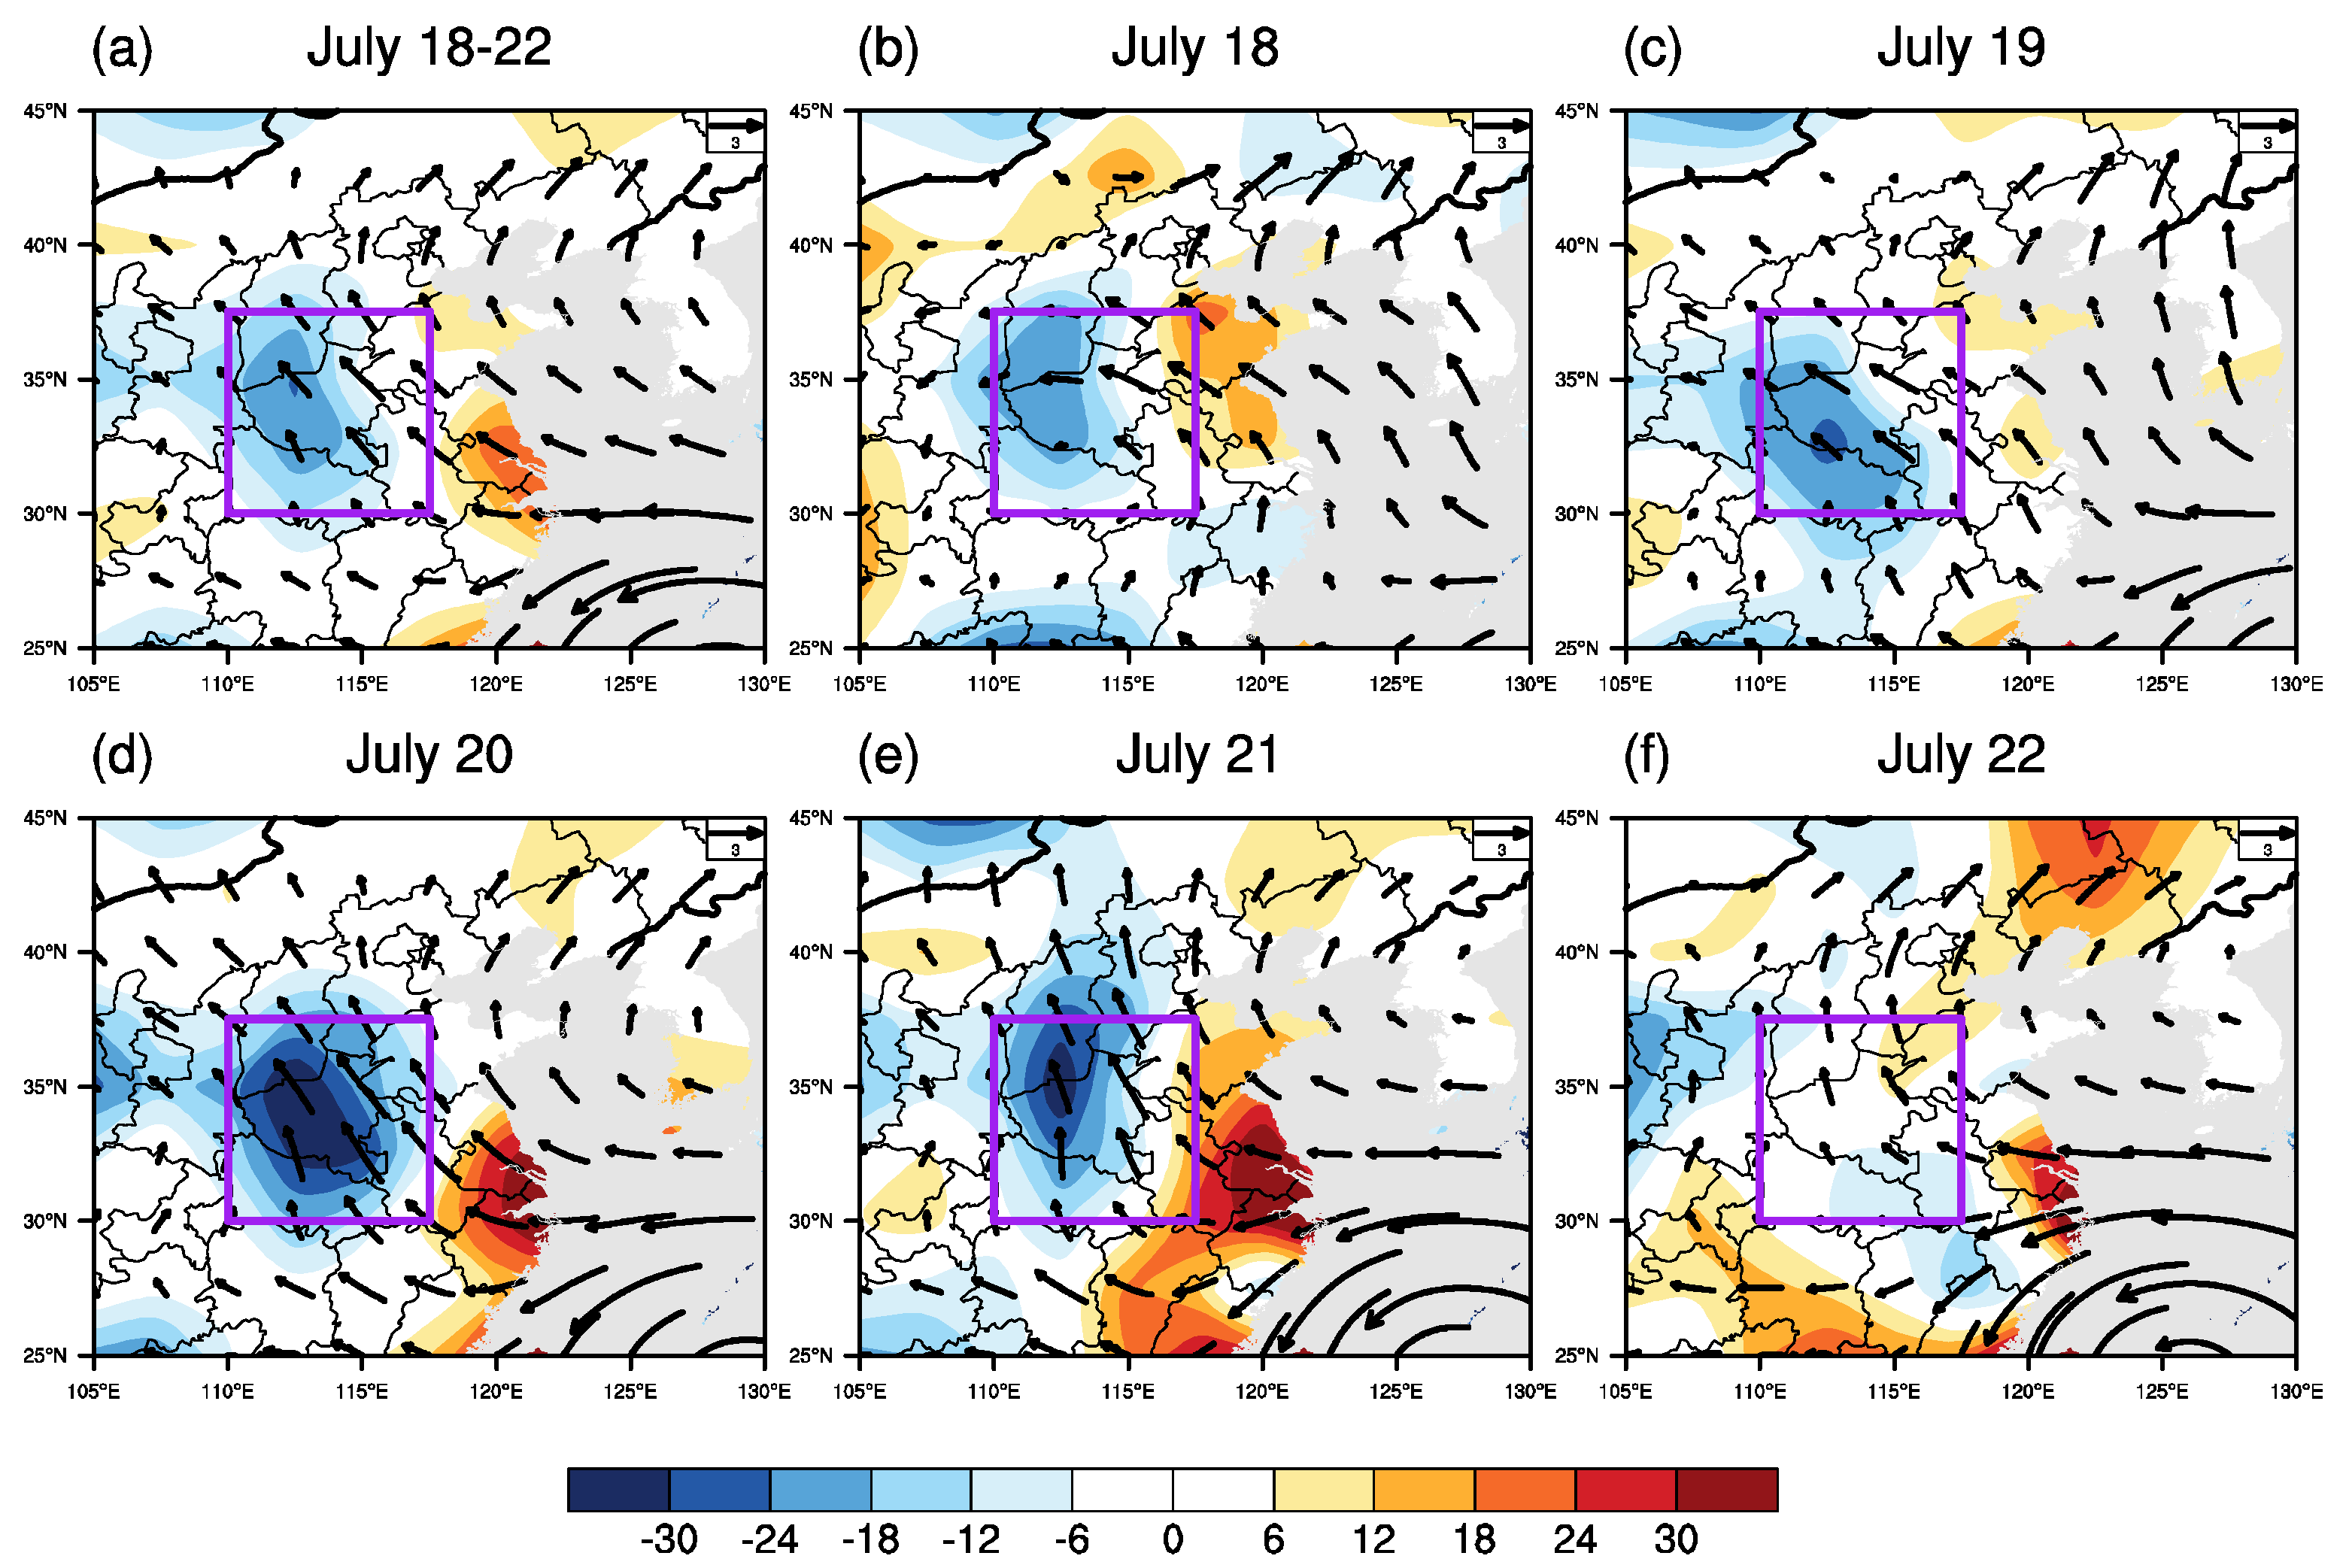
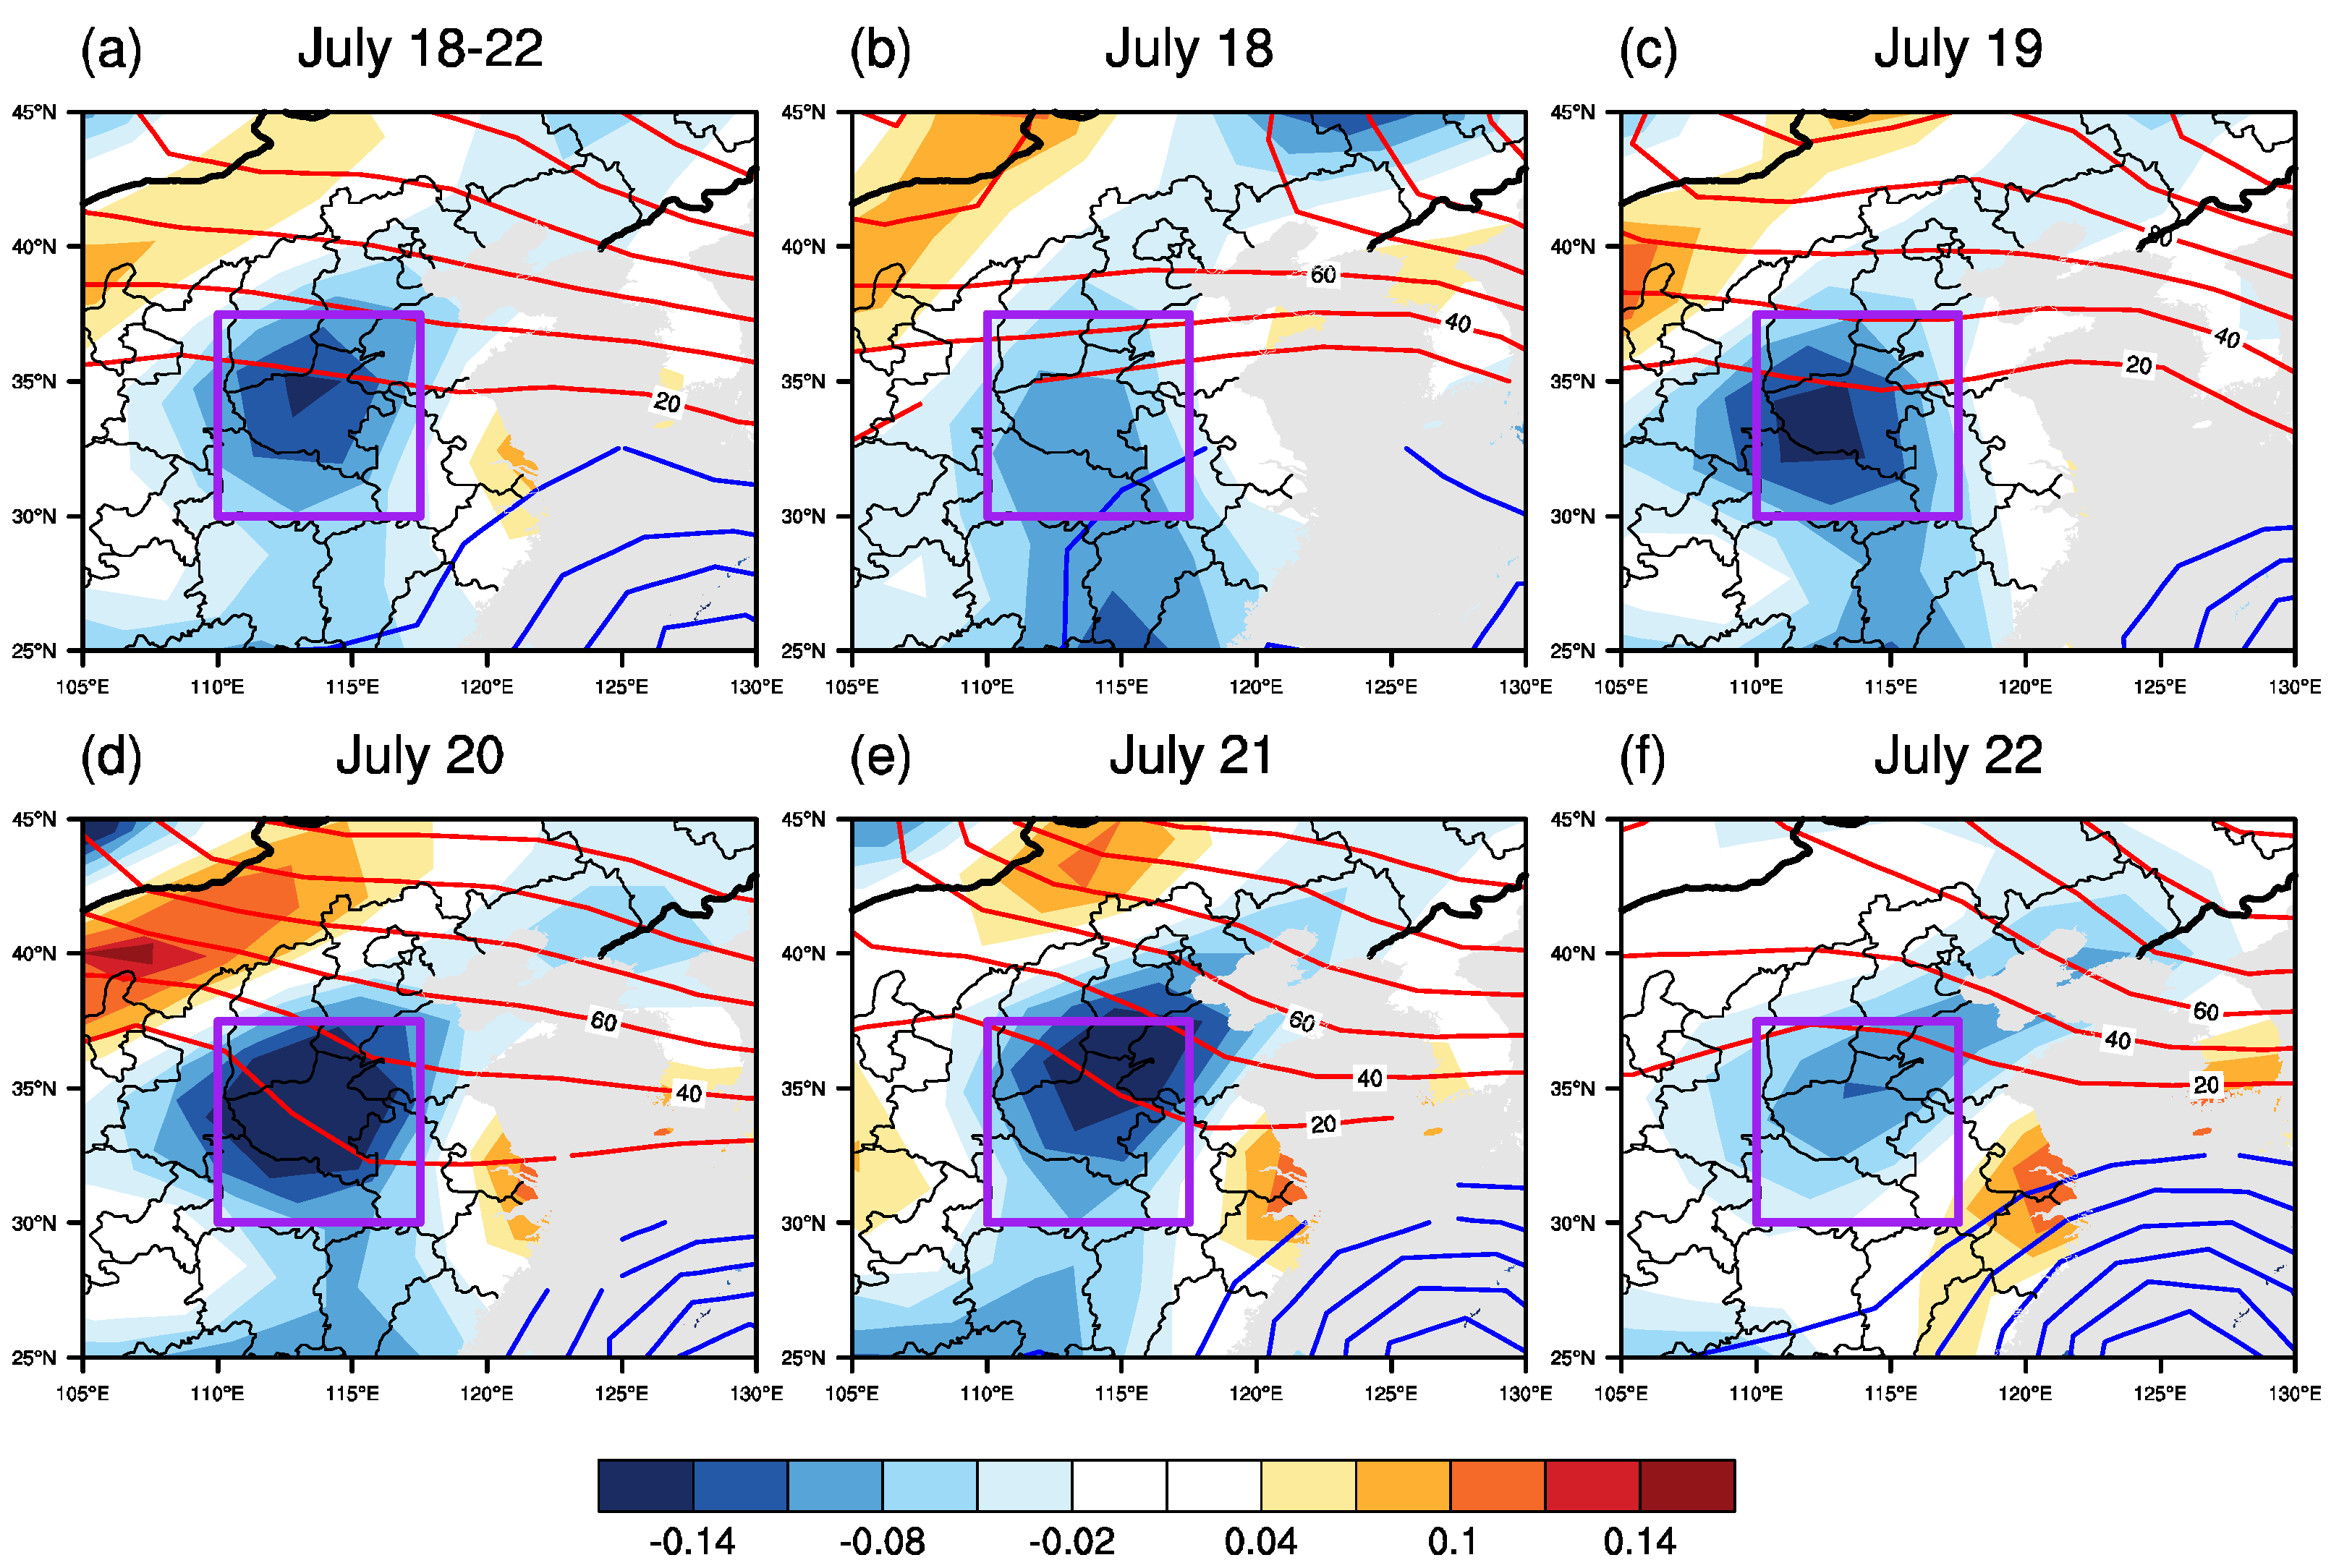
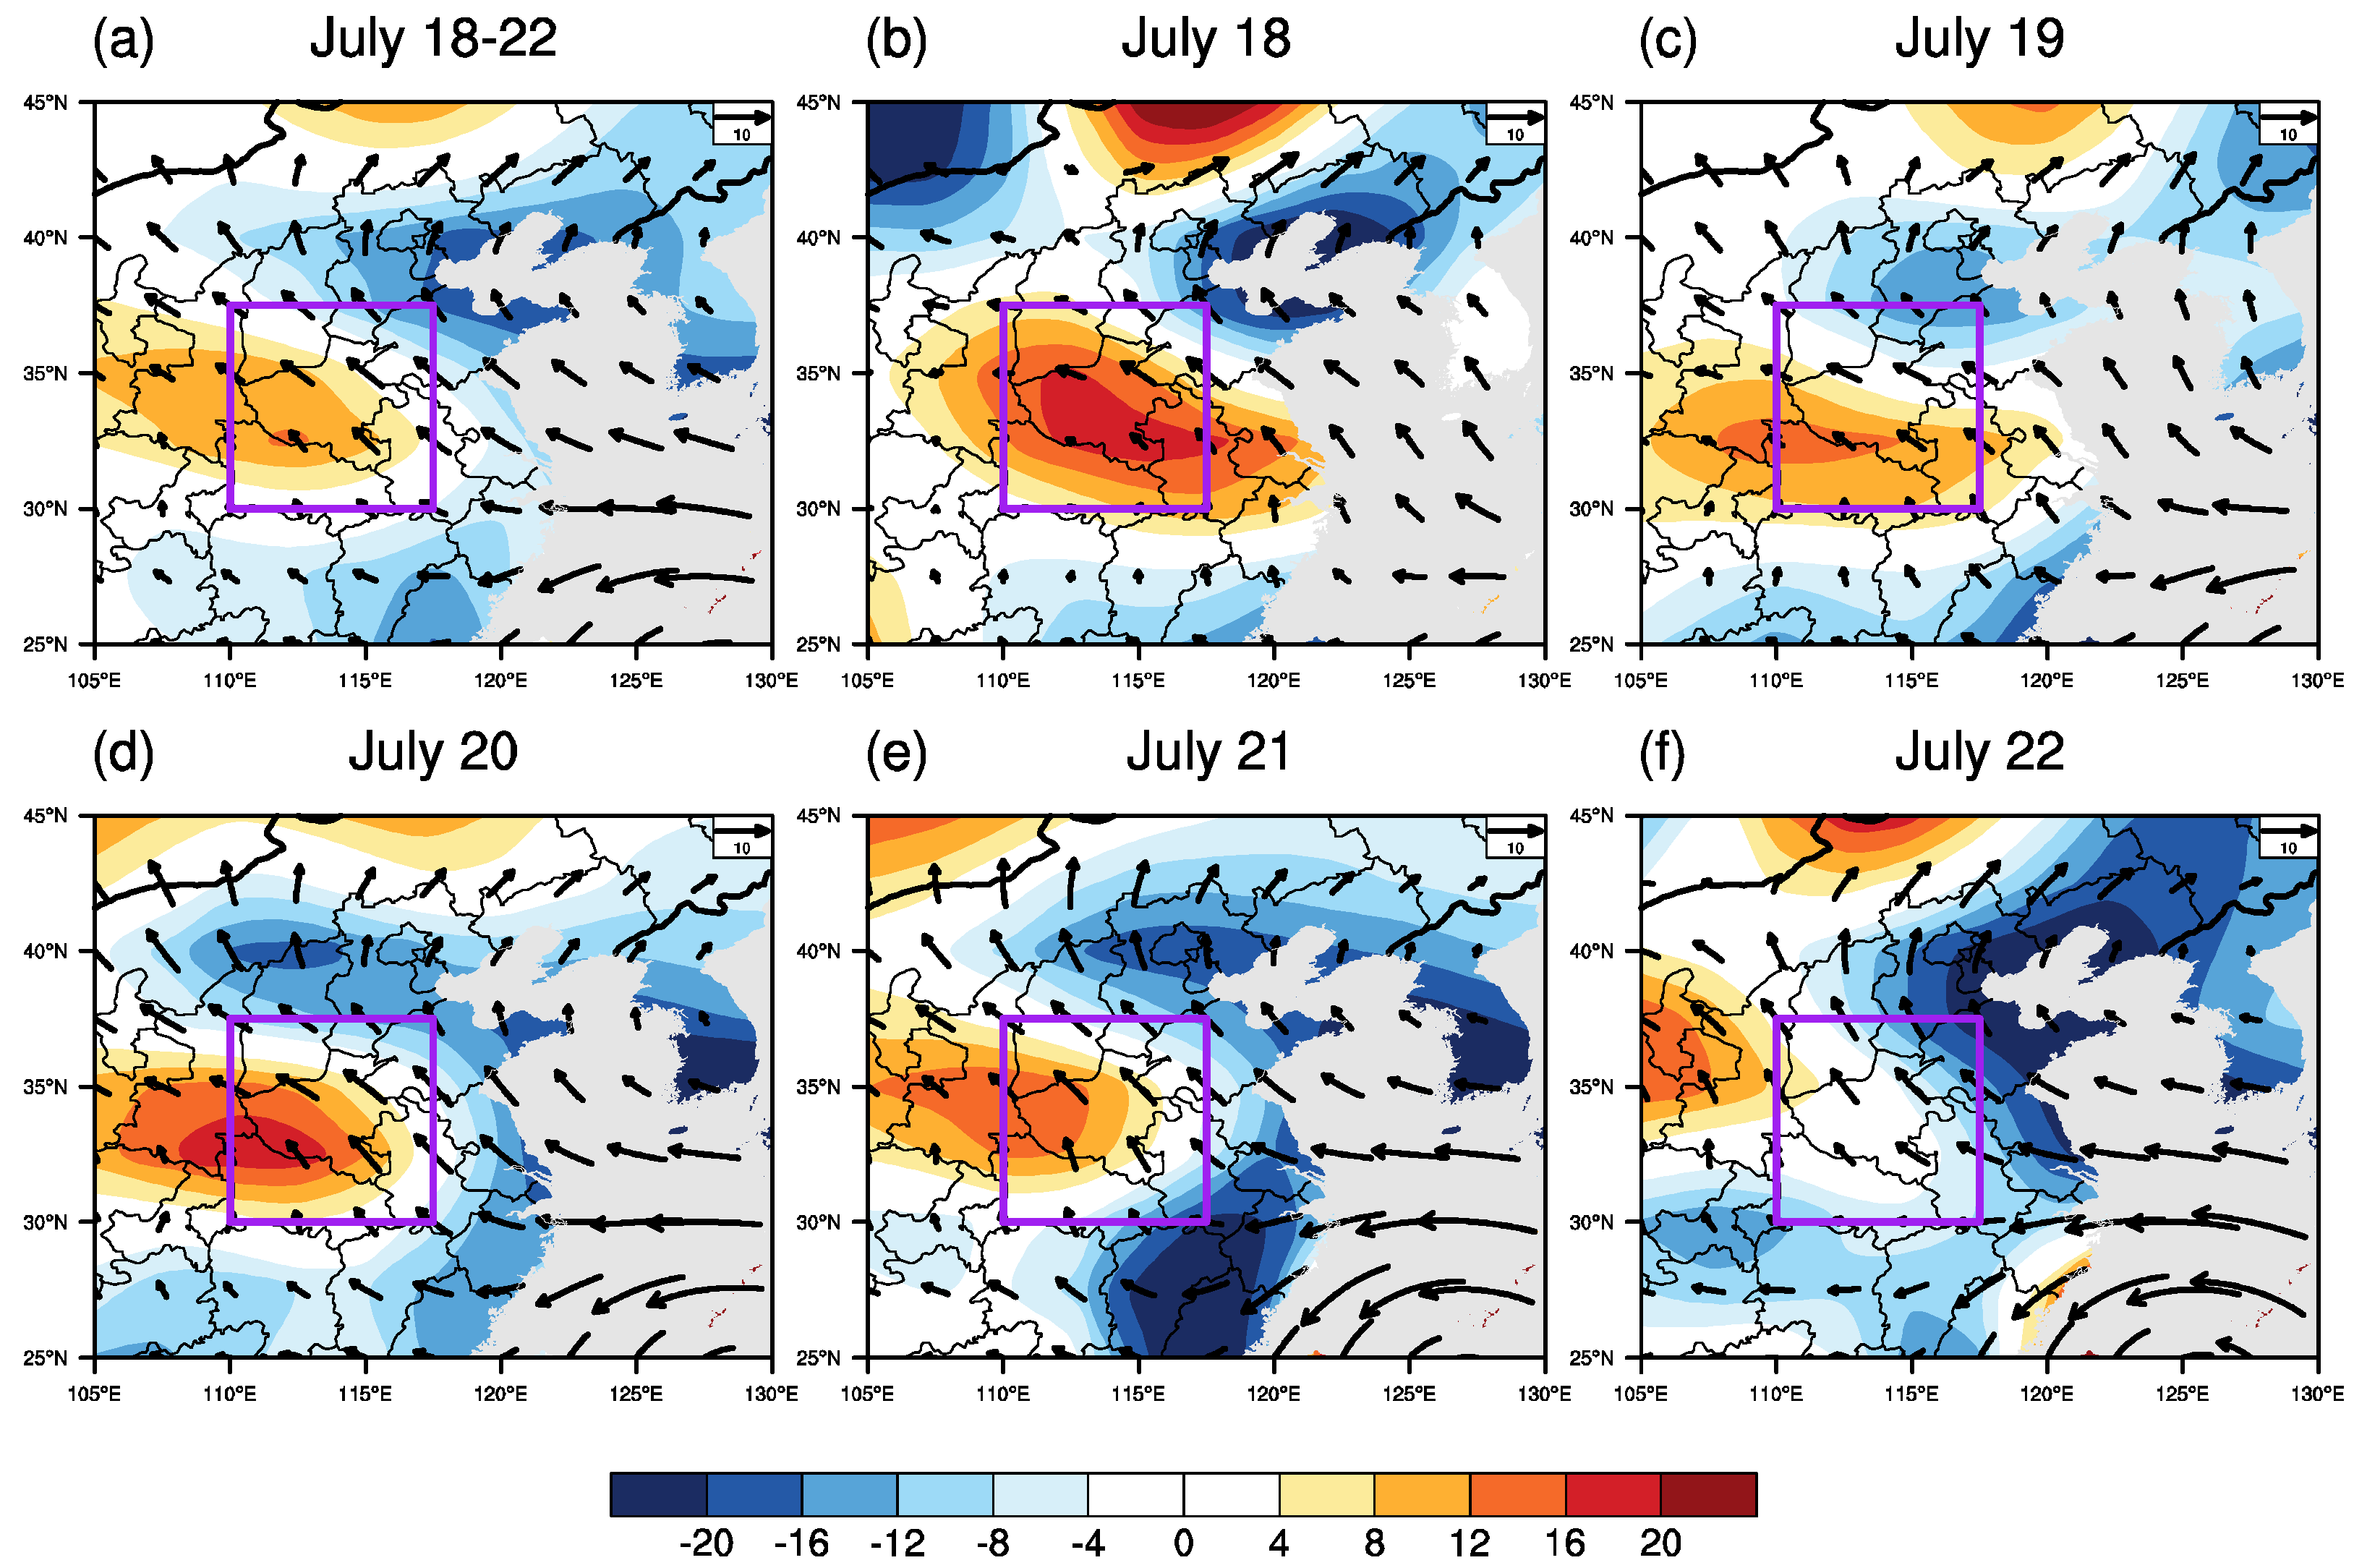
3.1. Extreme Rainfall Event and Atmospheric Circulations

During 18–22 July 2021, a heavy rainfall event occurred in Henan province. Different degrees of rainfall took place throughout the province, with the heavy rainfall central area located in the northern region. The maximum cumulative rainfall was greater than 600 mm (Figure 1a) exceeding the yearly rainfall (509.5 mm), with the rainfall anomaly percentage being 2000% higher than normal (Figure 1b). The average rainfall across the whole province was 229.48 mm, the highest record in Henan since 1951 and nearly twice as much as the second highest record in 1976 (Figure 2a). According to the evolution of the daily average rainfall in Henan province, the rainfall increased sharply from 18 July, before dropping sharply after reaching the peak value of 80 mm on 20 July to a level equal to the climatic rainfall level on 23 July (Figure 2b). A similar feature can be found with regard to the daily rainfall anomaly (Figure 2c). Therefore, the heavy rainfall process of this event was mainly concentrated in the period of 18–22 July.
During 18–22 July, influenced by the typhoon “In-Fa” and strong subtropical highs, there was a significant cyclone (anticyclone) to the east (north) of Taiwan Province, with the anticyclone extending to the west of Henan province. The easterly wind on the north side of the cyclone and the southeasterly wind on the southwest side of the anticyclone worked together, resulting in Henan being mainly controlled by the abnormal southeast airflow and sufficient water vapor transportation (Figure 3). In addition, the whole area of Henan was controlled by abnormal water vapor convergence, providing favorable water vapor conditions for the process of heavy rainfall. According to the daily evolution, the daily water vapor transportation was basically consistent with the 5 day average. The cyclone and anticyclone, as well as the water vapor transportation in the southeast direction, continued to increase, reaching the peak on 20 July, before gradually weakening on 21–22 July, consistent with the development and weakening evolution of this rainfall process (Figure 3a–f).
Consistent with Figure 3, the water vapor from the southeast gathered and was lifted after encountering the blocking of Taihang Mountain and Funiu Mountain in western Henan. The net water vapor input was obvious, forming large-scale and high-intensity rainfall in Henan. The water vapor in Henan mainly came from the southeast direction, i.e., the net water vapor input mainly came through the eastern and southern boundaries. The net water vapor input in the whole process was 8.2 × 10 × 10 7   kg / s , and the daily net water vapor transportation in Henan gradually increased after 18 July, reaching a peak value of 17.1 × 10 × 10 7   kg /   s on 20 July (Table 2).
Consistent with the location of the cyclone and anticyclone in Figure 3, there was a negative height center (low pressure, mainly affected by typhoon “In-Fa”) on the ocean surface in the northeast of Taiwan Province, as well as a positive height (high pressure) center on the north side (Figure 4). There was a huge pressure gradient force between the low-pressure and the high-pressure areas, and southeast wind anomalies were formed by the action of the Coriolis force, which transported water vapor to Henan along the periphery of the high-pressure area (Figure 3). The high-pressure system on the north side and the low-pressure system on the south side were very stable from 18 to 22 July, causing continuous water vapor transport to Henan. At the same time, there was a very strong upward movement over Henan, which was accompanied by abundant water vapor, resulting in abnormally strong rainfall (Figure 4). In addition, the intensity of vertical movements in Henan also gradually increased after 18 July, reaching its peak on 20 July.
The wind field at 850 hPa was basically consistent with the water vapor transport throughout the layer. Under the combined action of the cyclone and anticyclone, there was a significant southeast wind blowing from the ocean to Henan in the period from 18 to 22 July. In addition, there was significant positive vorticity in Henan, and its southeast and northeast areas were marked by negative vorticity anomalies. This configuration of positive and negative vorticity was conducive to the formation of strong vertical upward movement in Henan (see Figure 4). The positive and negative vorticity configuration was maintained from 18 to 22 July, and the vorticity gradient increased until 20 July (Figure 5). Therefore, the abnormally strong vertical upward movements caused by the north–south high and low geopotential height anomalies of 500 hPa and the positive and negative vorticity distribution of 850 hPa provided the motion condition for the continuous rainfall in Henan Province, while the continuous water vapor transportation in the southeast direction created favorable conditions for this heavy rainfall event.

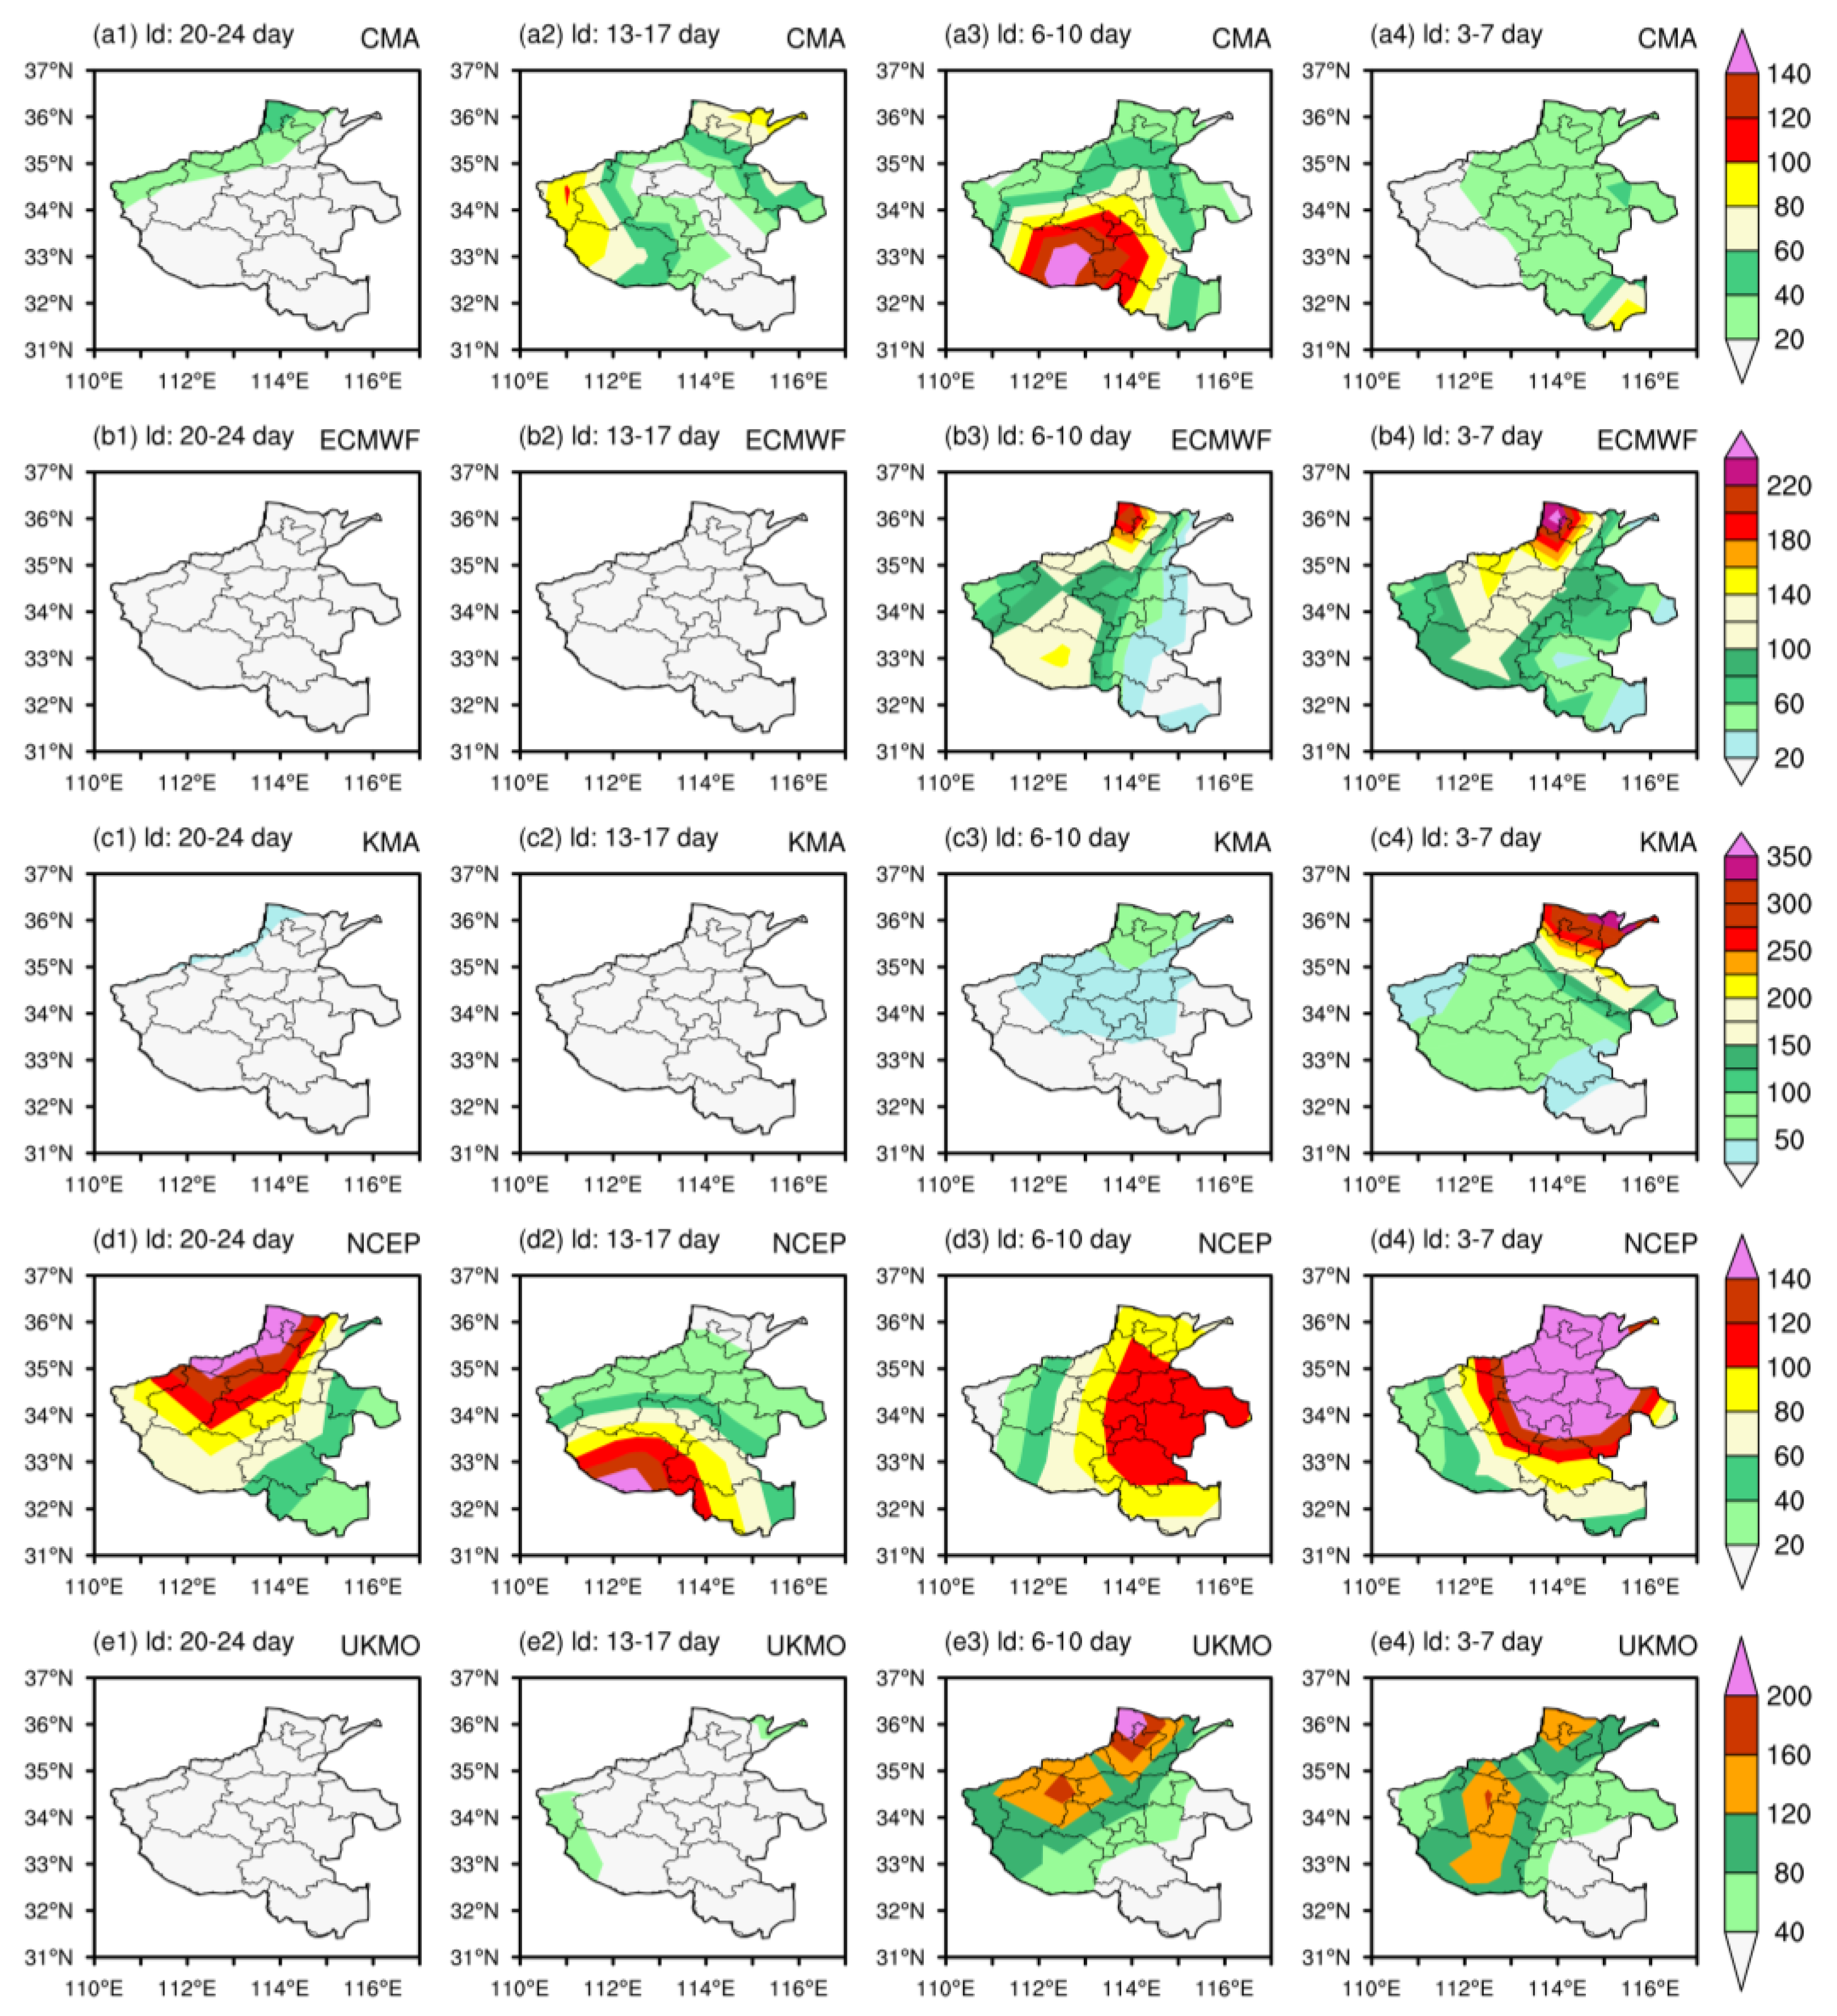
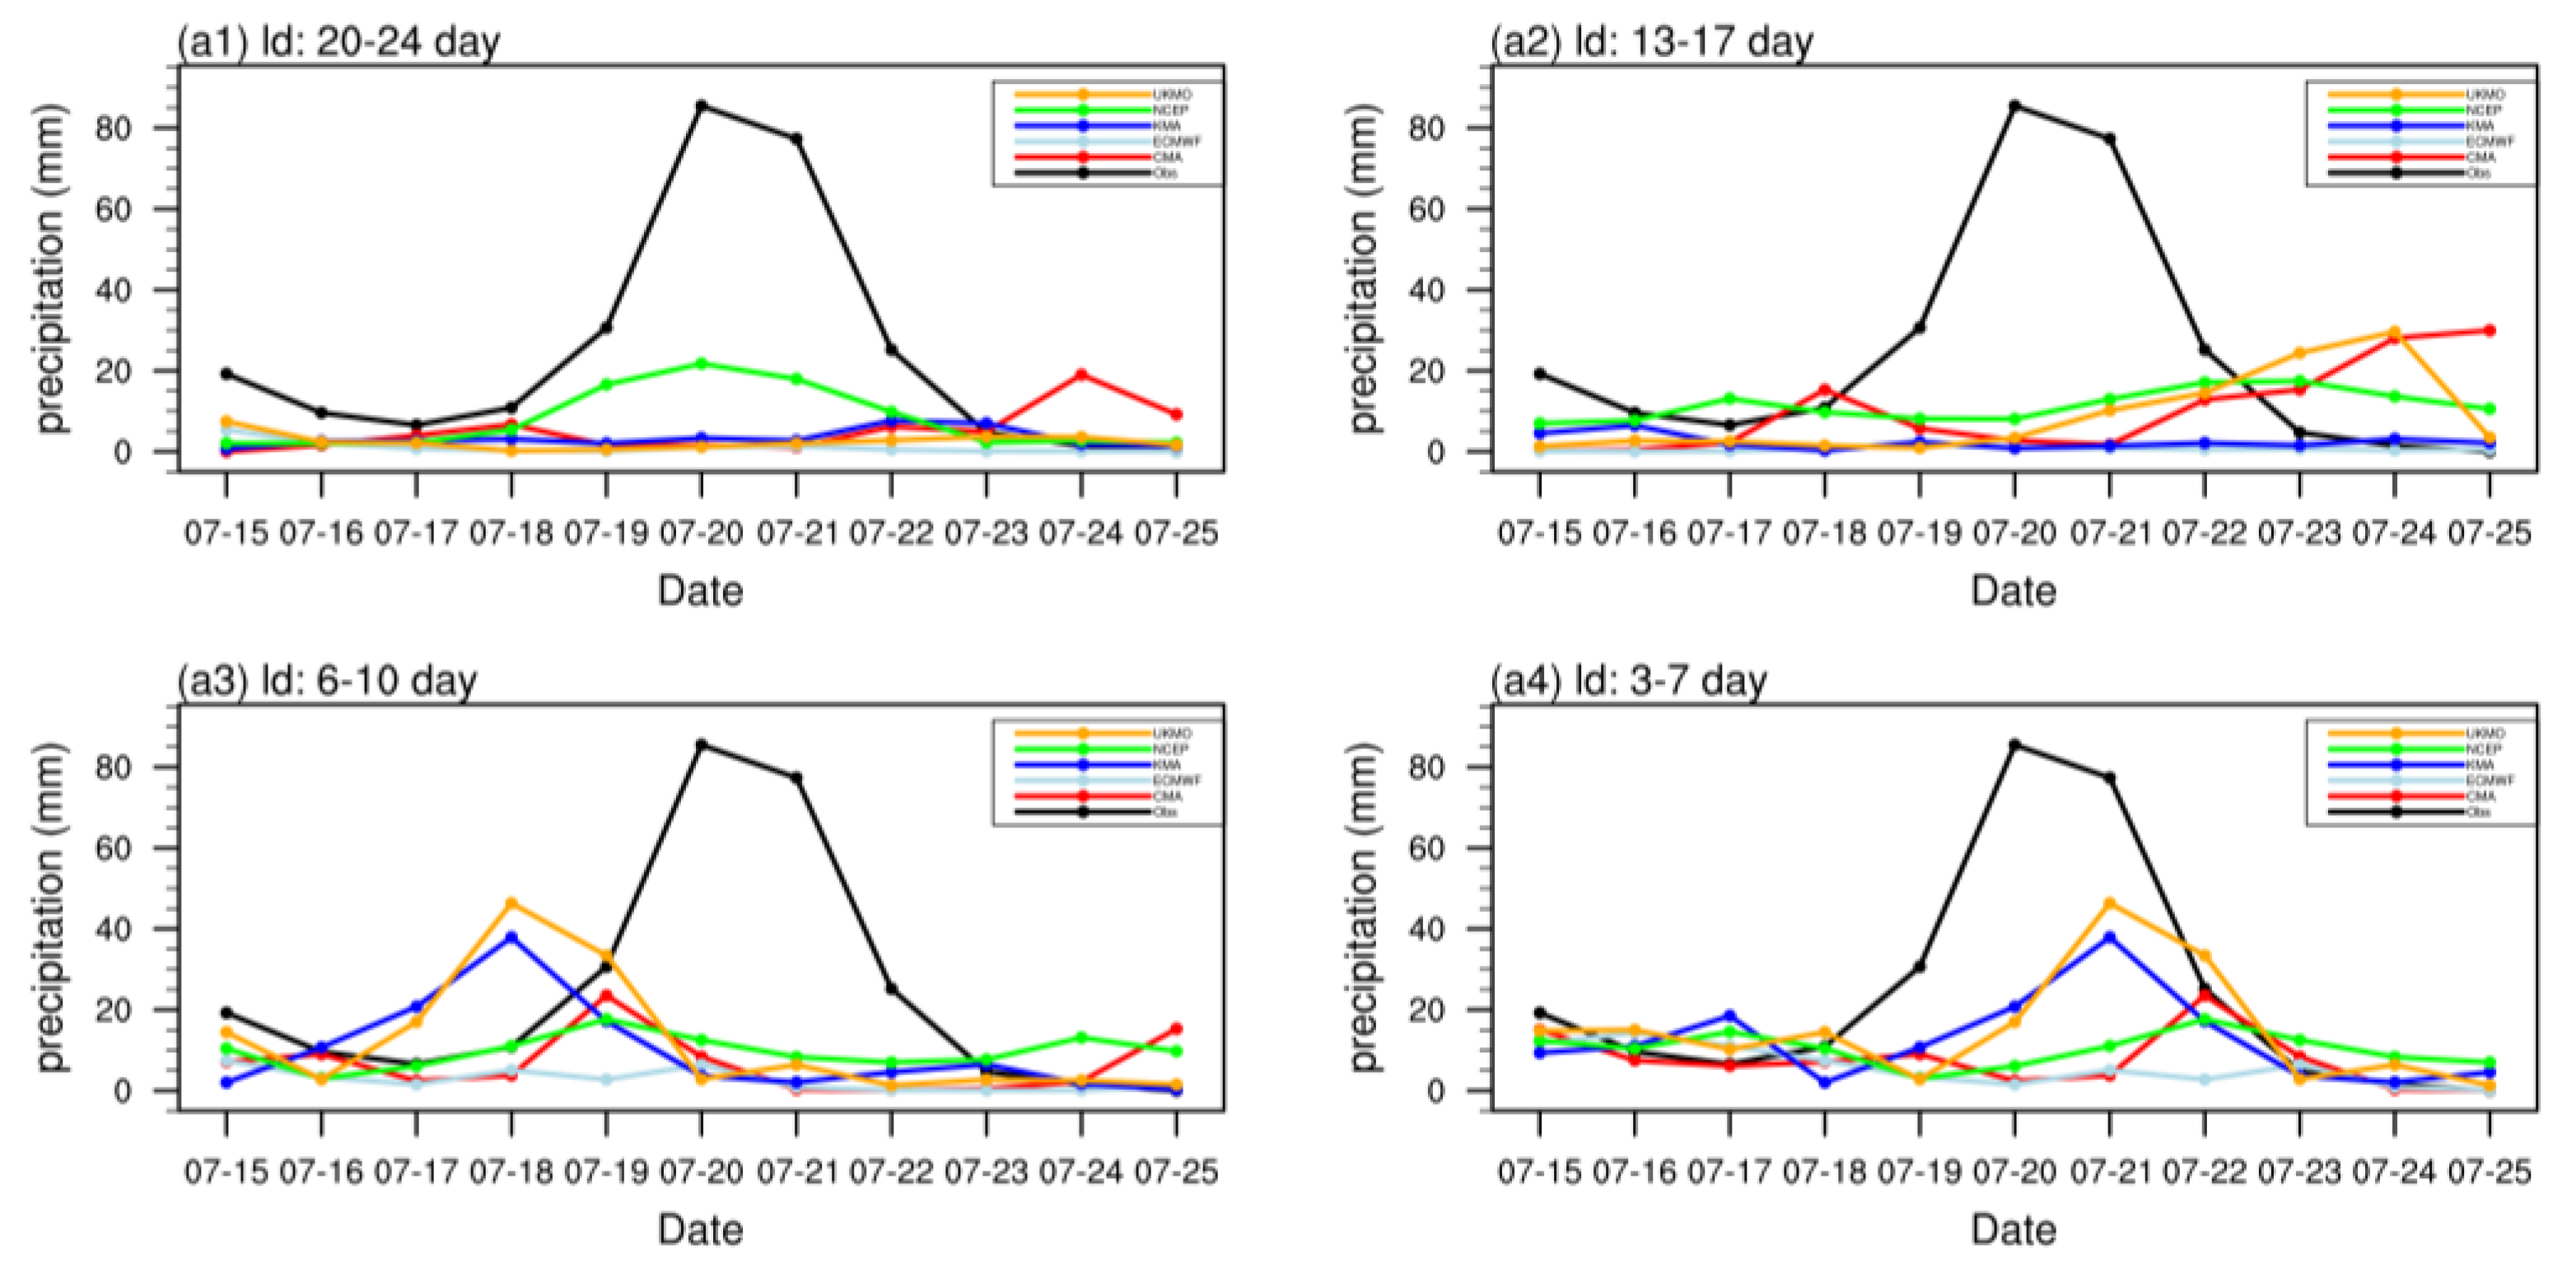
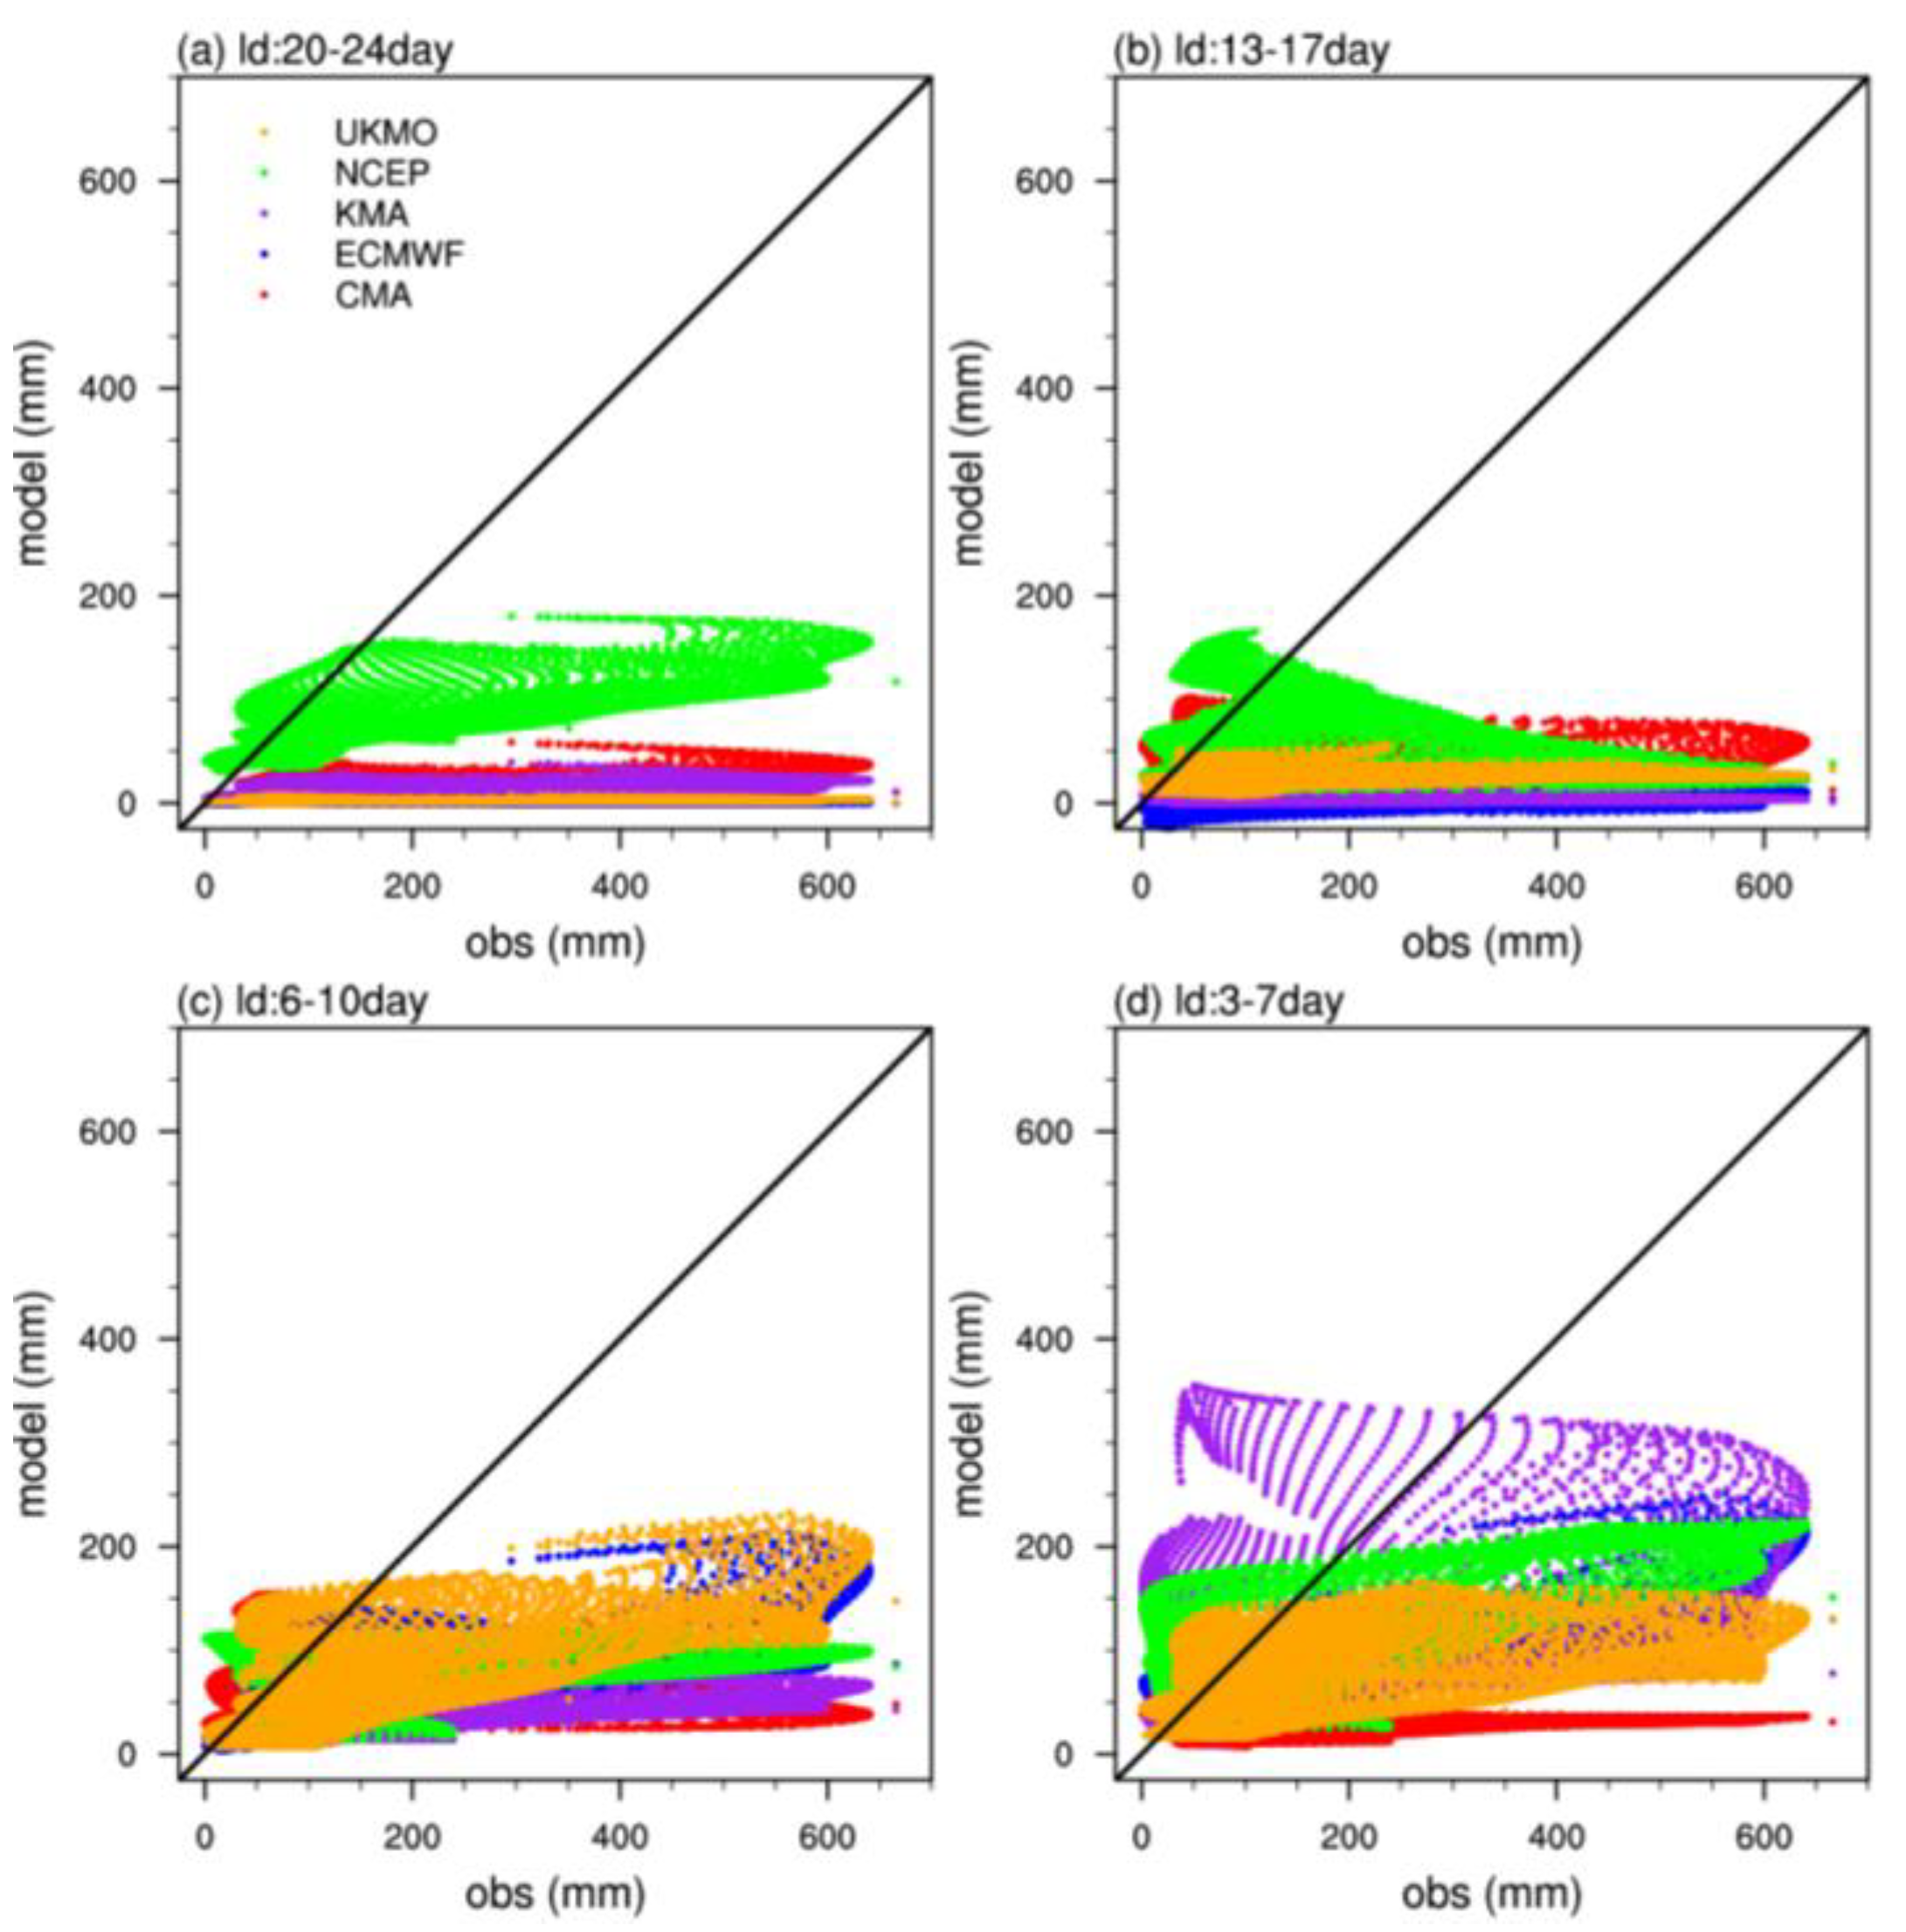
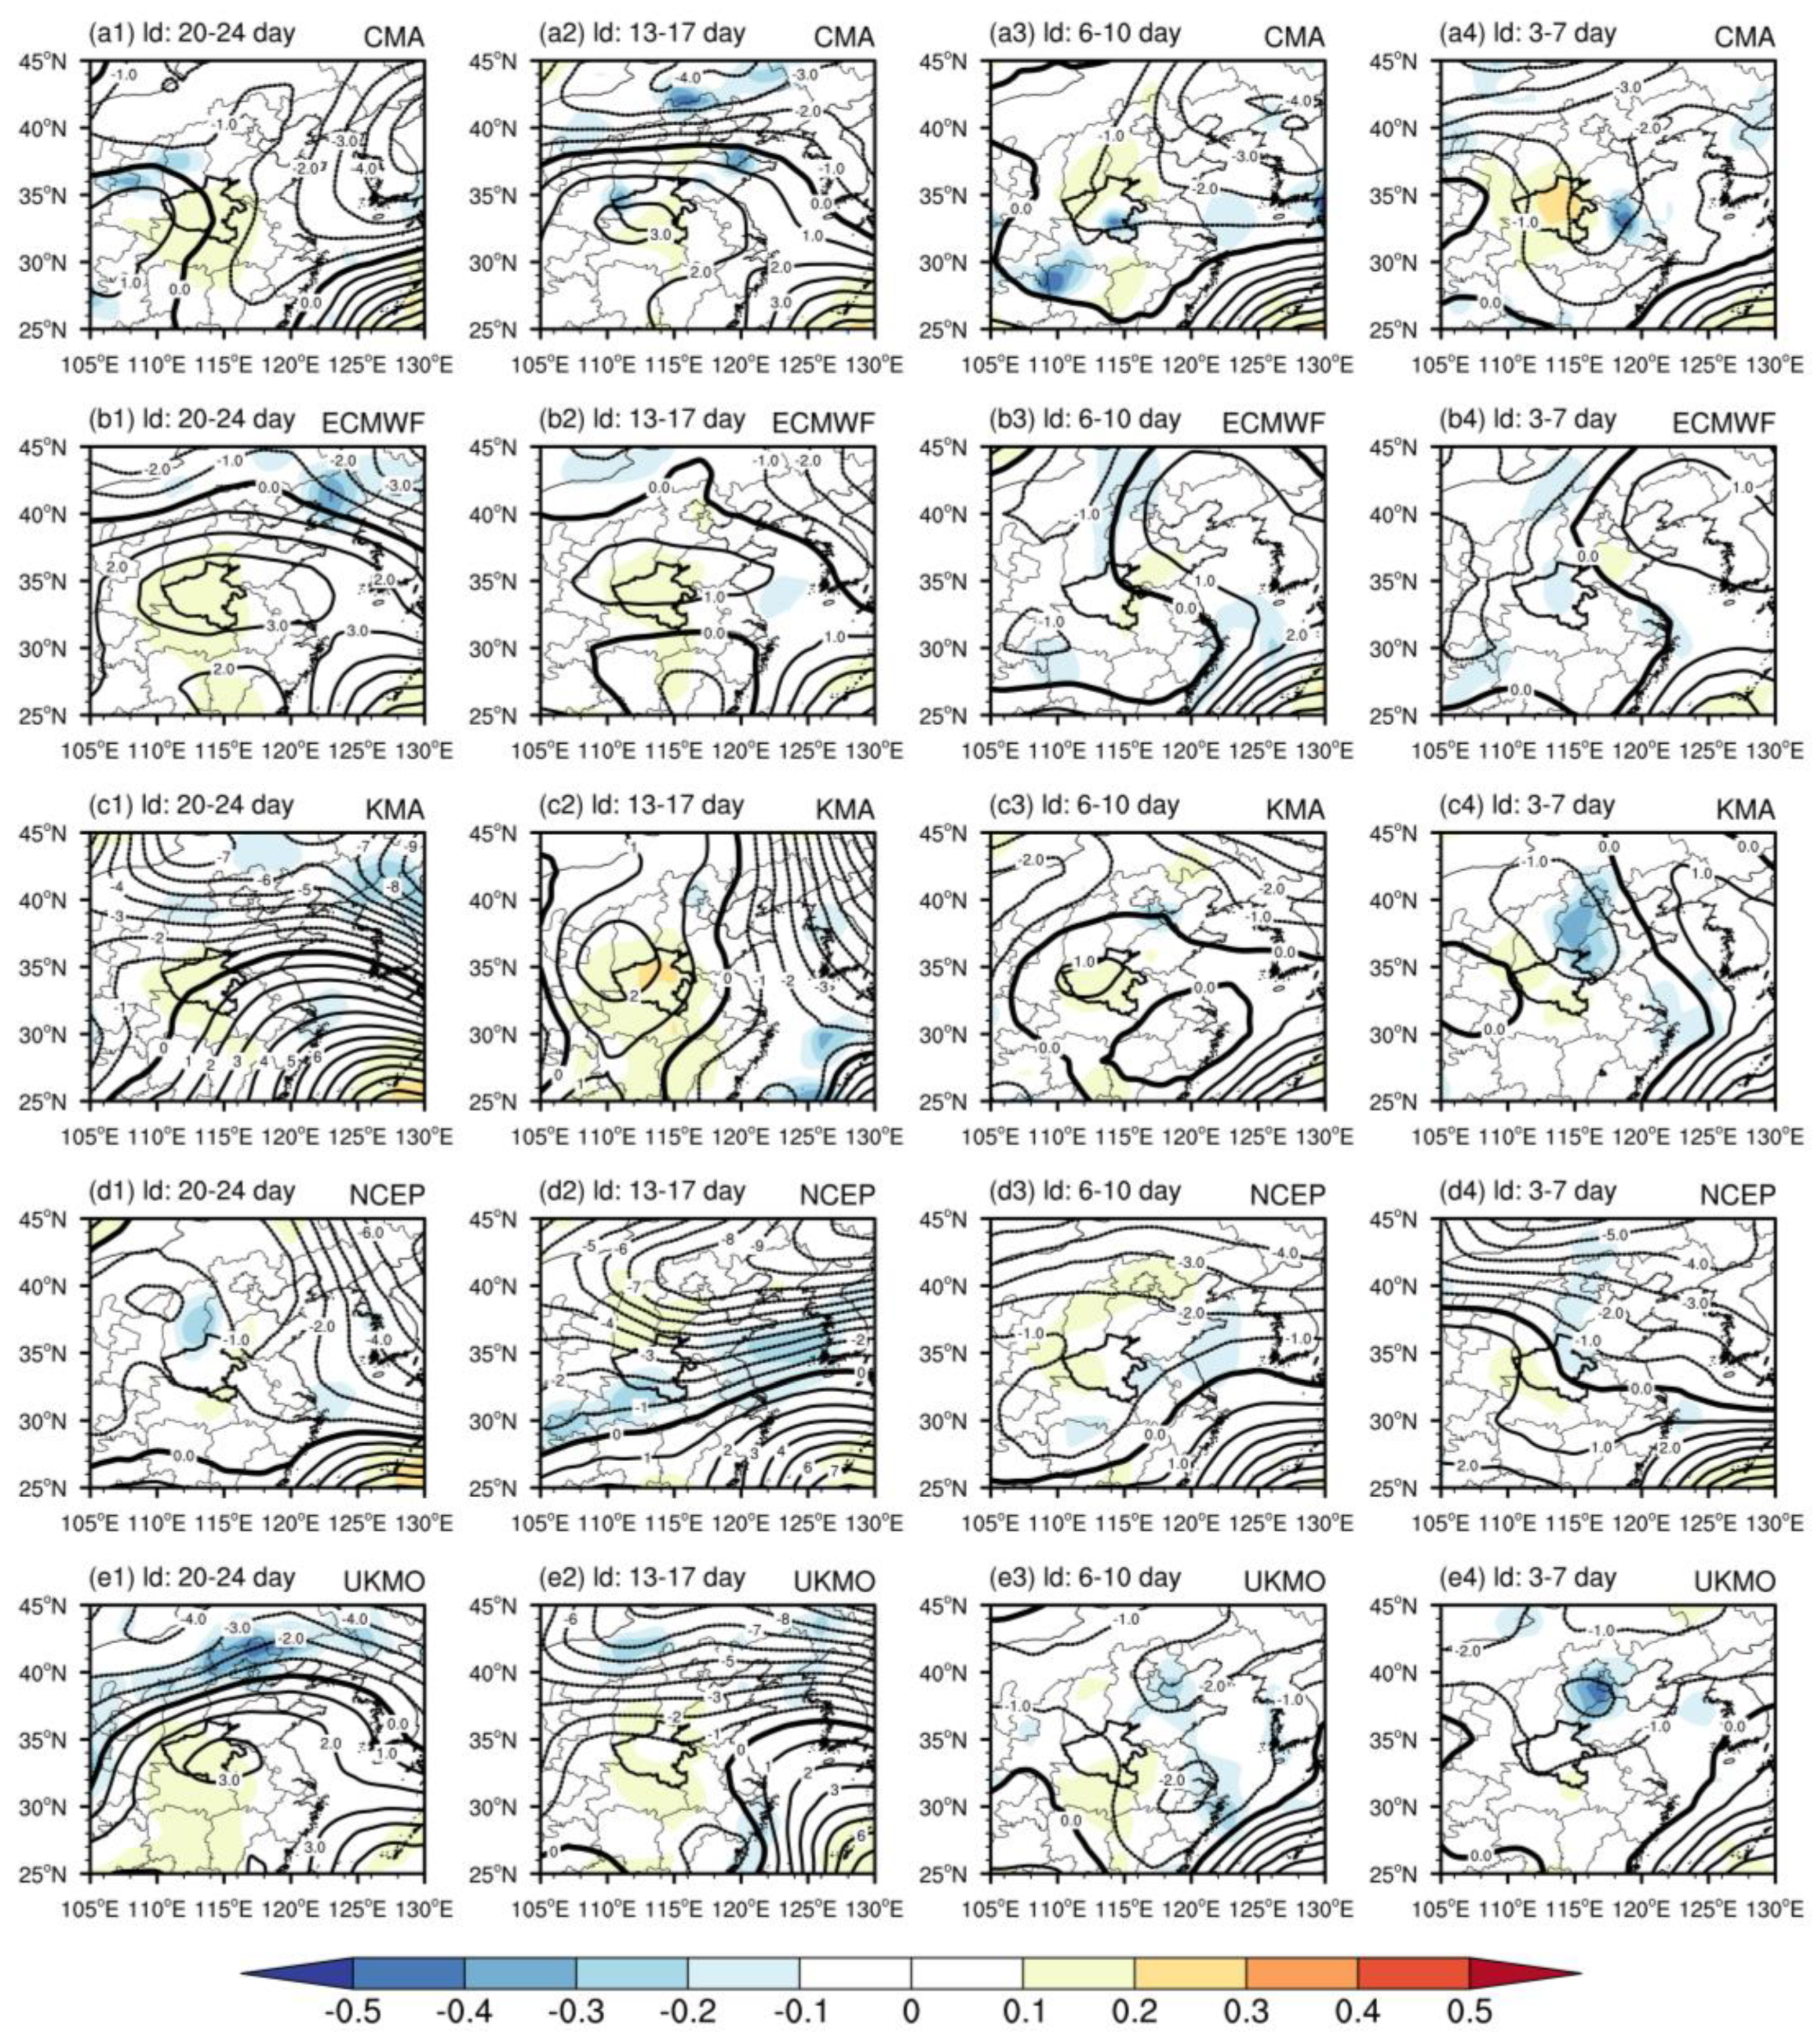
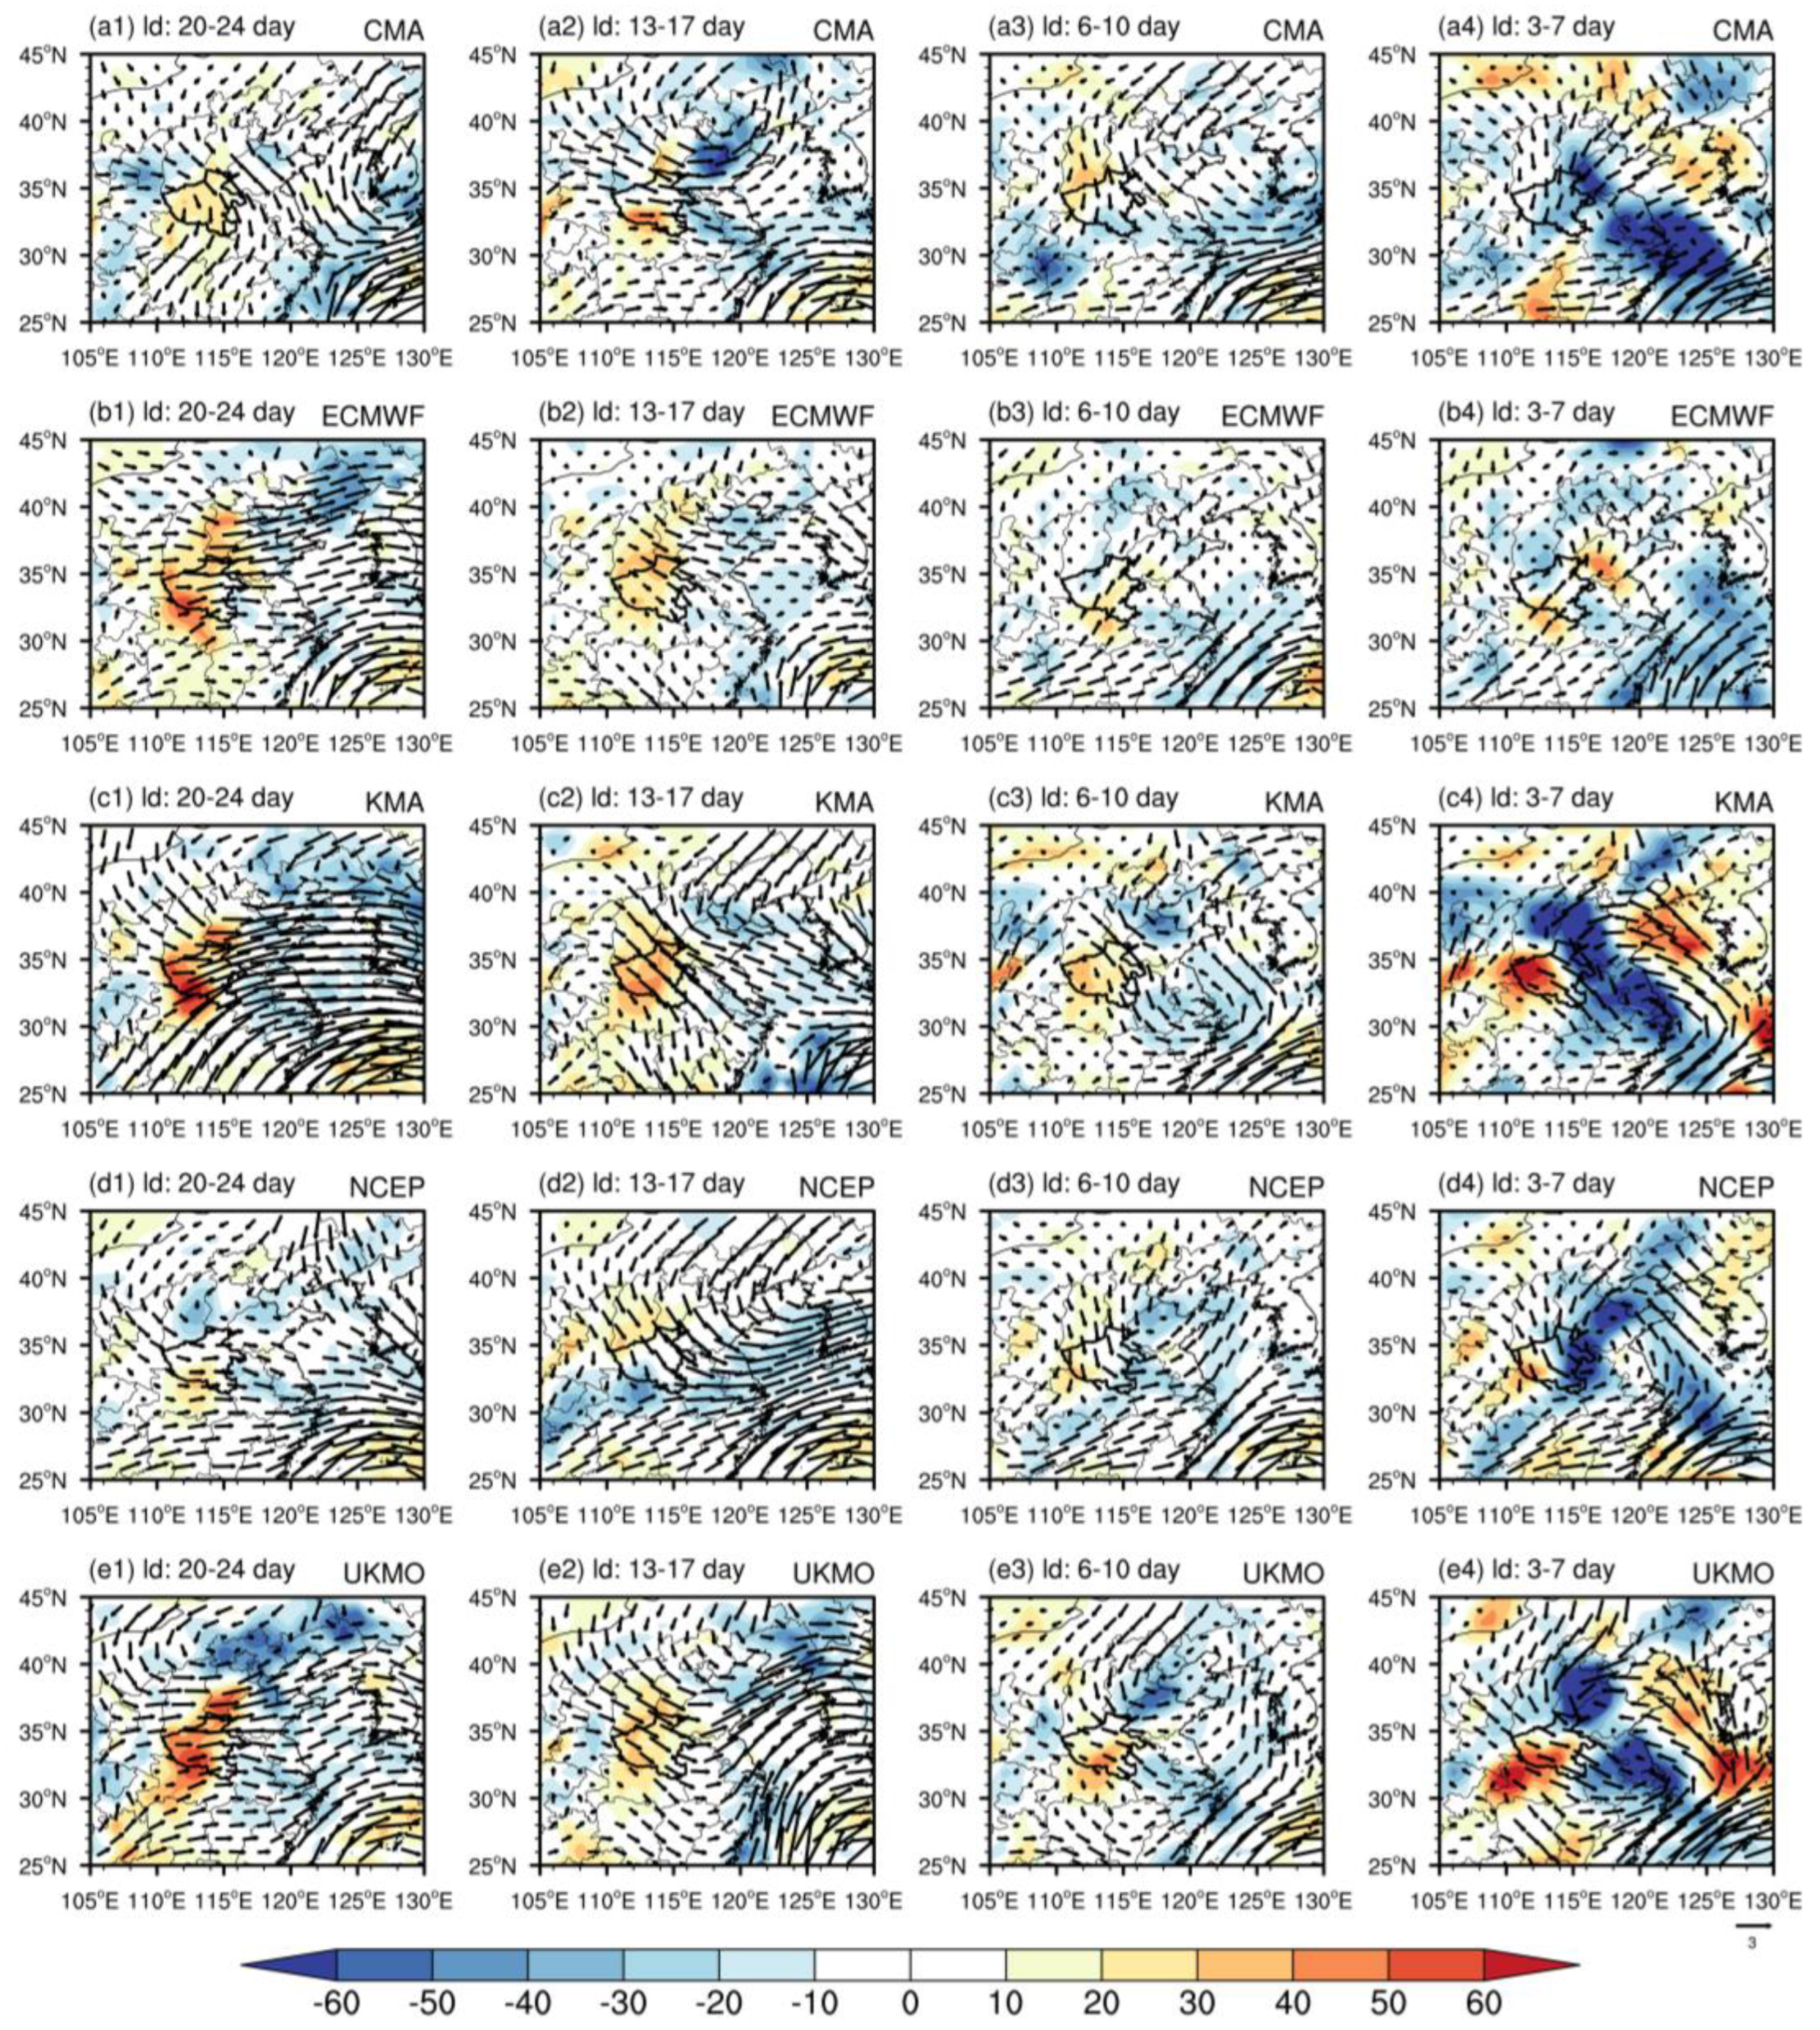
3.2. Prediction Performance of S2S Models

In terms of the accumulated rainfall from July 18 to July 22, only the NCEP model predicted the obvious heavy rainfall event in Henan Province 20 days ahead, while the CMA model predicted the obvious rainfall process 13 days ahead. With 6 days in advance, all five models predicted that there would be widespread rainfall in Henan, but the rainfall intensity and center were quite different. With 3 days in advance, all five models properly predicted the heavy rainfall event, with the rainfall center concentrated in the northern part of Henan (Figure 6). According to the TCs of cumulative rainfall between S2S model prediction and observation, the S2S models showed limited capability in predicting this extreme rainfall event 20 days in advance, with the TCs of four models being below 0.1. However, the NCEP model was first able to predict this extreme rainfall event. The models could capture this event signal 6 days ahead, with most TCs being above 0.2; the best TS was achieved 3 days in advance (Table 3).
In terms of the start and end time of this heavy rainfall, the NCEP model could better predict the rainfall process 20 days ahead, although the rainfall level was small. However, the other four models failed to predict the rainfall event (Figure 7(a1)). It is worth noting that, after the NCEP model was adjusted, the deviation of the prediction of the rainfall event increased (Figure 7(a2)), reflecting the large uncertainty of the model prediction 20 days in advance [34,35]. In the prediction 13 days in advance, the CMA, UK, and NCEP models predicted that there would be a heavy rainfall event, but with a large deviation from the actual situation, especially with respect to the peak value being obviously behind the actual situation (Figure 7(a2)). With 6 days in advance, with the exception of the ECMWF model, the other four models predicted an obvious rainfall process, but the start and end times differed, and the magnitude was quite smaller than the actual value (Figure 7(a3)). With the predictions 3 days ahead, all five models were able to predict this event, with the starting and peak values, as well as the center location, being consistent with actual situation (Figure 7(a4)).
Table 4 shows the root-mean-square error (RMSE) of the cumulative rainfall between the model prediction and observation for this extreme rainfall event during 18–22 July. It can be seen that the RMSE of the five model predictions 20 days and 13 days in advance was large, while the NCEP model RMSE was relatively small. The RMSE for the prediction 10 days in advance was obviously reduced, while that for the prediction 3 days in advance was further reduced. Figure 8 shows the spot distribution of predictions and observations for the cumulative rainfall. The prediction effect for this extreme event also improved with the leading prediction time. The NCEP model showed the best prediction performance for this event.
Figure 9 shows the difference in the average 500 hPa geopotential height and vertical velocity between the model prediction and observation. In the CMA model, the predicted 500 hPa geopotential height turned from positive to negative 6 days in advance, while the ascending motions remained weak for all four predictions (Figure 9(a1–a4)).
In the ECMWF model (Figure 9(b1–b4)), the geopotential height turned negative, and the vertical ascending motion strengthened for the prediction 6 days in advance, with an increased effect 3 days in advance. The KMA model had similar features to the ECWMF model (Figure 9(c1–c4)). The UKMO model presented negative geopotential height 13 days in advance with weak ascending motion 6 days in advance (Figure 9(e1–e4)). The vertical ascending motion of the NCEP model started out strong and the geopotential height presented a negative situation 20 days in advance (Figure 9(d1–d4)), indicating the better performance of the NCEP model in predicting the 21.7 extreme rainfall event compared to the other four models.
The predicted water vapor transport and convergence of the models 20 days and 13 days in advance were weaker than the observation, eventually becoming stronger than the actual situation 6 days in advance (Figure 10). The errors in water vapor transportation prediction were mainly due to the underestimated intensity of low-latitude cyclones and high-latitude anticyclones, which weakened the southeast wind intensity over Henan (Figure 10). Moreover, the CMA, KMA, and UKMO models overestimated the intensity of cyclonic circulation and relative vorticity to the east of Henan 6 days and 3 days in advance (Figure 10(a4,c4,e4)), resulting in the convergence center of water vapor being located to the east of Henan. In Figure 10(d1–d4), the NCEP model first predicted the weak water vapor convergence and circulation anomalies 20 days in advance, which was beneficial for enhancing the rainfall prediction 6 days in advance. As the prediction performance of the different models varied as a function of leading time, the application of the S2S models in real prediction operations needs to fully consider their prediction ability [36,37], especially with respect to extreme events.

4. Summary and Discussion

The features and formation mechanisms of the “21.7 event” in Henan Province and the performances of five S2S models in predicting this event were analyzed in this study. The maximum cumulative rainfall of this extreme rainfall event was greater than 600 mm (Figure 1a), exceeding the yearly rainfall (509.5 mm), with a rainfall anomaly percentage almost 2000% higher than normal (Figure 1b). During the “21.7 event”, rainfall covered the whole Henan province; the daily average rainfall reached its peak of 80 mm on 20 July, and the cumulative rainfall of the main process was 229.5 mm, which was 715% higher than normal (32.1 mm). The subtropical high (anticyclone) was stably retained in the range of 30° N–45° N along the East Asian coast, and typhoon “In-Fa” (cyclone) stagnated on the southeast coast of China. The southeasterly wind on the north side of the cyclone and the south side of the anticyclone were superimposed, which enhanced the water vapor transport to Henan and provided the water vapor condition for the extreme rainfall event. In this process, the remarkable ascending movement and positive relative vorticity in Henan jointly led to the water vapor convergence in Henan Province, thus resulting in this extreme rainfall event.
Five S2S models showed limited capability in predicting this extreme rainfall event, and the different models presented various biases. The NCEP model could predict the circulation anomalies close to the actual situation 20 days in advance, while the other four models could only capture the corresponding anomalies 6 days in advance, but biases still existed in the location of the rainfall center. All models could properly predict this extreme rainfall event 3 days in advance with a consistent starting date and accurate rainfall location, but the predicted rainfall value was still much lower than the observation. Accordingly, single S2S models had a limited ability in predicting this “21.7 event” in Henan province, especially with a 20 day leading time; however, the use of multiple models or model ensembles for prediction may enable identification of the signal of this extreme event 20 days in advance. Therefore, multi-model ensembles could represent an ideal solution for the application of S2S models [38].
The capability of the models to properly reproduce the local water vapor convergence and vertical movements represents a crucial factor limiting their ability to predict this extreme rainfall event. This study implies that, in S2S model rainfall prediction, it is critical to properly predict the local water vapor convergence and vertical movements [35]. Furthermore, S2S prediction is dependent on initial and boundary conditions, and the simulation of proper sub-seasonal prediction requires a realistic air–sea interaction and a reduction in initial errors [39,40].
The IPCC has reported substantial increases in heavy precipitation events under the background of global warming. Annual heavy precipitation events disproportionately increased compared to mean changes between 1951 and 2003 over many mid-latitude regions [41]. Extreme rainfall monitoring and prediction deserve great attention from meteorologists. This study indicated that the “21.7 event” could be predicted by one of the five S2S models 20 days in advance, with the remaining models achieving better prediction with the decrease in leading time. Two aspects can be considered in future S2S prediction: (1) the use of a multi-model ensemble to capture the signal of extreme rainfall events as early as possible and reduce the uncertainty of S2S prediction; (2) a decrease in leading time can allow more models to capture the “21.7 event”, indicating an increase in the probability of predicting rainfall events. Thus, S2S models are quite suitable for applications in rainfall prediction, with different models presenting different occurrence probabilities.

Author Contributions

Conceptualization, X.W. and G.F.; software, H.B.; writing—original draft, S.L.; writing—review and editing, L.L. All authors have read and agreed to the published version of the manuscript.

Funding

This work was supported by the National Key Research and Development Program of China (2018YFA0606301), the State Key Program of National Natural Science Foundation of China (42130610), and the General Program of the National Natural Science Foundation of China (42075057, and 41875100).

Institutional Review Board Statement

Not applicable.

Informed Consent Statement

Not applicable.

Data Availability Statement

NCEP reanalysis data are available from NCEP/NCAR Reanalysis 1: NOAA Physical Sciences Laboratory. The S2S model data are available from ECMWF|S2S, ECMWF, real-time, daily averaged. The station observation data are available from the National Meteorological Information Center, China Meteorological Administration (http://data.cma.cn, accessed on 4 September 2022).

Acknowledgments

The authors are very grateful to the editor and anonymous reviewers for their help and recommendations.

Conflicts of Interest

The authors declare no conflict of interest.

References

  1. Ding, Y. Monsoons over China. Adv. Atmos. Sci. 1994, 11, 252. [Google Scholar]
  2. Yu, M.; Liu, Y. The possible impact of urbanization on a heavy rainfall event in Beijing. J. Geophys. Res. Atmos. 2015, 120, 8132–8143. [Google Scholar] [CrossRef]
  3. Zhang, D.; Lin, Y.; Zhao, P.; Yu, X.; Wang, S.; Kang, H.; Ding, Y. The Beijing extreme rainfall of 21 July 2012: “Right results” but for wrong reasons. Geophys. Res. Lett. 2013, 40, 1426–1431. [Google Scholar] [CrossRef]
  4. Bodri, L.; Čermák, V. Prediction of extreme precipitation using a neural network: Application to summer flood occurrence in Moravia. Adv. Eng. Softw. 2000, 31, 311–321. [Google Scholar] [CrossRef]
  5. Huang, R.; Chen, J.; Wang, L.; Lin, Z. Characteristics, processes, and causes of the spatio-temporal variabilities of the East Asian monsoon system. Adv. Atmos. Sci. 2012, 29, 910–942. [Google Scholar] [CrossRef]
  6. Liu, Y.; Fan, K.; Chen, L.; Ren, H.-L.; Wu, Y.; Liu, C. An operational statistical downscaling prediction model of the winter monthly temperature over China based on a multi-model ensemble. Atmos. Res. 2021, 249, 105262. [Google Scholar] [CrossRef]
  7. Tian, B.Q.; Fan, K. Climate prediction of summer extreme precipitation frequency in the Yangtze River valley based on sea surface temperature in the southern Indian Ocean and ice concentration in the Beaufort Sea. Int. J. Climatol. 2020, 40, 4117–4130. [Google Scholar] [CrossRef]
  8. Vuillaume, J.F.; Dorji, S.; Komolafe, A.; Herath, S. Sub-seasonal extreme rainfall prediction in the Kelani River basin of Sri Lanka by using self-organizing map classification. Nat. Hazards 2018, 94, 385–404. [Google Scholar] [CrossRef]
  9. Li, J.; Ding, R. Temporal–spatial distribution of atmospheric predictability limit by local dynamical analogues. Mon. Weather Rev. 2011, 139, 3265–3283. [Google Scholar] [CrossRef]
  10. Li, J.; Hsu, H.H.; Wang, W.C.; Ha, K.-J.; Li, T.; Kitoh, A. East Asian climate under global warming: Understanding and projection. Clim. Dyn. 2018, 51, 3969–3972. [Google Scholar] [CrossRef]
  11. Li, J.; Wu, Z.; Jiang, Z.; He, J. Can global warming strengthen the East Asian summer monsoon. J. Clim. 2010, 23, 6696–6705. [Google Scholar] [CrossRef]
  12. Jiang, F.; Hu, R.; Wang, S.; Zhang, Y.-W.; Tong, L. Trends of precipitation extremes during 1960–2008 in Xinjiang, the Northwest China. Theor. Appl. Climatol. 2013, 111, 133–148. [Google Scholar] [CrossRef]
  13. Ma, S.; Zhou, T.; Dai, A.; Han, Z. Observed Changes in the Distributions of Daily Precipitation Frequency and Amount over China from 1960 to 2013. J. Clim. 2015, 28, 6960–6978. [Google Scholar] [CrossRef]
  14. Xiao, C.; Wu, P.; Zhang, L.; Song, L. Robust increase in extreme summer rainfall intensity during the past four decades observed in China. Sci. Rep. 2016, 6, 38506. [Google Scholar] [CrossRef] [PubMed]
  15. Xu, X.; Miao, Q.; Wang, J.; Zhang, X. The water vapor transport model at the regional boundary during the Meiyu period. Adv. Atmos. Sci. 2003, 20, 333–342. [Google Scholar] [CrossRef]
  16. Zhou, T.J.; Yu, R. Atmospheric water vapor transport associated with typical anomalous summer rainfall patterns in China. J. Geophys. Res. Atmos. 2005, 110, D08104. [Google Scholar] [CrossRef]
  17. Samel, A.N.; Wang, W.-C.; Zhong, X.-Z. The monsoon rainband over China and relationships with the Eurasian circulation. J. Clim. 1999, 12, 115–131. [Google Scholar] [CrossRef]
  18. Lu, R. Anomalies in the tropics associated with the heavy rainfall in East Asia during the summer of 1998. Adv. Atmos. Sci. 2000, 17, 205–220. [Google Scholar]
  19. Chen, Y.; Zhai, P. Two types of typical circulation pattern for persistent extreme precipitation in Central-Eastern China. Q. J. R. Meteorol. Soc. 2013, 140, 1467–1478. [Google Scholar] [CrossRef]
  20. Chen, Y.; Zhai, P. Precursor Circulation Features for Persistent Extreme Precipitation in Central-Eastern China. Weather Forcasting 2014, 29, 226–240. [Google Scholar] [CrossRef]
  21. Zhang, S.; Ma, Z.; Li, Z.; Zhang, P.; Liu, Q.; Nan, Y.; Zhang, J.; Hu, S.; Feng, Y.; Zhao, H. Using CYGNSS Data to Map Flood Inundation during the 2021 Extreme Precipitation in Henan Province, China. Remote Sens. 2021, 13, 5181. [Google Scholar] [CrossRef]
  22. Ran, L.; Li, S.; Zhou, Y. Observational Analysis of the Dynamic, Thermal, and Water Vapor Characteristics of the “7.20” Extreme Rainstorm Event in Henan Province. Chin. J. Atmos. Sci. 2021, 45, 1366–1383. [Google Scholar]
  23. Nie, Y.; Sun, J. Moisture Sources and Transport for Extreme Precipitation over Henan in July 2021. Geophys. Res. Lett. 2022, 49, 2021GL097446. [Google Scholar] [CrossRef]
  24. Yin, J.F.; Gu, H.D.; Liang, X.D. A possible dynamic mechanism for rapid production of the extreme hourly rainfall in Zhengzhou City on 20 July 2021. J. Meteor. Res. 2022, 36, 6–25. [Google Scholar] [CrossRef]
  25. Lorenz, E.N. Atmospheric Predictability as Revealed by Naturally Occurring Analogues. J. Atmos. Sci. 1969, 26, 636–646. [Google Scholar] [CrossRef]
  26. Bombardi, R.J.; Pegion, K.V.; Kinter, J.L.; Cash, B.A.; Adams, J.M. Sub-seasonal Predictability of the Onset and Demise of the Rainy Season over Monsoonal Regions. Front. Earth Sci. 2017, 5, 14. [Google Scholar] [CrossRef]
  27. Lin, H.; Mo, R.; Vitart, F.; Stan, C. Eastern Canada Flooding 2017 and its Subseasonal Predictions. Atmosphere-Ocean 2018, 57, 195–207. [Google Scholar] [CrossRef]
  28. Li, W.; Chen, J.; Li, L.; Chen, H.; Liu, B.; Xu, C.-Y.; Li, X. Evaluation and Bias Correction of S2S Precipitation for Hydrological Extremes. J. Hydrometeor. 2019, 20, 1887–1906. [Google Scholar] [CrossRef]
  29. Cowan, T.; Wheeler, M.; Alves, O.; Narsey, S.; de Burgh-Day, C.; Griffiths, M.; Jarvis, C.; Cobon, D.; Hawcroft, M. Forecasting the extreme rainfall, low temperatures, and strong winds associated with the northern Queensland floods of February 2019. Weather Clim. Extrem. 2017, 26, 100232. [Google Scholar] [CrossRef]
  30. Jie, W.H.; Vitart, F.; Wu, T.W.; Liu, X. Simulations of the Asian summer monsoon in the sub-seasonal to seasonal prediction project (S2S) database. Q. J. R. Meteorol. Soc. 2017, 143, 2282–2295. [Google Scholar] [CrossRef]
  31. Yang, S.; Zhang, Z.; Kousky, V.E.; Higgins, R.W.; Yoo, S.-H.; Liang, J.; Fan, Y. Simulations and seasonal prediction of the Asian summer monsoon in the NCEP climate forecast system. J. Clim. 2008, 21, 3755–3775. [Google Scholar] [CrossRef]
  32. Wang, B.; Lee, J.Y.; Kang, I.S.; Shukla, J.; Kig, J.-S.; Kumar, A.; Schemm, J.; Luo, J.-J.; Yamagata, T.; Park, C.-K. How accurately do coupled climate models predict the leading modes of Asian–Australian monsoon interannual variability. Clim. Dyn. 2008, 30, 605–619. [Google Scholar] [CrossRef]
  33. Lipkus, A.H. A proof of the triangle inequality for the Tanimoto distance. J. Math. Chem. 1999, 26, 263–265. [Google Scholar] [CrossRef]
  34. Liang, P.; Lin, H. Sub-seasonal prediction over East Asia during boreal summer using the ECCC monthly forecasting system. Clim. Dyn. 2018, 50, 1007–1022. [Google Scholar] [CrossRef]
  35. Liang, P.; Lin, H.; Ding, Y. Dominant modes of subseasonal variability of east asian summertime surface air temperature and their predictions. J. Clim. 2018, 31, 2729–2743. [Google Scholar] [CrossRef]
  36. Gong, Z.; Dogar, M.M.A.; Qiao, S.; Hu, P.; Feng, G. Limitations of BCC_CSM’s ability to predict summer precipitation over East Asia and the Northwestern Pacific. Atmos. Res. 2017, 193, 184–191. [Google Scholar] [CrossRef]
  37. Gong, Z.; Feng, G.; Dogar, M.M.; Huang, G. The Possible Physical Mechanism for the EAP-SR co-action. Clim. Dyn. 2018, 51, 1499–1516. [Google Scholar] [CrossRef]
  38. Qiao, S.; Chen, D.; Wang, B.; Cheung, H.; Liu, F.; Cheng, J.; Tang, S.; Zhang, Z.; Feng, G.; Dong, W. The Longest 2020 Meiyu Season Over the Past 60 Years: Subseasonal Perspective and Its Predictions. Geophys. Res. Lett. 2021, 48, e2021GL093596. [Google Scholar] [CrossRef]
  39. Zhu, Z.W.; Li, T. Statistical extended-range (10–30 day) forecast of summer rainfall anomalies over the entire China. Clim. Dyn. 2017, 48, 209–224. [Google Scholar] [CrossRef]
  40. Wu, J.; Zhang, P.; Li, L.; Ren, H.-L.; Liu, X.; Scaife, A.A.; Zhang, S. Representation and Predictability of the East Asia-Pacific Teleconnection in the Beijing Climate Center and UK Met Office Subseasonal Prediction Systems. J. Meteorol. Res. 2020, 34, 941–964. [Google Scholar] [CrossRef]
  41. Grubb, M.; Okereke, C.; Arima, J.; Bosetti, V.; Chen, Y.; Edmonds, J.A.; Gupta, S.; Koberle, A.; Kverndokk, S.; Malik, A.; et al. Climate Change 2022: Mitigation of Climate Change. 2022 Contribution of Working Group III to the Sixth Assessment Report of the Intergovernmental Panel on Climate Change; IPCC: Geneva, Switzerland, 2022. [Google Scholar]
Figure 1. Spatial distribution of rainfall in the Henan Province from 18 to 22 July 2021: (a) cumulative rainfall (unit: mm); (b) percentage of accumulated rainfall anomaly (unit: %).
Atmosphere 13 01516 g001
Figure 2. Time series of rainfall in Henan Province: (a) interannual variation of average rainfall (unit: mm) during 18–22 July from 1951 to 2021; (b) daily average rainfall of 2021 and climatic normal during 1–31 July (unit: mm); (c) daily rainfall anomalies (unit: mm) during 1–31 July 2021.
Atmosphere 13 01516 g002
Figure 3. The average and daily water vapor flux (vector, unit: 10 × 102 kg/m·s) and convergence anomalies (shading, unit: 10 × 10−5) kg/(m2·s)) during 18–22 July 2021. The purple region is Henan province. (a) The average and (bf) the daily variation during 18–22 July 2021, respectively.
Atmosphere 13 01516 g003
Figure 4. Same as Figure 3, but for the 500 hPa geopotential height (contour, unit: gpm) and vertical velocity anomalies (shading, unit: p/s). (a) The average and (bf) the daily variation during 18–22 July 2021, respectively.
Atmosphere 13 01516 g004
Figure 5. Same as Figure 3, but for the 850 hPa wind (vector, unit :   m / s ) and the relative vorticity anomalies (shading, unit :   s 1 ). (a) The average and (bf) the daily variation during 18–22 July 2021, respectively.
Atmosphere 13 01516 g005
Figure 6. Spatial distribution of accumulated rainfall (unit: mm) during 18–22 July in Henan Province predicted by the five models 20 days, 13 days, 6 days, and 3 days in advance, respectively: (a1a4) CMA model; (b1b4) ECMWF model; (c1c4) KMA model; (d1d4) NCEP model; (e1e4) UKMO model.
Atmosphere 13 01516 g006
Figure 7. The daily average rainfall of Henan from 15 to 25 July and the predictions of the five models 20 days, 13 days, 6 days, and 3 days in advance, respectively (a1a4).
Atmosphere 13 01516 g007
Figure 8. The spot distribution of predictions and observations for the cumulative rainfall during 18–22 July 2021 in Henan. Prediction (a) 20 days, (b) 13 days, (c) 6 days, and (d) 3 days in advance.
Atmosphere 13 01516 g008
Figure 9. Spatial distribution of the difference in 500 hPa geopotential height (counter, m ) and vertical velocity (shading, p / s ) between model prediction and observation during 18–22 July in Henan Province.
Atmosphere 13 01516 g009
Figure 10. Spatial distribution of the difference in average water vapor fluxes (vector, 10 × 10 2     kg / ( m · s )) and their convergence/divergence (shading, 10 × 10 5   kg / ( m 2 · s )) between model prediction and observation during 18–22 July in Henan Province.
Atmosphere 13 01516 g010
Table 1. Basic information of five selected models participating in the S2S project (https://confluence.ecmwf.int/display/S2S/Models, accessed on 4 September 2022).
Model VersionTime Range (Days)ResolutionPrediction Frequency
CMABCC-CPS-S2Sv20–60T266L562 times/week (Thursday and Sunday)
ECMWFCY47R20–46T639/319L1372 times/week (Monday and Thursday)
KMAGloSea6-GC3.20–60N216L85daily
NCEPNCEP_CFSv20–44T126L64daily
UKMOGloSea60–46T639/319 L91daily
Table 2. Net water vapor flux (unit: 10 × 107 kg/s) at four boundaries of Henan during 18–22 July 2021. Positive and negative values represent water vapor input and output, respectively.
18 July19 July20 July21 July22 July18–22 July
West−6.9−7.9−5.4−1.9−0.4−4.5
North−9.2−12.3−22.0−25.7−20.5−18.0
East14.614.421.118.120.117.7
South6.216.523.416.4−0.612.4
Net4.710.617.17.0−1.48.2
Table 3. TCs of cumulative rainfall prediction during 18–22 July in Henan.
Leading Time20 Days13 Days6 Days3 Days
CMA0.050.120.210.09
ECMWF0.010.010.340.44
KMA0.040.010.130.41
NCEP0.380.160.300.55
UKMO0.010.090.410.34
Table 4. RMSE of cumulative rainfall prediction during 18–22 July in Henan.
Leading Time20 Days13 Days6 Days3 Days
CMA242.66227.96214.35232.43
ECMWF253.18251.46188.54170.28
KMA243.52251.16224.82181.52
NCEP180.55224.16196.15153.54
UKMO251.87233.80175.50189.18
Publisher’s Note: MDPI stays neutral with regard to jurisdictional claims in published maps and institutional affiliations.

