Article

Comprehensive Evaluation of Odor-Causing VOCs from the Painting Process of the Automobile Manufacturing Industry and Its Sustainable Management

by
Vanitchaya Kultan
1,2,
Sarawut Thepanondh
1,2,*,
Nattaporn Pinthong
1,2,
Jutarat Keawboonchu
1,2 and
Mark Robson
3
1
Department of Sanitary Engineering, Faculty of Public Health, Mahidol University, Bangkok 10400, Thailand
2
Center of Excellence on Environmental Health and Toxicology (EHT), Bangkok 10400, Thailand
3
Department of Plant Biology, School of Environmental and Biological Sciences, The State University of New Jersey, New Brunswick, NJ 08901-8525, USA
*
Author to whom correspondence should be addressed.
Atmosphere 2022, 13(9), 1515; https://doi.org/10.3390/atmos13091515
Submission received: 17 August 2022 / Revised: 9 September 2022 / Accepted: 14 September 2022 / Published: 16 September 2022
(This article belongs to the Special Issue Air Pollution in Industrial Regions)

Abstract

:
Automotive manufacturing is one of the potential sources of air pollution particularly involving volatile organic compounds (VOCs). This study intensively evaluated VOC emissions and their dispersion from the industry. The measured VOCs were speciated for further evaluation of their odor threats according to the characteristics of each compound. Mathematical emission and air dispersion models were applied to assist in elaborating the source–receptor relationship allowing the determining of existing business-as-usual conditions with proposed mitigation measures to manage the pollution of the factory studied in this paper. Seven VOC species potentially caused odor problems to the surrounding community, including 1-butanol, ethyl benzene, toluene, m,p xylene, o xylene, methyl ethyl ketone, and methyl isobutyl ketone. The results from the AERMOD dispersion model revealed that the smell from these chemicals could reach up to about 800 m from the source. Analysis of mitigation measures indicated that two interesting scenarios should be considered according to their effectiveness. The concentrations of VOCs can decrease by up to 4.7, 14.0 and 24.9% from increasing the physical stack height by +1, +3 and +5 m from its existing height, respectively. Modification of the aeration tank of the wastewater treatment unit to a closed system also helped to reduce about 27.8% of emissions resulting in about a 27.6% decreased ambient air concentration. This study provided useful information on the characteristics of VOCs emitted by the automobile manufacturing industry. It also demonstrated the relevant procedures and highlights the necessity to comprehensively analyze the source–receptor relationship to evaluate the most appropriate measures in managing industrial air pollution.

1. Introduction

Air pollution is an environmental issue currently receiving attention from the government and public sectors. Every country has set specific measures and standards for controlling pollution from various activities before emitting it to the outdoors. However, emission and ambient air standards are usually designated for conventional air pollutants according to their impact on health, which may not govern the nuisance issues such as odor disturbance. Industrial sources are well recognized as some of the major emitting sources of air pollutants. Volatile organic compounds (VOCs), one type of air pollutant, can be potentially emitted in a large volume from various industrial processes including the painting and adhesion industries and the vehicle, electronic, furniture manufacturing, iron, and steel industries [1,2,3,4].
The automobile manufacturing industry has become one of the major industries in many countries. Its manufacturing processes consist of foundry and molding, powertrain, press, body-in-white, resin and paint, final assembly, and final inspection. Large amounts of different chemicals are used in this industry, particularly in the resin and painting section [5,6]. For example, the information on chemical use in the pilot factory in this study revealed that more than 95% of chemicals, amounting to about 290,000 kg monthly, are used in this process. At the painting stage, the metal vehicle bodies are washed by a solution and are prepared to enter the paint coating process using phosphating agents. Then, they are sent into the processes of spraying, starting with primer, basecoat, and clearcoat before being introduced into the final process, i.e., baking in an oven. Most of the VOC emissions come from the spraying activity, which is about 85% of the total VOC emissions [7,8]. Odor VOCs have been found to be the main compounds of the total VOCs in the automotive industry, especially for spraying activities [9]. In parts of the wastewater, painting sections are also the main sources of sewage discharges [10] and odorous VOCs [11], which are filled with organic micro pollutants like monocyclic and polycyclic aromatic hydrocarbons, which are used as solvents or additives [12]. The studied factory is situated in the community area, so a few houses are situated next to the factory fence due to space restrictions. Therefore, air pollution emissions from the source directly impacts the ambient concentration in that precinct depending on the distance from the source. Although the operations are set under a completely closed system, especially for the painting process to avoid the above-mentioned problems, emissions still occur.
This study focused on evaluating the odor emissions from the painting and resin sectors of the automobile manufacturing industry and their potential disturbances. The characteristics of the VOCs emitted from these processes were revealed through intensive quantitative and qualitative analysis. Smells can be pleasant or unpleasant. Odor is the most common problem which most businesses encounter [13,14], but quite a few ways of solving the problem exist. Odor is a complicated matter; therefore, its management is intricate as well. It would be very difficult to conduct a retrospective study to trace the source of a particular odor because the odors of each chemical seem to be similar and some odors are not only caused by factory production but also other basic activities [15]. Therefore, this study focused on an at-source analysis to predict the impact of factory operations on communities in a forward-looking perspective. This study analyzed odor diffusion characteristics and carried out simulations to reduce emission problems in addition to researching the VOC species from the industry.
The aims of the present study were to focus on the odor-causing VOCs from the painting and resin processes in terms of the odor effects impact on communities, to determine the distribution characteristics and the influence of the source, as well as to determine measures that could minimize those impacts as much as possible in order to mitigate conflicts based on predictions through internationally accepted mathematical models.

2. Materials and Methods
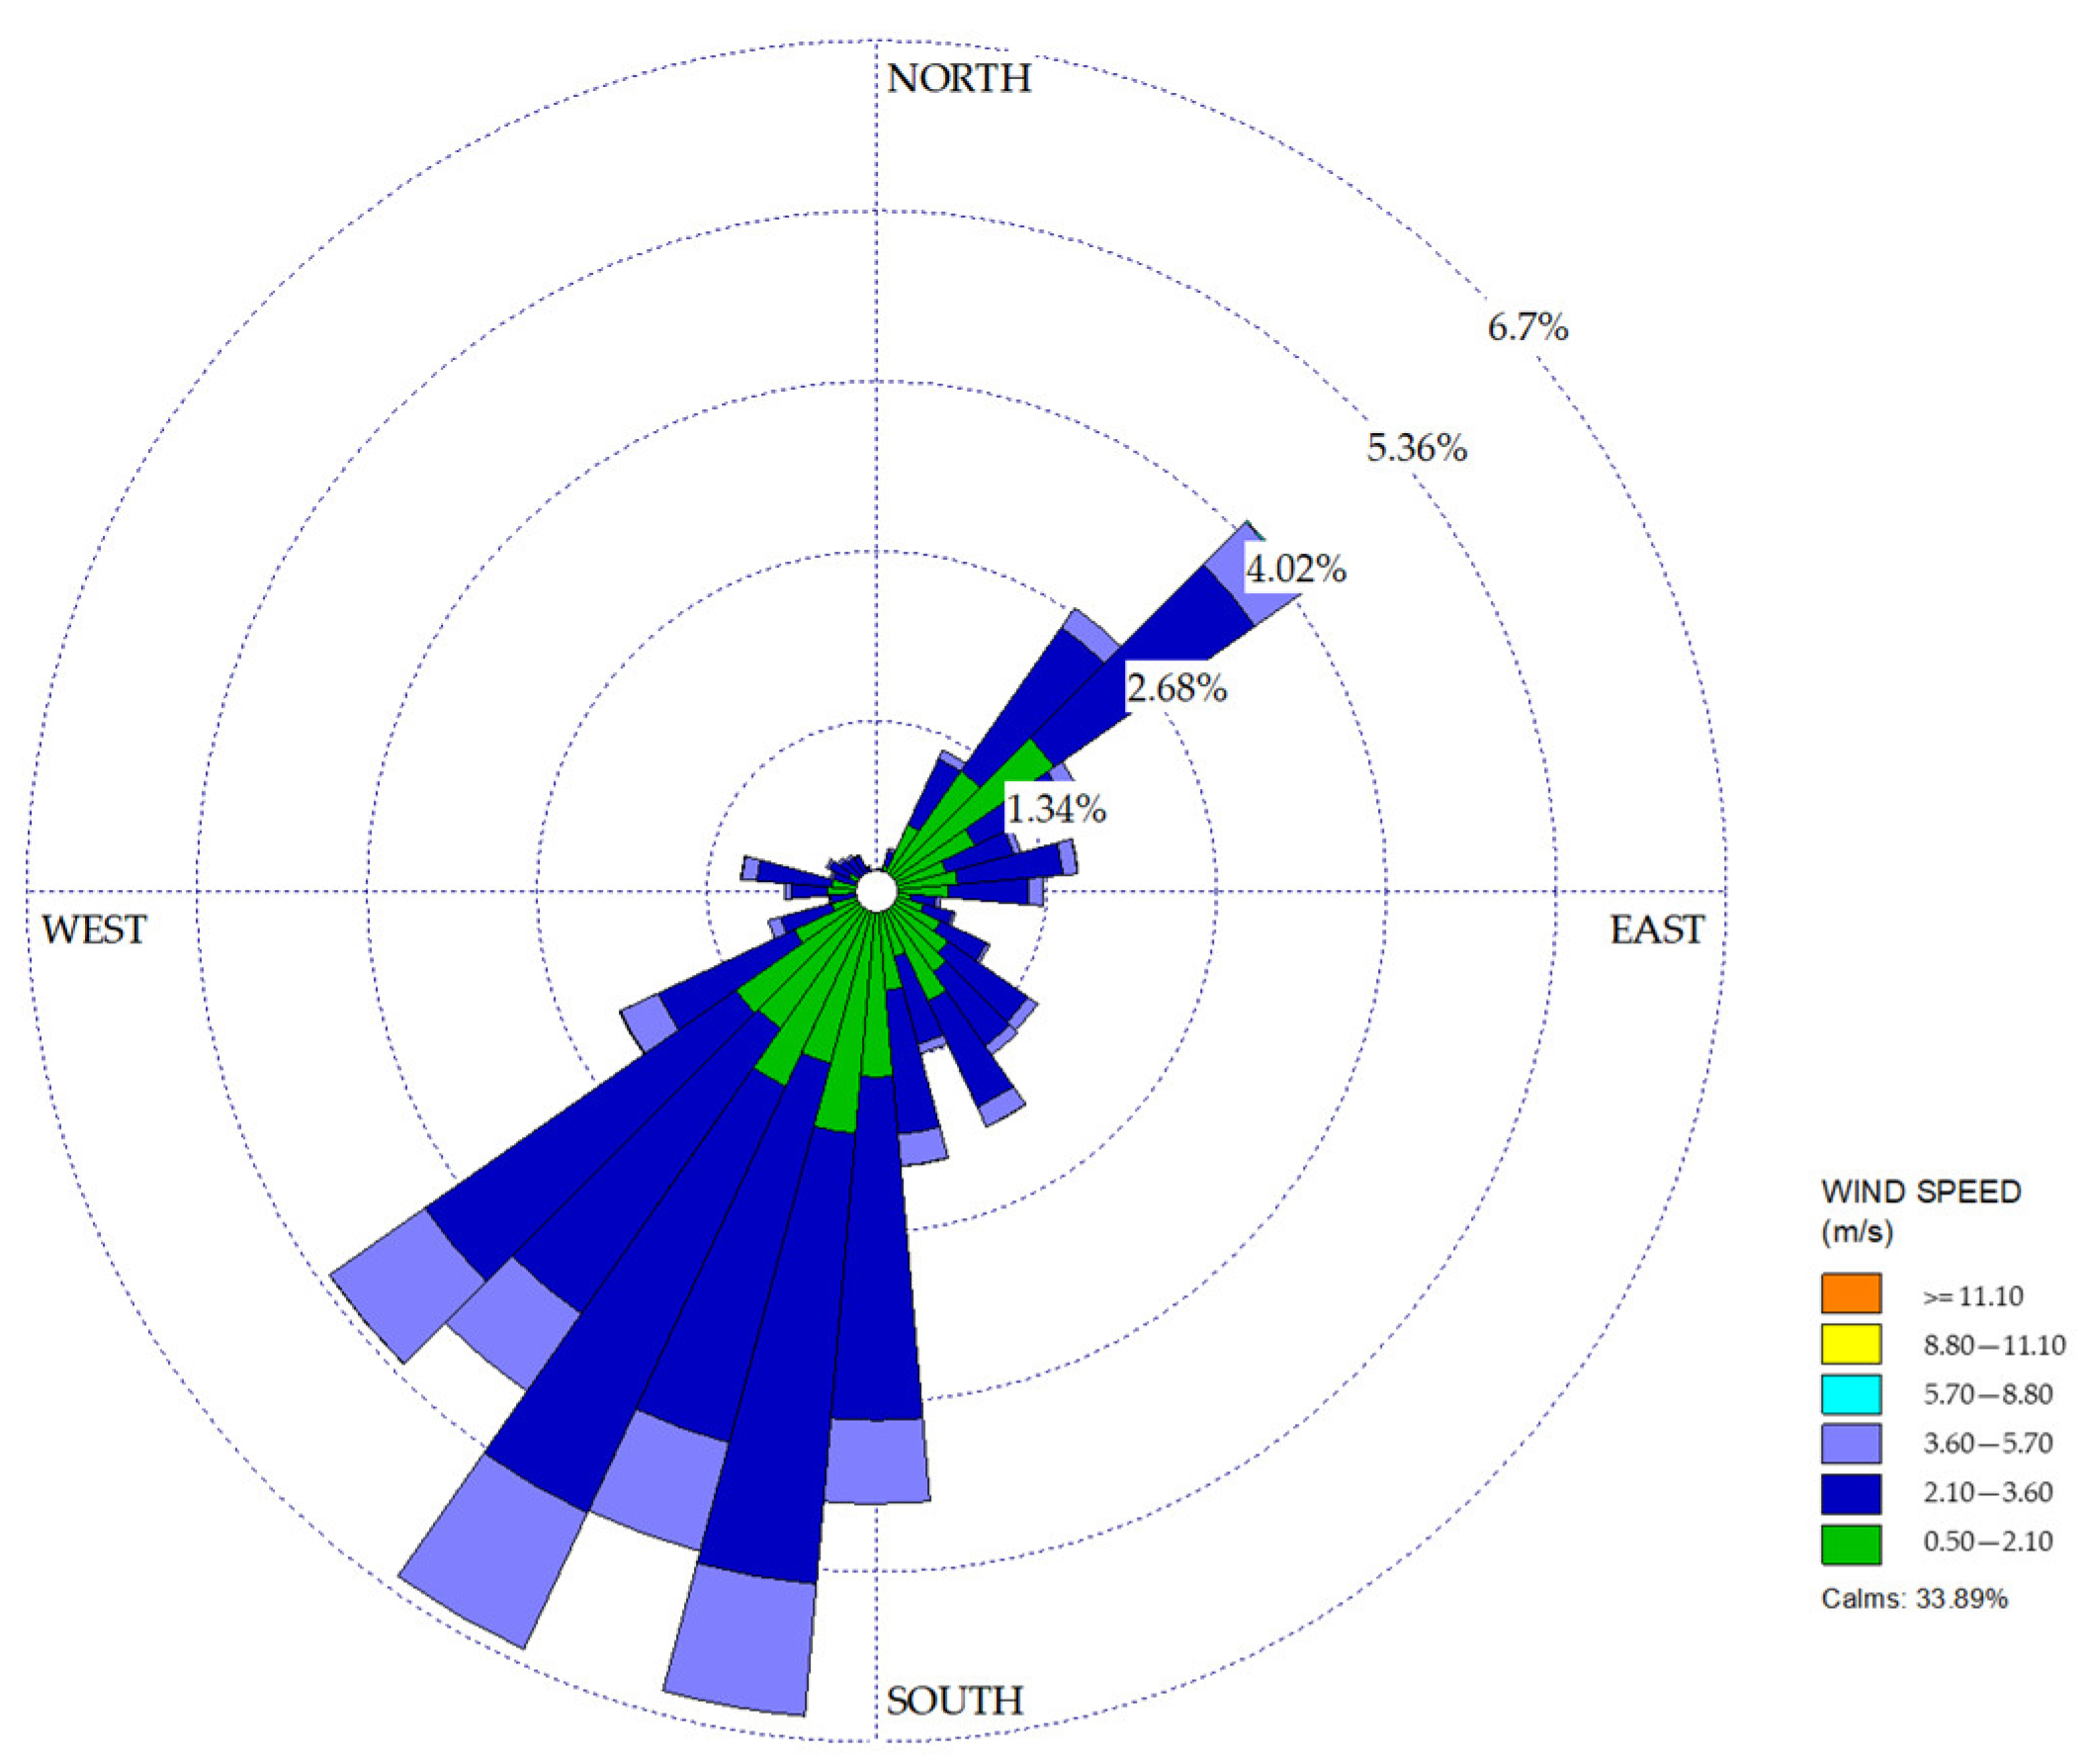
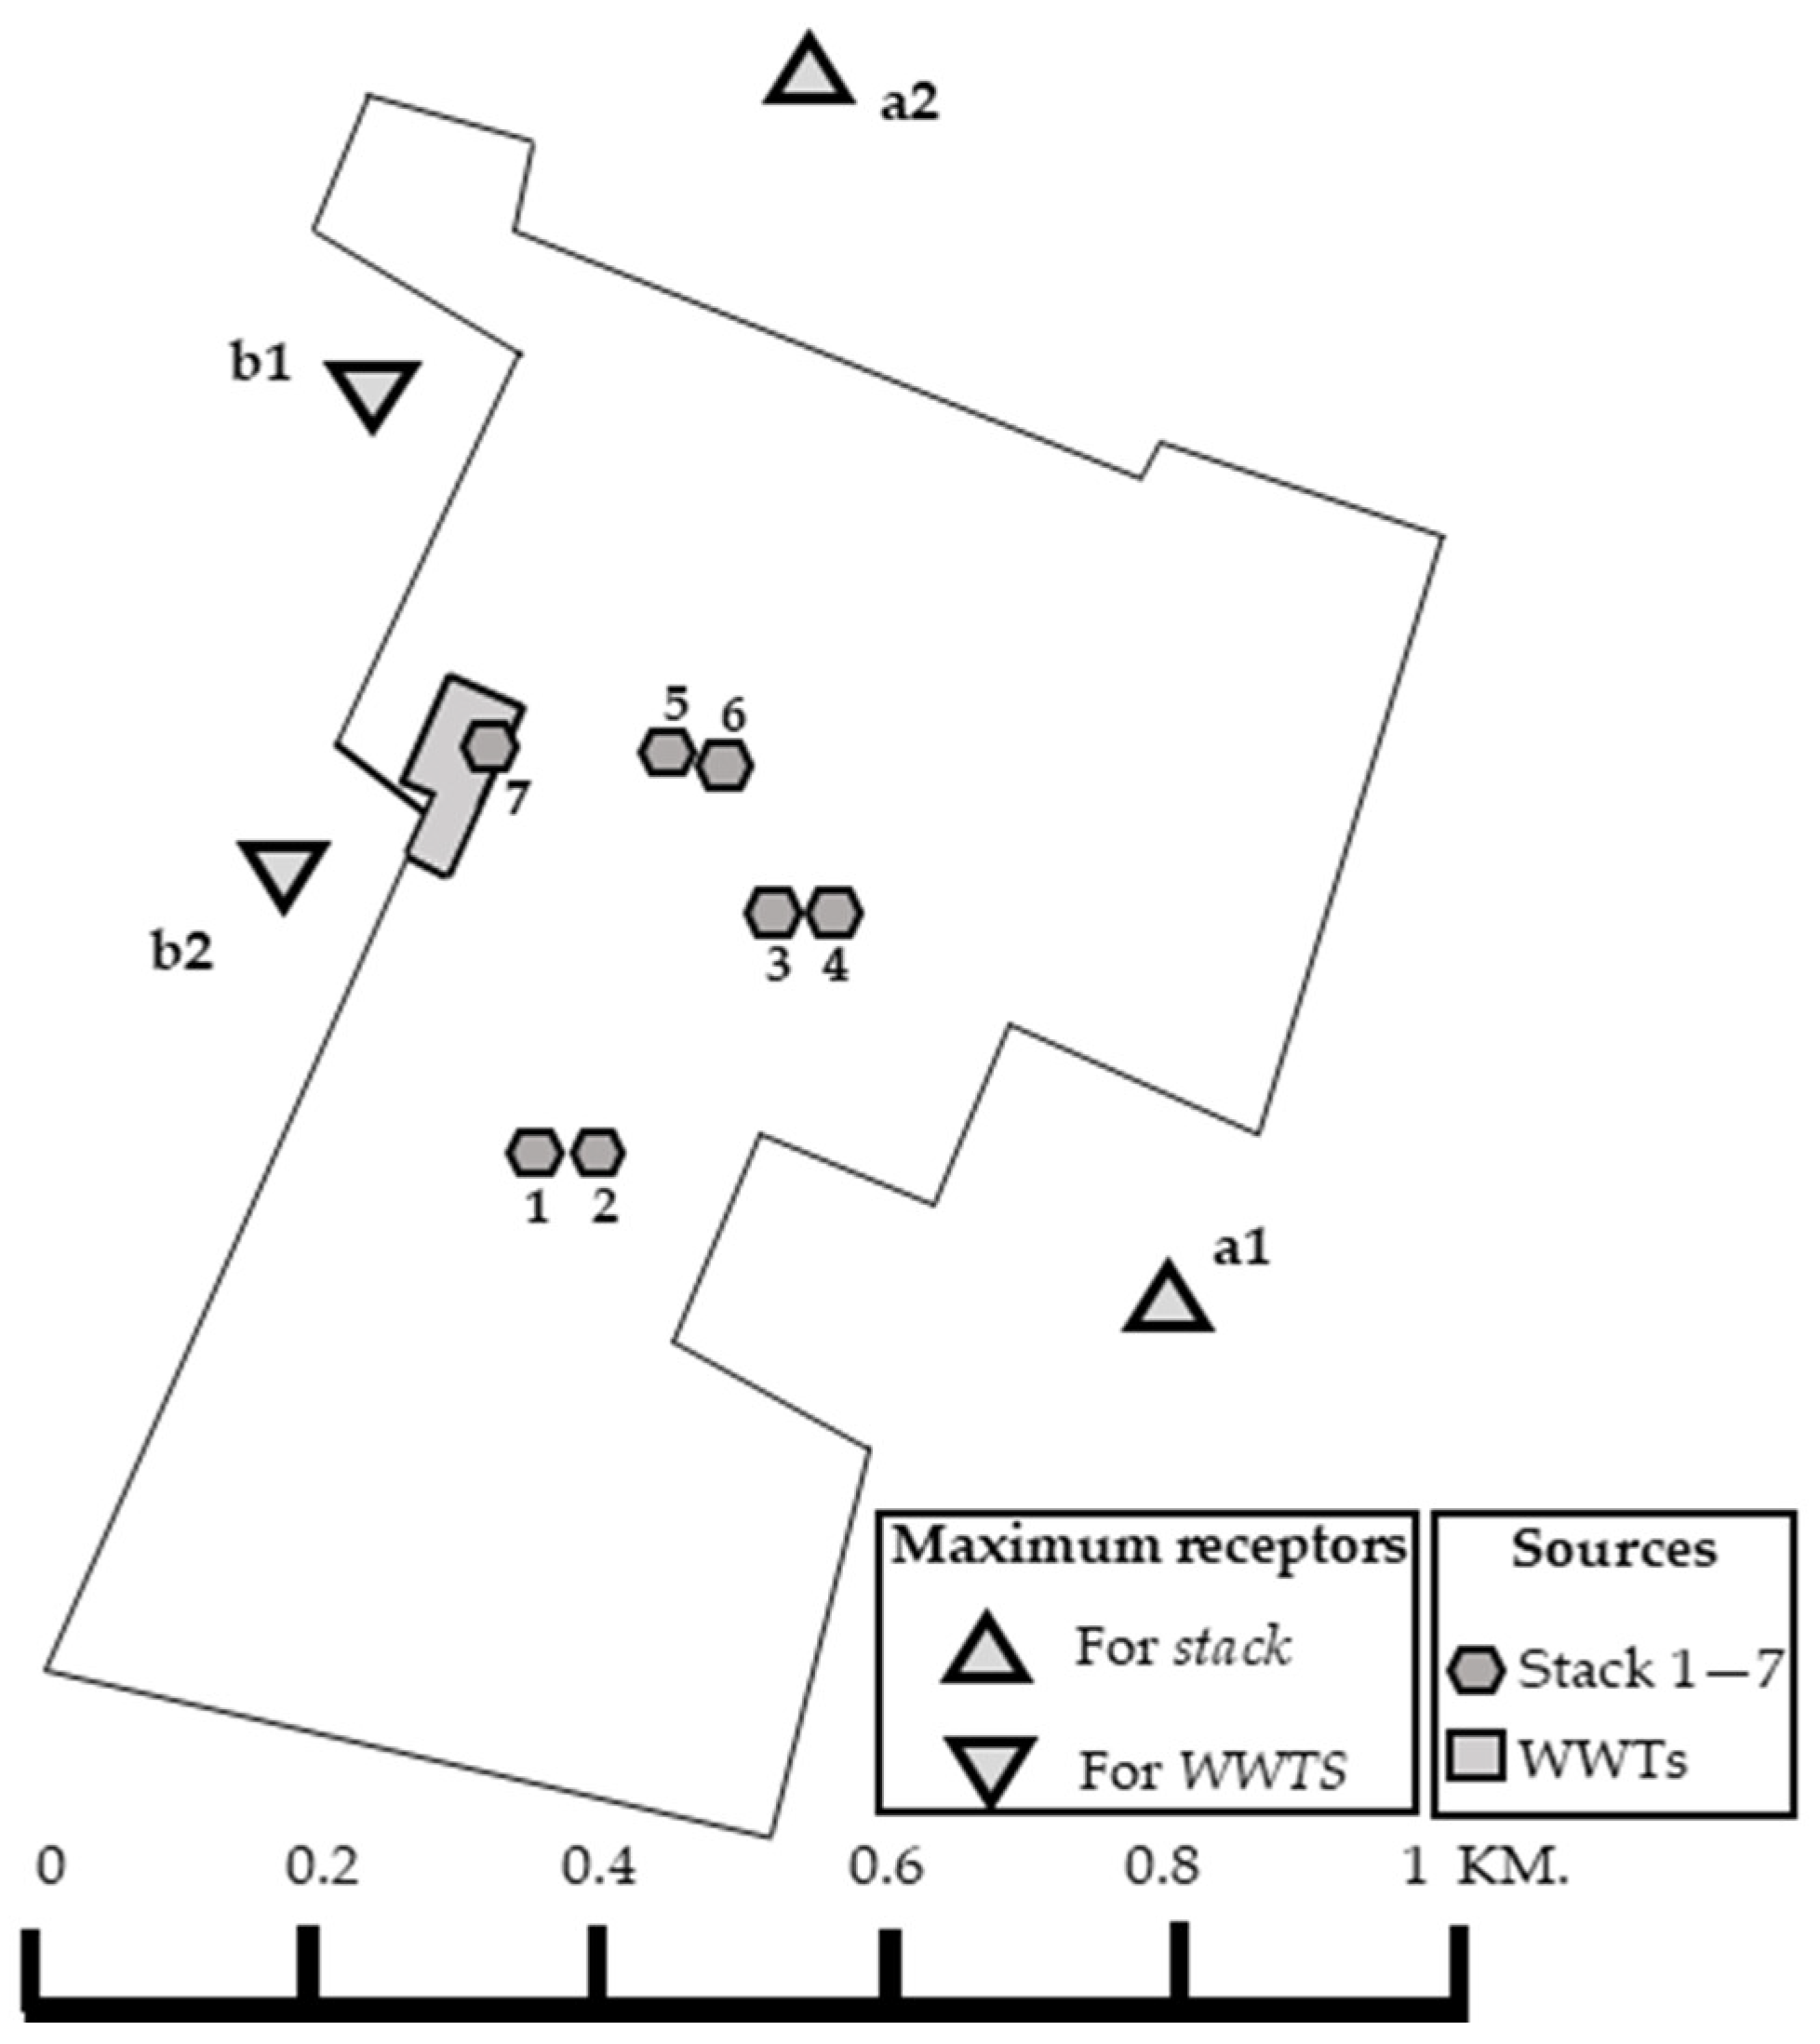
2.1. Study Area

This study was conducted by collaborating with one of the large automobile manufacturing factories in Thailand. It manufactures auto parts and assembles automobiles with a production capacity of 240,000 vehicles yearly. The amount of chemicals used in the plant is approximately 3000 tons yearly with the volume of effluent discharged through the wastewater treatment system (WWTs) outside is 7008 cubic meters each year. Although manufacturing consists of several steps, the focus of this study emphasized the painting and resin processes, where large amounts and several types of chemicals are used. Thus, this was believed to be the major potential source of emitted VOCs.

2.2. Direct Measurement and VOCs Emission Estimates

Direct measurement of VOCs from emission sources was conducted in this study to elucidate the characteristics and to quantify the amount of VOCs emitted from each potential source. The VOC samples were collected from seven main stacks and WWTs.

2.2.1. Stacks

Stack sampling was performed during the period when the full-capacity operation of the factory was achieved. Samples were extracted from each stack and passed through the entire sample interface system at a constant rate for storage in a specially organized bag (Tedlar® air bags). All sample extraction components were maintained at temperatures adequate to prevent moisture condensation within the measurement system components. Sample gas was introduced into the gas-chromatography-mass spectrometer (GCMS) via a pneumatic valve assembly to analyze VOCs. The concentrations of air emissions and emission rate were based on the reference condition of 25 degrees Celsius at 760 mmHg or 1 atm and on a dry basis. Samples from all stacks were collected on the same day to avoid the effects of different weather and factory operation conditions. Within each stack, five replicate VOC samples were collected. The physical details of the stacks are presented in Table 1. Measured concentrations were further used to calculate emission rates of individual VOCs released from each stack source.

2.2.2. Wastewater Treatment Process (WWTs)

The large-scale WWTs with a capacity of 3200 cubic meters daily was operated in an open system. Effluent from all sub-production units including domestic wastewater from the office and cafeteria zones were collected through a closed pipe before being transported to the main wastewater collection sump and continuously released to the system. A schematic diagram of WWTs is illustrated in Figure 1. Samplings of wastewater were conducted following the guidelines of the WATER 9 emission model at the raw waste tank and holding tank where wastewater entered and was stirred to recondition their properties before being treated. Sampling was conducted during the normal working hours and coincided with the stack air sampling [16]. Five samples were collected near the surface of the water at each point for replicating purposes. Samples were transferred to brown colored glass bottles to avoid any influence from light. Sulfuric acid was applied to preserve the water in an acidic form with a pH less than 2 and placed in a container with the temperature ranging from 2 to 5 degrees Celsius for assessment in an analytical laboratory. Collected samples were analyzed using the Purge and Trap Capillary-Column Gas-Chromatographic/Mass Spectrometric Method and Headspace based on the standard methods for examining water and wastewater, namely APHA, AWWA, WEF, Edition 23rd 2017 [17] and United States Environmental Protection Agency (USEPA) method, respectively.
Measured concentrations of VOCs and characteristics of wastewater were used together with design information of the WWTs as the input to determine the emission rate of VOCs from the WWTs using the WATER 9 emission model. USEPA allowed this computer program to estimate the fate of organic compounds in various wastewater treatment units [18]. The model assessed the volatile compounds discharged to the air from wastewater through different pathways based on specific chemical values and tank characteristics [18,19,20]. In this study, unit types that were drawn in the model were considered based on the unit characteristics corresponding to the actual operation of the system as shown in Table 2. From the above, the scope and planned-view sampling location of the factory are shown in Figure 2.

2.2.3. Quality Assurance and Quality Control (QA/QC)

For the stacks, samples collected in 1-L Tedlar bags were placed at room temperature out of direct sunlight and transported to a laboratory with the valve closed. The samples were analyzed within 12 h. Nitrogen was used for the preparation of blanks, dilution, and purging of sample bags. The calibration range had an RSD less than 30% and a correlation coefficient of linear regression greater than 0.95 for each VOC. Method detection limits (MDL) were determined for each compound in the range of 0.03 to 0.25 ug/m3. For WWTs, samples collected along with field blanks were transferred from the aqueous to the gaseous phase by bubbling an inert gas through samples contained in a purging chamber. Field blank samples were carried out in parallel with the other samples to avoid issues related to sample collection or storage. The vapor from the water sample was absorbed by the sorbent specific to that substance. After purging, each sorbent was heated and backflushed with inert gas and transferred to a GC column. The GC unit performed gas detection based on temperature discrimination. The results of the analysis with GC/MS were assigned to have a duplicate precision less than or equal to 10%, obtained from calculating the percentage difference between sample concentration and duplicate sample concentration. Percent of recovery required a value in the range of 85–115. The detection limit (LOD) had a measured concentration greater than the estimated uncertainty and was defined as three times the standard deviation of the blank values, which had a value in the range of <0.000012 to <0.6. The quantitation limit (LOQ) was obtained from the concentration of the signaling substance being 10 times the standard deviation (SD) of the blank with values in the range of <0.00004 to <2.0.

2.3. Dispersion Modeling and Source Apportionment Evaluation

Model Configuration

Dispersion of VOCs after being released from their emission sources was evaluated using the AERMOD dispersion model. The model was developed by the USEPA and has been widely used in many studies to predict ground-level concentration of air pollutants. In this study, AERMOD was configured to cover the modeling domain of 7 × 7 square kilometers with a cartesian receptor grid uniform spacing of 100 m × 100 m. Meteorological data (both upper and surface) were obtained from direct measurement of the Meteorological Department of Thailand. A measured meteorological station was located about 20 km from the study area. The hourly surface and upper air meteorological data used in AERMET covered one whole year. A wind rose diagram was created from the WRPLOT view model indicating that the predominant wind blew from a southwest to northeast direction as illustrated in Figure 3. The average wind speed was 1.48 m/s with 33.9% calm wind. Measured meteorological data were pre-processed using an AERMET processor. Topographic features of the modeling domain were constructed using the Digital Elevation Model (DEM) data through the Shuttle Radar Topography Mission information (SRTM1).

2.4. Odor Evaluation

Chemical interactions can cause different odor perceptions such as complementary, counteracting, and neutralizing reactions [21]. However, such characteristics are ambiguous. Therefore, this study investigated the potential separately for each substance, with the above reaction being ignored, similar to other studies [22,23]. AERMOD provided a 98th percentile of 1 h average concentrations at interested receptors. However, the expected odor from the factory did not cause public odor exposure for up to 1 h continuously, constituting a disturbing odor perception at intervals of about less than 10 min [24]. Therefore, a conversion was applied to find the average concentration of shorter time using the peak to mean ratio (P/M) concept [25]. This calculation was determined using Equation (1).
C p C m = ( t m t p ) u ,
where Cp is the VOCs average concentration in the shorter time integration, Cm is the 1 h average concentration of VOCs in the longer time integration, tm is the duration of the long interval (1 h), tp is the duration of the short interval (5 min), and u is the stability ratio depending on the ambient air (used 0.25 for slightly stable atmospheric stability) [26].
Calculated values were evaluated as odor pollution by applying the theoretical odor concentration equation [27] as shown in Equation (2).
C od ,   i = C i OTV i   ,
where Ci is the concentration of an individual VOCi and OTVi is the odor threshold value of the VOCi. If the C(od,i) calculated value was less than 1, then the VOCi concentration at receptors was lower than the standard. Thus, C(od,i) < 1 was negligible. The odor threshold value (OTV) of VOCs was determined from the implicated research as shown in Table 3. These were selected from compounds with relatively high concentrations in the processes or consistent with having a relatively low odor threshold [22,28].

2.5. Scenarios Analysis

2.5.1. Business-as-Usual Scenario

Business as usual refers broadly to any situation where everything is proceeding as normal operation. The dispersion was predicted from the model before whatever improvement was assigned to the baseline scenario (BAU).

2.5.2. Physical Modification

Because air pollutants emitted by stack sources do not begin to spread directly at the exit at the height of the physical stack (hs), air mass can continuously travel in the vertical direction before dispersing horizontally in a Gaussian plume model. The distance from the exit to the center of the plume is referred to as a plume rise (Δh). An increase in plume rise (Δh) is expected to produce a decrease in concentrations at ground level from the mechanical momentum or dominant momentum flux [33,34]. This study used a trial-and-error method to find appropriate measures that could reduce the problems of each target chemical odor. Therefore, the measures included in the study were divided into two main conformations classified by genesis. Stack sources were created by either reducing the shaft tip diameter or increasing the stack height to increase the velocity of the air flow emitted from the shaft and increase the chance of chemical dilution before contact with the ground, respectively. The gas exit temperature (buoyancy flux) did not have much of an effect on the lateral and vertical coordinates of the plume but presented an opportunity to affect the change in concentration within the stack itself [35] as the temperature was already low during the original operation. The in-situ wastewater plant was carried out by modifying its operation unit using emission data calculated by the WATER 9 model identifying the major VOC emission unit within the wastewater treatment system. Modification from an open to a closed system with a treatment unit equipped as well as reducing the distance of waste drop from the pipe were evaluated for its effectiveness in minimizing the problem.

3. Results and Discussion

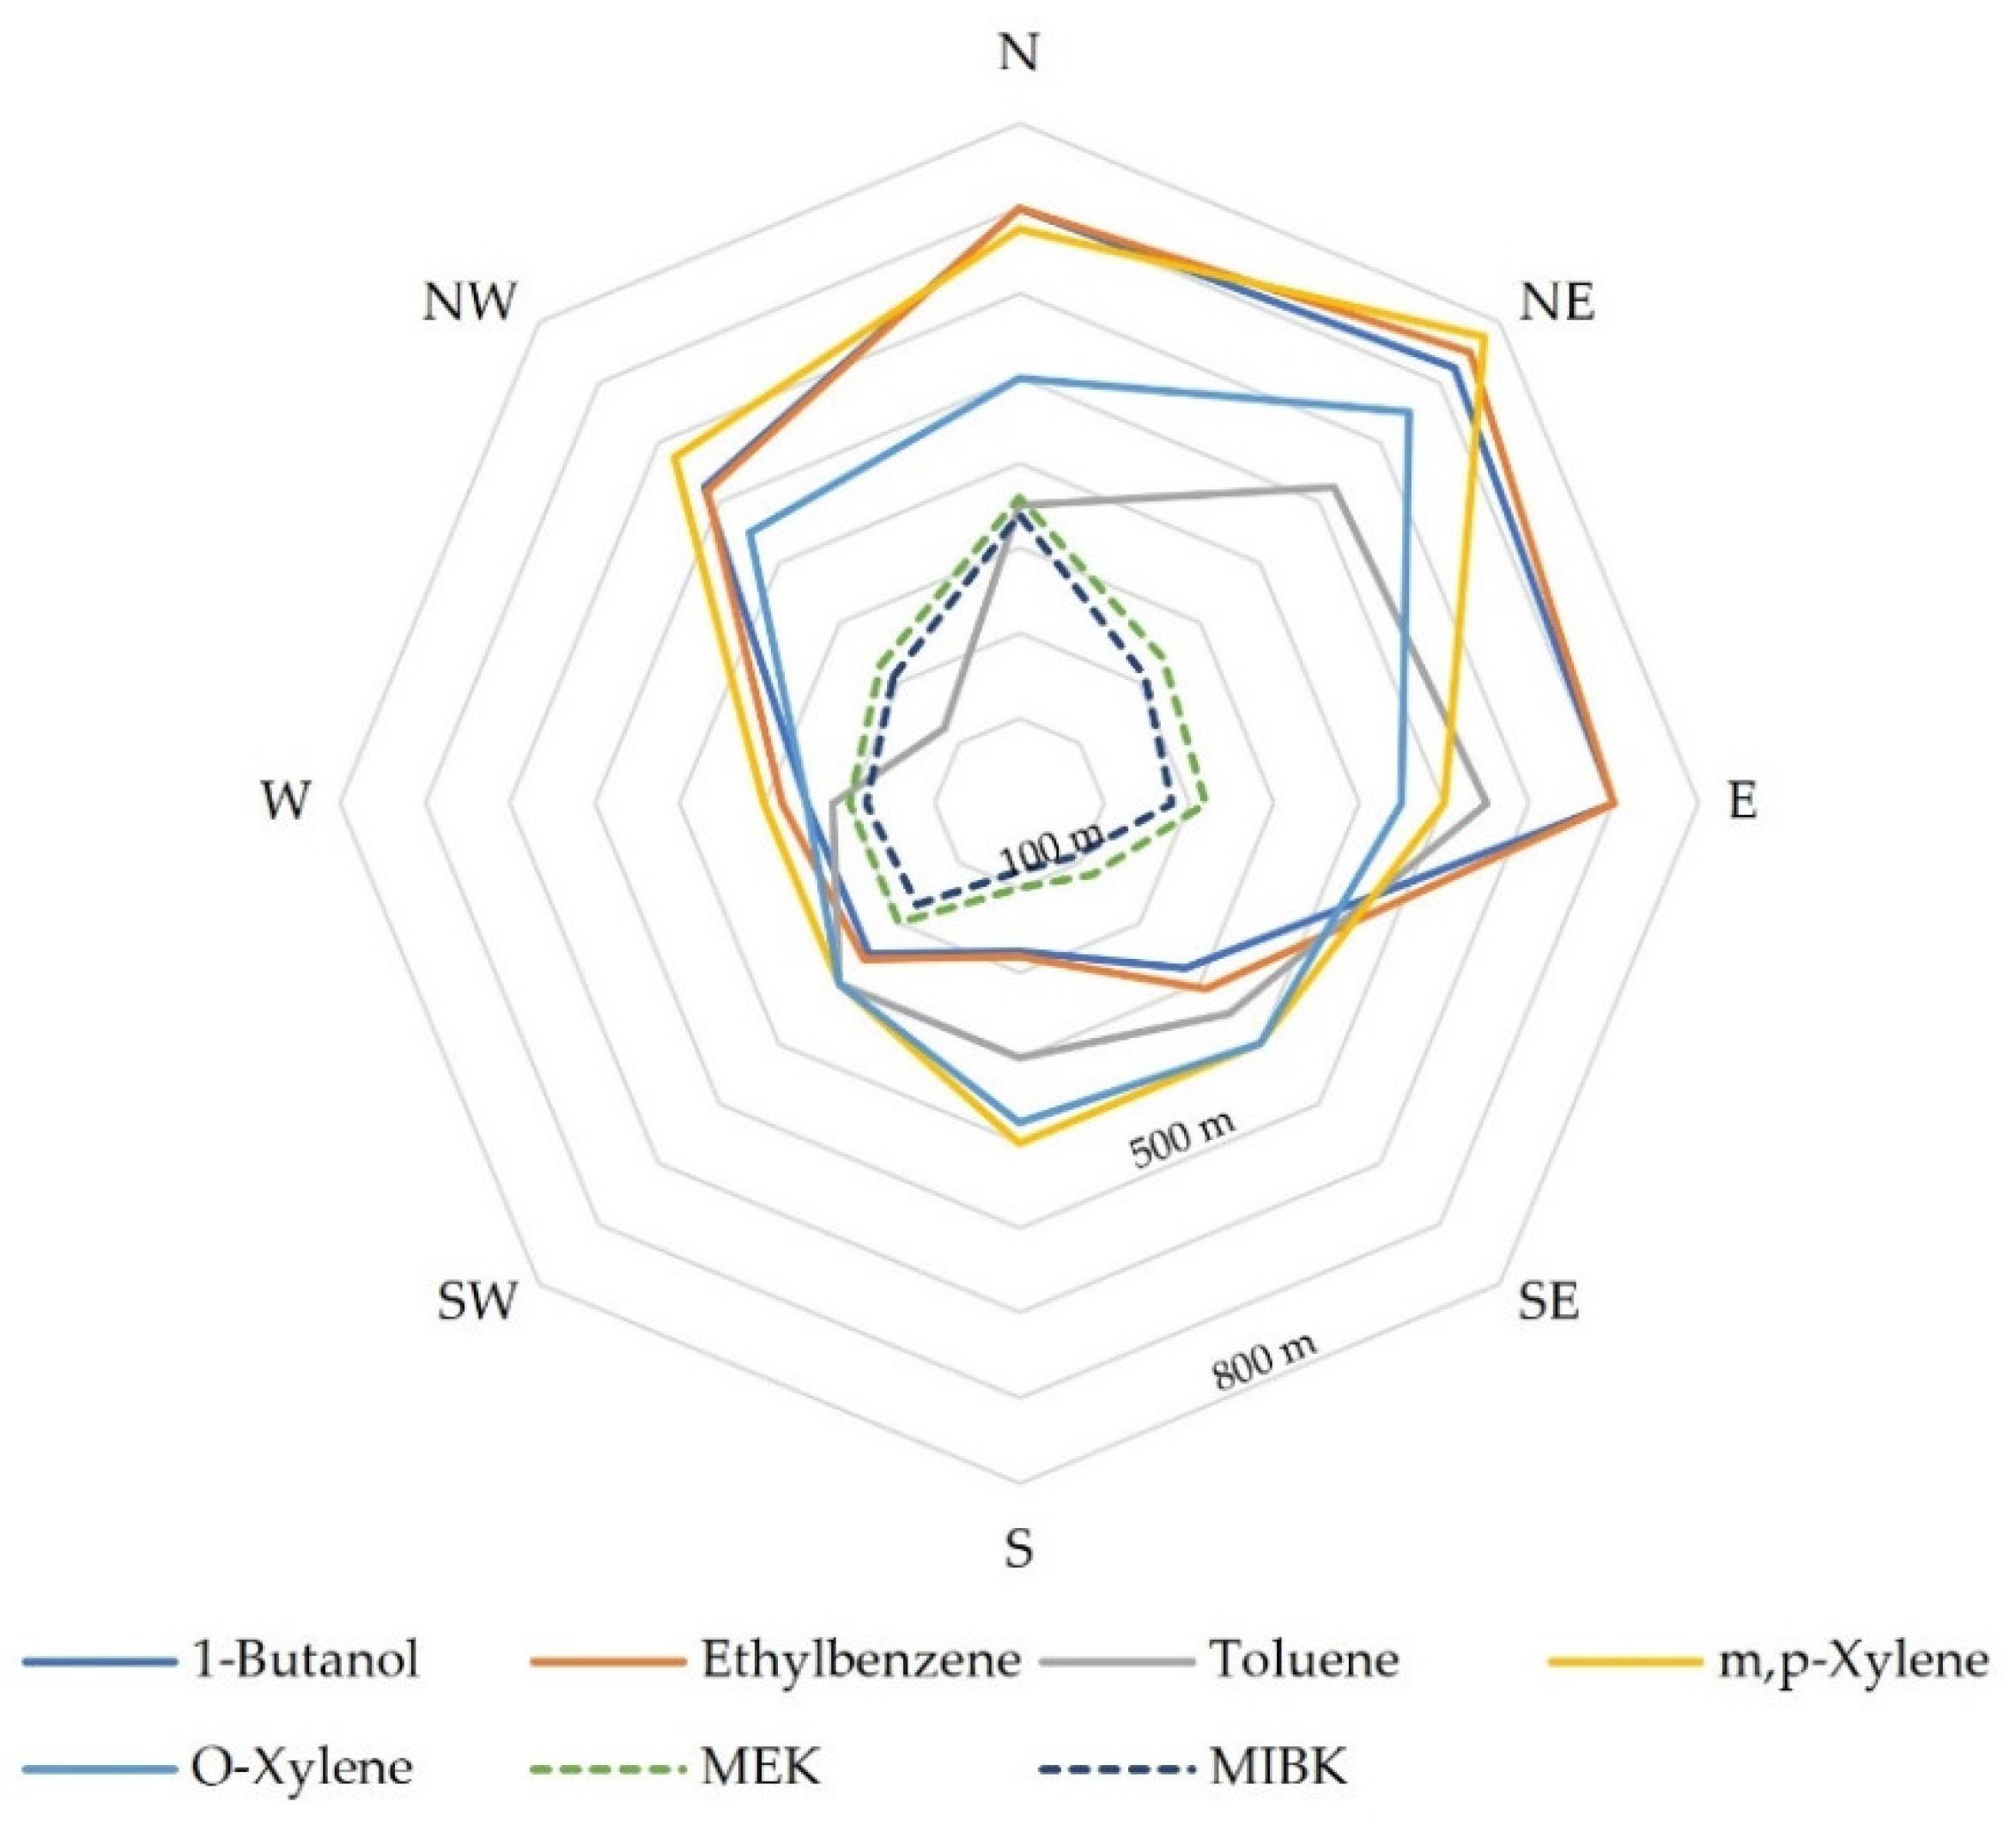
3.1. VOC Concentration under the BAU Scenario

For the stacks, 82 VOC substances were measured using the USEPA method 15. Among them, the measured concentrations of acetaldehyde (7.21–209.21 µg/m3), benzene (<0.16–9.82 µg/m3), 1-butanol (<0.15–4186.3 µg/m3), carbon disulfide (34.0–375.7 µg/m3), cyclohexane (6.4–512.4 µg/m3), dichloromethane (4.4–35.44 µg/m3), difluoro chloromethane (8.6–142.3 µg/m3), ethanol (72.4–212.5 µg/m3), ethylbenzene (28.3–7387.4 µg/m3), hexane (34.5–938.3 µg/m3), methyl ethyl ketone (26.8–305.3 µg/m3), methanol (46.8–1073.3 µg/m3), methyl isobutyl ketone (11.74–283.4 µg/m3), toluene (54.33–9325.3 µg/m3), 1,2,3-trimethylbenzene (10.9–84.2 µg/m3), 1,2,4-trimethylbenzene (38.8–221.9 µg/m3), m,p xylene (10.6–2200.9 µg/m3), and o xylene (4.6–943.3 µg/m3) were at concentrations higher than their OTV (Table 3).
Eighteen VOCs were found from the wastewater samples including 1,1 dichloroethene (<0.0008 mg/L), 1,1,2 trichloroethane (<0.001 mg/L), 1,2 dichloroethene trans (<0.0008 mg/L), benzene (<0.0008 mg/L), carbon tetrachloride (<0.001 mg/L), chloroethylene (<0.0006 mg/L), dichloroethane (1,2) (<0.0008 mg/L), dichloroethylene (1,2) cis (<0.0008 mg/L), ethynylbenzene (styrene) (<0.0008 mg/L), ethylbenzene (0.0015–0.0056 mg/L), methyl ethyl ketone (0.48–2.95 mg/L), methyl isobutyl ketone (1.56–1.8 mg/L), methylene chloride (<0.001 mg/L), tetrachloroethene (<0.001 mg/L), toluene (0.0013–0.0037 mg/L), trichloroethane 1,1,1, (<0.0008 mg/L) methyl chloroform (<0.0008 mg/L), trichloroethylene (<0.0007 mg/L), and xylene (0.0016–0.0068 mg/L).
An overview of the factory operations, which focused on components, activities, and energy consumption, described the paint sector as being responsible for the maximum ventilation in the manufacturing process [36]. Those detected VOCs comprised the common raw materials used for painting activity and most are used as a solvent for mixing and various color spraying activities [6]. Several researchers have reported that the substances emitted by paint spray booths are in the monoaromatic group (35% on average), such as benzene, toluene, xylene, styrene, ethylbenzene, 1,2,3 trimethyl benzene, 1,2,4 trimethyl benzene, m,p isopropyltoluene, etc., and oxygenated VOCs (65% on average), such as n-butanol, isobutanol, MIBK, MEK, ethylacetate, butylacetate, etc., [37,38,39]. Paint mixes contain many chemicals, and these solvents have high volatile properties. This painting activity involves immersing the entire structure in the coloring solution, meaning water is used in the production. Chemical determinations in wastewater from this part are often identified as solvent groups including toluene, n-butanol, methylethyl ketone (MEK), and butyl cellosolve, such as Methyl Isobutyl Ketone (MIBK) [40]. The water from this section becomes wastewater from the production process in large quantities. The additional coating spraying activity using compressed air is favorable for the release of these compounds in a closed building and is vented through such stacks [41].

3.2. Odor Library

The substances which potentially cause odor pollution were classified using the calculated results from Equation (1) and were compared with the OTV given in Table 3. A Cod less than 1 was interpreted as negligible. Substances in which Cod was greater than 1 were defined as moderate- (Cod 1.00–1.09) or high-ranking (high and outstanding concentrations; Cod > 1.10). In this study, the maximum ground-level concentration for all the substances spread along the dominant wind directions including the north, southeast, west, and northwest directions. However, the concentration projections by the model showed that the peak concentrations due to the stacks were at points a1 and a2, whereas the peak concentrations generated by the WWTs appeared in points b1 and b2. Therefore, four receptor points were set for the odor evaluation as shown in Figure 4. The maximum receptor groups a (a1 and a2) and b (b1 and b2) were set as the target receptors to study the effects of the stacks and WWTs, respectively. Seven substances exhibited a Cod value > 1 including 1-butanol, toluene, ethyl benzene, m,p xylene, and o xylene at receptors a1 and a2. In addition, at b2 and b2, methyl ethyl ketone and methyl isobutyl ketone were calculated in a range between 1.03 to 1.06. The results are summarized in Table 3.
A pollution map of the individual substances having a concentration above their odor threshold was evaluated to illustrate the odor impact area from the emitting sources (Figure 5). The smell of 1-butanol, toluene, ethyl benzene, m,p xylene, and o xylene was detected up to a distance of 800 m in most of the prevailing wind directions (northeast, north, and east).
However, for the MEK and MIBK substances, the WWTs was the major emitting source, having a displacement of diffusion close to the source compared with those chemicals from the stacks. The second group was distributed in a circular motion around the source except for the south (S) direction because this zone revealed very low wind speeds and frequencies. When using this group of substances as a representative of the water treatment system, it could conceivably indicate that the farthest distance for smelling the VOCs was approximately 350 m from the center in any direction with a wind speed of 0.5 m/s onwards. This information was very useful in determining the use of the space to avoid any odor disturbance and complaints.

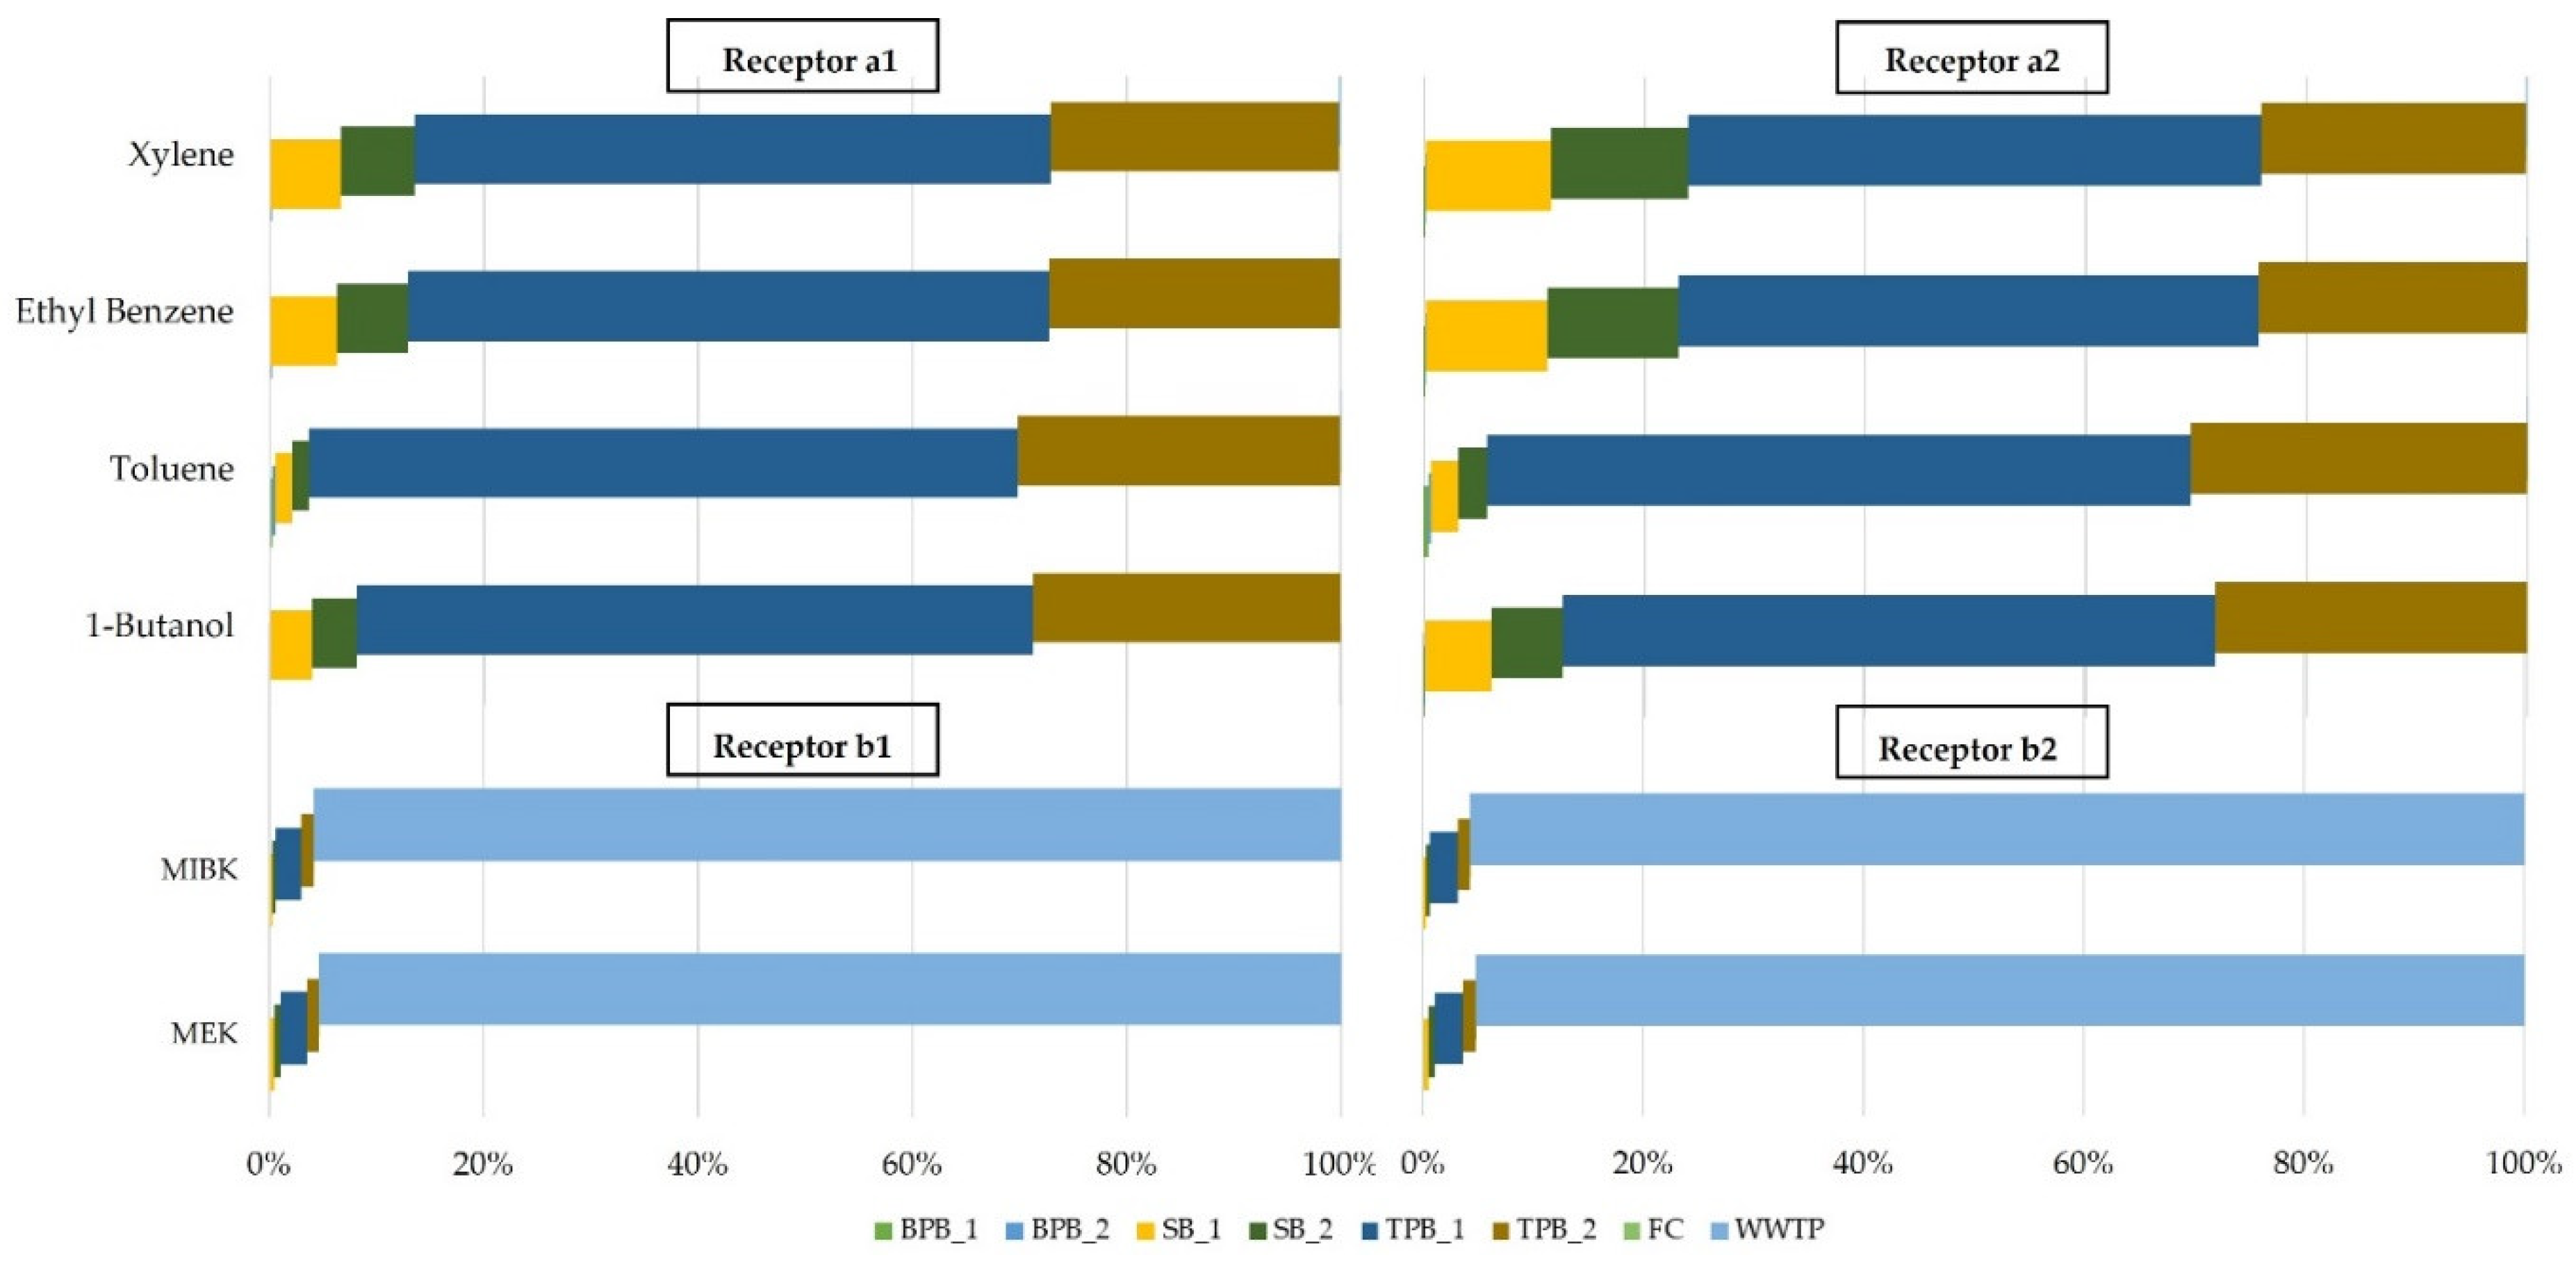
3.3. Source Contribution

The ground concentrations were analyzed to determine the major odor-contributing source using a reverse-ratio method based on modeled data from each source. The results revealed that the maximum ground level concentrations of 1-butanol, toluene, ethyl benzene, m,p xylene, and o xylene, found at points a1 and a2, greatly originated from TPB_1 and TPB_2, which were the emission stacks from a room with a pond for plating and painting activities. The paint line had an exhaust stream due to the magnitude of exhaust volume circulating in the paint spray booth. These two major stacks consisted of activities involving the high-volume spray booth at high temperatures and were very concentrated for top coating [42]. As for MEK and MIBK, the high concentrations were mostly from contributions from the WWTs (about 95.2 to 95.9%) as shown in Figure 6.
An intensive evaluation was carried out for each unit of the WWTs to elaborate the major odor-contributing unit. The results (Table S1) indicated that MEK concentrations were mainly contributed to by the raw waste tank (30.4%) followed by the pH adjustment (16.7%), reaction (14.2%), flocculation (12.1%), and holding tanks (5.8%). As for MIBK, the contribution of each emitter to the ground level concentration from the raw waste, pH adjustment, reaction, flocculation, and holding tanks were about 34.2, 30.0, 12.2, 5.5, and 3.4%, respectively. This is consistent with previous studies that used emission factors from WATER 9 [43,44]. The neutralization or equalization tank (primary treatment) emitted a high emission rate of VOCs as a result of the effect of the inner impeller and the concentration with a significant reduction in the quiescent water surface discharge rate of 5 g/hr [45].
This study found that there is room for improvement in reducing the emissions from the wastewater treatment of the plant by modifying the discharge pipe system. Notably, VOCs were moved away from the physical and chemical treatment areas. However, an anaerobic pond has a chance of causing air quality problems in terms of pollution and obnoxious odors. Therefore, consideration of this method should be reduced at this point [46]. In particular, volatile compounds originate from ponds containing high levels of chemical substances [47]. Those ponds indicated a high chemical wastewater receiver from the painting process and therefore emitted more VOCs than primary chemically treated wastewater collection pools supporting office wastewater such as a holding tank. Each sub-well in a WWTs is usually an open system to allow microorganisms in the wastewater to experience air [48] while on the other hand allowing them to release VOCs into the ambient air [49]. Moreover, the nature of the treatment activities also resulted in the release of VOCs into the atmosphere as agitation increased the exposure of the water to the air and to surface volatilization, especially in an open pond. [50,51,52].
The calculated results from the WATER 9 model (Table S1) indicated that RW and PA_1 were the major units contributing to the emissions from the WWTs. These emissions could be reduced by modifying these units to a closed system according to the regulations and results from other research, in which covering the basin made a huge change in the positive effects and could reach up to 90% VOC reduction [19,53]. Other measures included reducing the waste drop from pipe to the surface of the wastewater, which assists in minimizing the contact surface area and mass transfer coefficient, hence, reducing the emission rate when the liquid phase is in favorable conditions according to the Henry’s law coefficient [54,55].

3.4. Mitigation Measure Analysis

3.4.1. Physical Modification

For the stack source, we applied the concept of enhancing the dilution ability of the air by increasing the height of dispersion. Through this concept, the diameter of the emitting stacks was reduced from their original to increase the momentum flux of the plume rise [33,34,35]. Even though the stack exit velocity increased through this modification, their volumetric flow rates remained similar to those before the change. Increasing the physical stack height was also tested for its effectiveness in reducing ground level concentration. Notably, through these measures, the emission rate from the stacks was unchanged. The predicted ground level concentrations resulting from these mitigation measures as compared with the existing ones are presented in Table 4.
Modification of the physical characteristics of the WWTs was also tested to evaluate its effect on reducing the ground level concentration of VOCs. Based on the results of previous studies [56] that have investigated factors that significantly influence VOC emissions using the WATER 9 model, the main factors are the size of the water surface (effective diameter) exposed to air and the wind speed. To effectively prevent VOC emissions, the regulation issued by the Taiwan Environmental Protection Agency was to provide a sealed cover system that integrates ventilation equipment and air purification equipment [45]. The assumption of covering the RW unit and installing control equipment of at least 85% removal efficiency (SN 7) resulted in reducing the emission value by 27.8% and resulted in reducing the maximum ground level concentration by 27.6%. A related study found that VOCs emitted from open basins could be controlled and reduced by sealing using a fixed or floating roof connected to an 85% efficient air purification system. For basins where oil had been separated, 0.05% of the natural diffusion was left [45]. A study on the effect of covering the primary treatment by model simulation showed a 46–90% reduction in the VOC emission rate and was consistent with field analysis data [19]. However, a similar covering of the PA_1 unit (SN 8), which is the second source of drainage, reduced the emissions by only 6.5% and the concentration at the group b receptor by 6.4% due to a decrease in the concentration of wastewater [57,58]. Furthermore, SN 10 modification of the pipe that discharged wastewater from activities into the pond by extending the length immersed in the water to reduce air exposure and undulate surface wastewater resulted in a 0.6% and 0.9% reduction in emissions and concentrations, respectively. However, in addition to considering the change in concentration, installation costs must also be considered in practice. USEPA provides an instruction handbook, i.e., an air pollution control cost manual, that can be applied in the case of cost analysis for controlling VOC emissions [59]. The capital costs for covering neutralization basins is approximately US$ 200/m2 together with capital costs for venting and combustion by a regenerative oxidizer, 165,000 US$, and operation costs of approximately 52 US$ based on the inlet VOCs and a newly constructed 122 m3/min blower [45]. Consequently, this financial analysis may be applied in further studies.

3.4.2. Emission Reduction

To avoid these nuisance problems, we further evaluated the optimum level of emissions from the stack sources. The model was simulated to find the emission rate, which was expected to cause the predicted ambient concentration to be a level not higher than the odor threshold. Results from this sensitivity test will be useful in designing an optimum emission release and expected control efficiency of the air pollution control device. It can be seen from Table 4 that when reducing the emission rate by 10% each time at TPB_1, the concentration at group a was reduced to 6.6, 13.3, 19.9, 26.6, and 33.2%, respectively. On the other hand, identically controlling the emission rate from both TPB_1 and TPB_2 demonstrated a result not much different, namely, 9.7, 19.3, 29.6, 38.6, and 48.3%, respectively. The decreasing ground-level concentrations at the given point were characterized by a doubling of the decrease in emissions. Therefore, in terms of emission reduction implementation, the first measure was effective and should be considered as the most effective measure for stack emission reduction. The effectiveness of the several modifications can be seen in Figures S1–S5.

4. Conclusions

This study measured VOCs emission directly from the stack and wastewater treatment of the painting and resin processes in the automotive manufacturing industry, which are some of the potential sources of air pollution, particularly VOCs. Mathematical emissions and AERMOD dispersion models were applied to determine the source–receptor relationship and to propose mitigation measures for the pollution control of the factory studied in this paper. Seven VOC species potentially causing odor problems to the surrounding were categorized as 1-butanol, ethyl benzene, toluene, m,p xylene, o xylene, methyl ethyl ketone, and methyl isobutyl ketone. The AERMOD dispersion model results showed that the smell from these chemicals could reach up to about 800 m from the source. A distance of more than 50 m from the source was mainly affected from the stack sources while a distance under 50 m was mostly contributed to by the area source (WWTs). The paint-booth stack was the main source of odor-causing VOCs due to chemical washing and high-temperature top-coat spraying activities. This study suggested two mitigation measures according to their effectiveness. The VOC concentrations could be reduced by 4.7, 14.0, and 24.9% by increasing the physical stack height by +1, +3, and +5 m from its existing height, respectively. Modification of the aeration tank of wastewater treatment unit to a closed system could reduce emissions by about 27.8%, resulting in about a 27.6% decrease in the ambient air concentration. This study highlighted the characteristics of the VOCs emitted by the painting and resin processes of the automobile manufacturing industry and their source–receptor relationship, and suggested mitigating measures such as raising the stack height level and modifying the aeration tank of the WWT to control industrial odor pollution.

5. Limitations

This study characterized the odor-causing VOCs from the painting sector in the automotive manufacturing industry with direct in situ measurements and predicted their propagation using an air dispersion model. Therefore, the results of this study show the problem of odors caused directly by the painting process of the factory, although in the area there may be other VOC sources such as transportation, waste incineration, household activities, and other industrial plants.

Supplementary Materials

The following are available online at https://www.mdpi.com/article/10.3390/atmos13091515/s1, Table S1: VOC emissions from each unit of the wastewater treatment system. Figure S1: Peak concentration of each target chemical at maximum ground-level concentration (MGLC) after modification for Scenario 1–3; Figure S2: Peak concentration of each target chemical at maximum ground-level concentration (MGLC) after modification for Scenario 4–6; Figure S3: Peak concentration of each target chemical at maximum ground-level concentration (MGLC) after modification for Scenario 7–11; Figure S4: Peak concentration of each target chemical at maximum ground-level concentration (MGLC) after modification for Scenario 12–16; Figure S5: Peak concentration of each target chemical at maximum ground-level concentration (MGLC) after modification for Scenario 17–21.

Author Contributions

Conceptualization, methodology, software, validation, and writing—original draft preparation, V.K.; writing the review & editing, S.T., N.P. and J.K.; supervision, M.R. All authors have read and agreed to the published version of the manuscript.

Funding

This research was funded by Research and Researchers for Industry (RRi), The Thailand Research Fund (TRF) Ph.D. program, grant number PHD60I0008.

Institutional Review Board Statement

Not applicable.

Informed Consent Statement

Not applicable.

Data Availability Statement

Not applicable.

Acknowledgments

The authors are extremely grateful for the auto parts and manufacturing plants for their contributions to the study and to the environmental staff for their assistance in accessing information. Financial support of the study was granted by Research and Researchers for Industry (RRi), The Thailand Research Fund (TRF) Ph.D. Program (Grant No. PHD60I0008) to Vanitchaya Kultan and Sarawut Thepanondh is acknowledged. This study was supported for publication by the Faculty of Public Health, Mahidol University, Thailand.

Conflicts of Interest

The authors declare they have no conflict of interest.

References

  1. Wang, H.; Nie, L.; Li, J.; Wang, Y.; Wang, G.; Wang, J.; Hao, Z. Characterization and assessment of volatile organic compounds (VOCs) emissions from typical industries. Chin. Sci. Bull. 2013, 58, 724–730. [Google Scholar] [CrossRef]
  2. Zhang, C.; Geng, X.; Wang, H.; Zhou, L.; Wang, B. Emission factor for atmospheric ammonia from a typical municipal wastewater treatment plant in South China. Environ. Pollut. 2017, 220 (Pt B), 963–970. [Google Scholar] [CrossRef]
  3. Zhang, X.; Gao, S.; Fu, Q.; Han, D.; Chen, X.; Fu, S.; Huang, X.; Cheng, J. Impact of VOCs emission from iron and steel industry on regional O3 and PM2.5 pollutions. Environ. Sci. Pollut. Res. 2020, 27, 28853–28866. [Google Scholar] [CrossRef] [PubMed]
  4. Zhang, X.; Zhao, W.; Nie, L.; Shao, X.; Dang, H.; Zhang, W.; Wang, D. A new classification approach to enhance future VOCs emission policies: Taking solvent-consuming industry as an example. Environ. Pollut. 2021, 268, 115868. [Google Scholar] [CrossRef] [PubMed]
  5. Guven, D.; Hanhan, O.; Aksoy, E.C.; Insel, G.; Cokgor, E. Impact of paint shop decanter effluents on biological treatability of automotive industry wastewater. J. Hazard. Mater. 2017, 330, 61–67. [Google Scholar] [CrossRef] [PubMed]
  6. Onofre, A.; Godina, R.; Carvalho, H.; Catarino, I. Eco-innovation in the cleaning process: An application of dry ice blasting in automotive painting industry. J. Clean. Prod. 2020, 272, 122987. [Google Scholar] [CrossRef]
  7. Kim, B.R. VOC emissions from automotive painting and their control: A review. Environ. Eng. Res. 2011, 16, 1–9. [Google Scholar] [CrossRef]
  8. Chang, C.-T.; Lee, C.-H.; Wu, Y.-P.; Jeng, F.-T. Assessment of the strategies for reducing volatile organic compound emissions in the automotive industry in Taiwan. Resour. Conserv. Recycl. 2002, 34, 117–128. [Google Scholar] [CrossRef]
  9. Hu, R.; Liu, G.; Zhang, H.; Xue, H.; Wang, X.; Lam, P.K.S. Odor pollution due to industrial emission of volatile organic compounds: A case study in Hefei, China. J. Clean. Prod. 2020, 246, 119075. [Google Scholar] [CrossRef]
  10. Bajaj, M.; Winter, J. Biogas and biohydrogen production potential of high strength automobile industry wastewater during anaerobic degradation. J. Environ. Manag. 2013, 128, 522–529. [Google Scholar] [CrossRef]
  11. Gallego, E.; Roca, F.J.; Perales, J.F.; Sánchez, G.; Esplugas, P. Characterization and determination of the odorous charge in the indoor air of a waste treatment facility through the evaluation of volatile organic compounds (VOCs) using TD–GC/MS. Waste Manag. 2012, 32, 2469–2481. [Google Scholar] [CrossRef] [PubMed]
  12. Nair, K.S.; Manu, B.; Azhoni, A. Sustainable treatment of paint industry wastewater: Current techniques and challenges. J. Environ. Manag. 2021, 296, 113105. [Google Scholar] [CrossRef] [PubMed]
  13. Huang, D.; Guo, H. Dispersion modeling of odour, gases, and respirable dust using AERMOD for poultry and dairy barns in the Canadian Prairies. Sci. Total Environ. 2019, 690, 620–628. [Google Scholar] [CrossRef] [PubMed]
  14. Wang, Y.C.; Han, M.F.; Jia, T.P.; Hu, X.R.; Zhu, H.Q.; Tong, Z.; Lin, Y.T.; Wang, C.; Liu, D.Z.; Peng, Y.Z.; et al. Emissions, measurement, and control of odor in livestock farms: A review. Sci. Total Environ. 2021, 776, 145735. [Google Scholar] [CrossRef]
  15. Rincón, C.A.; De Guardia, A.; Couvert, A.; Wolbert, D.; Le Roux, S.; Soutrel, I.; Nunes, G. Odor concentration (OC) prediction based on odor activity values (OAVs) during composting of solid wastes and digestates. Atmos. Environ. 2019, 201, 1–12. [Google Scholar] [CrossRef]
  16. EPA. User’s Guide for WATER9 Software; US Environmental Protection Agency, Office of Air Quality Planning and Standards: Washington, DC, USA, 2001. Available online: https://www3.epa.gov/ttnchie1/software/water/water9_3/index.html (accessed on 21 November 2021).
  17. Rice, E.W.; Baird, R.B.; Eaton, A.D. Standard Methods for the Examination of Water and Wastewater, 23rd ed.; American Public Health Association: Washington, DC, USA; American Water Works Association: Denver, CO, USA; Water Environment Federation: Alexandria, VA, USA, 2017; Available online: https://engage.awwa.org/PersonifyEbusiness/Store/Product-Details/productId/65266295 (accessed on 30 October 2021).
  18. EPA. Air Emissions Models for Waste and Wastewater; Office of Air Quality Planning and Standards: Research Triangle Park, NC, USA, 1994. Available online: https://www3.epa.gov/ttnchie1/software/water/air_emission_models_waste_wastewater.pdf (accessed on 20 November 2021).
  19. Cheng, W.-H.; Chou, M.-S. VOC Emission Characteristics of Petrochemical Wastewater Treatment Facilities in Southern Taiwan. J. Environ. Sci. Health Part A 2003, 38, 2521–2535. [Google Scholar] [CrossRef]
  20. Sheikh, S.; Sandy, T.; Irani, M.; Jenkins, K. Estimating wastewater treatment emissions using epa’s water9 modeling software. Proc. Water Environ. Fed. 2004, 2004, 125–130. [Google Scholar] [CrossRef]
  21. Szulczynski, B.; Arminski, K.; Namiesnik, J.; Gebicki, J. Determination of Odour Interactions in Gaseous Mixtures Using Electronic Nose Methods with Artificial Neural Networks. Sensors 2018, 18, 519. [Google Scholar] [CrossRef]
  22. Nie, E.; Zheng, G.; Ma, C. Characterization of odorous pollution and health risk assessment of volatile organic compound emissions in swine facilities. Atmos. Environ. 2020, 223, 117233. [Google Scholar] [CrossRef]
  23. Wu, C.; Liu, J.; Zhao, P.; Li, W.; Yan, L.; Piringer, M.; Schauberger, G. Evaluation of the chemical composition and correlation between the calculated and measured odour concentration of odorous gases from a landfill in Beijing, China. Atmos. Environ. 2017, 164, 337–347. [Google Scholar] [CrossRef]
  24. Schauberger, G.; Piringer, M.; Schmitzer, R.; Kamp, M.; Sowa, A.; Koch, R.; Eckhof, W.; Grimm, E.; Kypke, J.; Hartung, E. Concept to assess the human perception of odour by estimating short-time peak concentrations from one-hour mean values. Reply to a comment by Janicke et al. Atmos. Environ. 2012, 54, 624–628. [Google Scholar] [CrossRef]
  25. Motalebi Damuchali, A.; Guo, H. Developing an odour emission factor for an oil refinery plant using reverse dispersion modeling. Atmos. Environ. 2020, 222, 117167. [Google Scholar] [CrossRef]
  26. Han, Z.; Li, R.; Shen, H.; Qi, F.; Liu, B.; Shen, X.; Zhang, L.; Wang, X.; Sun, D. Emission characteristics and assessment of odors from sludge anaerobic digestion with thermal hydrolysis pretreatment in a wastewater treatment plant. Environ. Pollut. 2021, 274, 116516. [Google Scholar] [CrossRef] [PubMed]
  27. Capelli, L.; Sironi, S.; Del Rosso, R.; Céntola, P.; Il Grande, M. A comparative and critical evaluation of odour assessment methods on a landfill site. Atmos. Environ. 2008, 42, 7050–7058. [Google Scholar] [CrossRef]
  28. Sharon, S.M.; Alex, H.L.; Patrick, D.O. Odor Thresholds for Chemicals with Established Occupational Health Standards, 3rd ed.; AIHA: Falls Church, VA, USA, 2013; Available online: https://swesiaq.se/onewebmedia/Dokument/ODOR%20THRESHOLDS.pdf (accessed on 18 January 2022).
  29. Council, N.R. Acute Exposure Guideline Levels for Selected Airborne Chemicals; The National Academies Press: Washington, DC, USA, 2014; Volume 17. [Google Scholar] [CrossRef]
  30. Nielsen, E.; Ladefoged, O. Evaluation of Health Hazards by Exposure to Ethylbenzene and Proposal of a Health-Based Quality Criterion for Ambient Air; The Danish Environmental Protection Agency: Odense, Denmark, 2013; Available online: https://www2.mst.dk/Udgiv/publications/2013/08/978-87-93026-31-5.pdf (accessed on 10 January 2022).
  31. Clayton, G.D.; Clayton, F.E. Patty’s Industrial Hygiene and Toxicology: Volume 2A: Toxicology, 3rd ed.; Clayton, G.D., Clayton, F.E., Eds.; John Wiley & Sons: New York, NY, USA, 1981; Volume 2A, p. v-2878. Available online: https://hero.epa.gov/hero/index.cfm/reference/details/reference_id/2919563 (accessed on 20 February 2022).
  32. Ueno, H.; Amano, S.; Merecka, B.; Kośmider, J. Difference in the odor concentrations measured by the triangle odor bag method and dynamic olfactometry. Water Sci. Technol. J. Int. Assoc. Water Pollut. Res. 2009, 59, 1339–1342. [Google Scholar] [CrossRef] [PubMed]
  33. Essa, K.S.M.; Mubarak, F.; Elsaid, S.E.M. Effect of the plume rise and wind speed on extreme value of air pollutant concentration. Meteorol. Atmos. Phys. 2006, 93, 247–253. [Google Scholar] [CrossRef]
  34. Lateb, M.; Masson, C.; Stathopoulos, T.; Bédard, C. Effect of stack height and exhaust velocity on pollutant dispersion in the wake of a building. Atmos. Environ. 2011, 45, 5150–5163. [Google Scholar] [CrossRef]
  35. Onbaşıoǧlu, S.U. On the simulation of the plume from stacks of buildings. Build. Environ. 2001, 36, 543–559. [Google Scholar] [CrossRef]
  36. Giampieri, A.; Ling-Chin, J.; Ma, Z.; Smallbone, A.; Roskilly, A. A review of the current automotive manufacturing practice from an energy perspective. Appl. Energy 2020, 261, 114074. [Google Scholar] [CrossRef]
  37. Chen, J.; Liu, R.; Gao, Y.; Li, G.; An, T. Preferential purification of oxygenated volatile organic compounds than monoaromatics emitted from paint spray booth and risk attenuation by the integrated decontamination technique. J. Clean. Prod. 2017, 148, 268–275. [Google Scholar] [CrossRef]
  38. Mathur, A.K.; Majumder, C.B. Biofiltration and kinetic aspects of a biotrickling filter for the removal of paint solvent mixture laden air stream. J. Hazard. Mater. 2008, 152, 1027–1036. [Google Scholar] [CrossRef] [PubMed]
  39. Kim, B.R.; Kalis, E.M.; Dewulf, T.; Andrews, K.M. Henry’s Law Constants for Paint Solvents and Their Implications on Volatile Organic Compound Emissions from Automotive Painting. Water Environ. Res. 2000, 72, 65–74. [Google Scholar] [CrossRef]
  40. Kim, B.; Kalis, E.; Adams, J. Integrated emissions management for automotive painting operations. Pure Appl. Chem. 2001, 73, 1277–1280. [Google Scholar] [CrossRef]
  41. Gao, M.; Liu, W.; Wang, H.; Shao, X.; Shi, A.; An, X.; Li, G.; Nie, L. Emission factors and characteristics of volatile organic compounds (VOCs) from adhesive application in indoor decoration in China. Sci. Total Environ. 2021, 779, 145169. [Google Scholar] [CrossRef]
  42. Chen, C.P. Automotive Painting: Achieving a Technological, Economic and Environmental Balance. Master’s Thesis, Massachusetts Institute of Technology, Cambridge, MA, USA, 1995. Available online: http://hdl.handle.net/1721.1/11552 (accessed on 29 August 2022).
  43. Fatehifar, E.; Kahforoshan, D.; Khazini, L.; Soltanmohammadzadeh, J.; Sattar, H. Estimation of VOC emission from wastewater treatment unit in a petrochemical plant using emission factors. In Mathematics and Computers in Science and Engineering; WOS:000262474400041; EPA: Washington, DC, USA, 2008; pp. 87–193. [Google Scholar]
  44. Malakar, S.; Saha, P.D. Estimation of VOC Emission in Petroleum Refinery ETP and Comparative Analysis with Measured VOC Emission Rate. IJES 2015, 4, 20–29. Available online: https://www.theijes.com/papers/v4-i10/C0410020029.pdf (accessed on 29 August 2022).
  45. Cheng, W.H.; Hsu, S.K.; Chou, M.S. Volatile organic compound emissions from wastewater treatment plants in Taiwan: Legal regulations and costs of control. J. Environ. Manag. 2008, 88, 1485–1494. [Google Scholar] [CrossRef]
  46. Torrens, K.D.; Senske, B.F. Aeration Tank As a Bioscrubber for Odor and VOC Control. In Industrial Wastes (IW) Conference 2007; Water Environment Federation: Alexandria, VA, USA, 2007; pp. 683–694. Available online: https://www.researchgate.net/publication/314558553_Aeration_Tank_As_a_Bioscrubber_for_Odor_and_VOC_Control (accessed on 14 September 2022).
  47. Mai, H.N.P. Integrated Treatment of Tapioca Processing Industrial Wastewater Based on Environmental Bio-Technology. Ph.D. Thesis, Wageningen University and Research, Wageningen, The Netherlands, 2006. Available online: http://www.thailandtapiocastarch.net/download/download-th-48.pdf (accessed on 5 December 2021).
  48. Mihelcic, J.R.; Baillod, C.R.; Crittenden, J.C.; Rogers, T.N. Estimation of VOC Emissions from Wastewater Facilities by Volatilization and Stripping. Air Waste 1993, 43, 97–105. [Google Scholar] [CrossRef]
  49. Vigneswaran, S. Waste Water Treatment Technologies; EOLSS Publications: Sydney, Australia, 2009; Volume I, Available online: https://www.google.com/books?hl=th&lr=&id=HQ9xCwAAQBAJ&oi=fnd&pg=PA1&dq=Waste+Water+Treatment+Technologies-Volume+I&ots=c-9kSzLSEx&sig=hoHDdMlLRDZEvl0l8I7OzQNFIO4 (accessed on 19 November 2021).
  50. Benintendi, R. Modelling and experimental investigation of activated sludge VOCs adsorption and degradation. Process Saf. Environ. Prot. 2016, 101, 108–116. [Google Scholar] [CrossRef]
  51. Chen, W.S.; Kai, W.; Tsay, L.W.; Kai, J.J. The oxidation behavior of three different zones of welded Incoloy 800H alloy. Nucl. Eng. Des. 2014, 272, 92–98. [Google Scholar] [CrossRef]
  52. Santos, J.M.; Kreim, V.; Guillot, J.-M.; Reis, N.C., Jr.; de Sá, L.M.; Horan, N.J. An experimental determination of the H2S overall mass transfer coefficient from quiescent surfaces at wastewater treatment plants. Atmos. Environ. 2012, 60, 18–24. [Google Scholar] [CrossRef]
  53. DiMenna, R.A.; Sandeen, L.R. Determination of biological kinetic constants using respirometry for the water9 air emissions model. Proc. Water Environ. Fed. 2004, 2004, 887–896. [Google Scholar] [CrossRef]
  54. Tata, P.; Witherspoon, J.; Lue-Hing, C. VOCs Emission from Wastewater Treatment Plant; CRC Press: Boca Raton, FL, USA, 2003. [Google Scholar] [CrossRef]
  55. Chou, M.-S.; Chang, H.-Y. Bio-Oxidation of Airborne Volatile Organic Compounds in an Activated Sludge Aeration Tank. J. Air Waste Manag. Assoc. 2005, 55, 604–611. [Google Scholar] [CrossRef] [PubMed]
  56. Calvo, M.J.; Prata, A.A.; Hoinaski, L.; Santos, J.M.; Stuetz, R.M. Sensitivity analysis of the WATER9 model: Emissions of odorous compounds from passive liquid surfaces present in wastewater treatment plants. Water Sci. Technol. 2018, 2017, 903–912. [Google Scholar] [CrossRef] [PubMed]
  57. Cheng, H.-H.; Lu, I.C.; Huang, P.-W.; Wu, Y.-J.; Whang, L.-M. Biological treatment of volatile organic compounds (VOCs)-containing wastewaters from wet scrubbers in semiconductor industry. Chemosphere 2021, 282, 131137. [Google Scholar] [CrossRef] [PubMed]
  58. Corsi, R.L.; Quigley, C.J.; Melcer, H.; Bell, J. Aromatic voc emissions from a municipal sewer interceptor. Water Sci. Technol. 1995, 31, 137–145. [Google Scholar] [CrossRef]
  59. EPA. EPA Air Pollution Control Cost Manual; Air Quality Strategies and Standards Division of the Office of Air Quality Planning and Standards, US Environmental Protection Agency: Research Triangle Park, NC, USA, 2002; Volume 27711. Available online: https://www.epa.gov/economic-and-cost-analysis-air-pollution-regulations/cost-reports-and-guidance-air-pollution#cost%20manual (accessed on 29 August 2022).
Figure 1. Schematic diagram of WWTs (abbreviation of unit type is denoted in Table 2).
Atmosphere 13 01515 g001
Figure 2. Scope and planned view sampling location of the factory.
Atmosphere 13 01515 g002
Figure 3. Wind direction from WRPLOT view.
Atmosphere 13 01515 g003
Figure 4. Maximum ground-level concentration at discrete receptors for different source types (a1–a2 were the maximum receptors for stack sources and b1–b2 were the maximum receptors for WWTs source).
Atmosphere 13 01515 g004
Figure 5. Distribution patterns according to wind direction classified by odor-potential substances.
Atmosphere 13 01515 g005
Figure 6. Source identification of each substance at receptors.
Atmosphere 13 01515 g006
Table 1. Physical characteristics of sampling stacks.
Stack IDHeight (m)Diameter (m)Temp. (°C)Gas Velocity (m/s)Flow Rate (m3/s)O2 Rate, Dry Basis (%)CO2 Rate, Dry Basis (%)Absolute Stack Pressure (mmHg)
BPB_1220.88 × 0.76 13011.17.621<1.0758.3
BPB_2220.88 × 0.76 13011.07.621<1.0758.3
SB_1181.40 × 1.40 12810.119.821<1.0758.3
SB_2181.40 × 1.40 12810.319.821<1.0758.3
TPB_1223.00 × 6.10 12711.5201.321<1.0758.3
TPB_2223.00 × 6.10 12711.0201.321<1.0758.3
FC181.00 26410.18.620<1.0758.3
1 The stack was rectangular in shape. 2 The stack was circular in shape.
Table 2. Characteristics of processing units of WWTs.
StepName of UnitNumberOpen/Close SumpShapeDimension (m) *Activity
1Raw waste tank (RW)1OpenRectangular2.8 × 1.1 × 2Collection of wastewater
2pH Adjustment tank (PA1)2OpenRectangular1.2 × 1.2 × 2 and 3 × 3 × 2Mixing
3Reaction tank (RA)2OpenRectangular1.2 × 1.2 × 2 and 3 × 3 × 2Mixing
4Flocculation tank (FC)2OpenRectangular1.2 × 1.2 × 2 and 3 × 3 × 2Mixing
5Sedimentation tank (SD1)2OpenCircle8 × 3 and 12 × 3Sludge separation
6Holding tank (HD1)1OpenRectangular6.45 × 4.95 × 2.5Gather wastewater
7pH Adjustment tank (PA2)2OpenRectangular2 × 2 × 2.5 and 2 × 2 × 4Mixing
8Aeration tank (AR)2OpenRectangular15 × 14.5 × 3Air blower
9Sedimentation tank (SD2)2OpenCircle12 × 3 and 15 × 3Sludge separation
10Holding tank (HD2)2OpenRectangular4.95 × 6.45 × 2.5Collection of wastewater
11Final tank (FN)2OpenRectangular1.8 × 1.1 × 2Collection of wastewater
12Sludge thickener tank (ST)2OpenCircle8 × 3 and 4.5 × 3Collection of sludge
* Dimensions of each unit, arranged by width (m), length (m), and height (m), respectively, for rectangular tank and diameter (m) were multiplied height (m) for the circle tank. The sludge hydro press step was not included in this study due to its closed system management.
Table 3. Odor threshold of the potential VOC substances and calculated prediction results with the odor equation at top 2 maximum ground level in the domain study.
CompoundOdor CharacterOTV *P/MCodOdorant Ranking **
ppmµg/m3µg/m3
AcetaldehydeEthereal0.00152.71.060
0.931
0.39
0.34
N
DichloromethaneSweet1.241000.630
0.557
0.01
0.01
N
BenzeneAromatic, sweet, empyreumatic0.4715000.628
0.544
0.01
0.01
N
Carbon disulfideVegetable, sulfide, medicinal0.0165024.0
21.1
0.48
0.42
N
DifluorochloromethaneEthereal200,1927.08 × 1088.05
6.97
0.01
0.01
N
MethanolSimilar to ethanol3.05400019.4
19.3
0.01
0.01
N
EthanolChemical odor0.0917010.6
9.12
0.06
0.05
N
HexaneGasoline0.426150058.4
51.4
0.04
0.03
N
Methyl Ethyl KetoneSweet, sharp0.07210223
222
1.06
1.06
M
CyclohexaneSweet0.52180032.7
29.0
0.02
0.02
N
1-ButanolBanana-like, harsh, alcoholic0.086260272
235
1.05
1.00
M
Methyl Isobutyl KetoneSweet, sharp0.1400414
412
1.03
1.03
M
TolueneSour, burnt0.16600674
594
1.12
1.00
H
Ethyl BenzeneOily, solvent0.092400427
373
1.07
1.00
M
m,p-XyleneSweet, empyreumatic0.0125277.5
68.3
1.49
1.31
H
o-XyleneSweet, empyreumatic0.0125253.5
47.1
1.03
1.00
M
1,2,4-Trimethyl BenzeneAromatic0.006308.68
7.73
0.29
0.26
N
1,2,3-Trimethyl BenzeneAromatic0.006303.31
2.96
0.11
0.10
N
* Lowest values reported from studies appearing in Odor Thresholds for Chemicals with Established Health Standards of American Industrial Hygiene Association (AIHA) and research [28,29,30,31,32]. ** N: Negligible, M: Moderate, H: High.
Table 4. Summary of changes resulting from model experiments.
Scenario
(SN)
ModificationPercent ReductionAffected Receptor
PointDescriptionEmission from SourceGround Level Concentration
PhysicalA Group of Substances from Stack
No. 1TPB_1: De (reducing from existing)−0.2 mUnvaried~1.7Group a
No. 2−0.5 m~5.8
No. 3−1 m~15.7
No. 4TPB_1: Height (increasing from existing)+1 mUnvaried~4.7
No. 5+3 m~14.0
No. 6+5 m~24.9
A Group of Substances from WWTs
No. 7RWcovered~27.8~27.6Group b
No. 8PA_1covered~6.5~6.4
No. 9RW and PA_1covered~35.5~35.5
No. 10Drop from pipeDipped in water~0.6~0.9
No. 11Drop and RWDipped + covered~29.0~28.6
Emission ControlA Group of Substances from Stack Focused on Emissions
No. 12TPB_1Reduced Emission−10%~6.6Group a
No. 13−20%~13.3
No. 14−30%~19.9
No. 15−40%~26.6
No. 16−50%~33.2
No. 17TPB_1 and TPB_2Reduced Emission−10% each~9.7
No. 18−20% each~19.3
No. 19−30% each~29.6
No. 20−40% each~38.6
No. 21−50% each~48.3
Publisher’s Note: MDPI stays neutral with regard to jurisdictional claims in published maps and institutional affiliations.

