Article

Impact of PM10 Particles on the Measurement Error of SO2 Electrochemical Gas Sensor

1
The Institute of Technological Sciences, Wuhan University, Wuhan 430072, China
2
School of Power and Mechanical Engineering, Wuhan University, Wuhan 430072, China
3
Electric Power Research Institute of State Grid Shanxi Electric Power Company, Taiyuan 030029, China
*
Author to whom correspondence should be addressed.
Atmosphere 2022, 13(9), 1512; https://doi.org/10.3390/atmos13091512
Submission received: 26 July 2022 / Revised: 4 September 2022 / Accepted: 12 September 2022 / Published: 16 September 2022
(This article belongs to the Special Issue Industrial Air Pollution Control in China)

Abstract

:
To address the problems of poor measurement accuracy and long service life of SO2 electrochemical gas sensors when used in thermal power plant areas, fly ash emitted from a thermal power plant in China was used as the research object. Based on the analysis of the morphological characteristics of fly ash particles, theoretical calculations were used to obtain the settling speed of fly ash particles and the amount of fly ash deposited at different times, and then the impact of fly ash on the measurement error of a SO2 electrochemical gas sensor was investigated by experimental tests. The research results show that the particle size distribution of fly ash is 2–11 μm, the average settling speed of fly ash particles is 1.34 × 10⁻³ m/s, and the deposition amount of fly ash on the surface of the sensor inlet film is 0.95 mg per day. The deposition time of fly ash affects the sensor measurement error, and the longer the deposition time, the larger the sensor measurement error, which is due to the reduction of gas diffusion area S and diffusion coefficient K in the sensor caused by fly ash deposition. Fly ash deposition has a greater impact on the sensor when measuring low concentration gases. The higher the gas concentration, the lower the measurement error, because the higher the gas concentration, the faster the gas reaches the working electrode area and the higher the effective SO2 concentration detected in the limited response time. When using SO2 electrochemical sensors in environments with high concentrations of fly ash or dust, it is recommended to install dust-proof devices (such as air-permeable filter membranes with a pore size of less than 4 μm) and regularly clean the deposited fly ash, which can improve the accuracy of the sensor measurement and extend the service life.

1. Introduction

The total installed capacity of power generation in China in 2021 was 237,692 million kW, of which 129,678 million kW was thermal power generation capacity, accounting for 54.56% of the total installed power generation capacity [1], which shows that thermal power generation is still the main source of power generation in China. Thermal power plants mainly burn coal to generate electricity, and more than 50% of China’s coal is consumed for power generation [2]. Coal generates soot, SO2, NOx, and other harmful gases during the combustion process for power generation [3,4]. Soot is a coal combustion fly ash-based dust particle that tends to form aerosol state pollutants in the air, leading to human respiratory diseases and environmental pollution [5,6]. The greatest danger of SO2 is the formation of acid rain, which causes damage to the ecosystem such as soil, plants, and aquatic systems [7,8]. NOx has high chemical activity and produces photochemical smog, forms acid rain, destroys the ozone layer and aggravates the greenhouse effect [9], damages the human respiratory system and immune system, and threatens life safety [10]. The increase in thermal power generation has led to an increase in the emission of combustion products from thermal power plants, thus requiring the monitoring of toxic and hazardous gases such as SO2 and NOx in the atmosphere around thermal power plants.
The common types of detection sensors for SO2 gas are catalytic combustion, thermal conductivity, optical interference, and electrochemical [11]. Electrochemical sensors have the advantages of high measurement resolution, good output linearity, operational checkpoints, and low price [12,13] and are widely used in gas detection devices in various industries. Due to the large amount of soot generated by combustion emissions from thermal power plants, the electrochemical gas sensor monitoring devices installed in the thermal power plant area are prone to problems such as low measurement accuracy and short service life. In this paper, we take fly ash emitted from a coal gangue power plant in China as the research object to study the impact of fly ash PM10 particles on the measurement error of SO2 electrochemical gas sensors and make recommendations for the use and maintenance of gas monitoring devices in the area of thermal power plants.
In this paper, firstly, the morphological characteristics of fly ash particles and the particle size distribution of fly ash particles were obtained by electron microscopy scanning of fly ash samples; secondly, the aerodynamic and hydrodynamic theories were used to calculate the settling speed of fly ash particles and the amount of fly ash deposited at different times; finally, the measurement errors of SO2 electrochemical gas sensors under the conditions of fly ash PM10 particles were investigated by experimental tests.

2. Experimental Section

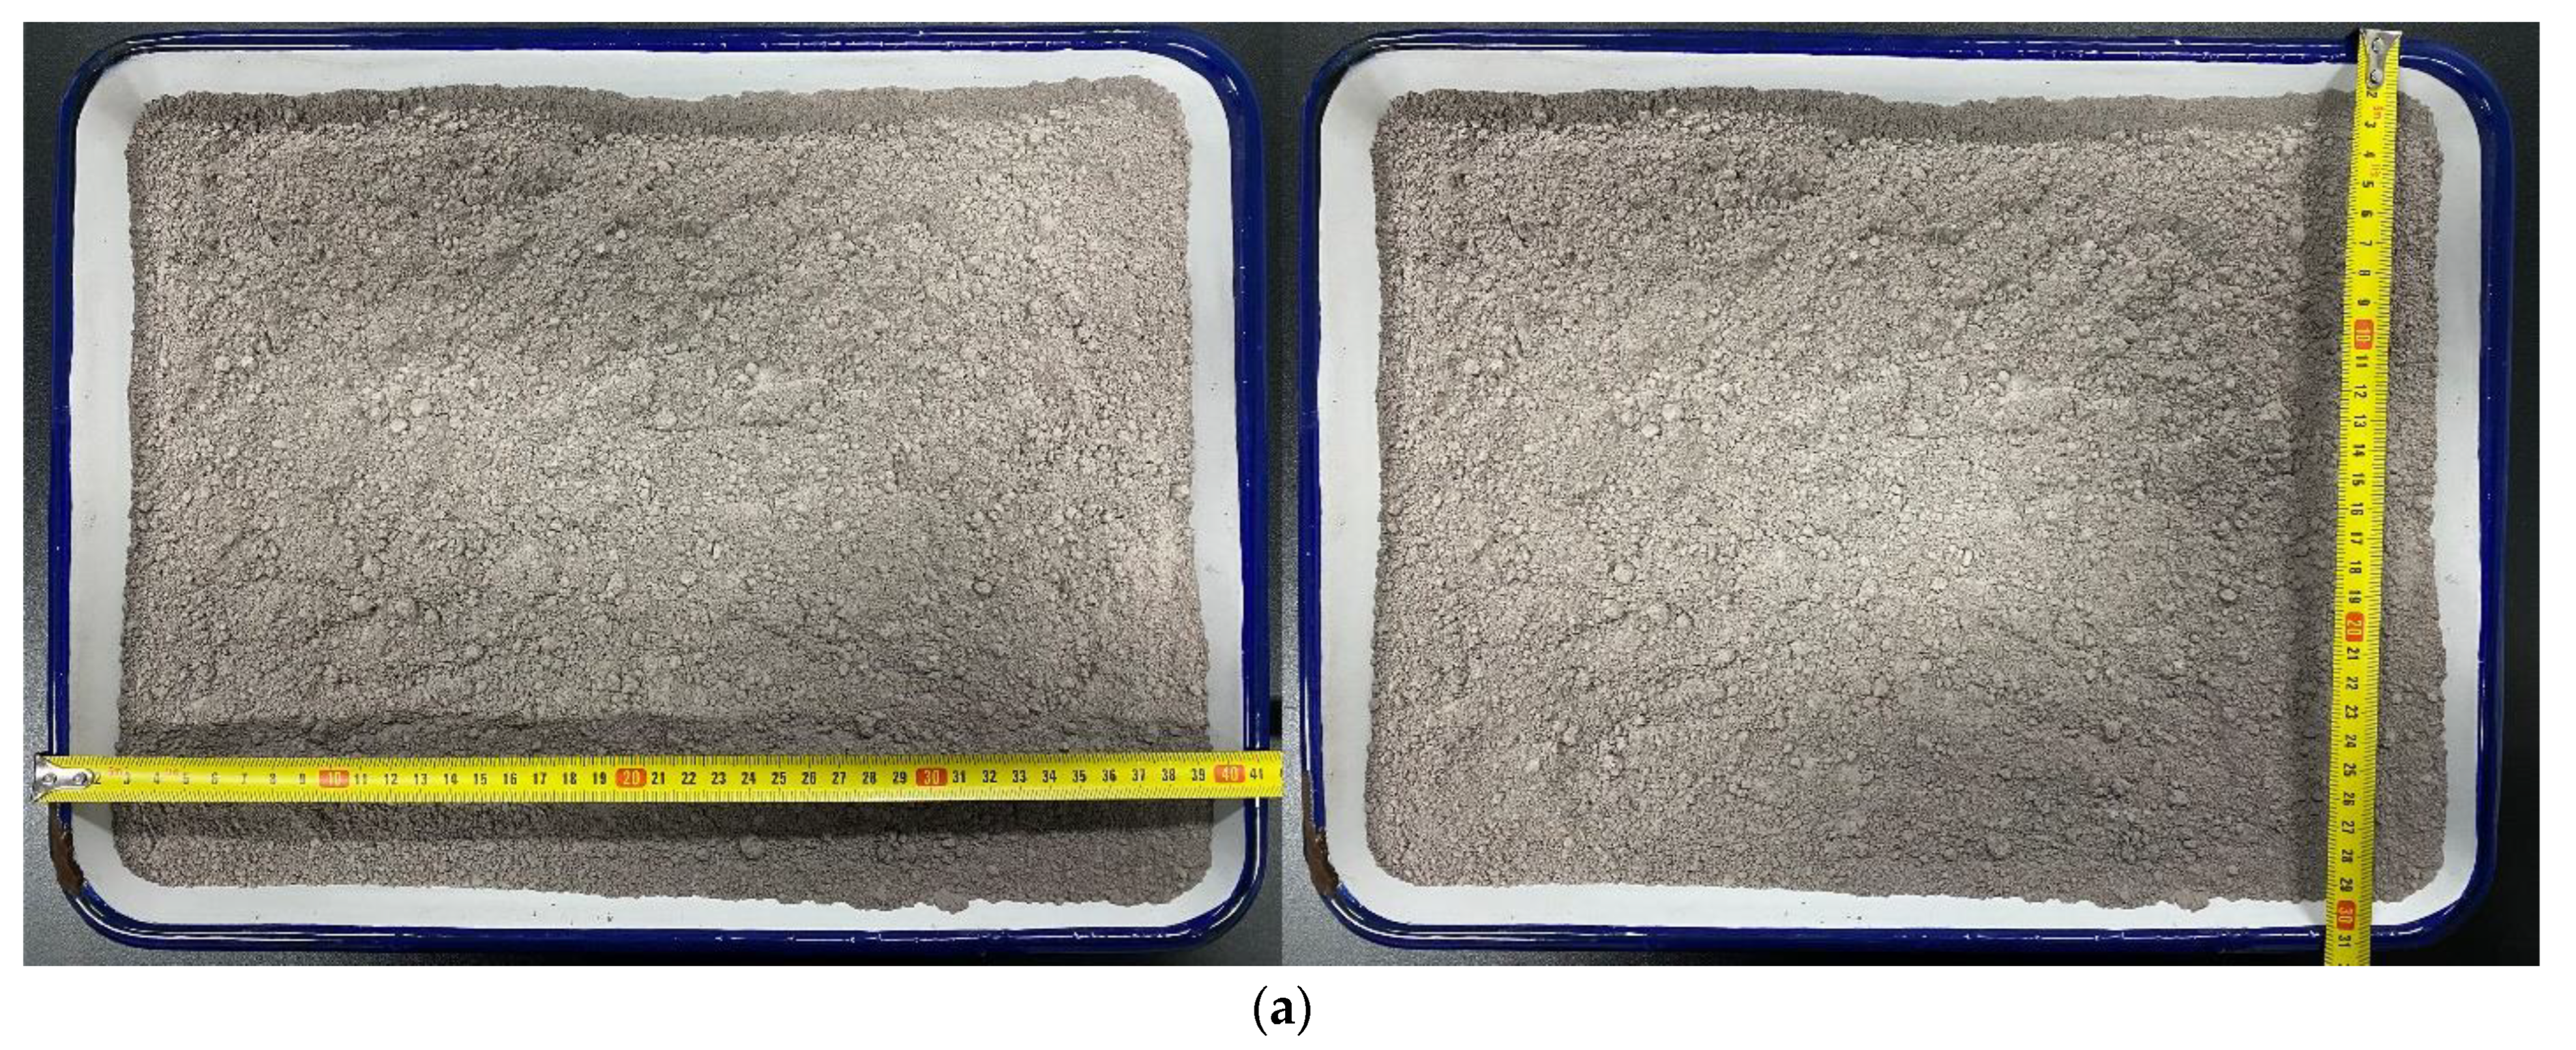
2.1. Experimental Instruments and Experimental Samples

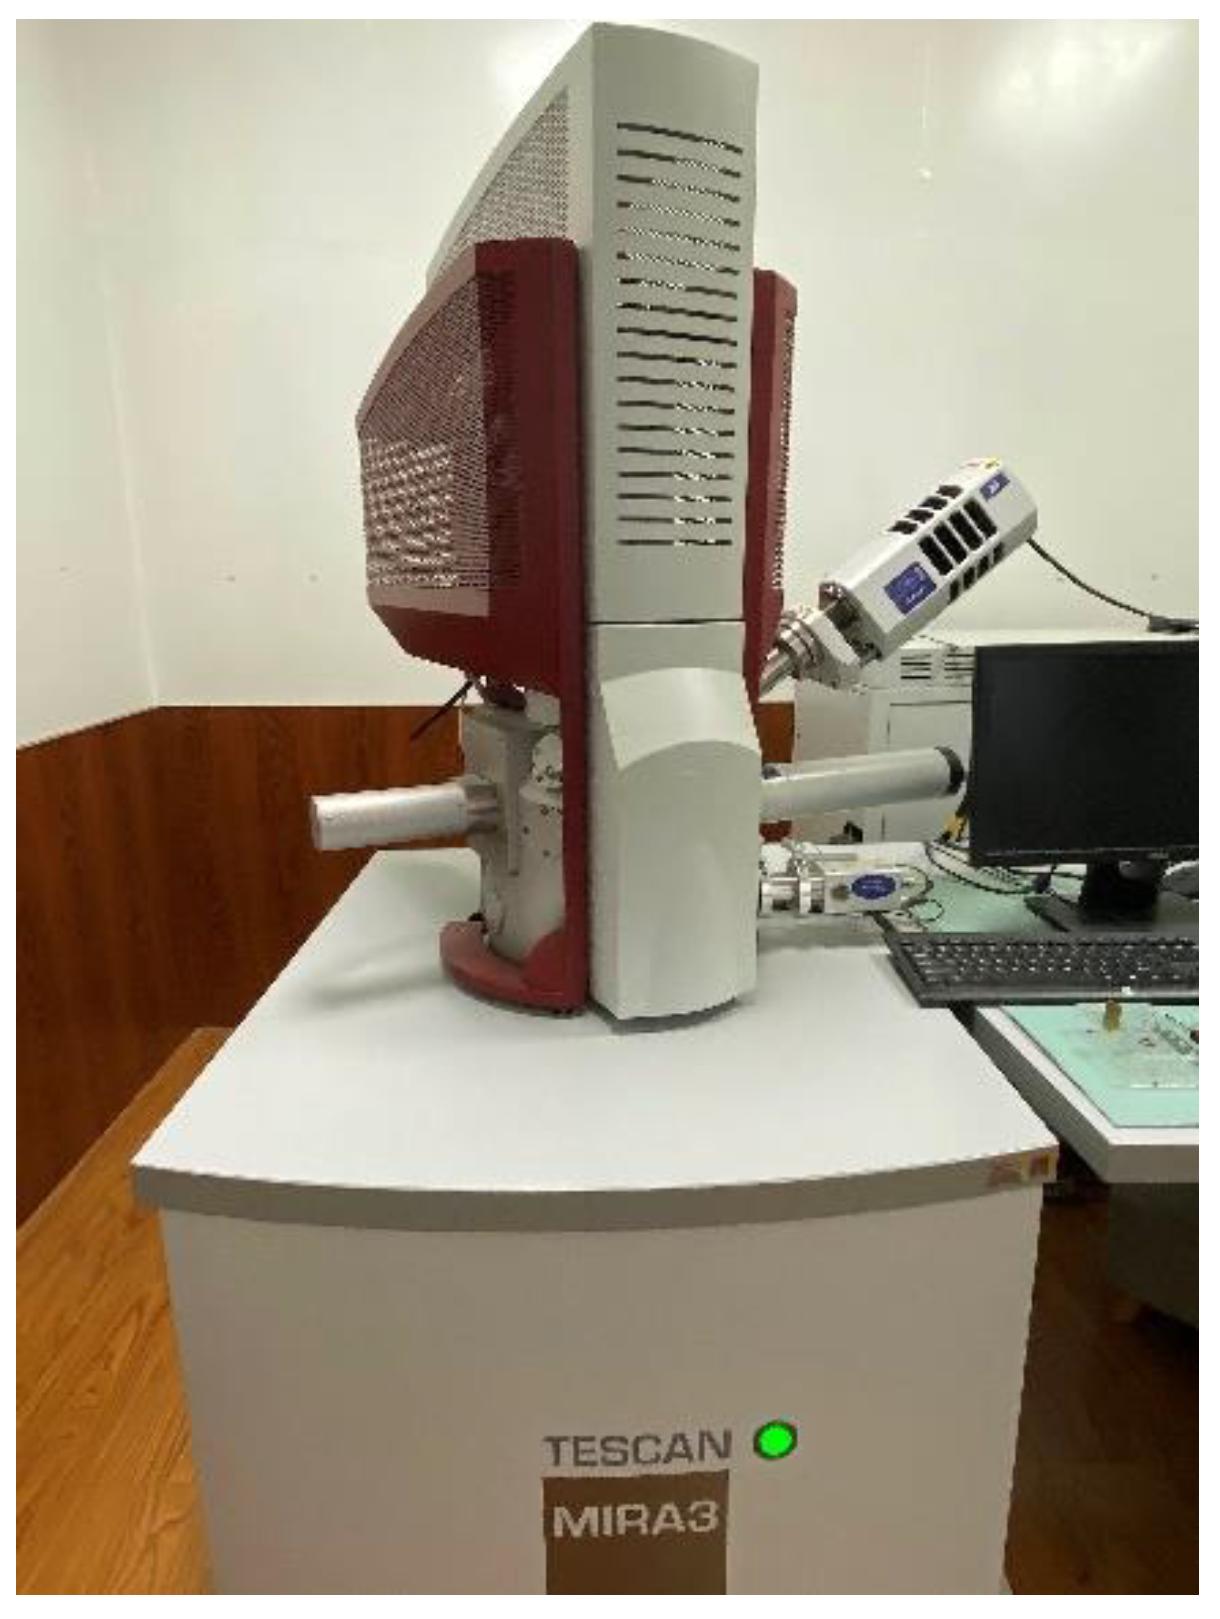
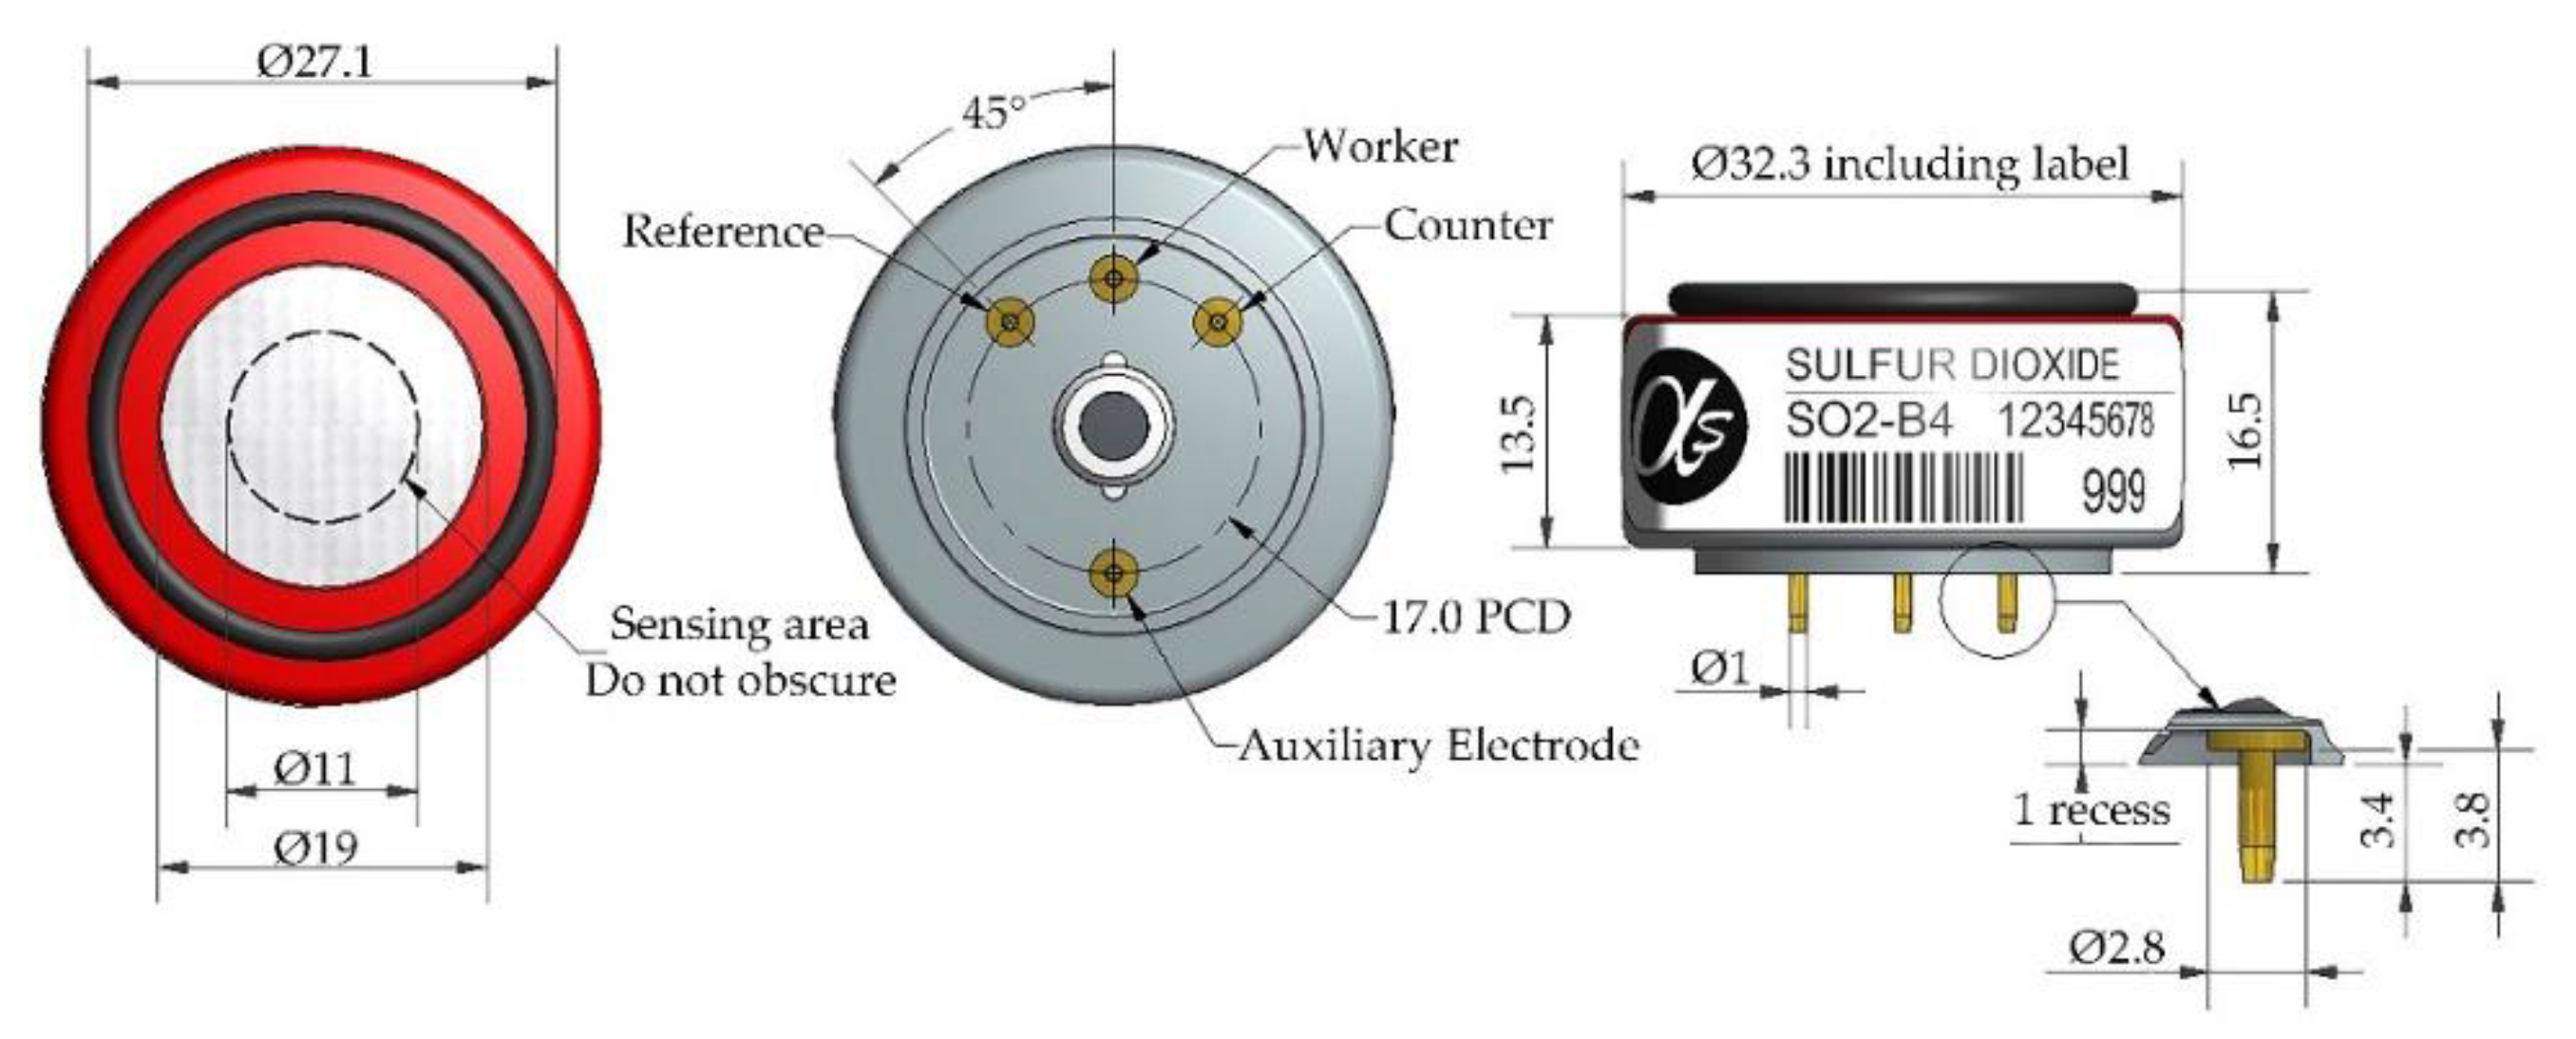
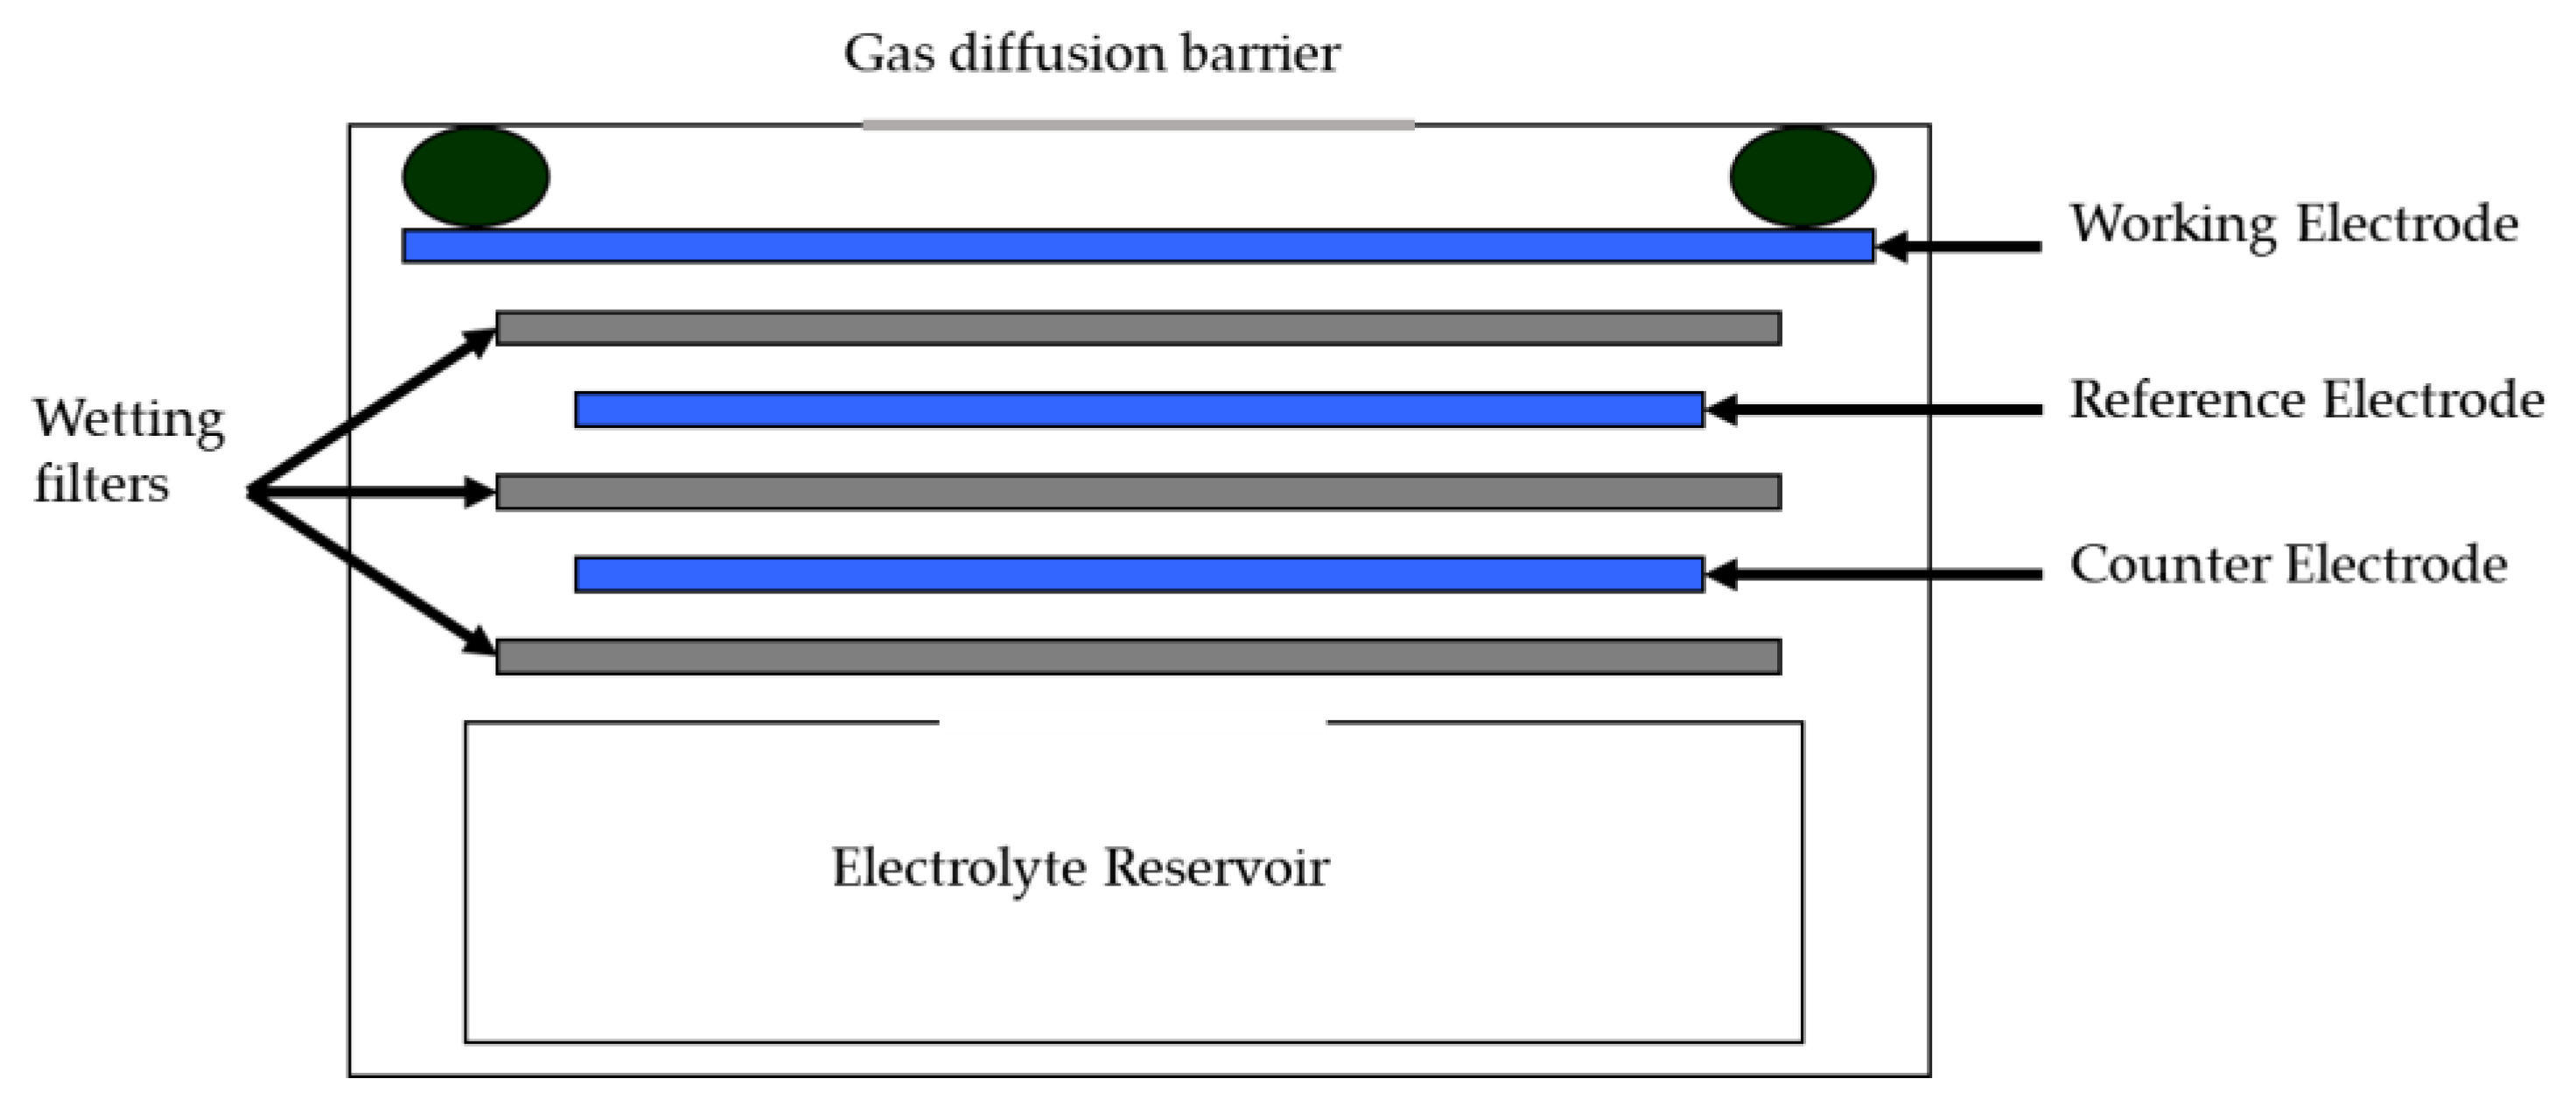
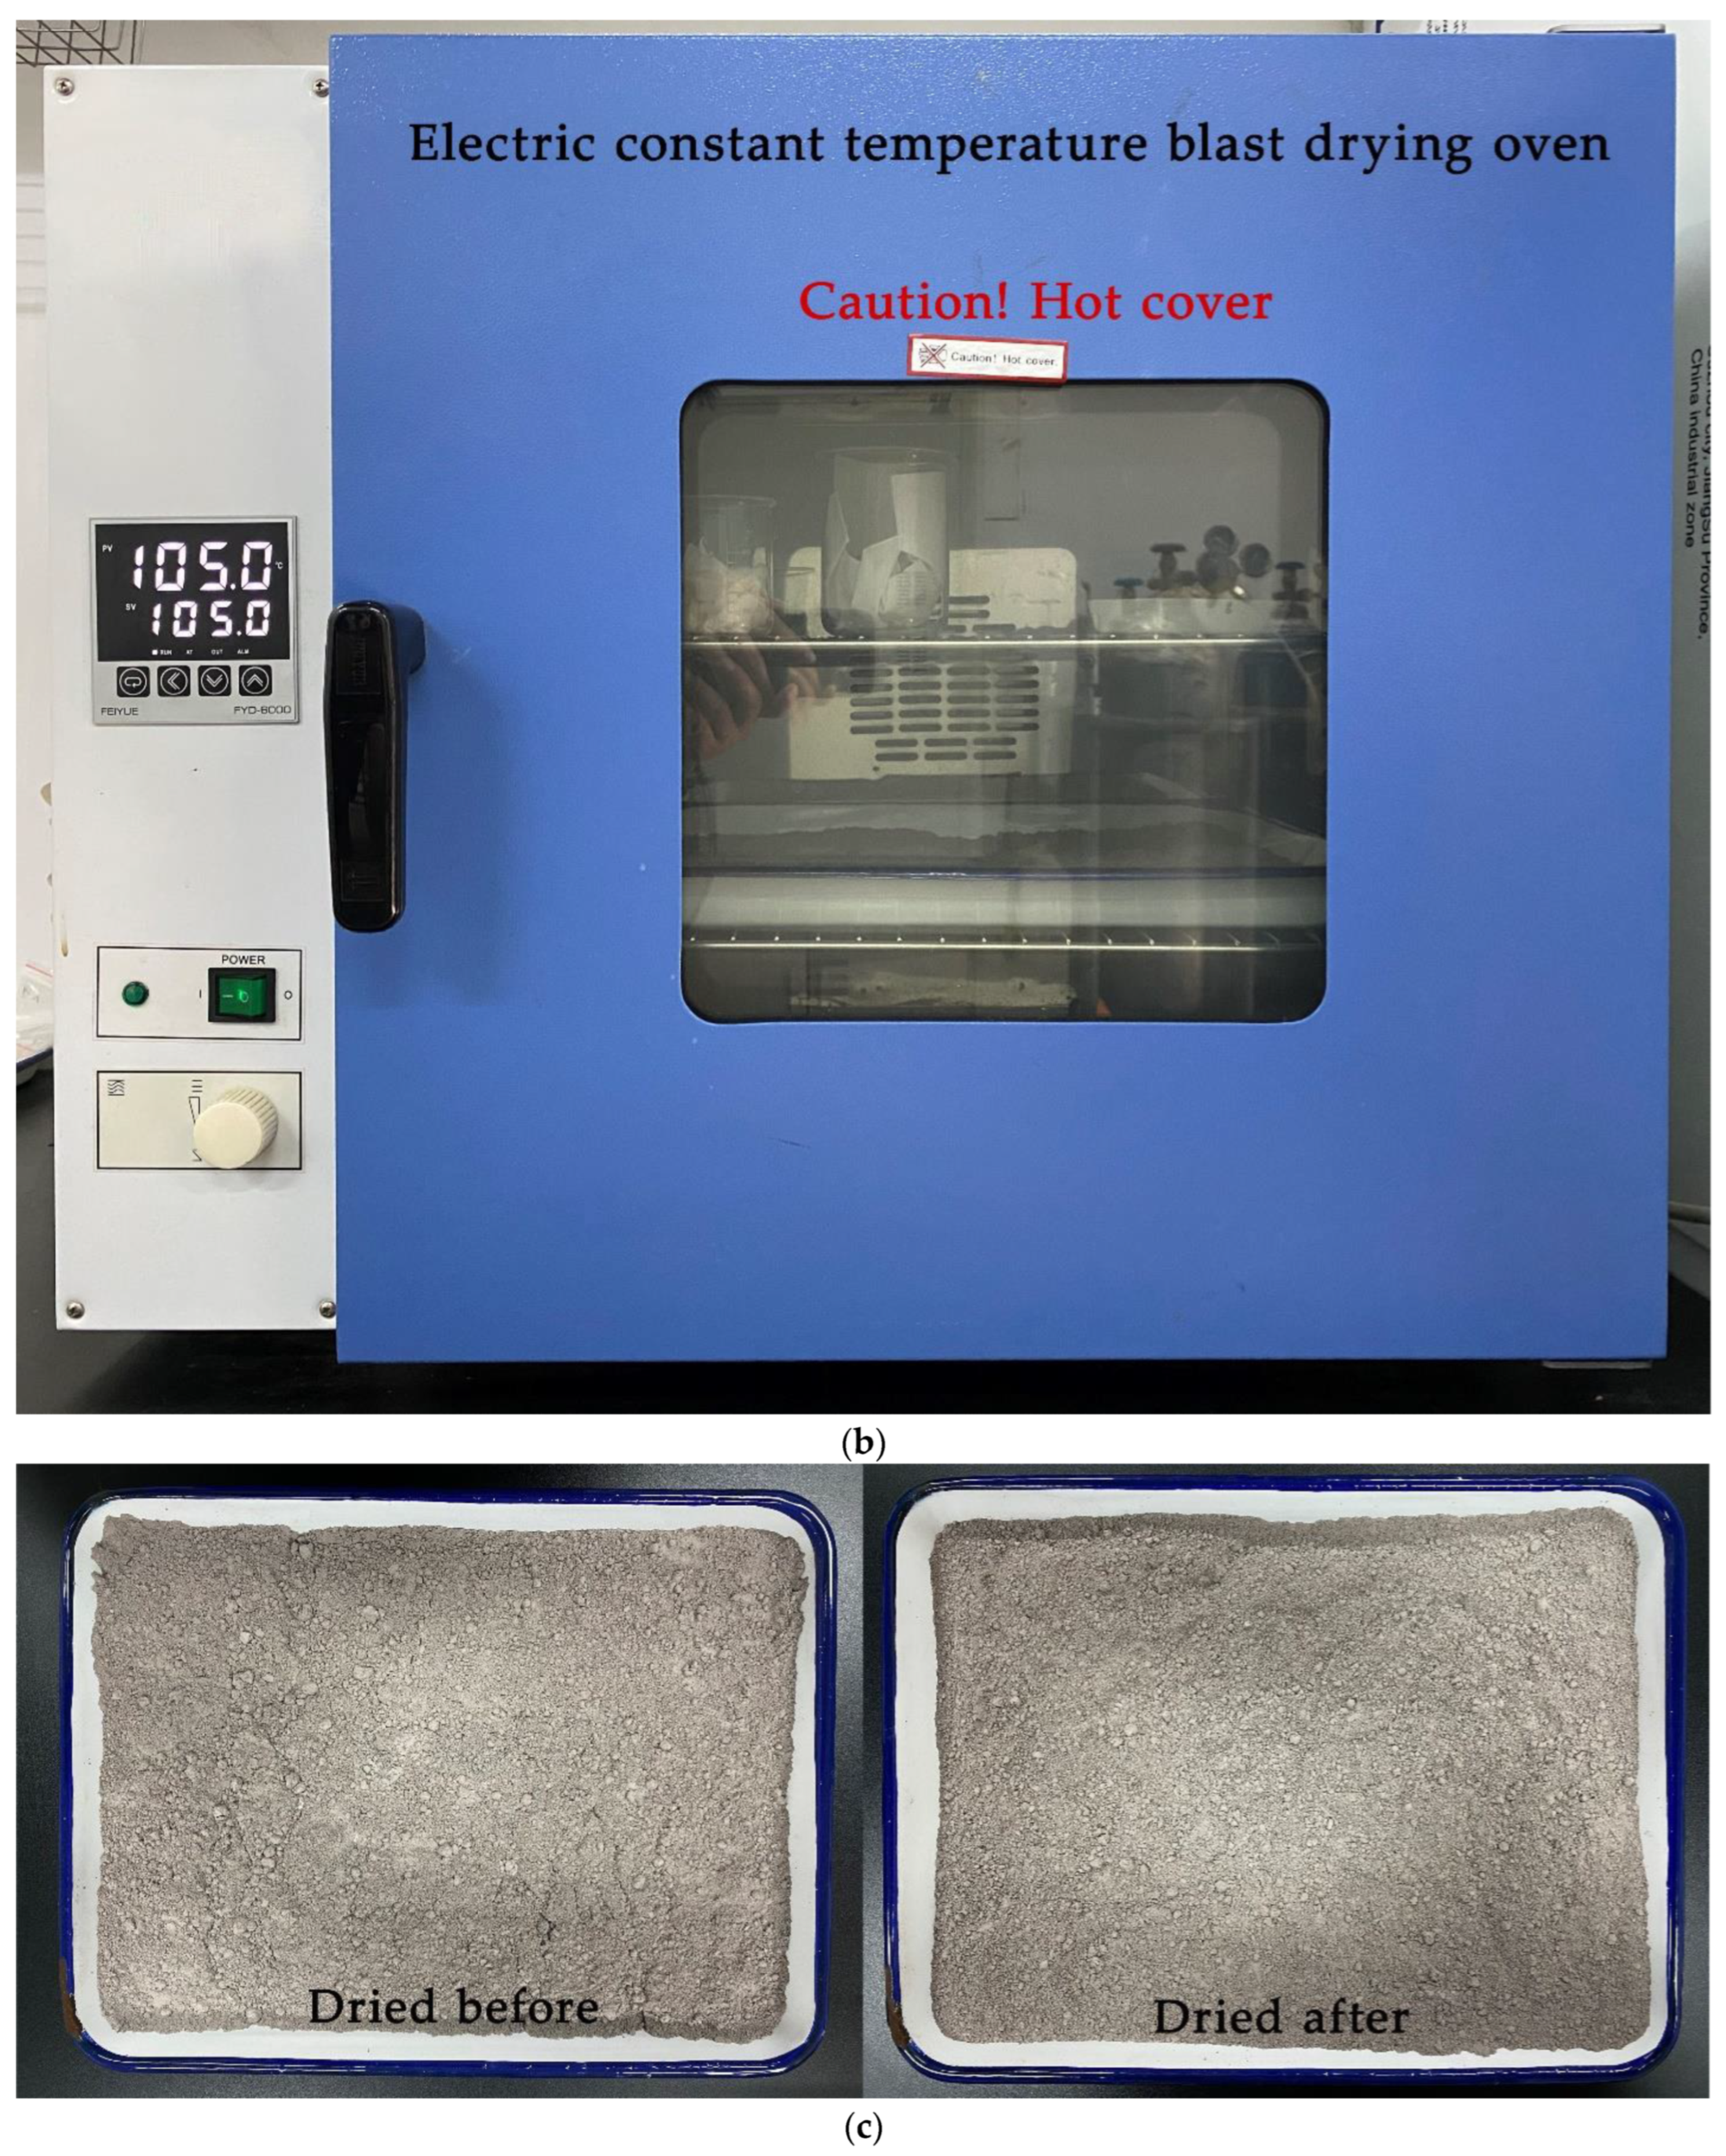
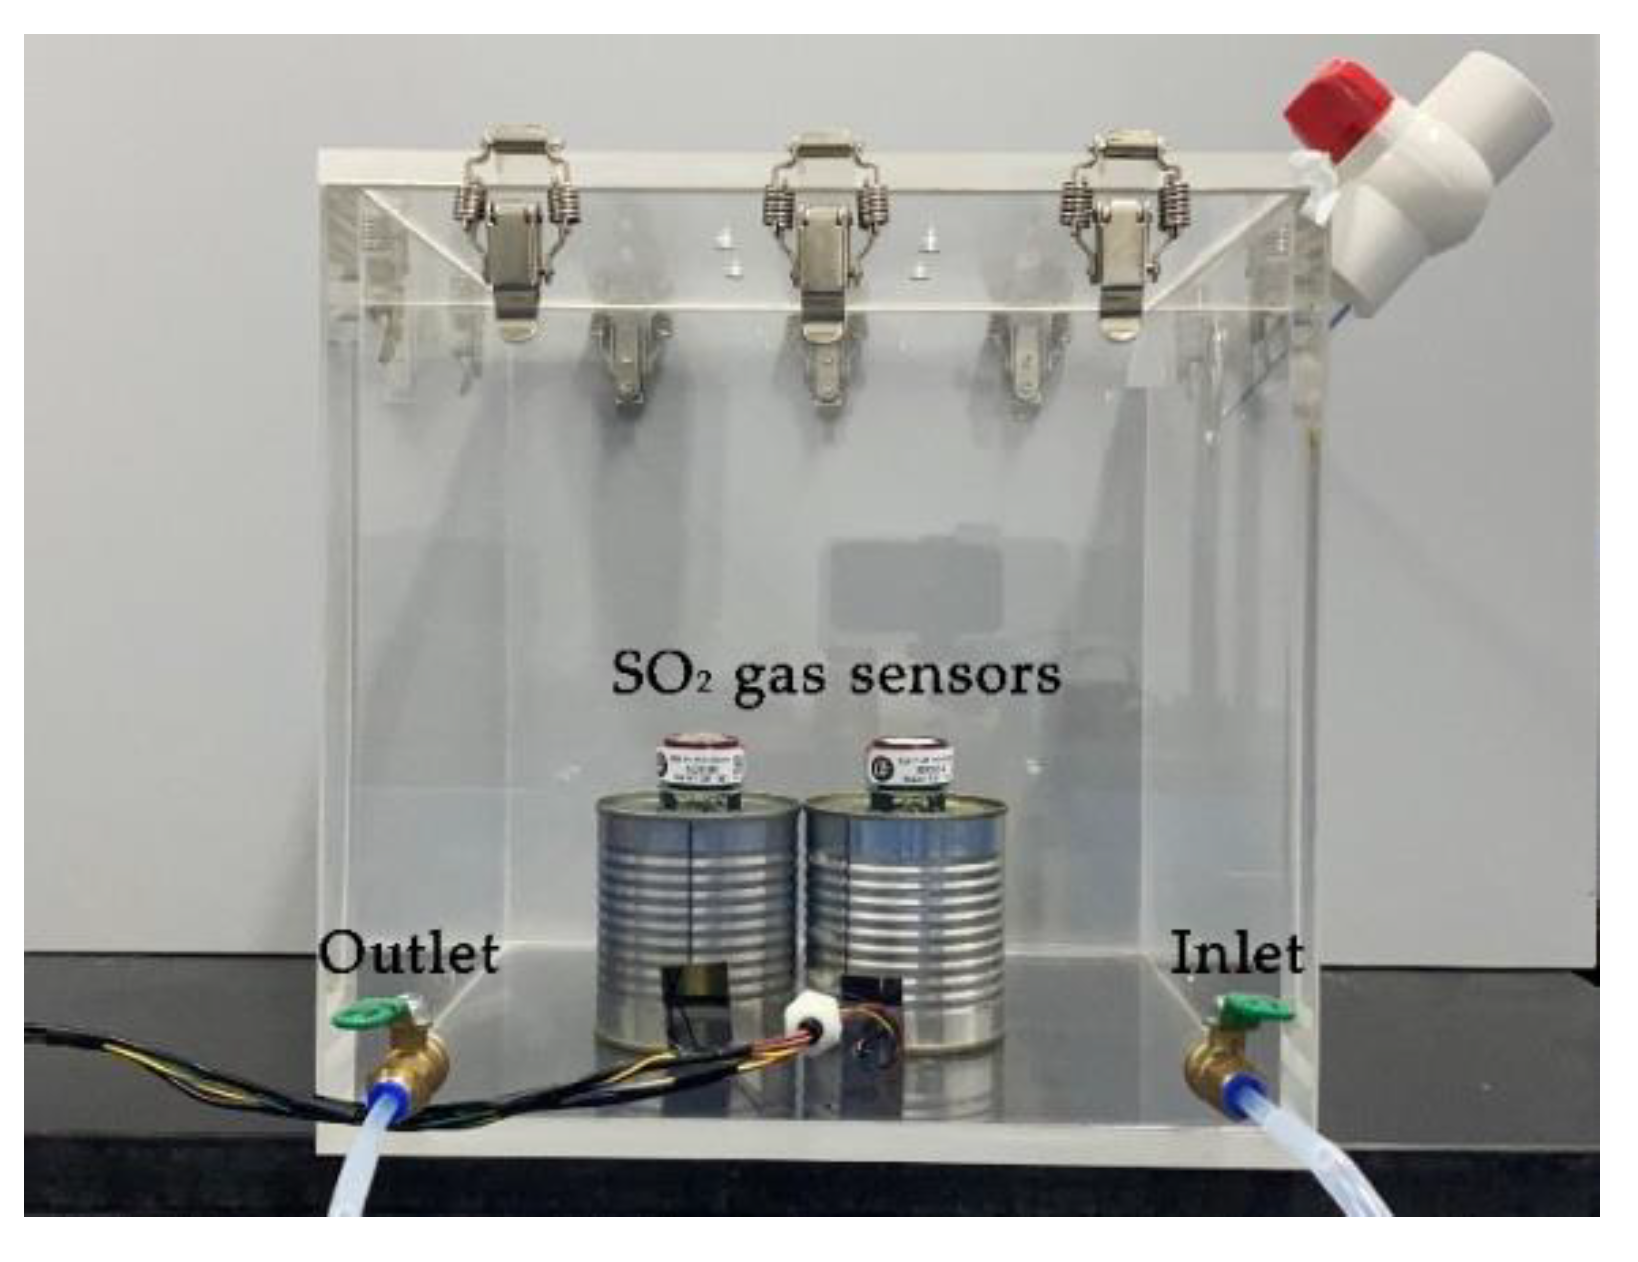
2.1.1. Experimental Instruments

We used a MIRA3 field emission scanning electron microscope, TESCAN (Czech Republic), shown in Figure 1. The device has a high brightness Schottky emitter for high resolution and low noise imaging. The resolution is 1.2 nm (30 keV) in high vacuum mode and 2.0 nm (30 keV) in low vacuum mode. The acceleration voltage is 200 V~30 kV, landing voltage is 50 V~30 kV, probe current is 2 pA~200 nA, and scanning speed is 20 ns~10 ms. The diameter of the electron microscope chamber is 230 mm and the sample stage is a 5-axis linkage, 360° rotation, and a moving range of X = 80 mm, Y = 60 mm, and Z = 47 mm.
Nano Measure, a particle size and distribution calculation software, is widely used to calculate and statistically analyze the particle size and distribution of SEM images. In this study, this software was used to calculate and count the size and distribution of fly ash particles in SEM images.
The manufacturers of SO2 electrochemical sensors in China are Cubic Sensor and Instrument Co., Ltd. (Wuhan, China), Hanwei Technology Group (Zhengzhou, China), Alphasense (Essex, UK), CityTech (London, UK), Honeywell (Morristown, NJ, USA), Figaro (Minoo city, Osaka, Japan), etc. Comparing various sensor parameters, we found that Alphasense’s sensor has the highest measurement accuracy, so we chose Alphasense’s SO2 electrochemical gas sensor for the test. The diameter inlet membrane of the SO2 electrochemical gas sensors used in this experiment is 19 mm, and the area of the membrane is 283.5 × 10⁻⁶ m2. The inlet membrane material is porous PTFE with 12–16 μm pore size, 49% porosity, and 0.28 μm thickness, whose appearance structure is shown in Figure 2, and the performance parameters are shown in Table 1.
The schematic diagram of the electrochemical gas sensor is shown in Figure 3 [14], which mainly consists of a gas permeable membrane, working electrode, counter electrode, reference electrode, and electrolyte solution [15].
The electrodes are made of materials that have a catalytic effect on the gas being measured [16], and the three electrodes are stacked in parallel in the sensor. A constant voltage is applied between the working electrode, which is used to oxidize or reduce the gas, and the counter electrode, which allows the gas to come into contact with the catalyst and electrolyte, forming a three-phase interface between gas, liquid, and solid. The counter electrode is used to balance the reaction at the working electrode, where the reduction or oxidation reaction occurs. The reference electrode is used to anchor the working electrode voltage to keep the potential of the working electrode and the counter electrode constant.
The working principle of the SO2 electrochemical gas sensor is that the SO2 gas to be measured enters the sensor through the inlet membrane, and an oxidation reaction occurs at the interface between the working electrode and the electrolyte solution to produce an electrolytic current, which forms a current loop through the electrolyte solution and the counter electrode, the magnitude of the electrolytic current is proportional to the concentration of the SO2 gas to be measured, and the SO2 gas concentration is measured by the magnitude of the electrolytic current.
SO2 diffuses through the inlet film to the surface of the working electrode, where an oxidation reaction takes place and the limiting diffusion current (i) is generated at the same time:
SO 2 + 2 H 2 O SO 4 2 + 4 H + + 2 e  
The limiting diffusion current (i) resulting from this oxidation reaction can be measured by the internal circuitry of the sensor. Under the specified working conditions, the electron transfer number (Z), Faraday constant (F), gas diffusion area (S), diffusion coefficient (D), and diffusion layer thickness (δ) are constants, and the magnitude of the ultimate diffusion current (i) is proportional to the SO2 concentration (c), so the SO2 concentration (c) can be determined by the ultimate diffusion current (i) [17].
i = Z F S D δ × c

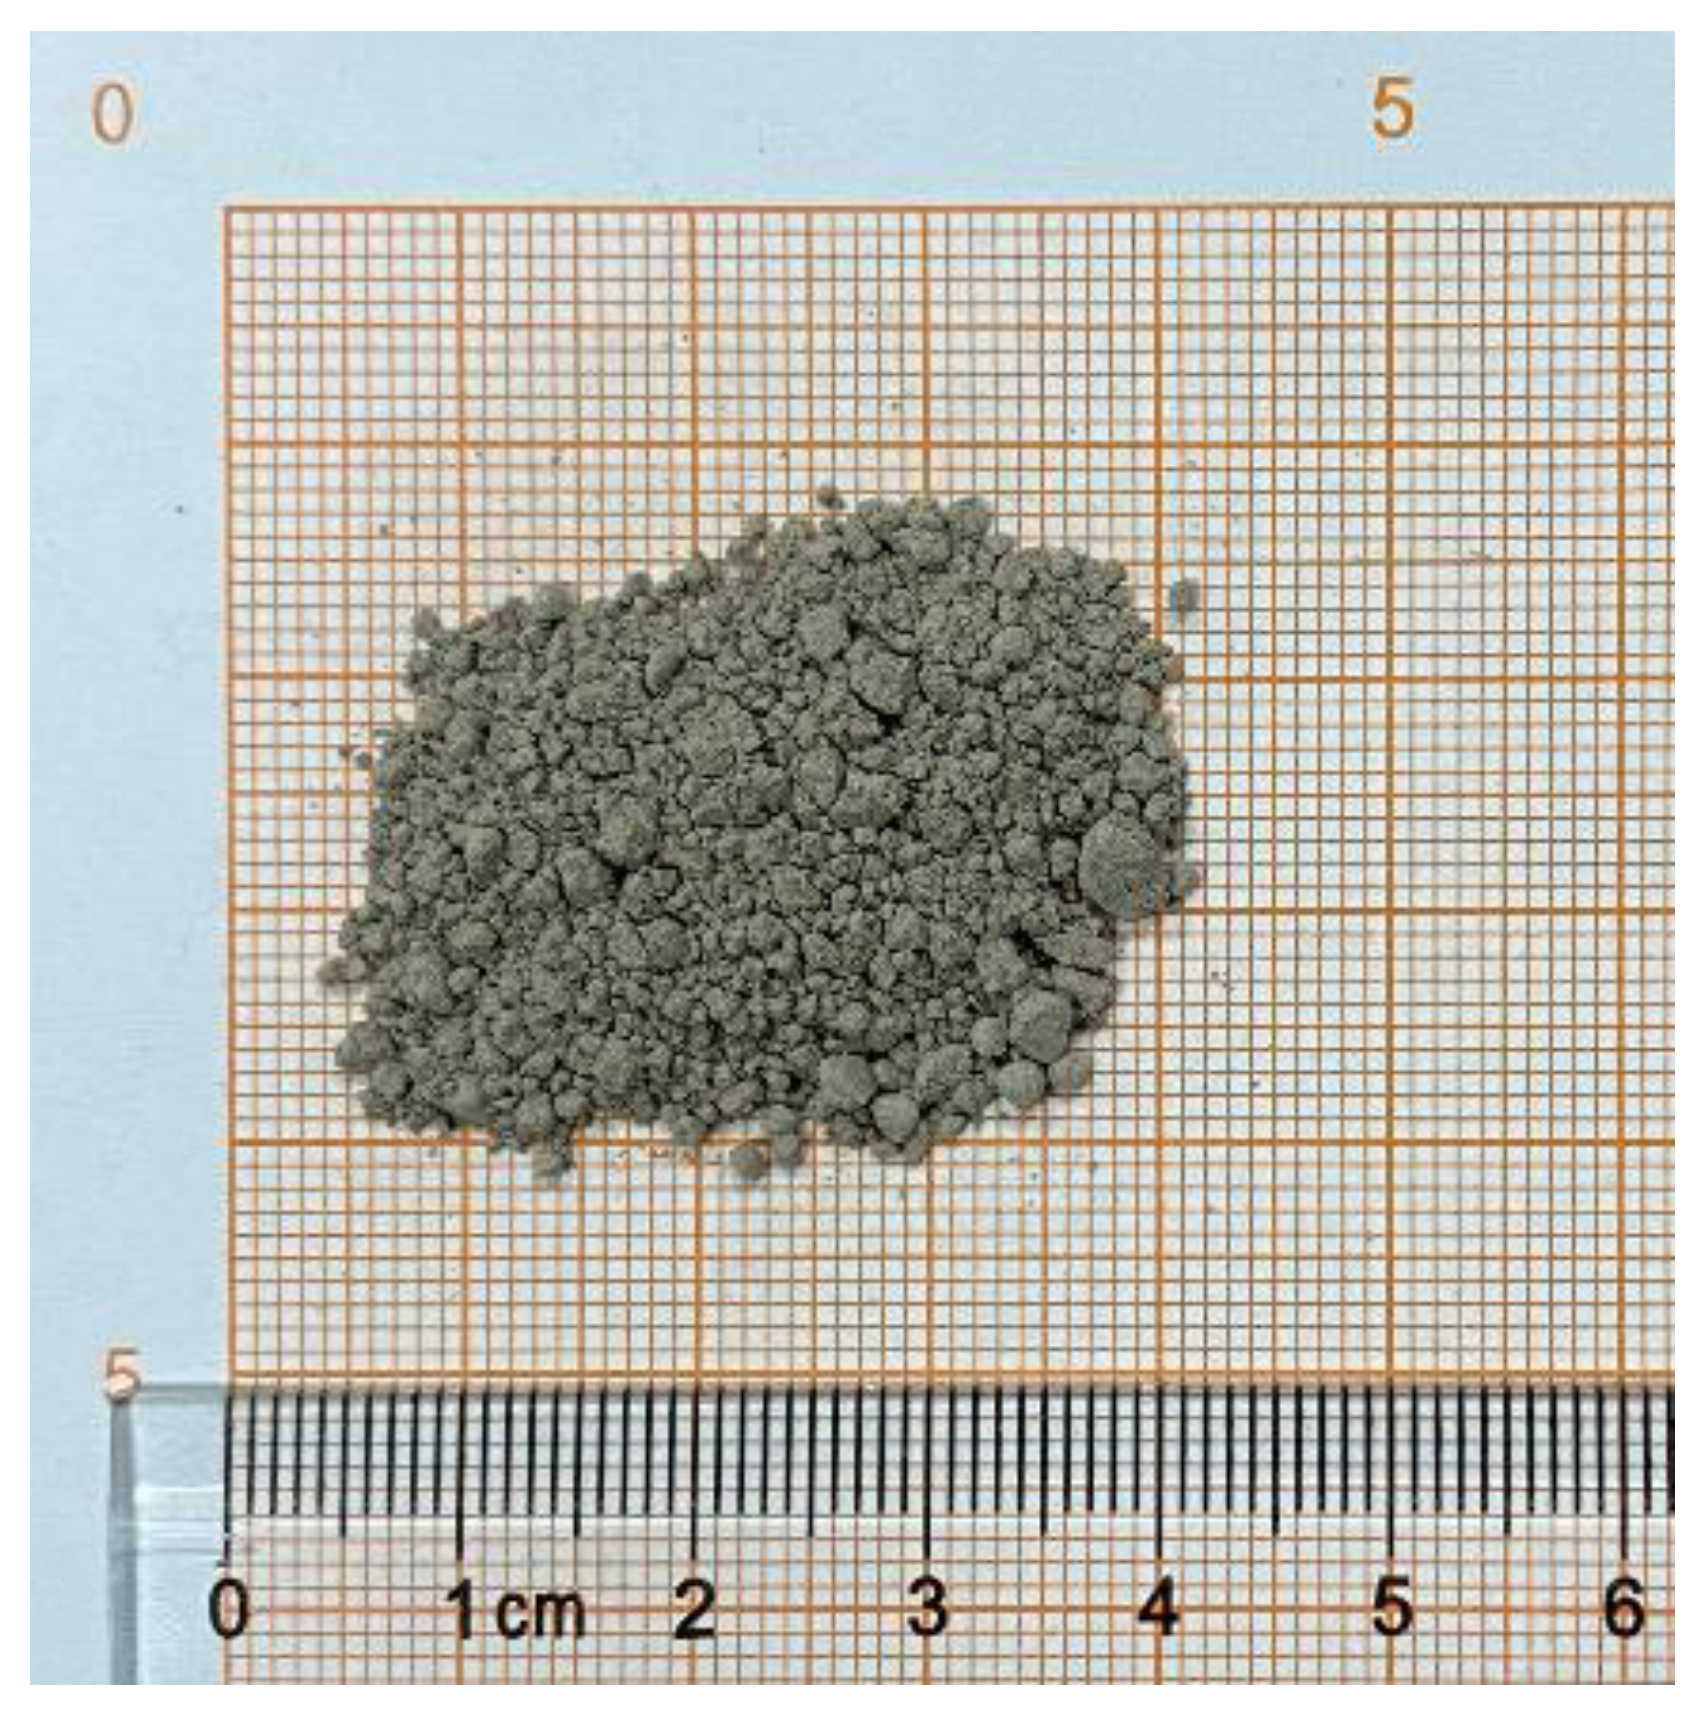
2.1.2. Experimental Samples

We used SO2 and N2 standard gases. The purity of N2 gas is 99.999%; the concentration of SO2 gas is 1000 ppm, diluted to 10 ppm, 20 ppm, 30 ppm, 40 ppm, 50 ppm, 60 ppm, 70 ppm, and 80 ppm, respectively, by using high purity N2 gas.
Fly ash samples were used, as shown in Figure 4. The fly ash samples came from the dust collector hopper of thermal power plants and were collected by using polyethylene transparent bags for easy observation of sample appearance. A total of 10 kg of fly ash was sampled at different times. The sampling times were 9:00–10:00, 15:00–16:00, and 20:00–21:00. Sampling at different times made the samples better describe the fly ash profile of the thermal power plant.

2.2. Experimental Instruments and Experimental Samples

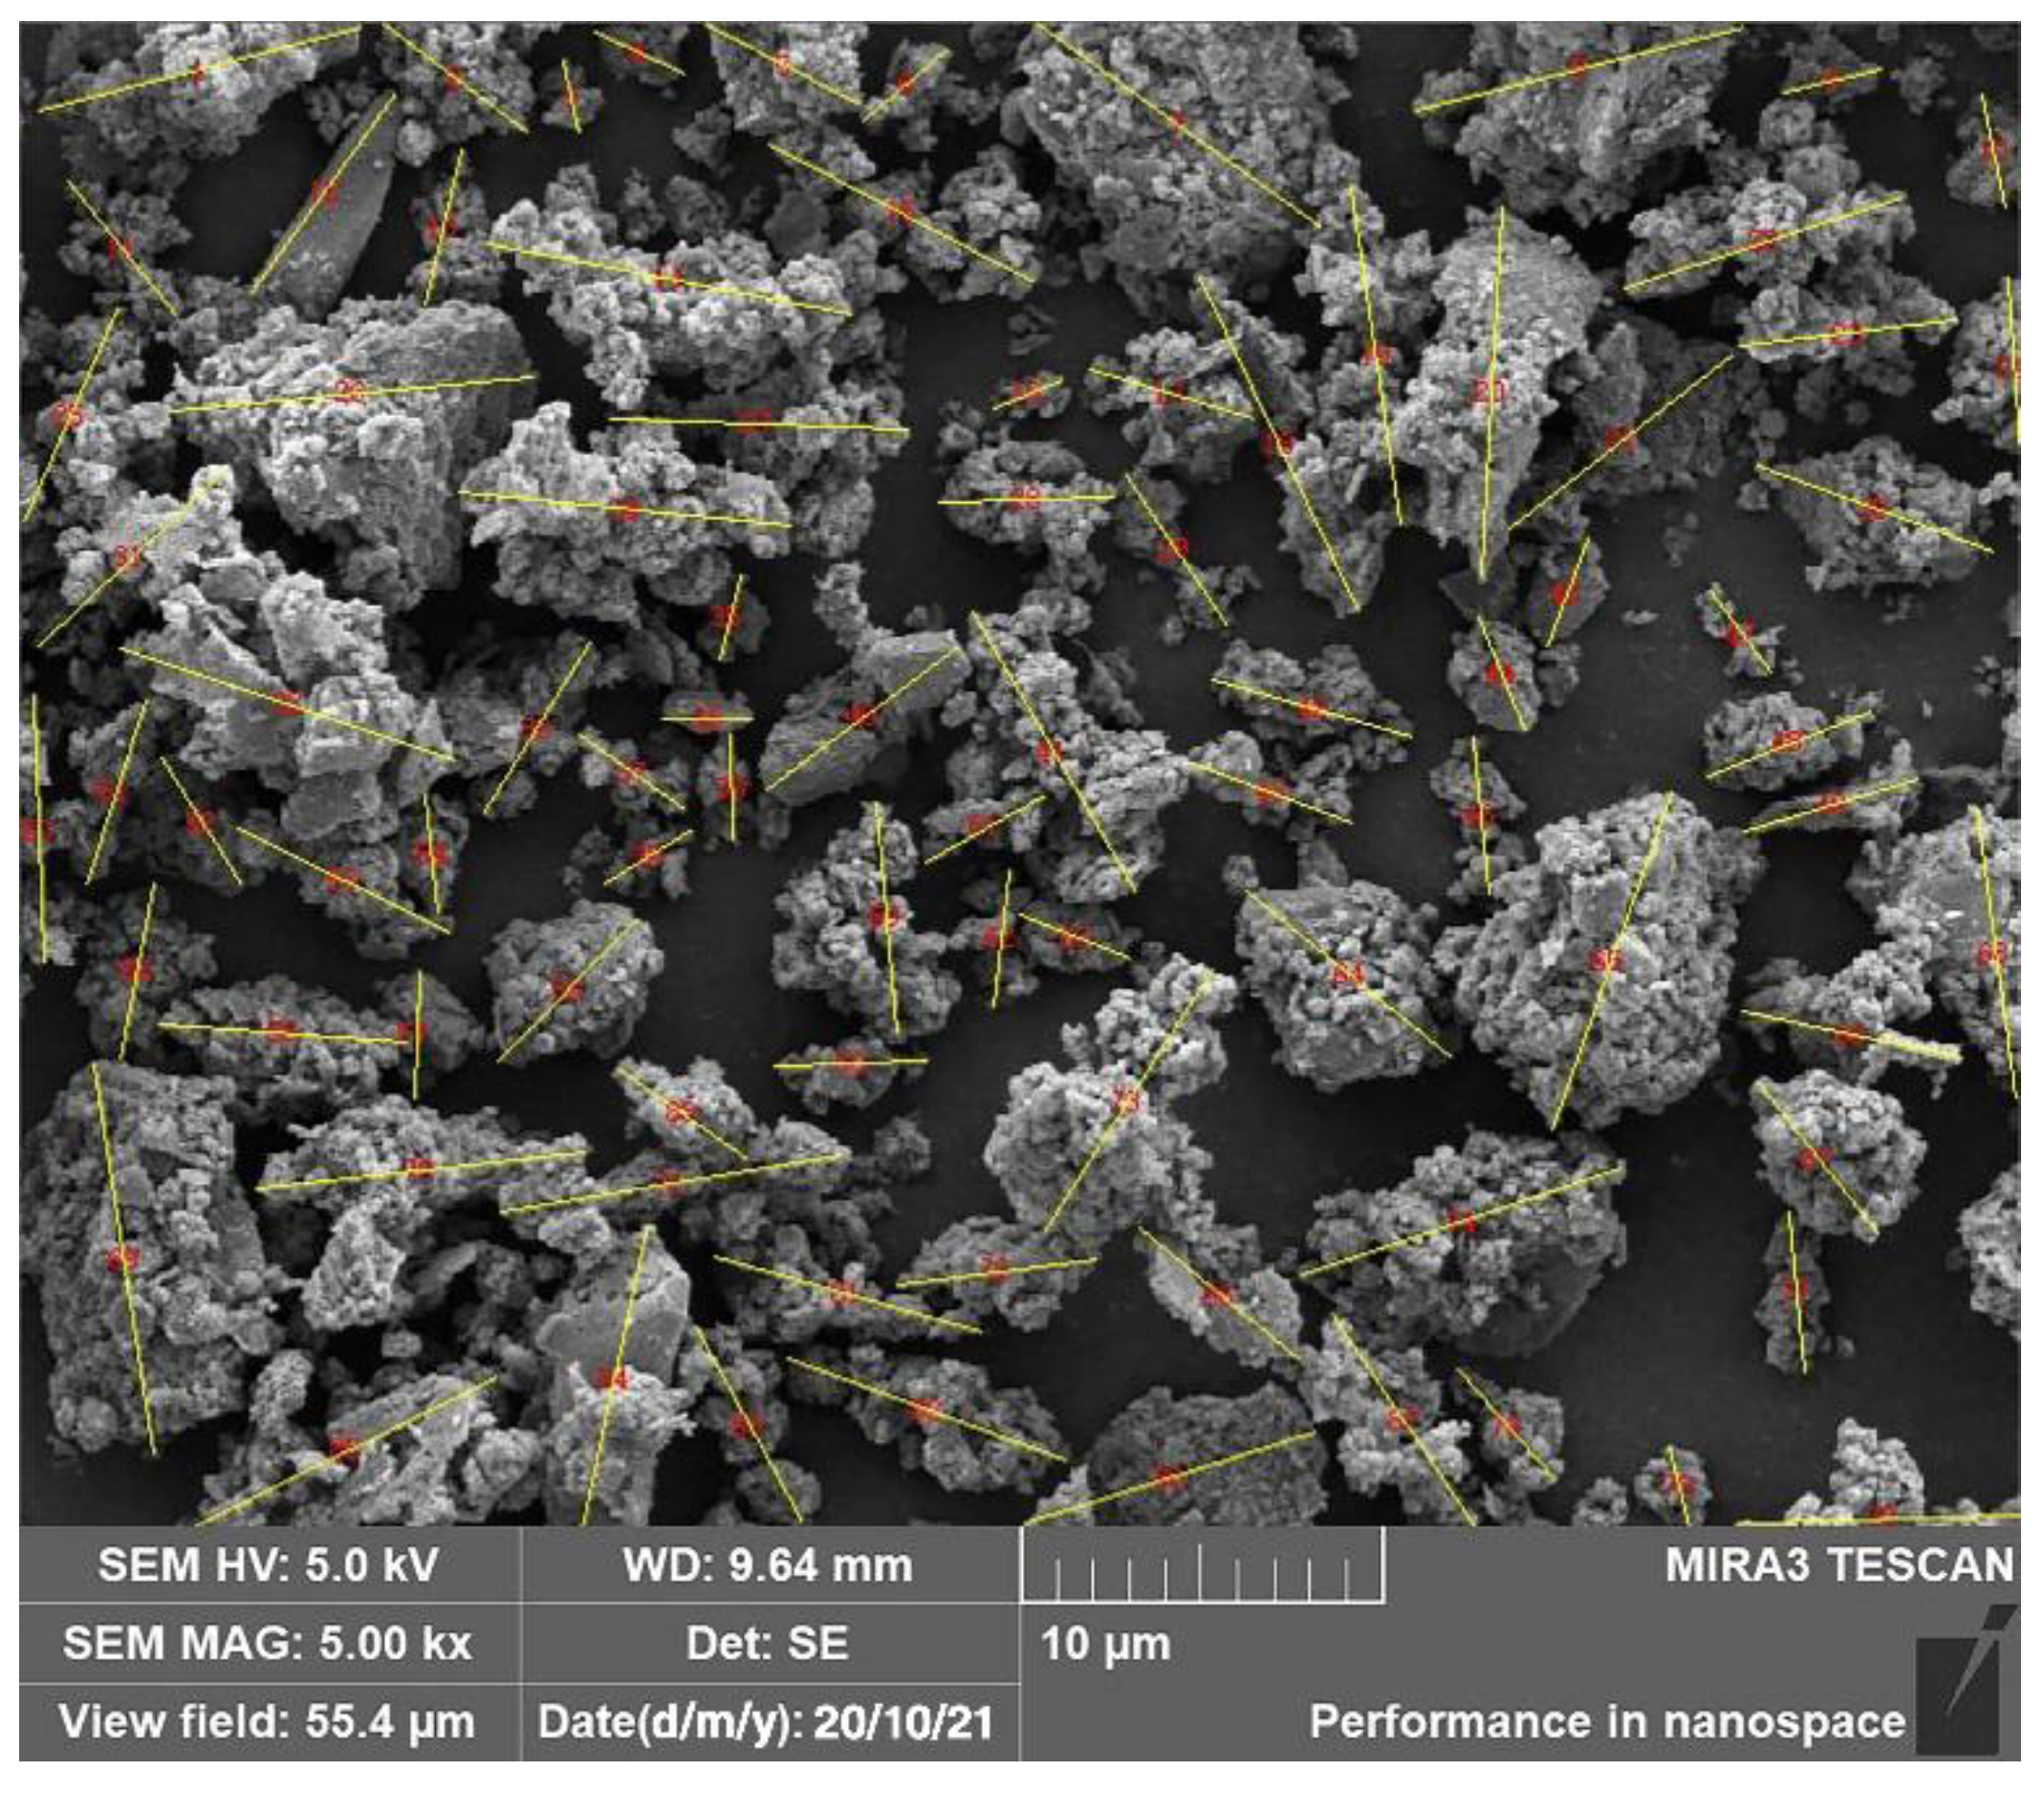
2.2.1. Scanning of Fly Ash Particle Morphology

The experiments need to research the fly ash particle morphological characteristics and particle size, which is used to calculate the fly ash settling speed. 500 g of fly ash samples were dried at 105 °C for 60 min. The fly ash sample was put evenly on a tray and the pile thickness of fly ash was about 5 mm. The drying process of fly ash is shown in Figure 5. Through the drying checkability experiment, we found that the weight of fly ash basically no longer changed after 60 min of drying. Then 5 g of the dried fly ash was taken for morphological scanning, and the remaining fly ash was used for subsequent experimental tests.

2.2.2. Measurement Error Experiment of SO2 Electrochemical Gas Sensor

The SO2 electrochemical gas sensor was placed in a sensor measurement error test chamber made of Plexiglas, as shown in Figure 6. The size of the Plexiglas test chamber is 300 × 300 × 300 mm, the wall thickness of the glass is 10 mm, and the glass was bonded with methylene chloride to ensure hermeticity. There are two reasons for the size of the test chamber. Firstly, the space should be large enough for hand operation space when placing the sensor in the test chamber. Secondly, if the size is too large (e.g., 1000 × 1000 × 1000 mm), it will lead to a decrease in sealing and more gas is needed to fill the test chamber. SO2 gas is a toxic gas, so there will be leakage poisoning potential. The amount of fly ash deposited under different deposition times was placed on the surface of the sensor inlet film, and then SO2 gas of known concentration was introduced into the test chamber to measure the measurement error of the sensor under fly ash deposition. The study conducted three sets of sensor test trials, each lasting 1 h.

3. Results

3.1. Particle Morphology of Fly Ash

To visualize the morphological characteristics of fly ash particles, a scanning electron microscope was used to scan the morphology of the fly ash particles, and the results of the morphology scan are shown in Figure 7. The fly ash particles were of different sizes and irregular shapes, with dotted bumps and pits on the surface. The boundaries of the fly ash particles are relatively clear, and some small particles are attached to the surface of large particles.
It is important to note that the particle size distribution of fly ash varies with the origin and combustion temperature of the coal used as fuel.
The fly ash sample used in this paper was from a coal gangue thermal power plant and another sample of fly ash was collected from a coal thermal power plant. The particle size distribution of fly ash from coal thermal power plants is more uniform, with a regular spherical appearance and a smooth, unattached surface. As coal contains more carbon than coal gangue, it burns at a higher temperature and burns more fully, so the fly ash particles will be smaller in size.

3.2. Particle Size Distribution of Fly Ash

The particle size distribution is shown in Table 2. The particle size distribution ranges from 2 to 11 μm, with a minimum value of 2.04 μm, a maximum value of 10.88 μm, and an average value of 6.1 μm.
PM10 particles were chosen as the focus of the study for two reasons.
The first reason is the size of the dust particles in the atmosphere. The dust particles in the atmosphere are mainly PM2.5 and PM10. Larger particles such as PM50 and PM100 will settle quickly and will not stay in the air for a long time, so this size was chosen as the main object of study.
The second reason is that the particle size of the fly ash samples is mainly PM10. The particle size distribution range of the fly ash samples is 2–11 μm, 90% of the particles are larger than 2.5 μm and the average particle size is 6.1 μm. Therefore, PM10 particles were chosen as the focus of the study.
The size of the fly ash particles would affect the sensor measurement error. The sensor inlet membrane material has a pore size of 12–16 μm and a porosity of 49%. When the fly ash particle size is larger than 16 μm, for example, PM50 or PM100, it will completely cover the inlet hole of the sensor inlet membrane, resulting in an increase in measurement error.

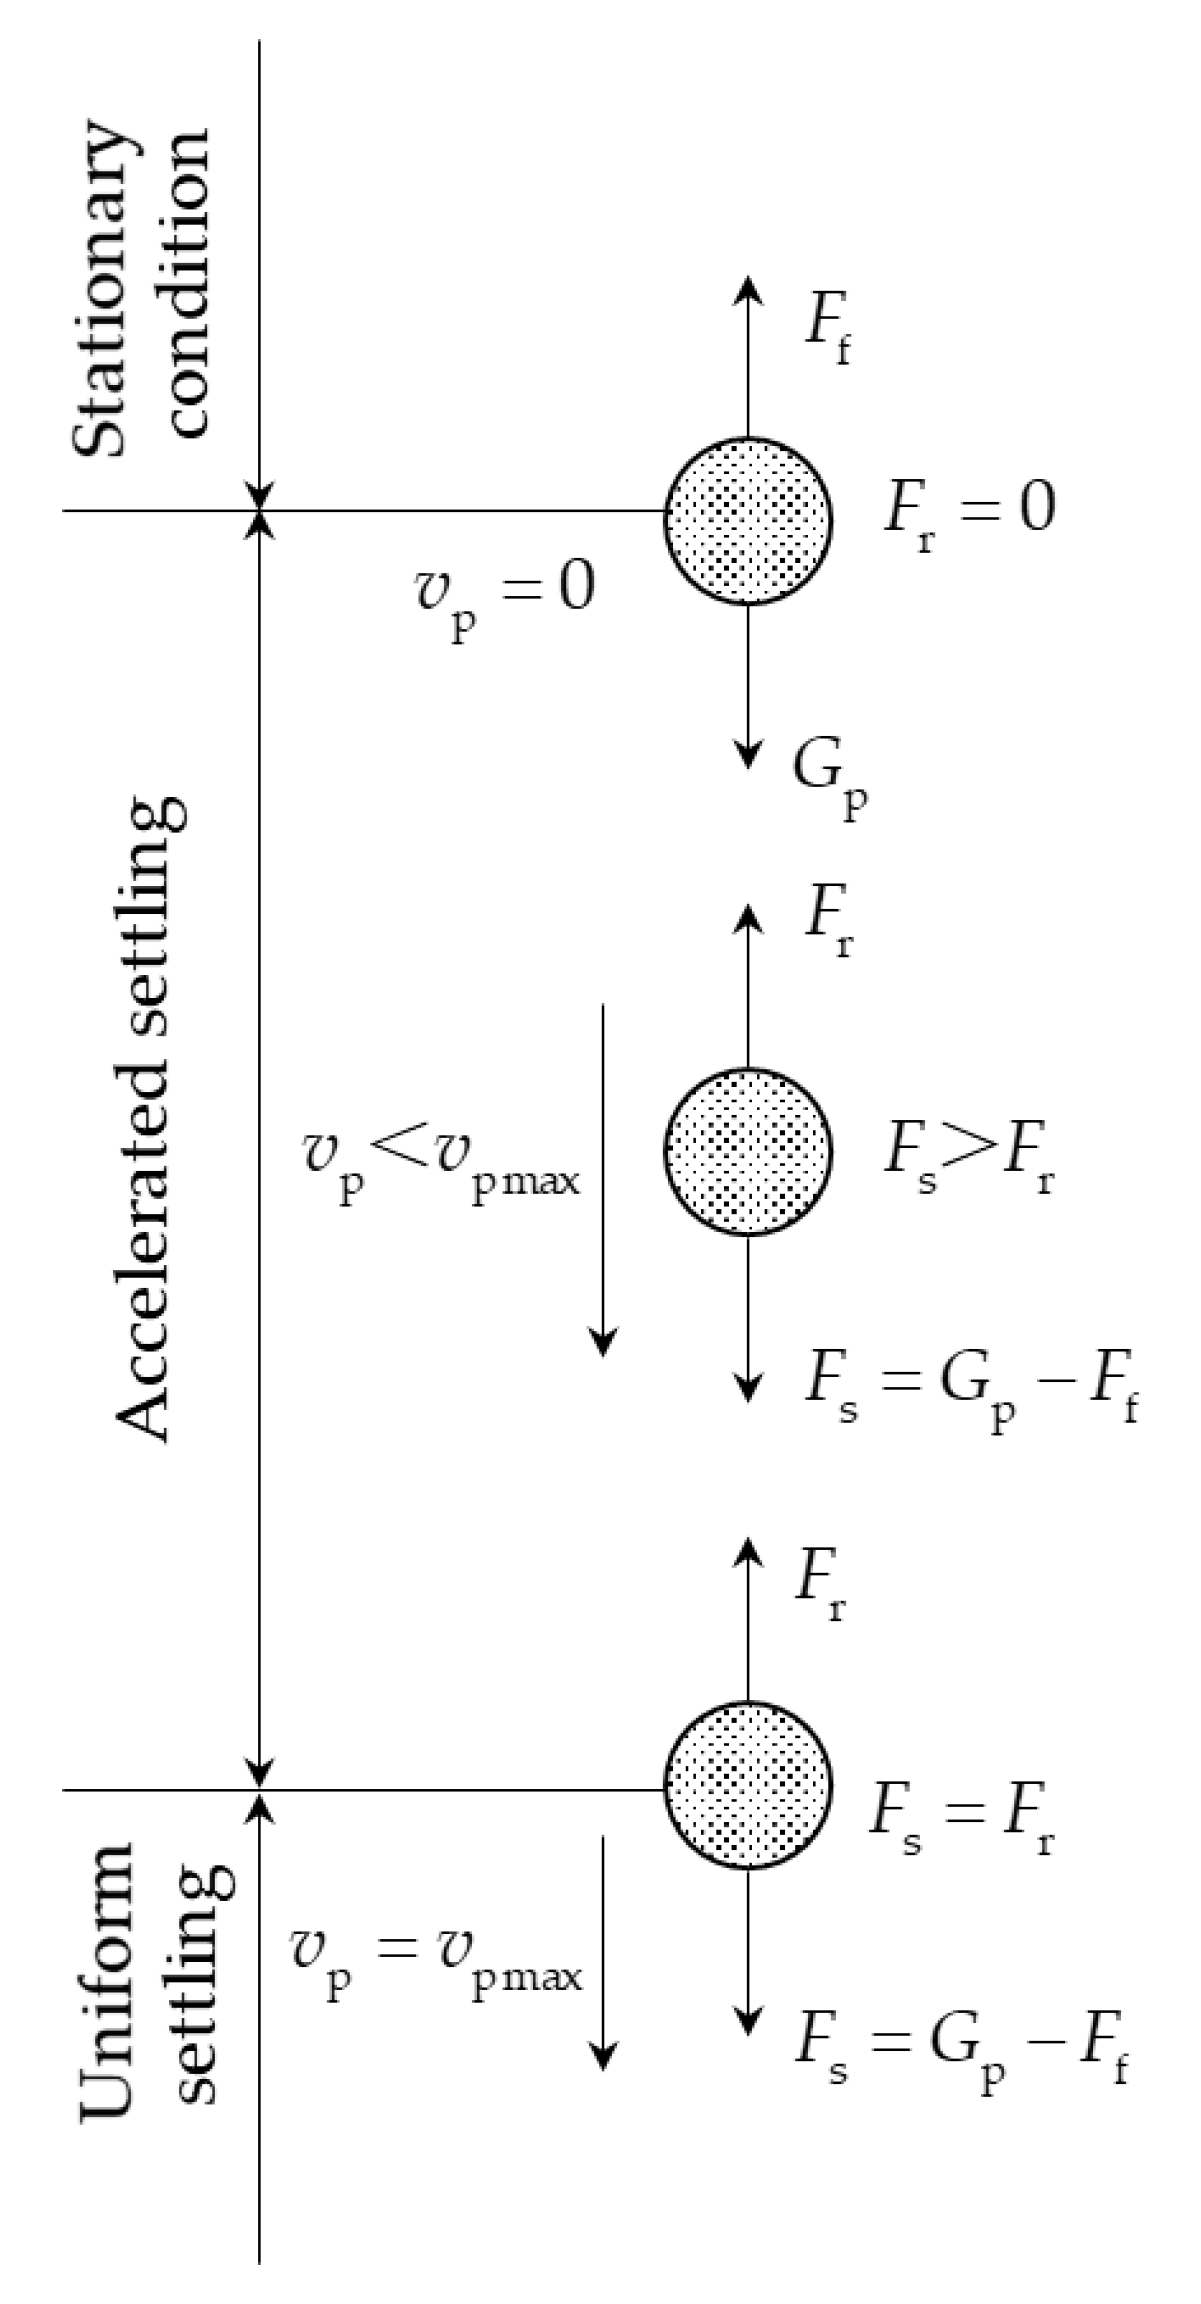
3.3. Calculation of Settling Speed of Fly Ash Particles (*Appendix A for the Meaning of the Equation Symbols)

Due to the complex atmospheric environment at the sensor use site, temperature, humidity, wind speed, wind direction and airflow state (laminar flow zone, transition zone, turbulent flow zone) can affect the fly ash deposition, and it is difficult to simulate the atmospheric environment at the site in the laboratory. Therefore, the atmospheric environment of the laboratory was kept relatively ideal (temperature 20 °C, humidity 50%, wind speed 0, laminar flow zone) to simplify the particle settling process and facilitate the calculation of particle settling speed and fly ash deposition amount based on theoretical knowledge of aerodynamics and fluid mechanics.
The temperature range of the sensor is −30 to 50 °C and the humidity range of the is 15 to 90%RH. The experimental settings of temperature (20 °C) and humidity (50 RH%) are within the range of the sensor and meet the requirements of sensor use. This experimental condition was set because the temperature and humidity are easier to keep stable in the laboratory. The temperature was kept at 20 °C to avoid air convective movement due to temperature differences and the heat exchange between the molecules and the environment.
The settling process and forces on the fly ash particles in the air of the laboratory are shown in Figure 8. According to the speed of fly ash particles, the settling process can be divided into three stages: stationary condition, accelerated settling, and uniform settling.
In still air, fly ash particles are subject to gravity G p and air buoyancy F f .
G p = m p g = ρ p V p g = 1 6 π d p 3 ρ p g
F f = ρ a g V p = 1 6 π d p 3 ρ a g
F s = G p F f = 1 6 π d p 3 ( ρ p ρ a ) g
Under the action of the total force F s , the fly ash particles accelerate to settle, and the air produces resistance force F r . The equation of motion of fly ash particles settling in the air is:
F s F r = m p d v p d t
The force of air resistance F r can be calculated by the following equation [18].
F r = 1 2 C a A p ρ a v p 2
For spherical particles there are
F r = 1 2 C a π d p 2 4 ρ a v p 2 = C a π d p 2 ρ a v p 2 8
Substituting Equations (5) and (8) into Equation (6), the expression for the settling speed of spherical particles is obtained.
d v p d t = ( ρ p ρ a ) g ρ p 3 C a ρ a 4 d p ρ p v p 2
The initial settling moment of fly ash particles in the air, gravity G p is greater than the sum of air buoyancy F f and air resistance F r , and fly ash particles had accelerated falling speed. As the falling speed gradually increases, the air resistance also increases until the gravity is equal to the air buoyancy and air resistance, and the fly ash particle settling speed reaches the maximum v pmax . After that, the fly ash particles began a uniform falling motion, at this time the acceleration of fly ash particles is zero, that is
d v p max d t = ( ρ p ρ a ) g ρ p 3 C a ρ a 4 d p ρ p v p max 2 = 0
v p max = 4 d p ( ρ p ρ a ) g 3 ρ a C a
According to a similar theory, the drag coefficient C a is a function of the Reynolds number R e p of fly ash particles [19], which can be expressed by the following equation:
C a = k R e p m
When the air is in the laminar region, R e p 1 , k = 24, m = 1, it is obtained that:
C a = 24 R e p = 24 μ a ρ a v p d p
Bringing Equation (13) into Equation (11), the maximum settling speed of spherical particles in the laminar flow region can be obtained as:
v p max = ( ρ p ρ a ) g d p 2 18 μ a
The true density of fly ash particles is calculated to be ρ p = 1200   kg / m 3 . According to the standard atmospheric table [20], at a temperature of 20 °C, the air density is ρ a = 1.205   kg / m 3 , and the aerodynamic viscosity is μ a = 1.810 × 10 5   Pa s .
The dust particles in the atmosphere are mainly PM2.5 to PM10 (2.5 μm–10 μm). When the particle size is less than 2.5 μm, it easily combines with moisture and other dust particles in the air to form airborne suspensions (e.g., aerosols). Larger particles such as PM50 and PM100 will settle down quickly and will not stay in the air for a long time. Particles with a size of 2.5 μm–10 μm can achieve settling in the air. The particle size distribution of the fly ash samples in this study is 2–11 μm with an average particle size of 6.1 μm, and 90% of the particles are larger than 2.5 μm, so the fly ash samples can achieve settling in the experimental environment. Therefore, the maximum settling speed of fly ash sample particles of different particle sizes in air at 20 °C ranges from
v d p = 2 μ m = 1.44 × 10 4   m / s v d p = 11 μ m = 4.36 × 10 3   m / s
The average settling speed of fly ash particles is calculated by taking the average particle size of 6.1 μm.
v d p = 6.1 μ m = 1.34 × 10 3   m / s
It is important to note that the superiority of this method is that it uses a physical model to describe the stationary condition, accelerated settling condition, and uniform settling condition of particles in the air in detail, which makes the particle settling process intuitive and clear. However, the actual atmospheric environment is far more complex than the laboratory atmosphere environment. The effects of temperature differences and wind speeds also need to be considered when simulating the atmosphere in the field.
Despite its shortcomings, the method is effective for deriving particle settling speeds in laboratory atmospheric environments and is useful for the analysis of particle settling processes in actual atmospheric environments.

3.4. SO2 Electrochemical Gas Sensor Measurement Error Experiment

Chinese air pollution emission standards for thermal power plants stipulate [21] that the emission concentration limit of soot from thermal power boilers and gas turbine units for air pollutants is 30 mg/m3. In the laboratory environment, the amount of fly ash settling per unit area when settling in a unit volume is 30 mg, then the final amount of fly ash settling on the surface of the SO2 electrochemical gas sensor inlet film is 8.6 × 10⁻³ mg. According to Equation (16), the time required for the complete settling of fly ash in a unit volume at a height of 1 m is 746.3 s (approximately 13 min).
There are two reasons for the selection of fly ash concentration.
The first reason is that the fly ash concentration in the actual scene is too small to affect the sensor measurement error in a short period of time. This experiment studied the impact of fly ash on the SO2 electrochemical gas sensor, with fly ash as the independent variable and the measured value of the SO2 sensor as the dependent variable. The concentration of fly ash discharged from the coal-fired boiler is as high as 800–1000 mg/m3. After dust removal and desulfurization, the concentration of fly ash discharged into the atmosphere must not exceed 30 mg/m3. We installed the measurement equipment 100 m away from the thermal power plant and found that the actual measurement of PM10 was only 1 mg/m3 at the highest and the measurement varied in real time. Initially, we chose 1 mg/m3 for the experiment and found that the fly ash concentration was so small that the amount deposited on the sensor surface for 1 day was essentially zero, so we finally chose the concentration limit of 30 mg/m3 for the experiment.
The second reason is that the concentration of 30 mg/m3 can achieve the effect of time acceleration, which is convenient for the life prediction of the sensor.
Under relatively ideal laboratory conditions, it can be considered that the deposition amount of 1 day at 30 mg/m3 is equivalent to the deposition amount of 30 days of continuous deposition accumulation at 1 mg/m3. By varying the days of continuous deposition, a time acceleration effect can be achieved.
When the SO2 electrochemical gas sensor was placed in the fly ash environment with a concentration of 30 mg/m3 for a long time, the theoretical deposition amounts at different deposition times are shown in Table 3. Three sets of sensors were used for testing in this study and the measurement error results were calculated from the average of three sets of sensor measurements.
The SO2 electrochemical gas sensor was placed inside the SO2 test chamber and the deposition amounts of fly ash under different deposition times were placed on the surface of the inlet film. Then the SO2 gas with concentrations of 10 ppm, 20 ppm, 30 ppm, 40 ppm, 50 ppm, 60 ppm, 70 ppm, and 80 ppm was introduced, respectively. The series of SO2 gas concentrations were set according to the range of the sensor. The range of the sensor is 100 ppm, so the concentration of SO2 gas was set to 10 ppm, 20 ppm, 30 ppm, 40 ppm, 50 ppm, 60 ppm, 70 ppm, and 80 ppm for the reliability of the test. These concentrations were not related to the SO2 concentration emitted from the power plant. Sensor measurements were obtained for deposition times of 30, 60, and 100 days, as shown in Table 4. The data processing results are shown in Figure 9 and Figure 10.
There are also two reasons for the selection of SO2 gas concentration.
The first reason is that the actual SO2 gas concentration is too small to be configured in the laboratory. The measurement equipment found that the actual value of SO2 gas concentration does not exceed 0.3 ppm (300 ppb), which is difficult to achieve when configured and not available from most standard gas suppliers so we chose ppm level concentration for the experiment.
The second reason is that selecting different concentrations to be measured within the range of the sensor enables a comprehensive study of the measurement error of the sensor. The range of the sensor used for the experiments was 0–100 ppm (resolution 5 ppb). In order to make it easier to configure the concentrations and process the data, 10 ppm, 20 ppm, 30 ppm, 40 ppm, 50 ppm, 60 ppm, 70 ppm, and 80 ppm were selected for the test.

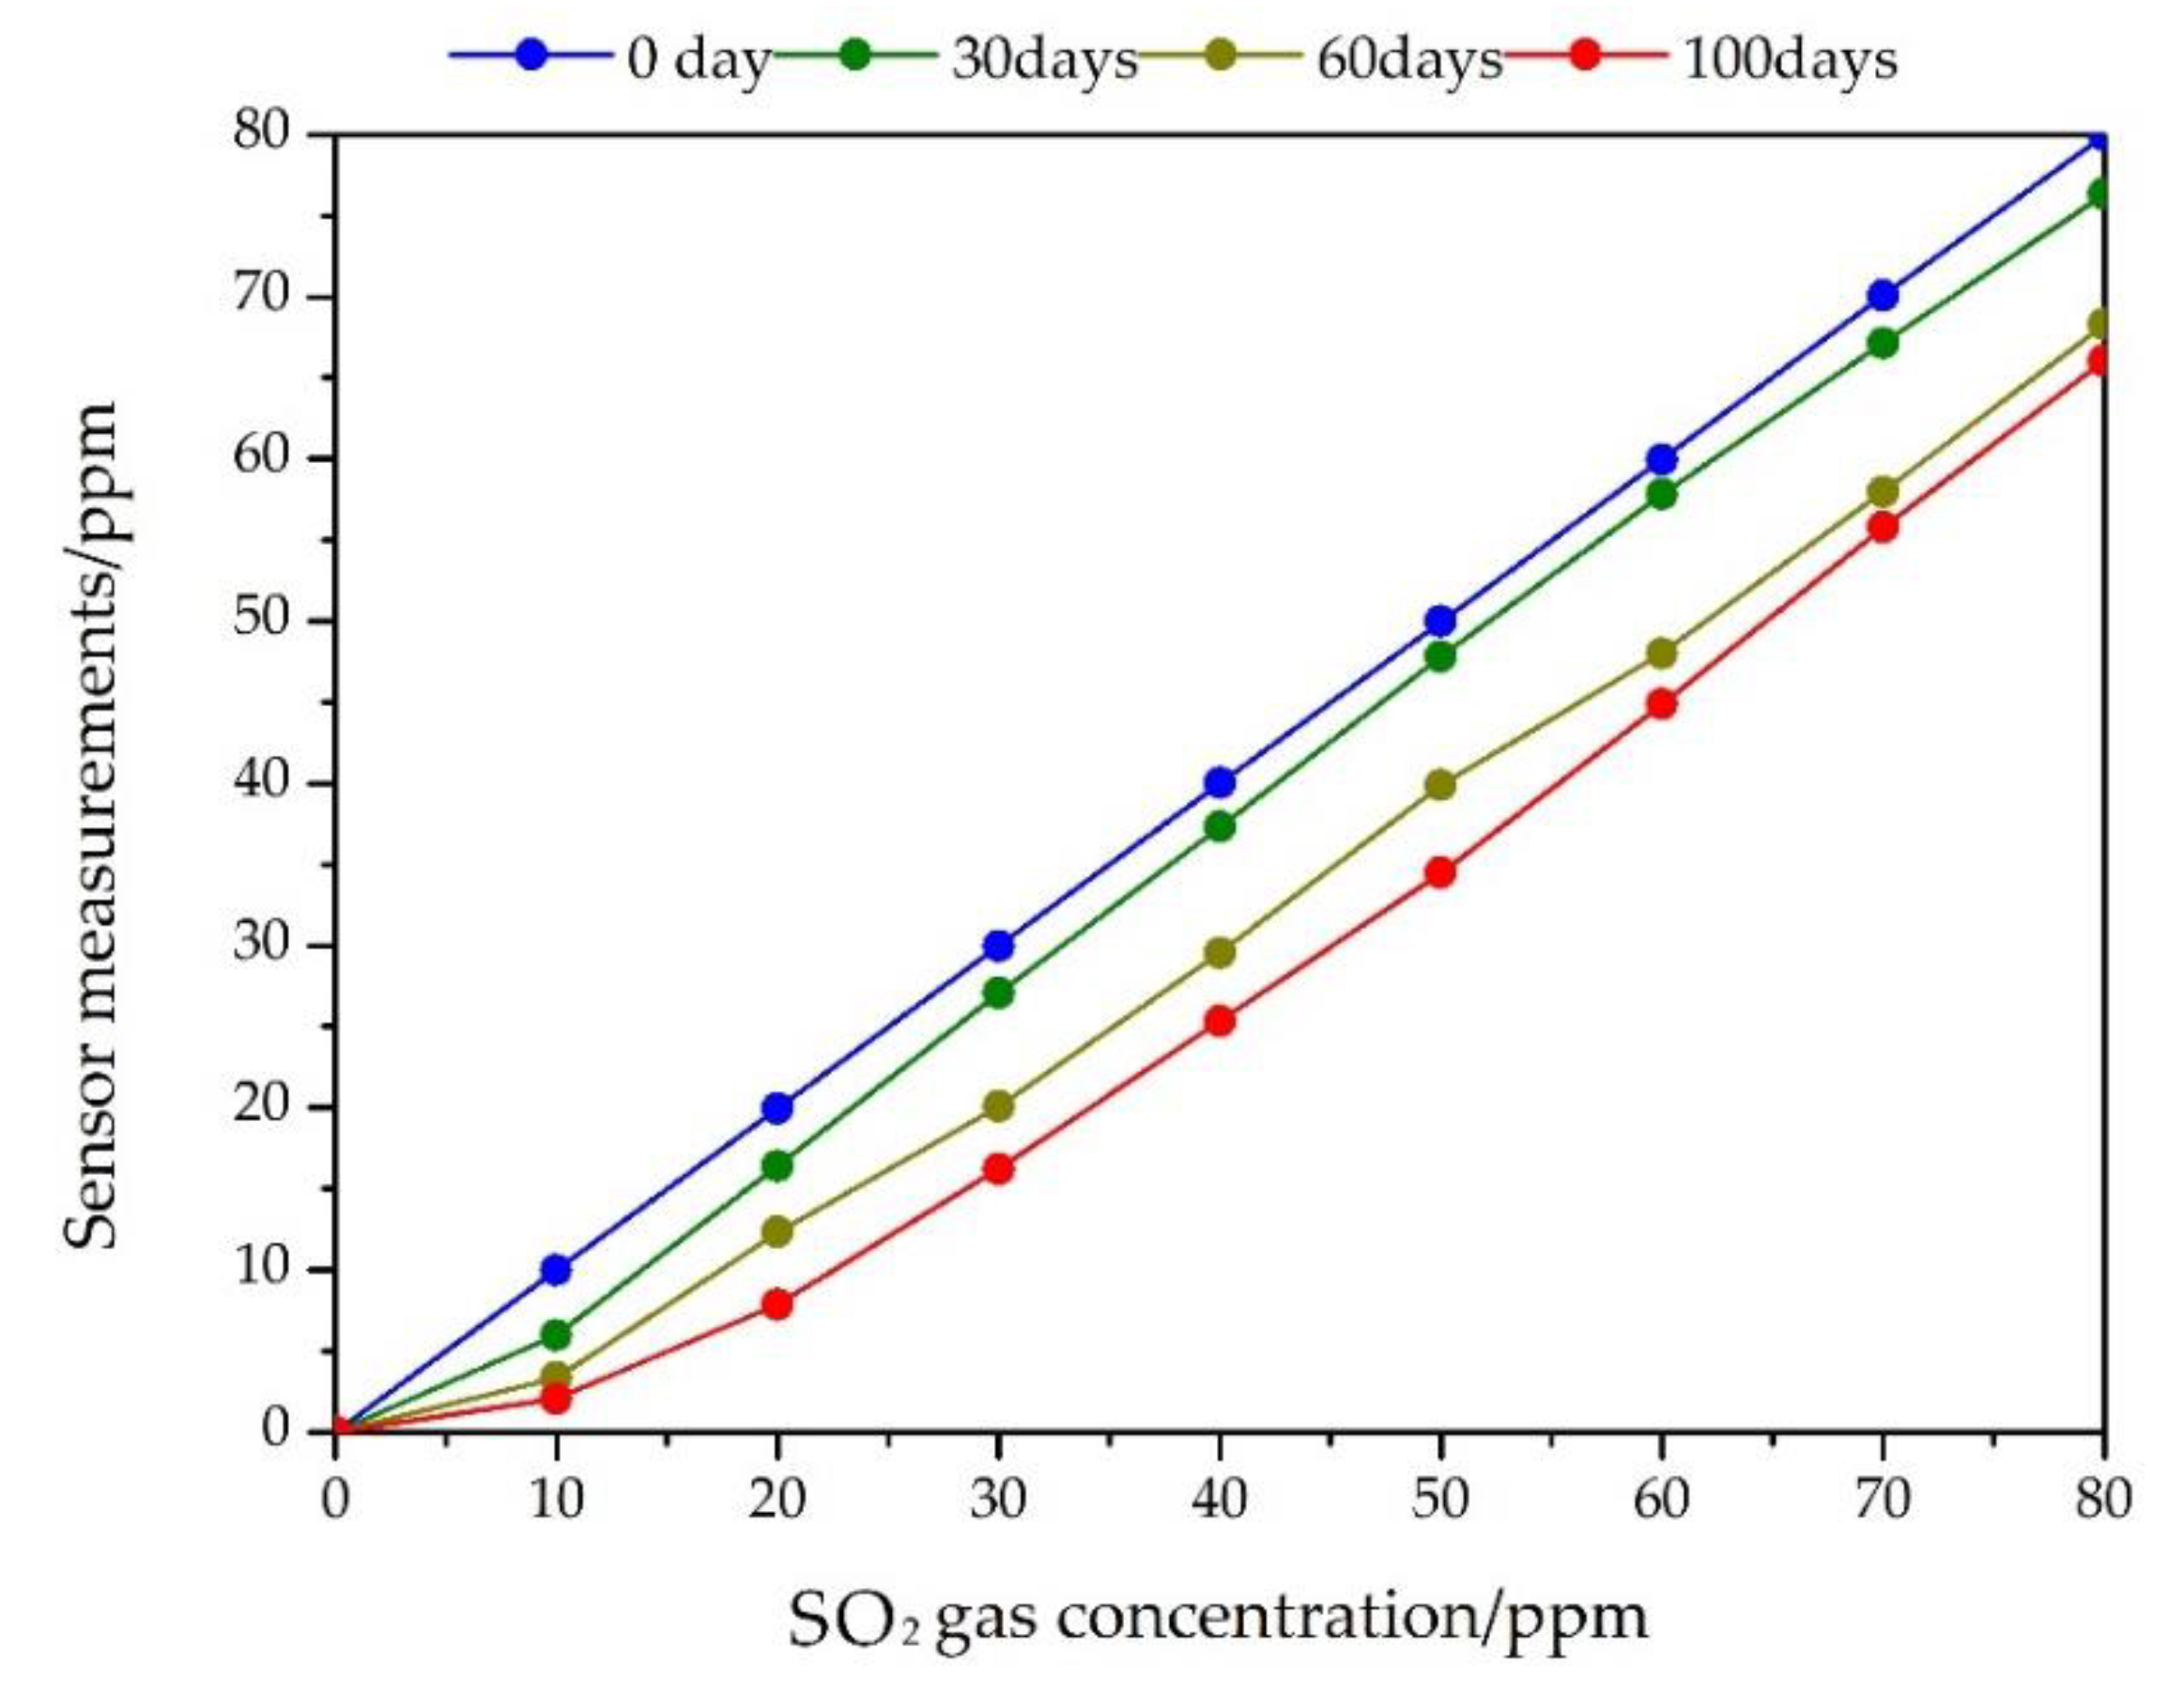
3.4.1. Impact of Deposition Time on Sensor Measurement Error

From the experimental data, the maximum value of sensor measurement error is 4.025 ppm at 30 days of deposition, 12.04 ppm for 60 days, and 15.505 ppm for 100 days, which indicates that the sensor measurement error increases as the deposition time increases. The measurement error is equal to the SO2 gas concentration value minus the sensor measurement values and then multiplied by 100%. (For example, the measurement error of deposition time of 30 days is 40.25% = (10−5.975) × 100%.)
The reason for this phenomenon is that the particle size distribution of fly ash ranges from 2–11 μm, while the pore size of the sensor inlet membrane material is 12–16 μm, with a porosity of 49%. Although the pore size of the inlet membrane material is larger than the particle size of fly ash, the pore size does not represent the filtration accuracy. When fly ash is deposited on the surface of the sensor inlet film, the inlet film material can block fly ash particles smaller than the pore size from entering the sensor electrode area through inertial collision, diffusion collision, ideal interception, and electrostatic adsorption [22], thus forming a single layer of deposited fly ash on the inlet film and blocking part of the pores, resulting in the reduction of the gas diffusion area S in Equation (2) and generating a negative measurement error, making the sensor measurement value is smaller than the standard concentration value.
Meanwhile, with the growth of deposition time and the increase of deposition layer thickness, the single-layer deposited fly ash will gradually develop into multi-layer deposited fly ash, so that the diffusion coefficient K in Equation (2) continues to decrease, leading to a decrease in the measured value and an increase in the measurement error.

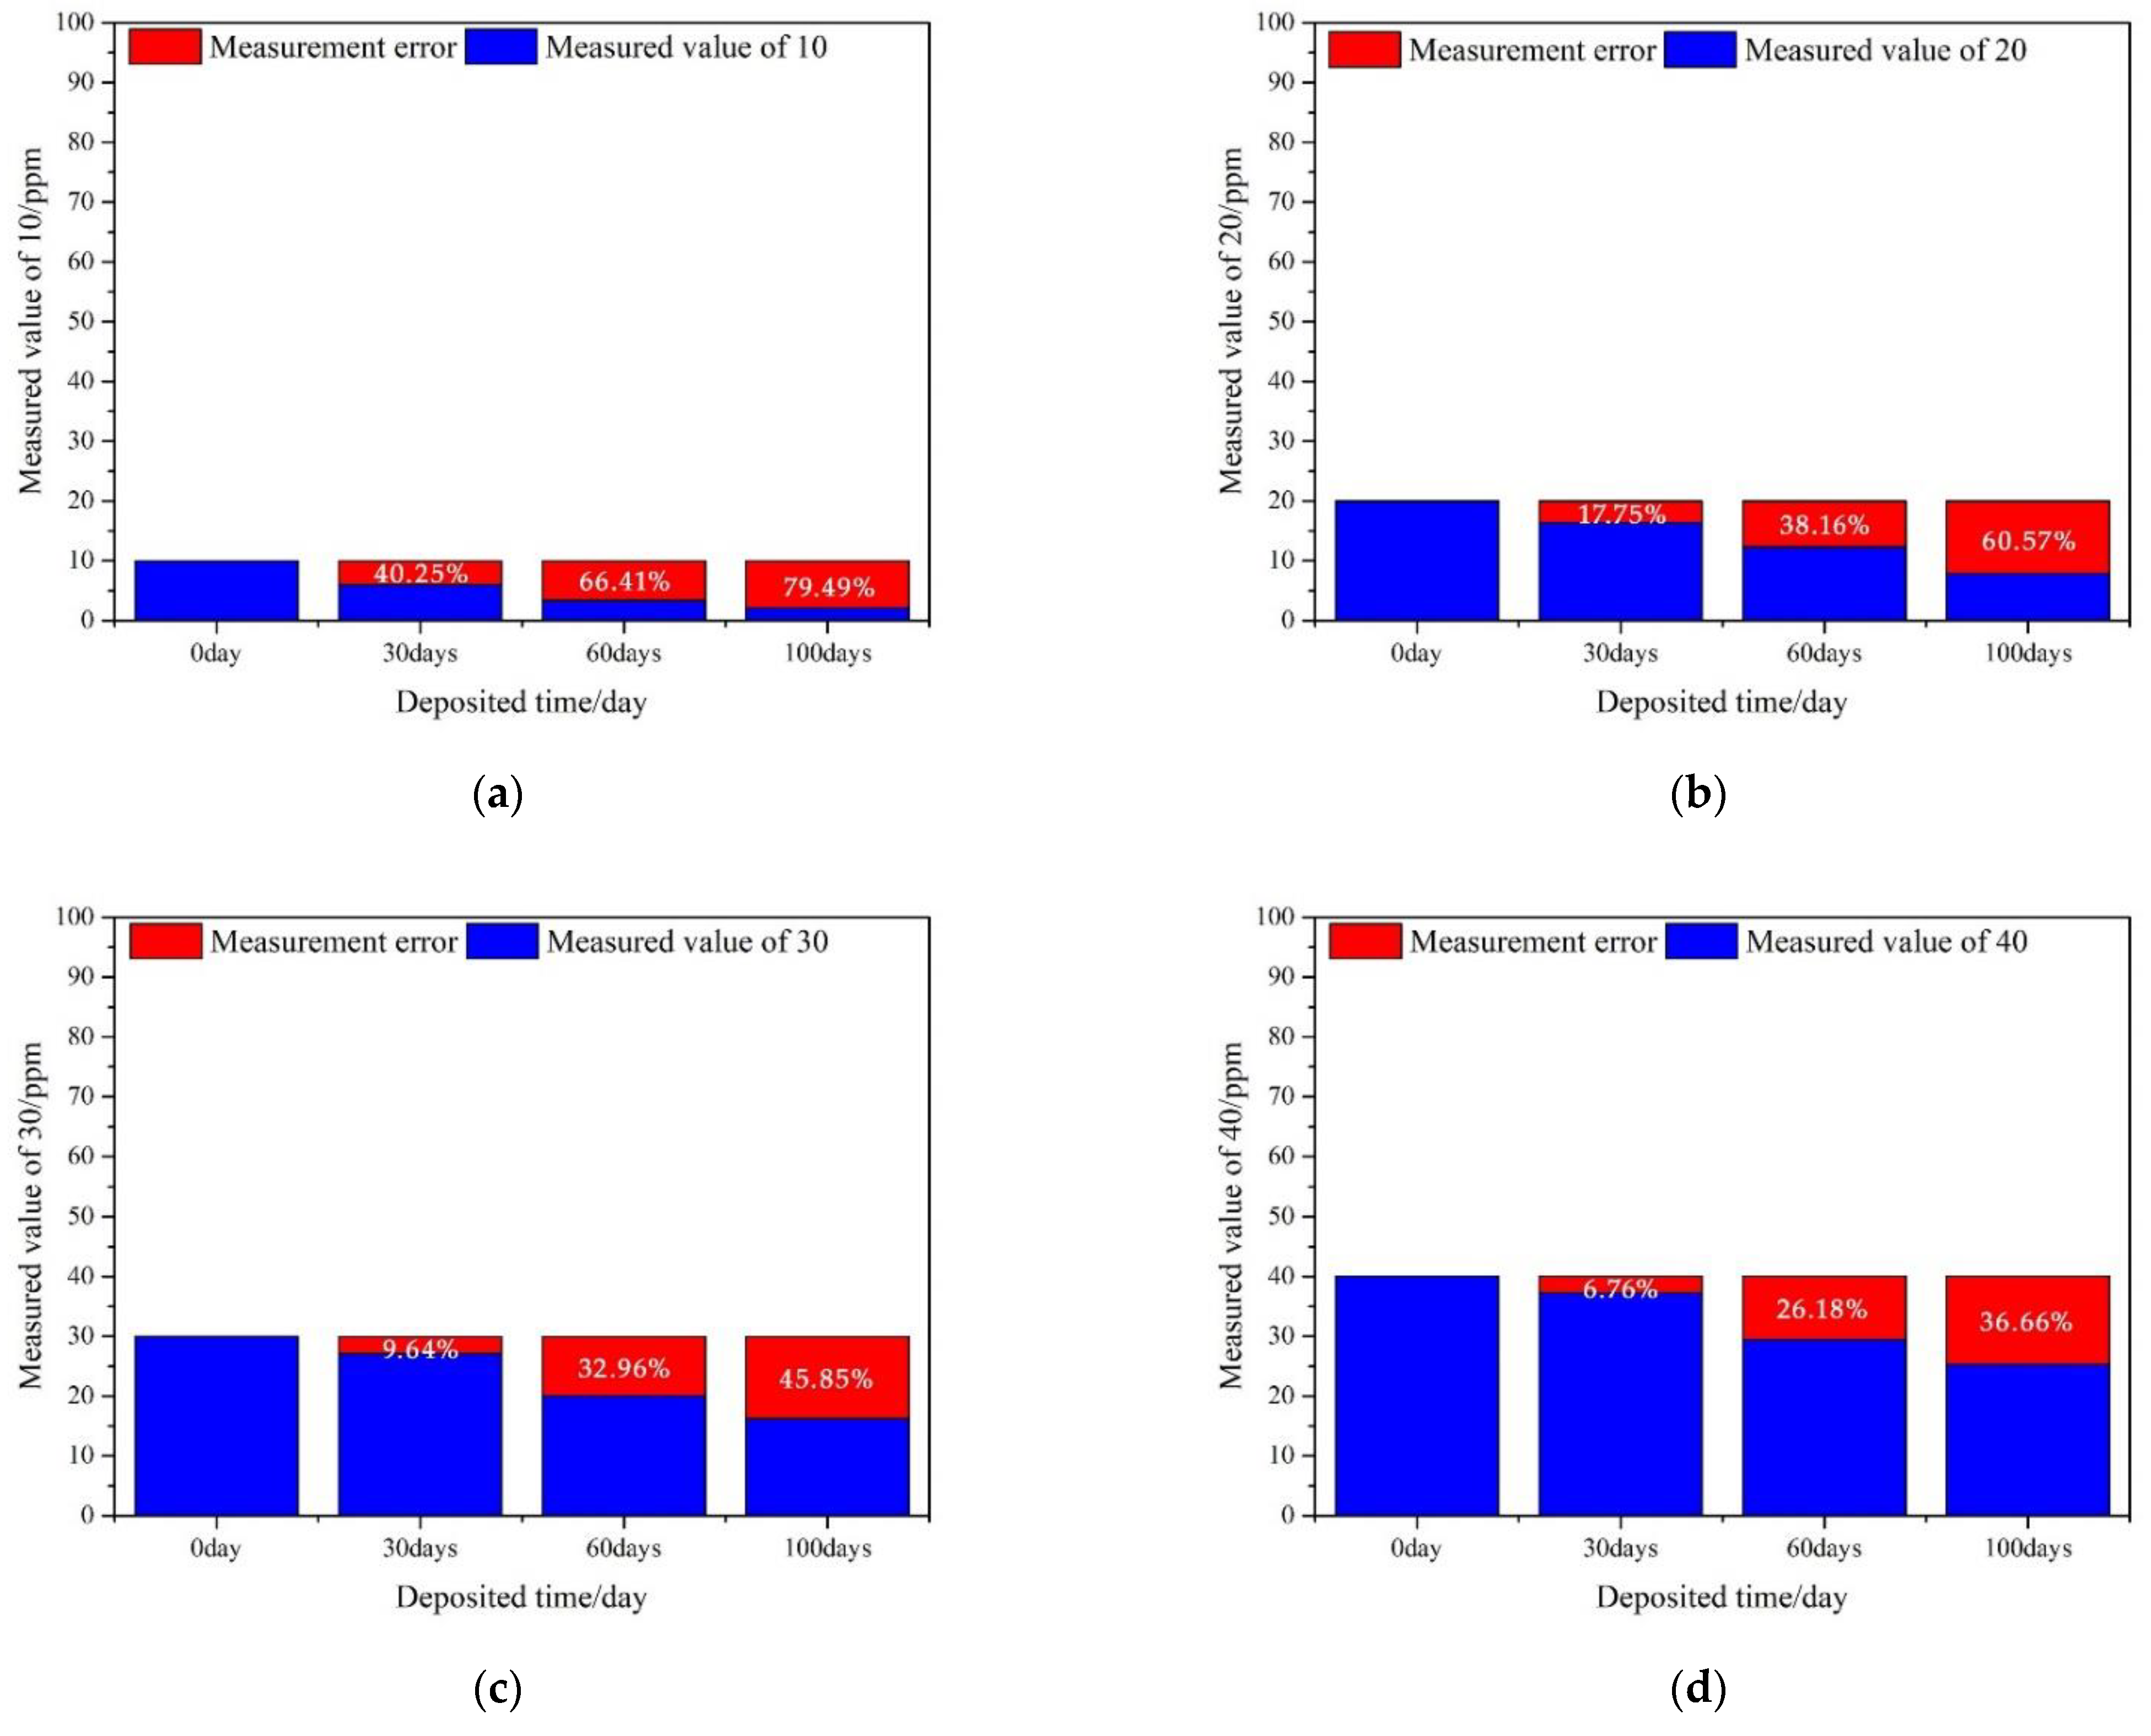
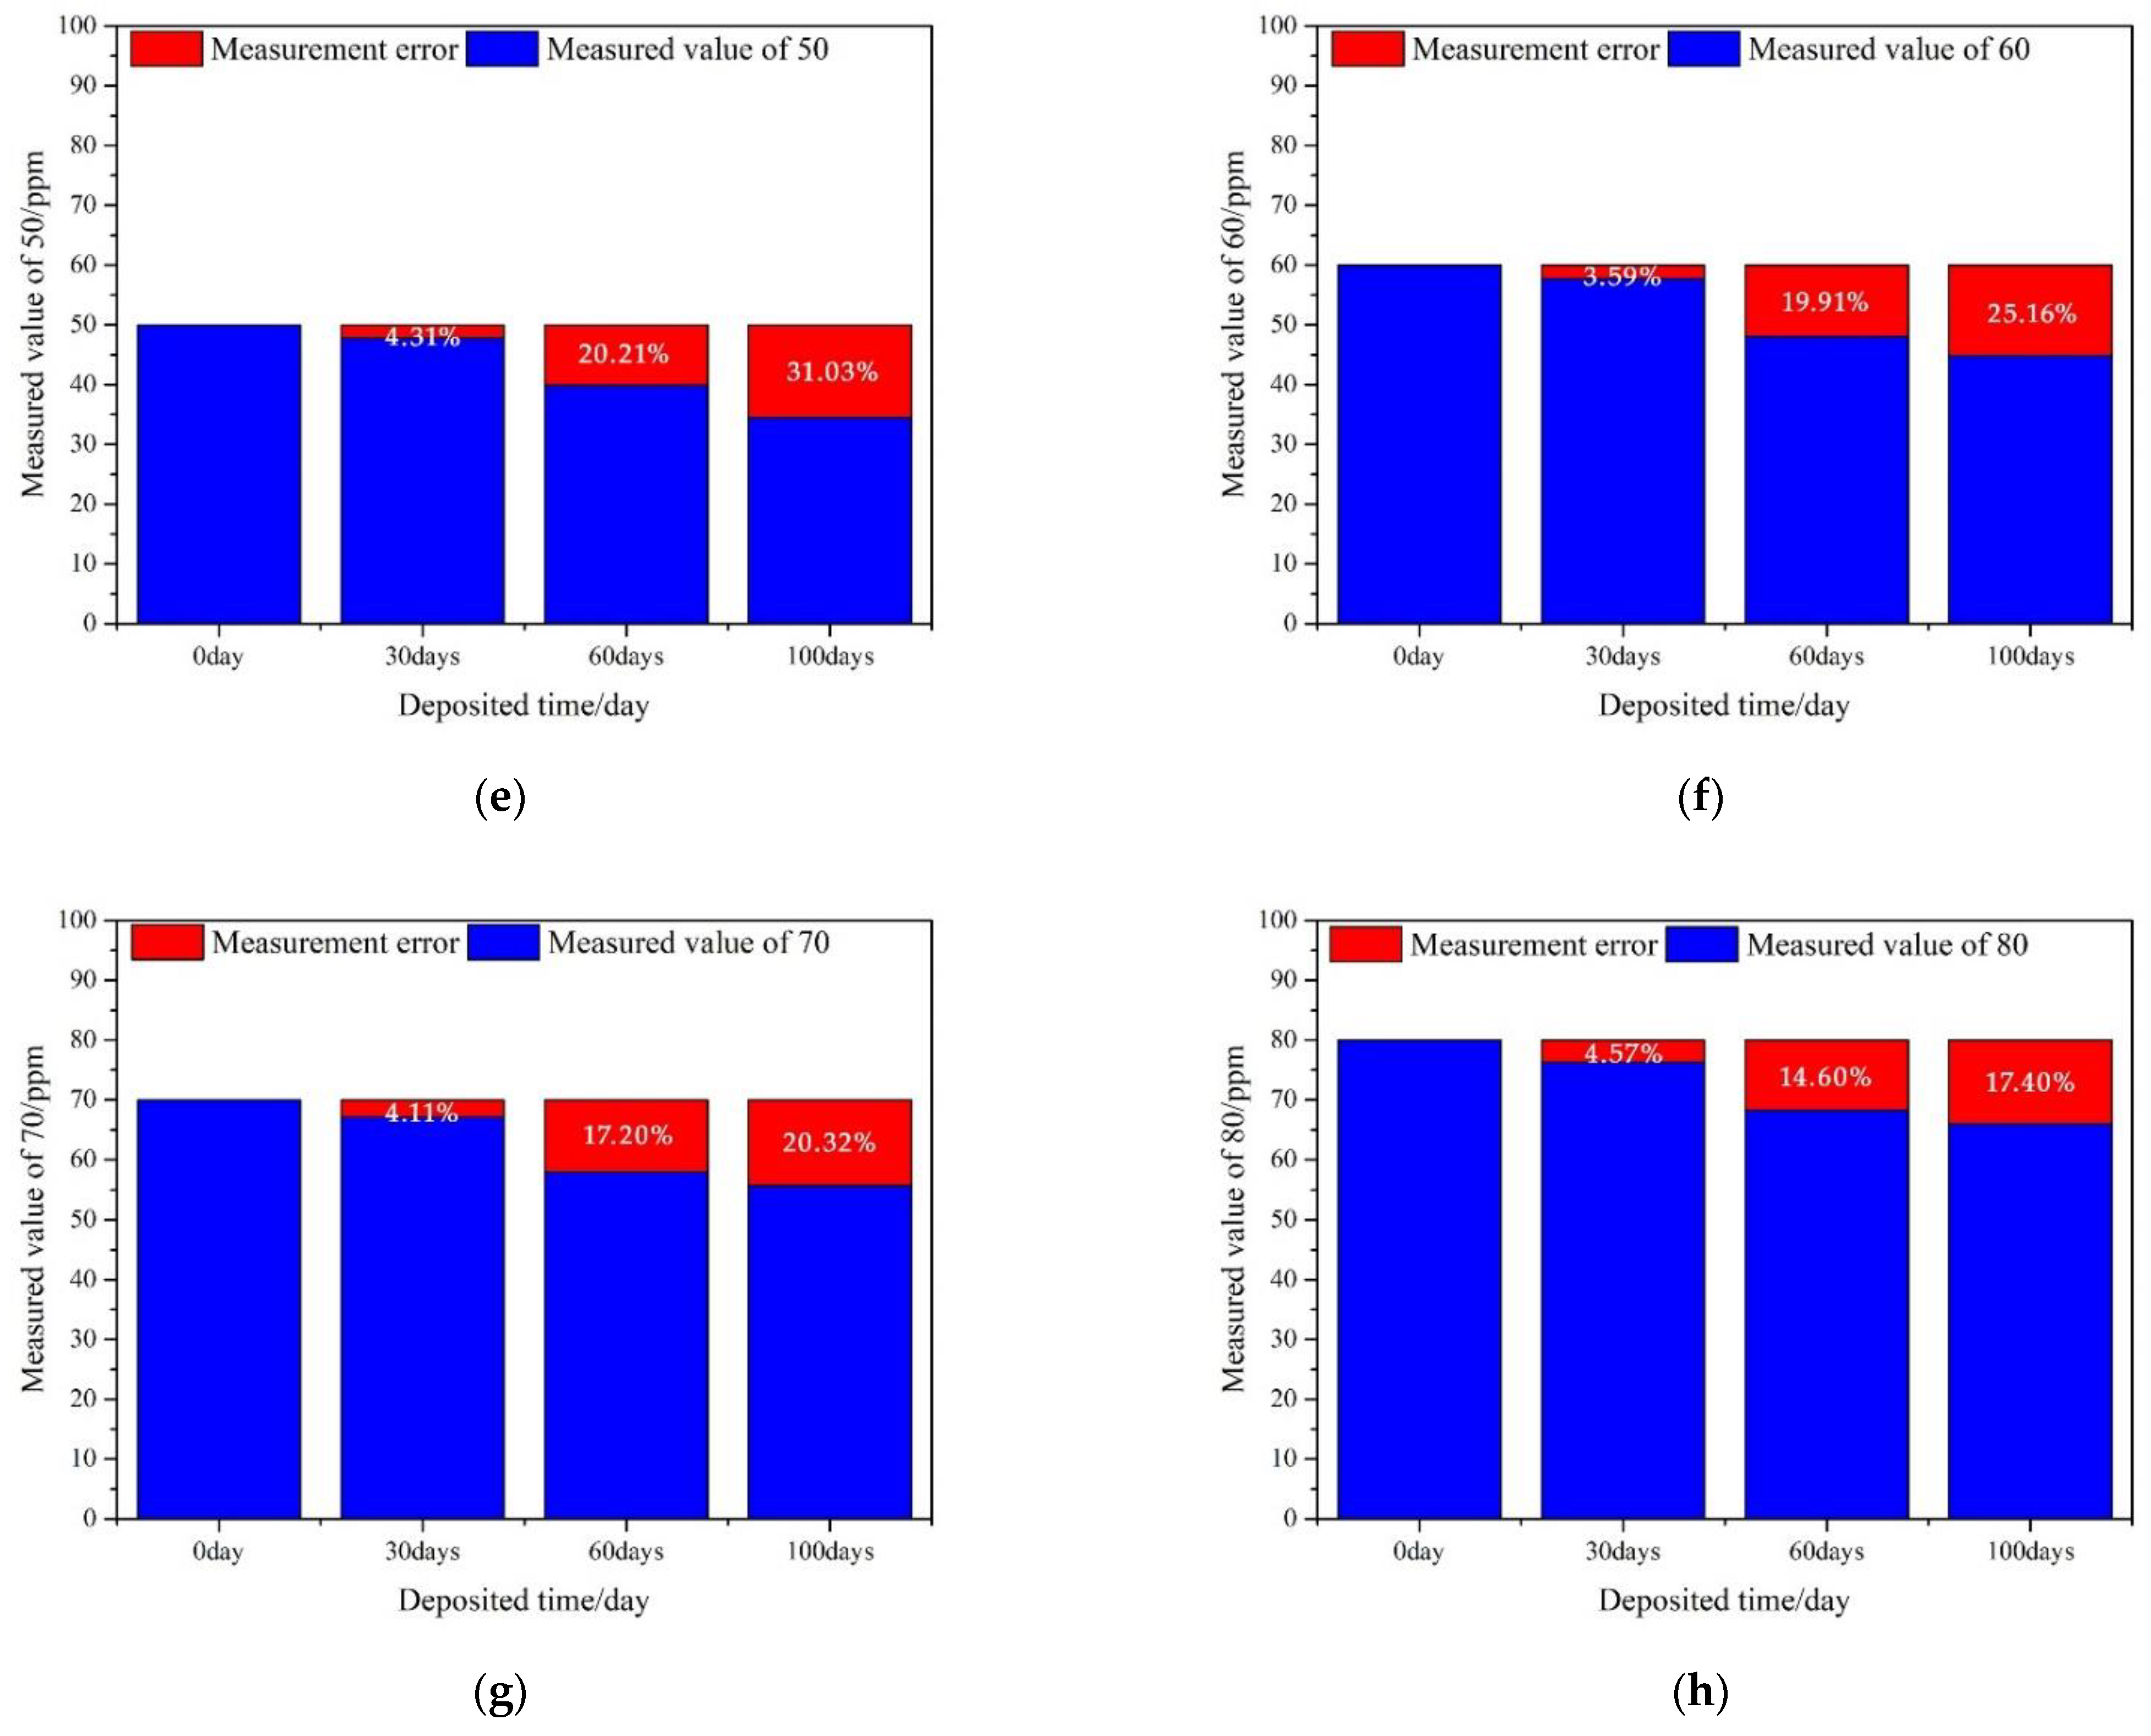
3.4.2. Impact of Fly Ash Deposition on the Measurement Error of Different Gas Concentrations

From Figure 10a, when the SO2 gas concentration was 10 ppm, the measurement error was 40.25% for depositing 30 days, 66.41% for depositing 60 days, and 79.49% for depositing 100 days.
From Figure 10b, when the SO2 gas concentration was 20 ppm, the measurement error was 17.75% for depositing 30 days, 38.16% for depositing 60 days, and 60.57% for depositing 100 days.
From Figure 10c, when the SO2 gas concentration was 30 ppm, the measurement error was 9.64% for depositing 30 days, 32.96% for depositing 60 days, and 45.85% for depositing 100 days.
From Figure 10d, when the SO2 gas concentration was 40 ppm, the measurement error was 6.76% for depositing 30 days, 26.18% for depositing 60 days, and 36.66% for depositing 100 days.
From Figure 10e, when the SO2 gas concentration was 50 ppm, the measurement error was 4.31% for depositing 30 days, 20.21% for depositing 60 days, and 31.03% for depositing 100 days.
From Figure 10f, when the SO2 gas concentration was 60 ppm, the measurement error was 3.59% for depositing 30 days, 19.91% for depositing 60 days, and 25.16% for depositing 100 days.
From Figure 10g, when the SO2 gas concentration was 70 ppm, the measurement error was 4.11% for depositing 30 days, 17.20% for depositing 60 days, and 20.32% for depositing 100 days.
From Figure 10h, when the SO2 gas concentration was 80 ppm, the measurement error was 40.57% for depositing 30 days, 14.60% for depositing 60 days, and 17.40% for depositing 100 days.
Fly ash deposition has a greater impact on the sensor when measuring low concentration gases. As the SO2 concentration increases, the sensor measurement error becomes smaller and smaller. The reason may be due to the fact that during the limited response time of the sensor, the SO2 gas flows at a certain rate from the outer region of the inlet film, where the concentration is higher, to the working electrode region, where the concentration is lower or even zero. Additionally, this flow rate is proportional to the difference in concentration between the two regions [23]. Therefore, under the same experimental conditions, SO2 gas with a concentration of 80 ppm reaches the working electrode region faster, and the effective SO2 concentration detected by the working electrode in the limited response time is higher and the measurement error is smaller.
The experiment also found that the timely removal of fly ash deposited on the sensor inlet film surface could reduce the sensor measurement error.

3.4.3. Actual Field Measurements and Limitations of Purely Experimental Methods

Measurement equipment had been installed at a distance of 100 m away from the thermal power plant, as shown in Figure 11, and the actual maximum measurement value of PM10 was only 1 mg/m3, which was much smaller than the concentration limit. The high measurement error was caused by the calculation using a fly ash concentration limit of 30 mg/m3 and not by the method of particle settling analysis. No relevant information on the research aspect of this paper has been found, and future studies are needed to address this lack of knowledge. Therefore, the limiting concentration of PM10 has been chosen for testing purposes due to test feasibility and experimental operability.
The limitation of the purely laboratory experimental method is that the fly ash concentration values used were much higher than the field values, resulting in rapid sensor failure, which in practice does not occur so quickly.

4. Conclusions and Recommendations

Fly ash deposition reduces the sensor gas diffusion area S and diffusion coefficient K, the longer the deposition time, the greater the sensor measurement error. Additionally, the fly ash deposition has a greater impact on the sensor when measuring low concentration gases, the higher the gas concentration, the smaller the measurement error.
The different particle sizes of fly ash produced from different coal thermal power plants may have different settling speeds, which requires the use of sensors with different pore inlet membranes for monitoring. Meanwhile, the same sensors may not have the same lifetime when used in different thermal power plants.
When using SO2 electrochemical sensors in environments with high concentrations of fly ash or dust, it is recommended to install a dust-proof device (such as an air-permeable filter membrane with a pore size of less than 4 μm) outside the sensor inlet membrane to block the entry of fly ash. At the same time, a heating function should be installed on the dust-proof device to prevent the filter pores from being blocked by moist fly ash. Timely cleaning of the deposited fly ash can also reduce the sensor measurement error and extend the service life of the sensor. Additionally, cleaning of deposited fly ash timely can also reduce sensor measurement errors and extend sensor life.

Author Contributions

Conceptualization, S.W. and W.C.; methodology, D.L. and W.C.; software, W.C.; validation, W.C.; formal analysis, D.L. and W.C.; investigation, D.L. and W.C.; resources, H.Z.; data curation, W.C.; writing—original draft preparation, W.C.; writing—review and editing, D.L. All authors have read and agreed to the published version of the manuscript.

Funding

This research was funded by the Research on anti-corrosion technology of power transmission and transformation engineering equipment in high pollution areas and development and application of atmospheric monitoring system, grant number 52053020002R.

Institutional Review Board Statement

Not applicable.

Informed Consent Statement

Not applicable.

Data Availability Statement

Not applicable.

Acknowledgments

The SEM used for fly ash morphology analysis is from the School of Power and Mechanical Engineering, Wuhan University.

Conflicts of Interest

The authors declare no conflict of interest.

Appendix A

Explanation of equation symbols in the main text.
  • Equations (3)–(5)
    m p : Mass of fly ash particles, kg
    ρ p : Density of fly ash particle density, kg/m3
    V p : Volume of fly ash particle, m3
    d p : Aerodynamic equivalent diameter of fly ash particle, m
    ρ a : Density of air, kg/m3
  • Equations (6) and (7)
    C a : Air resistance coefficient, dimensionless units
    A p : Maximum cross-sectional area of fly ash particles in the direction of motion, m2
    Defined by the parameter equivalent diameter
    v p : Speed of movement of fly ash particles in the air, m/s
  • Equations (12) and (13)
    R e p = d P ρ a v p μ a
    μ a : Dynamic viscosity of air, Pa s
    k, m: Constants

References

  1. National Energy Administration. The National Energy Administration Released the Statistical Data of National Power Industry in 2021. Government Website; 26 January 2021. Available online: http://www.nea.gov.cn (accessed on 8 April 2022).
  2. National Bureau of Statistics. China Statistical Yearbook; China Statistics Press: Beijing, China, 2021; Volume 3, pp. 154–196.
  3. Huang, L.; Hu, J.; Chen, M.; Zhang, H. Impacts of power generation on air quality in China—Part I: An overview. Resour. Conserv. Recycl. 2016, 121, 103–114. [Google Scholar] [CrossRef]
  4. Liu, Y.; Yan, J.; Xu, W.; Liu, M. Emission characteristics of conventional air pollutants in coal-fired power plants after ultra-low emission transformation. J. Environ. Sci. 2020, 40, 1967–1975. [Google Scholar]
  5. Chu, Y.; Cheng, Z.; Dong, Y. The harm of dust environment in thermal power plant and its prevention countermeasures. J. Environ. Dev. 2018, 30, 68–70. [Google Scholar]
  6. Zhai, S. Study on the impact of pollutants in thermal power plants on the environment. J. Shandong Ind. Technol. 2018, 6, 184. [Google Scholar]
  7. Cao, D. SO2 pollution, harm and control technology in China. J. Environ. Sci. Surv. 2013, 32, 73–74. [Google Scholar]
  8. Liu, X.; Fu, Z.; Zhang, B.; Zhai, L.; Meng, M.; Lin, J.; Zhuang, J.; Wang, G.G.; Zhang, J. Effects of sulfuric, nitric, and mixed acid rain on Chinese fir sapling growth in Southern China. Ecotoxicol. Environ. Saf. 2018, 160, 154–161. [Google Scholar] [CrossRef] [PubMed]
  9. Li, G. Harm of nitrogen oxides to environment and pollution control technology. J. Shanxi Chem. Ind. 2019, 39, 123–125. [Google Scholar]
  10. Liang, J.; Zheng, J.; Han, M. Nitrogen oxide and its treatment technology. J. Sci. Technol. Innov. Appl. 2021, 24, 120–122. [Google Scholar]
  11. Liang, Y.; Tian, F.; Feng, W. Research progress of coal mine gas detection technology in China. J. Coal 2021, 46, 1701–1714. [Google Scholar]
  12. Zhao, C.; Niu, G.; Gong, H. Research progress of electrochemistry and semiconductor SO2 gas sensor. J. Funct. Mater. Devices 2020, 26, 143–159. [Google Scholar]
  13. Wu, Z. Colloidal Electrolyte Electrochemical Gas Sensor; Zhengzhou University: Zhengzhou, China, 2020; p. 7. [Google Scholar]
  14. Alphasense. ANN104 How Electrochemical Gas Sensors Work. Available online: https://www.alphasense.com/downloads/application-notes/ (accessed on 12 August 2021).
  15. Hai, T.; Yang, Y.; Yan, M. Study on potentiostatic electrolytic electrochemical gas sensor. J. Sens. Microsyst. 2020, 39, 63–65. [Google Scholar]
  16. Li, S.; Jin, G.; Chen, B. Effect of temperature on electrochemical NH3 gas sensor. J. Mod. Comput. (Prof. Ed.) 2016, 28, 3–6. [Google Scholar]
  17. Stationary Source Emission—Determination of Sulfur Dioxide—Fixed Potential by Electrolysis Method; HJ 57-2017; China Environmental Science Press: Beijing, China, 2017; p. 2.
  18. Qiang, N.; Ji, X.; Xu, B. Air Pollution Control Engineering; Chemical Industry Press: Beijing, China, 2015; pp. 35–40. [Google Scholar]
  19. Zhao, B. Air Pollution Control Engineering; Chemical Industry Press: Beijing, China, 2017; pp. 31–32. [Google Scholar]
  20. Lei, J.; Wu, X.; Wu, J. Aerodynamics; Beijing University of Technology Press: Beijing, China, 2015; p. 348. [Google Scholar]
  21. GB 13223-2011; Emission Standard of Air Pollutants for Thermal Power Plants. China Environmental Science Press: Beijing, China, 2011; p. 3.
  22. Cai, J. Air Filtration ABC; China Construction Industry Press: Beijing, China, 2002; p. 2. [Google Scholar]
  23. John, C. Crittenden. MWH’s Water Treatment: Principles and Design; East China University of Technology Press: Shanghai, China, 2016; p. 5. [Google Scholar]
Figure 1. MIRA3 field emission scanning electron microscope.
Atmosphere 13 01512 g001
Figure 2. Structure diagram of SO2 electrochemical gas sensor.
Atmosphere 13 01512 g002
Figure 3. Schematic diagram of the electrochemical gas sensor.
Atmosphere 13 01512 g003
Figure 4. Fly ash sample.
Atmosphere 13 01512 g004
Figure 5. Fly ash drying process. (a) Tray size. (b) Electric constant temperature blast drying oven. (c) The comparison of dried before and dried after fly ash.
Atmosphere 13 01512 g005aAtmosphere 13 01512 g005b
Figure 6. SO2 electrochemical gas sensor test chamber.
Atmosphere 13 01512 g006
Figure 7. Fly ash particle morphology.
Atmosphere 13 01512 g007
Figure 8. The settling motion process and forces on fly ash particles in air.
Atmosphere 13 01512 g008
Figure 9. Sensor measurements at different concentrations of SO2 gas and different fly ash deposition times.
Atmosphere 13 01512 g009
Figure 10. Measurement errors of sensors with different deposition times for the same concentration of SO2 gas: (a) 10 ppm measurement error; (b) 20 ppm measurement error; (c) 30 ppm measurement error; (d) 40 ppm measurement error; (e) 50 ppm measurement error; (f) 60 ppm measurement error; (g) 70 ppm measurement error; (h) 80 ppm measurement error.
Atmosphere 13 01512 g010aAtmosphere 13 01512 g010b
Figure 11. Measurement equipment around thermal power plants.
Atmosphere 13 01512 g011
Table 1. Performance parameters of SO2 electrochemical gas sensor.
CategoryIndexValue
PerformanceSensitivity275 to 475 nA/ppm at 2 ppm SO2
Response timet90 < 30 s, from zero to 2 ppm SO2
Zero current−80 to +80 nA in zero air at 20 °C
Noise±2 standard deviations (5 ppb equivalent)
Range100 ppm limit of performance warranty
Linearity0 to −2 ppb error at 100 ppm SO2, linear at zero and 10 ppm SO2
Overgas limit200 maximum ppm for stable response to gas pulse
LifetimeZero drift<±20 ppb equivalent change/year in lab air
Sensitivity drift<±15% change/year in lab air, monthly test
Operating life>36 months until 50% original signal (24 months warranty)
EnvironmentalSensitivity at −20 °C70%~82%, at 2 ppm SO2
Sensitivity at 50 °C95%~110%, at 2 ppm SO2
Zero at −20 °C0 to−10 nA change from 20 °C
Zero at 50 °C10 to 30 nA change from 20 °C
Key SpecificationTemperature range−30~50 °C
Humidity range15~90%RH
Pressure range80~120 kPa
Storage period6 months (at 3 to 20 °C)
Load resistor33~100 Ω
Weight13 g
Data from the manual of SO2 electrochemical gas sensor.
Table 2. Particle size distribution of fly ash.
Distr./μmMean/μmAmountFreq./%
2–2.92.45910.34
2.9–3.83.351112.64
3.8–4.74.2578.05
4.7–5.65.151618.39
5.6–6.56.0578.05
6.5–7.46.95910.34
7.4–8.37.8589.2
8.3–9.28.7578.05
9.2–10.19.6589.2
10.1–1110.5555.74
Data from Nano Measure software statistics.
Table 3. Deposition amounts of fly ash at different deposition times.
Deposition Time1 h1 day30 days60 days100 days
Deposition Amount/mg39.7 × 10−30.9528.55795
Data from experimental measurements.
Table 4. Sensor measurements for different concentrations of SO2 gas at different deposition times.
Sensor Measurement Values/ppmDeposition TimeMeasurement Error/%
0 Day30 Days60 Days100 Days30 Days60 Days100 Days
SO2 gas concentration/ppm00000000
10105.9753.3592.05140.2566.4179.49
2019.94416.40412.3337.86417.7538.1660.57
3029.95527.06628.08116.2229.6432.9645.85
4040.00037.29829.5325.3386.7626.1836.66
5049.97547.82339.87434.4704.3120.2131.03
6059.99457.79348.01044.8643.5919.9125.16
7070.00067.12657.96055.7734.1117.2020.32
8079.96076.30868.28866.0454.5714.6017.40
Data from experimental measurements and calculations.
Publisher’s Note: MDPI stays neutral with regard to jurisdictional claims in published maps and institutional affiliations.

