Article

Numerical Simulation of a Typical Convective Precipitation and Its Cloud Microphysical Process in the Yushu Area, Based on the WRF Model

1
School of Atmospheric Sciences, Plateau Atmosphere and Environment Key Laboratory of Sichuan Province, Joint Laboratory of Climate and Environment Change, Chengdu University of Information Technology, Chengdu 610225, China
2
Quanzhou Meteorological Bureau, Quanzhou 362000, China
*
Author to whom correspondence should be addressed.
Atmosphere 2022, 13(8), 1311; https://doi.org/10.3390/atmos13081311
Submission received: 30 June 2022 / Revised: 14 August 2022 / Accepted: 15 August 2022 / Published: 17 August 2022
(This article belongs to the Special Issue Land-Atmosphere Interaction on the Tibetan Plateau)

Abstract

:
Cloud microphysical processes significantly impact the time variation and intensity of precipitation. However, due to the high altitude of the Tibetan Plateau (TP) and the lack of observational data, the understanding of cloud microphysical processes on the TP is relatively insufficient, affecting the accuracy of precipitation simulations around the TP. To further reveal the characteristics of convective precipitation and cloud microphysical structure over the TP, the mesoscale numerical model, WRF, and various observational data were used to simulate and evaluate typical convective precipitation in the Yushu area, which was recorded from 11 to 12 August 2020. The results showed that the combination of the Lin scheme in the WRF model could effectively reproduce this case’s characteristics and evolution process. In the simulation process, the particles of each phase were distributed at different altitudes, and their mass and density over time reflected the characteristics of surface precipitation changes. Among the particles mentioned above, rainwater contributed the most to the initiation and growth of graupel particles. Further research established that the initiation of graupel was mainly affected by the freezing effect of rainwater and cloud ice, while the growth of graupel was influenced primarily by the collision of graupel particles and rainwater. On the whole, from the evolution characteristics of microphysical processes over time, it was found that the ice phase process plays an essential role in this typical convective precipitation.

1. Introduction

The Tibetan Plateau (TP) is a large landform with the highest average altitude and largest area in the world. As the “roof of the world” and “third pole”, it has significant dynamic and thermal effects on the East Asian climate, the Asian monsoon process, and the northern hemisphere’s atmospheric circulation [1,2,3]. At the same time, as the “water tower of the world”, its land–sea–air interaction profoundly impacts the global natural and climatic environment [4]. In summer, the warm and humid airflow over the TP provides sufficient water vapor to cause the frequent occurrence of convective precipitation over the TP, then changing the vertical profile of atmospheric temperature and humidity over the TP, resulting in abnormal water and heat exchange and circulation over the TP [5,6,7]. Therefore, it is significant to carry out research on convective precipitation over the TP.
The rainy weather seen over the TP is usually related to water vapor transported by the warm southward current [8]. Precipitation on the TP gradually decreases from southeast to northwest, and summer precipitation accounts for about 60–70% of the total annual precipitation [9]. The TP convective system (CS) plays an important role in precipitation over the TP and its adjacent areas. The CS is strong in summer and weak in winter. Therefore, the frequency of convective precipitation peaks during the summer monsoon season from May to September. During this period, the TP is dominated by low-level monolayer and stratiform clouds [10]. Even in winter, the CS contributes up to 70% of precipitation in the central and eastern TP [11,12]. Surface heating essentially leads to the high frequency of afternoon convection, and the cloud top of the CS is positively correlated with the intensity of surface heat flux [13]. Most of the summer precipitation over the TP circulates through local evapotranspiration, and the land-atmosphere interaction has a more significant impact on summer precipitation than in winter [14].
Convective clouds can gather denser and larger ice particles than stratiform clouds, causing twice as much precipitation as stratiform clouds [15]. During weak convection, the warm rain process in the rainfall center produces more significant precipitation than the cold rain process [16]. On the TP, the main ice-crystal microphysical processes are the depositional growth and self-transformation of ice crystals into snow. The sedimentation of graupel plays a crucial role in the formation of precipitation, but the melting of snow is less significant, which is quite different from other regions [17]. Although the direct contribution of warm-cloud microphysical processes to ground precipitation is small, they make an essential contribution to the formation of supercooled raindrops, which is a necessary precondition for forming graupel embryos through a non-uniform freezing process. The growth of graupel particles mainly depends on the aggregation of water and snow particles in the riming process of supercooled clouds [18].
Numerical models are widely used in the study of cloud precipitation processes because they can successfully describe the process of cloud development and precipitation generation. Among the various models, the weather research and forecasting (WRF) model considers multiple physical processes in detail and has relatively rich parameterization schemes, so it is the most widely used model. Studies have shown that the optimal scheme is highly dependent on the weather or climate state and application scale, for which no one scheme generally performs best [19]. The choice of TP regimen also depends on the specific purpose of the study [20]. The comparison of different microphysical schemes shows that the Thompson scheme is superior to the simulations of other schemes in terms of the temporal and spatial variation of precipitation from 1 week to 3 months [21,22,23]. Compared with the Kesser, Ferrier, and WRF single-moment 3-, 5-, and 6-level schemes, the Lin scheme performs the best in the simulation of TP heavy precipitation events [24].
Study of the microphysical processes over the TP is of great significance for an in-depth understanding of TP precipitation and the water cycle and for improving the numerical prediction level. Based on this consideration, the current paper selects a typical convective precipitation process for numerical simulation research, using the TP’s observation data in the Yushu area. Based on the results, the structure of typical convective clouds in the TP summer and the water transformation process in the clouds were analyzed and studied, and the microphysical mechanism of TP cloud precipitation was explored.

2. Data and Methods

2.1. Observational Data

Yushu Tibetan Autonomous Prefecture, located in the southwest of Qinghai Province, China, is the study area of this paper. This paper uses site observation data, FY-2G satellite product data, and Ka-band millimeter-wave cloud radar data for comparison with the WRF simulation results. A detailed introduction follows.

2.1.1. Regular Observational Data

Observational data from China’s surface meteorological stations were used to evaluate the model’s accumulated precipitation. As shown in Figure 1, there are six stations, namely, Yushu (marked as 1), Qumalai (marked as 2), Zhiduo (marked as 3), Zaduo (marked as 4), Nangqian (marked as 5), and Qingshuihe (marked as 6).

2.1.2. Satellite Data

FY-2G is from the third batch of operational geostationary satellites in the FY-2 series, launched on 31 December 2014. The subsatellite point of FY-2G changed from 99.5° E to 105° E and finally changed to 99.2° E over the equator in April 2018. FY-2G is the latest satellite to have Class 2 and 3 products since 2015. So far, FY-2G has carried the best performing radiometer of any FY-2 family of operational satellites. Compared with the second batch of satellites, such as FY-2E, FY-2G can scan specific areas with more flexibility and higher temporal resolution. Its use is essential in meteorological disaster monitoring, early warning, prevention, and disaster reduction [25,26]. The FY-2G blackbody brightness temperature TBB data were used here.

2.1.3. Radar Data

The radar data was sourced from the Ka-band millimeter-wave cloud radar (Ka-MMCR) in Yushu Meteorological Bureau, Qinghai. This radar uses a solid-state, Doppler system to obtain cloud echo and motion information from the air by transmitting pulsed electromagnetic waves and receiving backscattered signals from cloud particles, thereby obtaining reflectance, radial velocity, velocity spectrum width, and other data [27]. The peak power is greater than 100 W, the operating frequency is 33.44 GHz (wavelength is 8.9 mm), the dynamic range is 75 dB, and the pulse repetition frequency is 8333 Hz. The radar takes readings toward the zenith, the antenna beam width is 0.3°, the time resolution is 5 s, the spatial resolution is 30 m, and the detection height range is 0.12–15.8 km. Based on this radar detection, a number of studies have revealed the characteristics of the vertical structure of clouds and the diurnal variation of precipitation on the Qinghai-Tibet Plateau in summer [28,29,30,31].

2.2. Mode Settings

The model version 4.2.1 of WRF was used, and the CFSR reanalysis data were used as the initial and boundary forcing fields. The simulation time was from 00:00 UTC on 10 August 2020 to 00:00 UTC on 12 August 2020. As shown in Figure 1, the mode adopts three layers of nesting, with the Yushu meteorological station acting as the center of the simulation area. The model was vertically divided into 38 layers with unequal spacing; the number of nested grid points was 181 × 181, 301 × 301, and 361 × 361. The horizontal resolutions were 9 km, 3 km, and 1 km, respectively. The time steps were 27 s, 9 s, and 3 s, respectively. The following parameterization schemes were selected during the simulation: the rapid radiative transfer model (RRTM) long-wave radiation scheme [32], the Dudhia short-wave radiation scheme [33], and the Grell–Devenyi cumulus parameterization scheme (only used in the outermost layer) [34], the MYJ boundary layer parameterization scheme [35,36], and the RUC land surface process [37]. To compare the difference between microphysics parameterization schemes, six cloud microphysics parameterization schemes were selected to evaluate the simulation ability of different cloud microphysics parameterization schemes; these are Lin, WSM5, WSM6, New Thompson, Morrison, and Eta, which have worked well in previous studies [38,39,40].

2.3. Statistical Methods

Statistical indicators, such as the correlation coefficient (R), average relative error (MRE), and relative deviation (BIAS) are selected to evaluate the simulated results. The relevant statistics are calculated as follows:
R = i = 1 n x x ¯ x o b s x ¯ o b s i = 1 n x x ¯ 2 × i = 1 n x o b s x ¯ o b s 2
M R E = 1 n i = 1 n x o b s x x o b s
B I A S = i = 1 n x x o b s i = 1 n x o b s × 100 % .

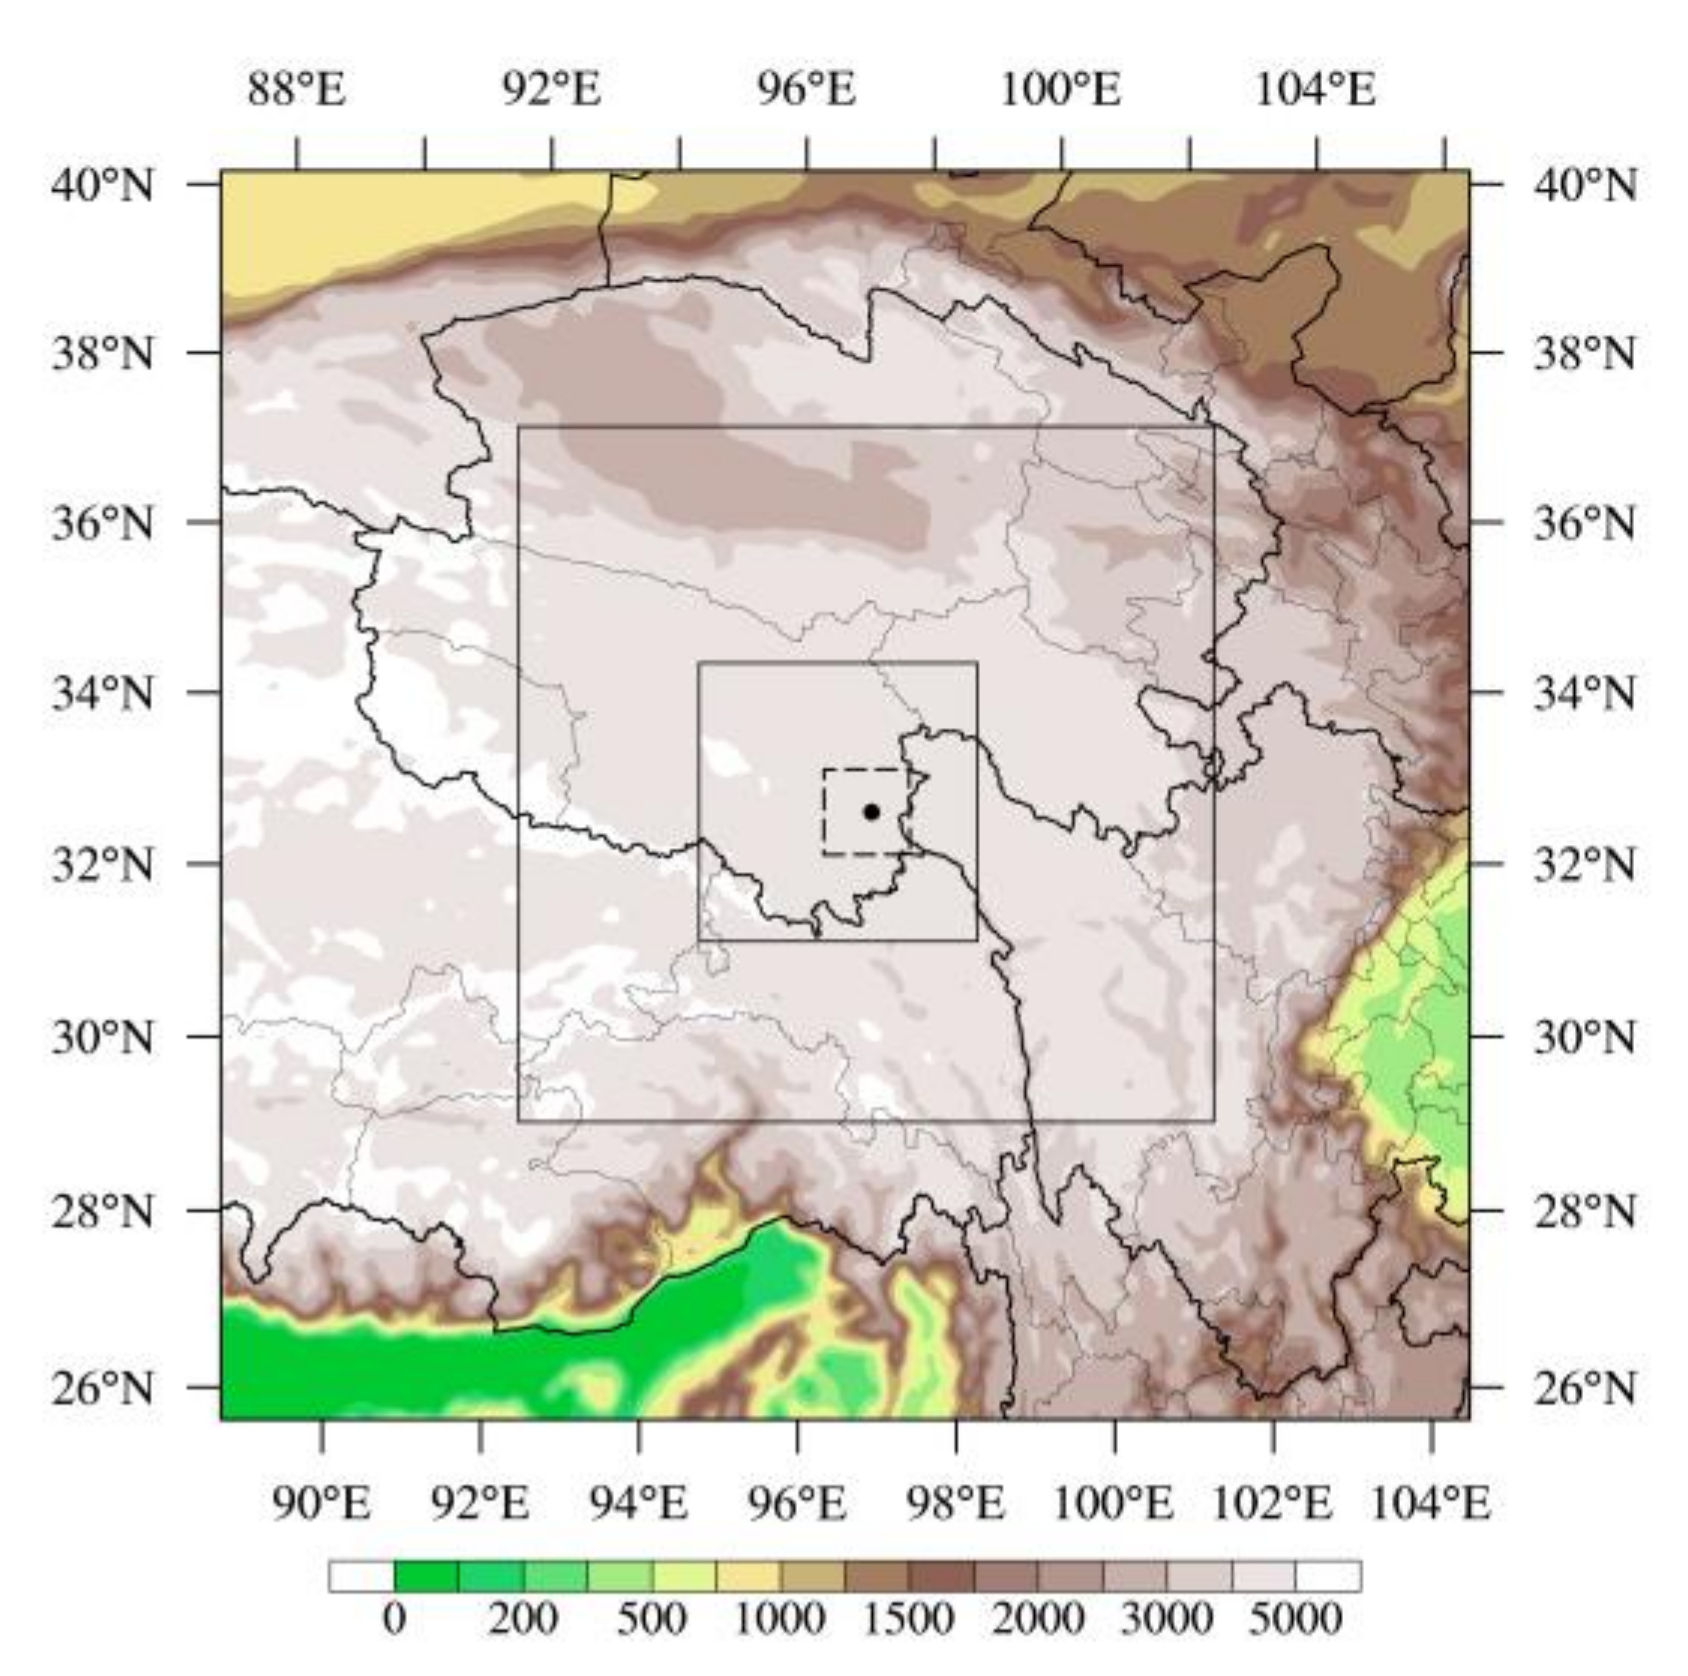
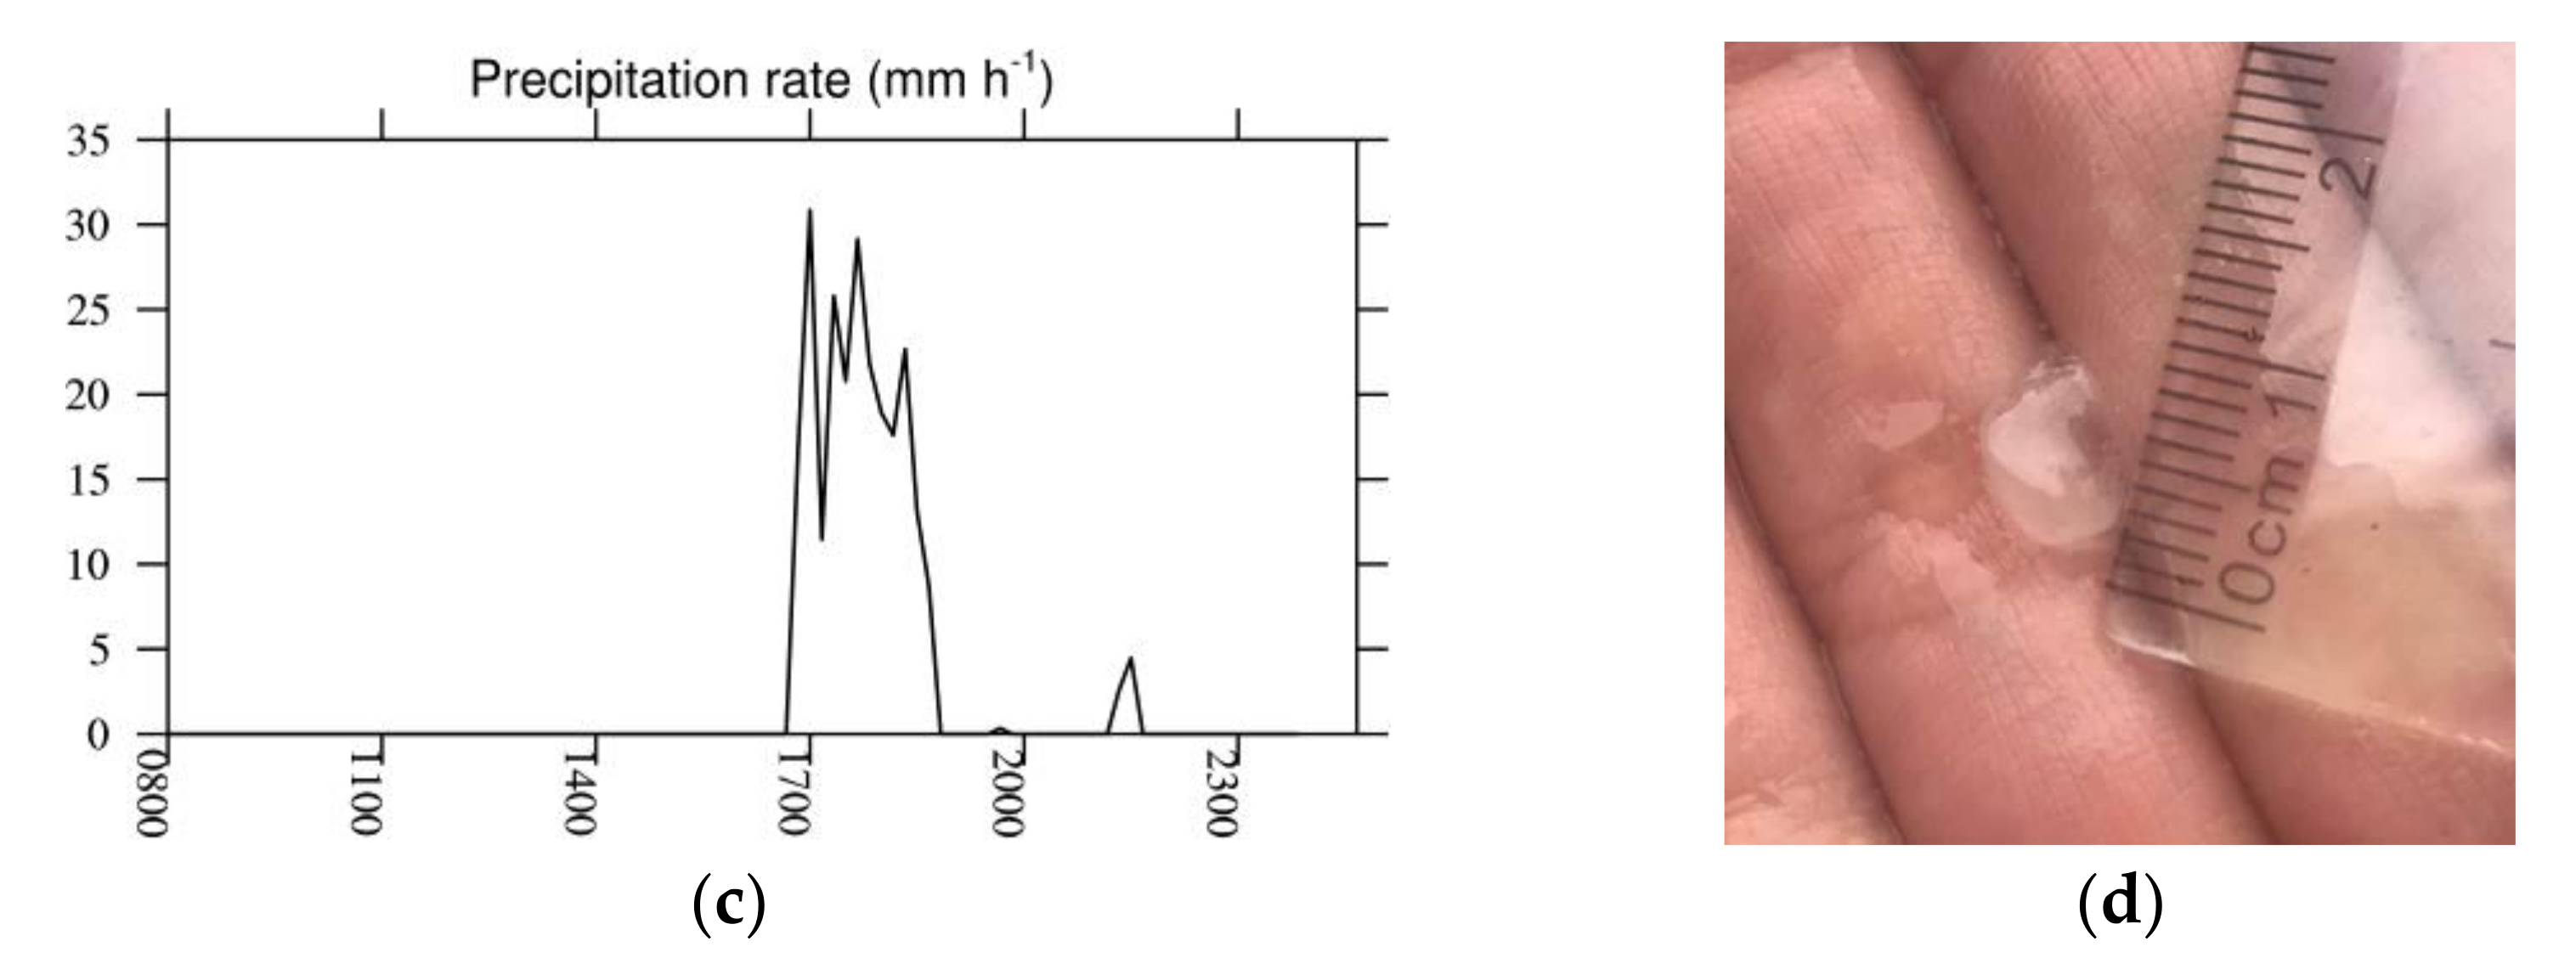
3. The Case Description

As shown in Figure 2, the TBB value recorded by the Yushu meteorological station was lower than −60 degrees Celsius at 17:00, 11 August 2020, indicating that the cloud top was very high and the convection was strong. Figure 2 shows the reflectivity factor time series of the Ka-band millimeter-wave cloud radar fusion product. Figure 2 shows that the period from 16:00 to 17:00 on that day was before the occurrence of precipitation; the reflectivity continued from 3 km to 12 km above the ground, indicating convection at that time. The cloud layer was thick and the convection behavior developed vigorously; the peak appears at 16:50 at 3–6 km, and the maximum value of the reflectivity factor was close to 25 dbz, indicating that a large amount of water was generated in the convective cloud at this time. Under the influence of intense convective weather, convective precipitation occurred in Yushu City from 16:47 to 18:58, from which hail appeared from 16:56 to 16:59, and the diameter of the hail reached over 5 mm in size. The rain intensity peaked at 17:00 on that day, at 30 mm/h, and continued until after 18:00.

4. Verification of Model Simulation

Figure 3 showed the spatial distribution of the 24h precipitation, from 08:00 on 11 August to 08:00 on 12 August, simulated by six cloud microphysics parameterization schemes, and the precipitation was observed by six meteorological stations (Yushu, Qumalai, Zhiduo, Zaduo, Nangqian, and Qingshuihe) that are also marked on the Figure. In the figure, the precipitation generally shows a decreasing trend from south to north. As shown in Figure 3, the six cloud microphysics parameterization schemes simulate the north–south block precipitation distribution in the Yushu area. For each precipitation center, the simulation results of the six schemes are not significantly different. In the north region, the WSM5 scheme and the new Thompson scheme simulate more precipitation, while in the south part, the rainfall simulated by the Morrison scheme is too small. The simulation results of the Lin scheme, the WSM6 scheme, and the Eta scheme are relatively consistent with the observed results.
The evaluation indexes of the simulation results are shown in Table 1. In terms of the correlation coefficient, the Lin scheme and Morrison scheme have the highest degree of linear correlation, and the New Thompson scheme has a little correlation. The WSM5 scheme and the New Thompson scheme perform poorly in terms of average relative error. From the perspective of relative deviation, the Morrison scheme and the Eta scheme have serious negative biases, which means that these two schemes seriously underestimated the precipitation and rainfall at this time.
Figure 4 shows the temporal and spatial distribution of radar reflectivity factors, as simulated by six cloud microphysics parameterization schemes, from 16:00 to 18:00 on 11 August. The simulation results of different schemes are quite variable. In terms of spatial distribution, the WSM6 scheme and the Eta scheme cannot simulate reflectivity of more than 6 km. In terms of the peak time, the peak time of the simulation results of the WSM5 scheme is behind, while the simulation results of the New Thompson scheme are far ahead. On the whole, the simulation results of the Lin scheme and Morrison scheme are closer to the actual results in time and space. In comparison, the Lin scheme can better describe the precipitation for some time after the peak.
In terms of the simulation of the spatial distribution of cumulative precipitation, the Lin scheme and the WSM6 scheme have the best performance. In terms of the simulation of the reflectivity factor, the Lin scheme and the Morrison scheme have the best performance. Among them, the Lin scheme in the WRF model can reasonably simulate the convective precipitation process in the Yushu area at this time, indicating that the WRF model is reliable for studying the convective precipitation process in the Yushu area.

5. Analysis of the Microphysical Process

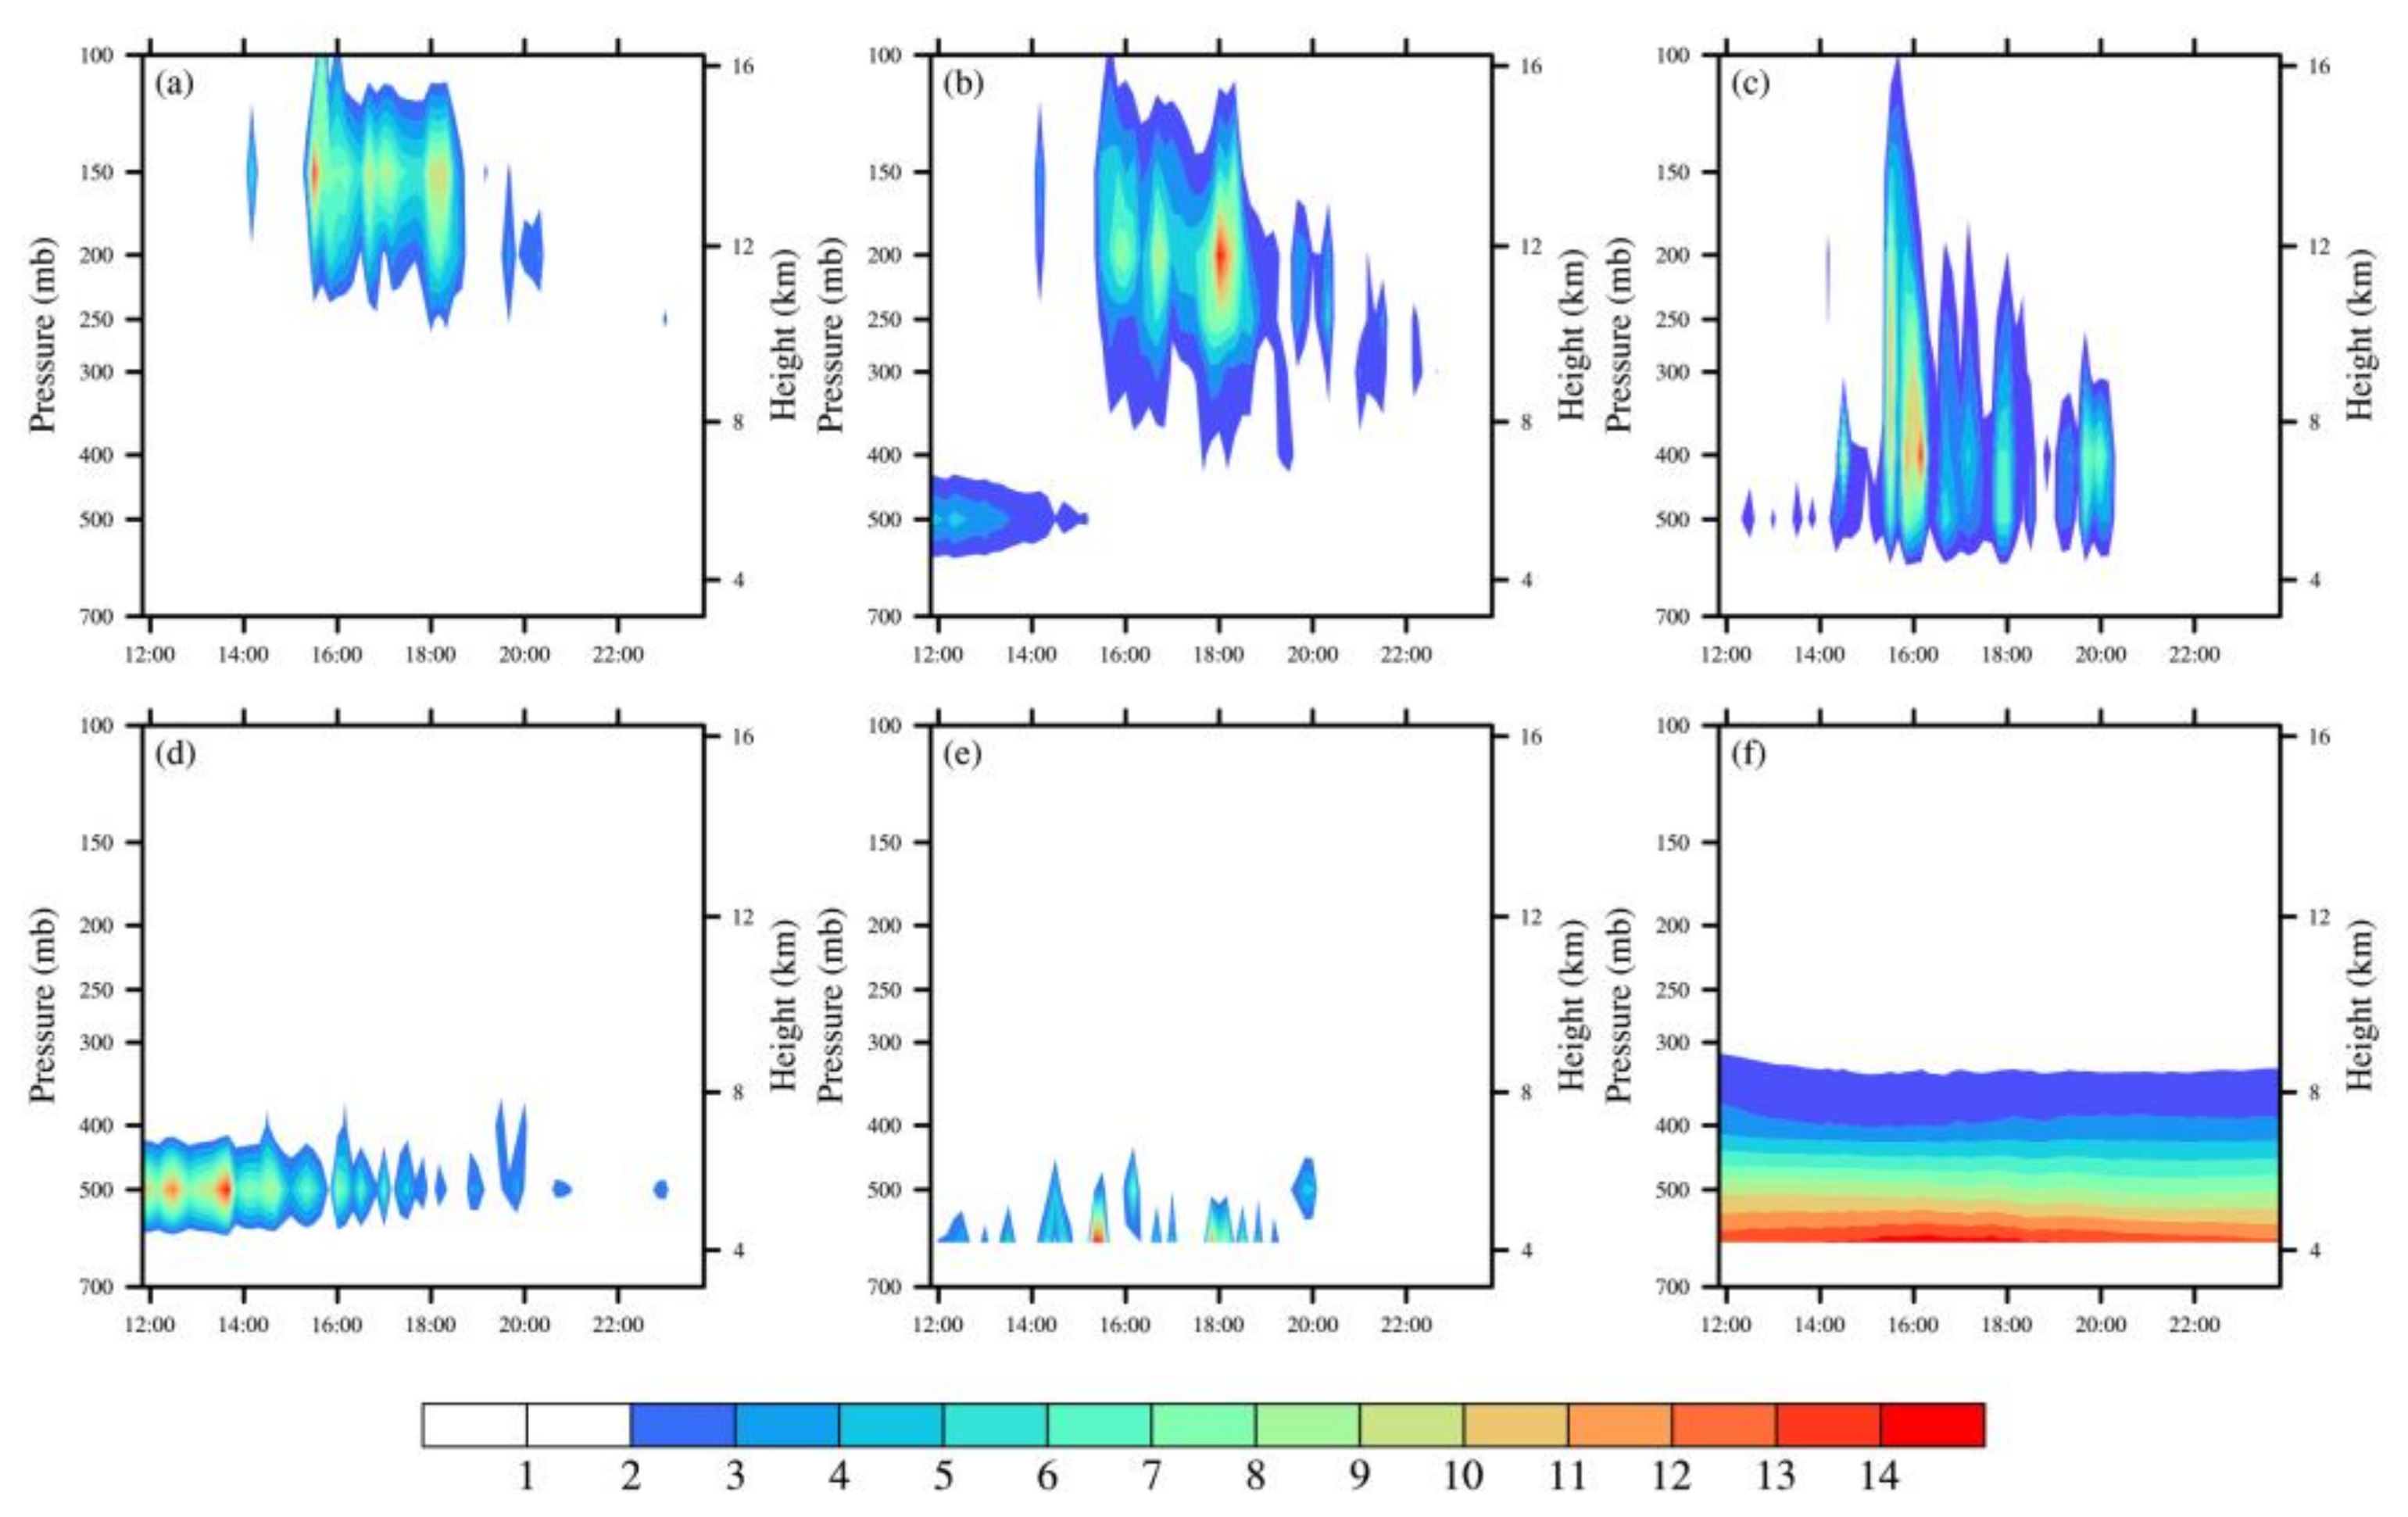
5.1. Spatiotemporal Distribution

In Figure 5, the time–height distribution of the mass densities of various phase particles showed that the distribution of solid hydrometeors is relatively high and cloud ice is located in the highest layer, with a distribution range of 300–100 hPa, while its maximum-value center is concentrated at about 150 hPa; snow appears in the middle and high layers, with a wide distribution range, and the top value center is concentrated at 250–200 hPa; graupel is mainly distributed in the middle and high layers, with high particle content and deep vertical distribution; cloud water appears in the middle layer and the maximum-value center is concentrated at 500 hPa; the rainwater seems to appear in the medium and low layers, and the top value center is below 500 hPa; the water vapor is evenly distributed, and the maximum value is concentrated in the lower layer.
In terms of the extreme value of the mixing ratio, water vapor shows the highest mixing ratio, followed by cloud water and rainwater, and, finally, graupel, snow, and ice. Figure 6 shows that gaseous hydrates have the highest mixing ratio, liquid hydrates have the second highest, and solid hydrates have the lowest mixing ratio. From the perspective of time distribution, the maximum value center of cloud water appears at 12:00–14:00, the other various phase particles have top value centers from 16:00–18:00, while the extreme value center is at 16:00. This shows that the plateau’s convective precipitation begins to develop in the afternoon, growing strongest in the evening, and the maximum precipitation value is concentrated around the evening period. This is consistent with the conclusions obtained in previous studies [41,42]. The maximum cloud-water mass density value is about two hours earlier than those for the changing trend of the extreme value center of other phase particles.

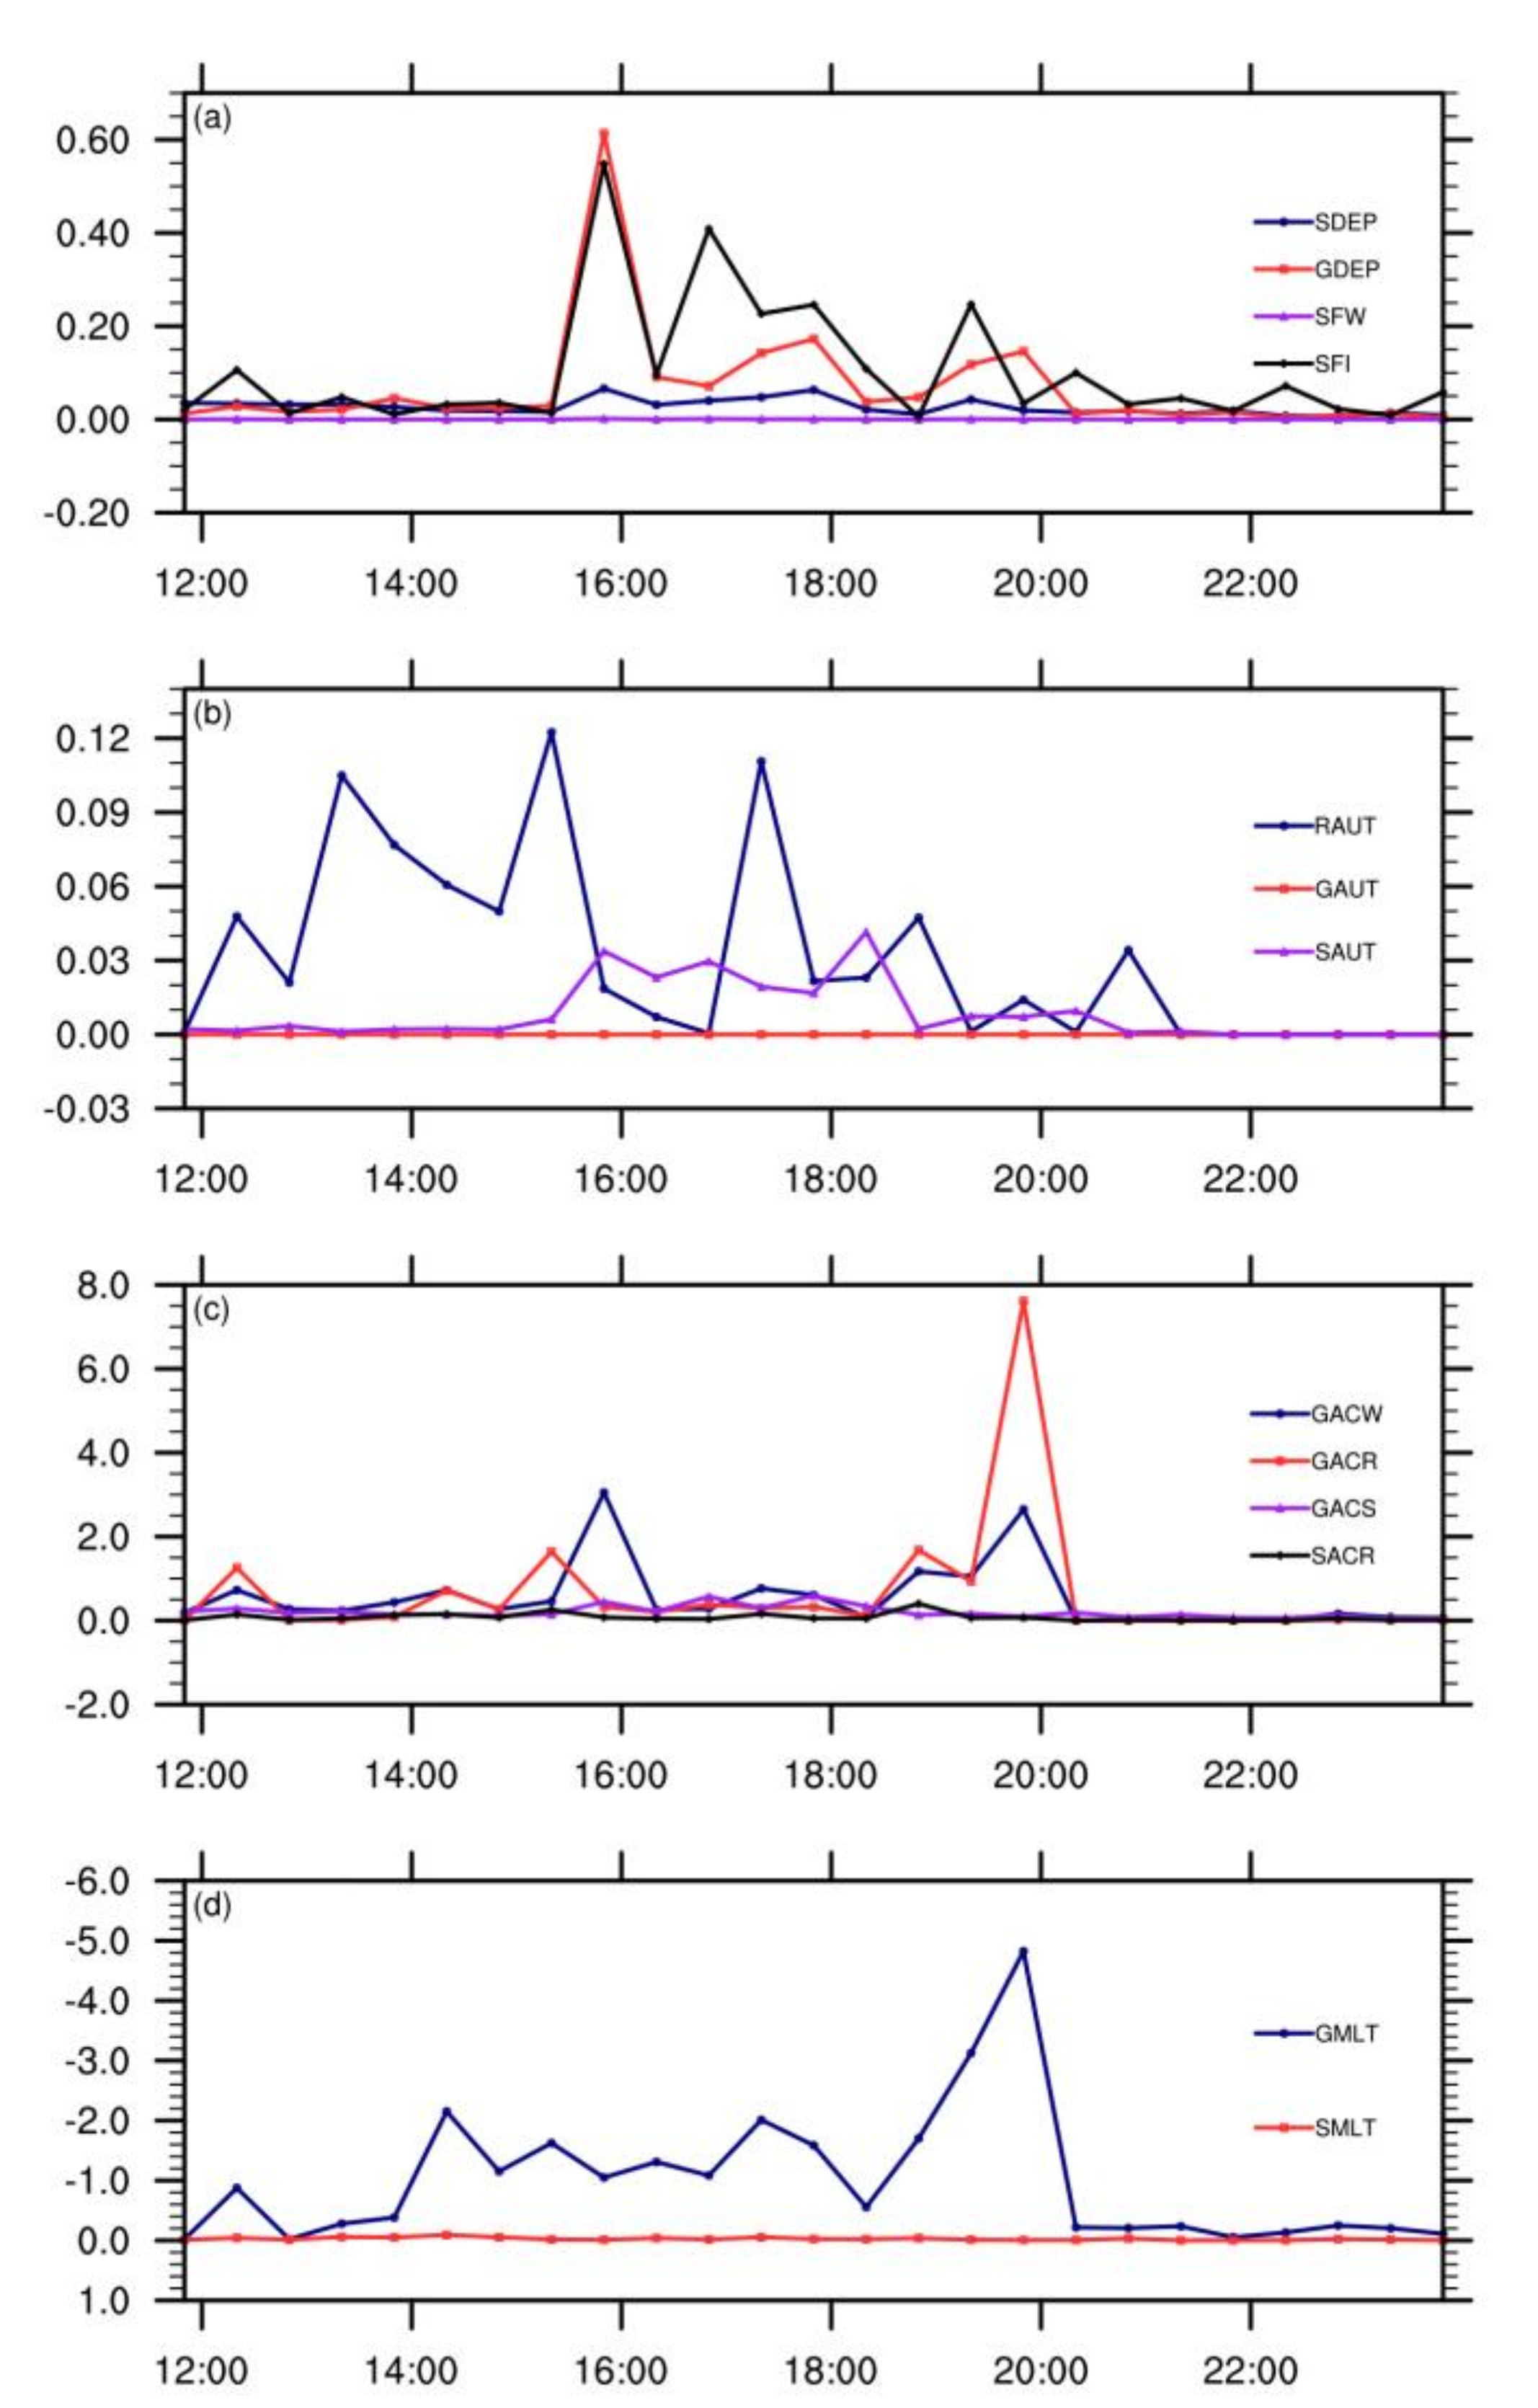
5.2. Source Term Analysis

The Lin microphysics parameterization scheme considers the mixing ratio of water vapor, cloud water, rainwater, cloud ice, snow, and graupel. In the Lin microphysics parameterization scheme, there are four sources of rainwater: graupel melts to form rain (GMLT), while snow melts to form rain (SMLT), cloud water automatically gathers to form rainwater (RAUT) and the collision of rain and cloud water growth (RACW). There are five kinds of source terms of snow: the sublimation growth of snow (SDEP), the Bergeron process transformation of cloud ice into snow (SFI), ice crystals aggregate to form snow (SAUT), and the collision between snow and cloud ice. There are nine sources of graupel: snow gathers to form graupel (GAUT), cloud and ice collide with supercooled rainwater to form graupel (IACR), with collision and growth to graupel (RACS), supercooled water freezes to form graupel (GFR), graupels collide with cloud water and grow (GACW), graupels collide with rainwater (GACR), graupel and ice crystals collide and grow (GACI), grain and snow collide with growth (GACS) along with grain glide growth (GDEP). To better reveal the transformation of microphysical quantities in the convective precipitation process, the model’s source-sink transformation rates are analyzed here. The area averaged (32.5–33.5° E, 96.5–97.5° N, the dashed area in Figure 2) the vertical distribution of the rainwater source, snow source, graupel primary source, and graupel growth source at 17:00 on 11 August.
From the vertical distribution of the conversion rate of the rainwater source term, it can be seen that the rainwater mainly comes from the RACW and the RAUT. The conversion rate of SMLT is very close to 0 and is negligible. It is worth noting that the GMLT has a very negative value, which indicates that the conversion of rainwater to graupel is powerful at this time.
From the vertical distribution of the conversion rate of the snow source item, it can be seen that, unlike the rain source item, the snow source item shows significant differences at different heights. The top centers of SAUT and SACI appear at 150 hPa. The SFI and SDEP have a large center distribution at 400 hPa. The SACR dominates the snow source term, with its top center at 500 hPa, and the conversion rate is more than three times that of the second-largest conversion rate. This indicates that snow is produced at multiple heights but mainly comes from the collision and growth of snow and rain at the altitude of 500 hPa.
From the primary source term of graupel particles, it can be seen that the IACR is the largest value, RACS is the second-largest value, and the center of the maximum value of the two appears at 500 hPa. Conversion rates for the rest of the process are negligible compared to the first two. This indicates that in the initial stage of graupel, the IACR and the RACS are the main processes.
From the growth source term of graupel particles, it can be seen that most of the microphysical processes of graupel growth reach a peak at 500 hPa, the GACR is extremely large, and the maximum conversion rate occurs at 500 hPa. The GACW is about 1/5 of the former, and the ultimate conversion rate also appears at 500 hPa. Conversion rates for the rest of the process are negligible. This shows that in the growth process of graupel particles, the GACR dominates. At the same time, the GACW also has a particular contribution to the growth of graupel.
To sum up, rainwater has an inevitable growth, but most of it is involved in transforming into graupel particles. The development of snow is relatively insignificant in magnitude. In the initial stage, graupel particles are mainly affected by cloud ice, freezing, supercooled rainwater, and rainwater and graupel particles. The snow collision and growth process have an impact, but the magnitude of the conversion rate is not significant. In its growth stage, the collision and growth of graupel and rain significantly impact the growth of graupel particles, which is also an essential precipitation process.

5.3. Evolutionary Characteristics

From the evolution characteristics of the main microphysical processes in Figure 7, it can be seen that an intense precipitation process occurred in the Yushu area from midnight on 11 August to midnight on 12 August. In the desublimation and Bergeron processes, the GDEP plays a significant role. The SFI takes second place, while the SDEP is not significant. In the process of ice-phase particle aggregation, the RAUT is the most significant. The SAUT has a particular contribution. The main microphysical processes of collision and growth can be seen, the GACR and the GACW are the main processes and the GACS and the SACR are not significant. During the melting process, the GMLT and the SMLT both show negative values, which means that the freezing process is underway, that is, the conversion of rainwater to graupel and snow, of which the transformation of rainwater to graupel particles accounts for a large part. Only a tiny amount of rain is converted into snow. From the point of view of the magnitude of the conversion rate, the growth and coagulation processes are the most significant. Among them, the interaction of graupel particles with rainwater and cloud water is more critical in terms of collision and growth. During the condensation process, most of the graupel comes from rainwater condensation.
Therefore, it can be seen from the evolution characteristics of the precipitation microphysical process over time (Figure 8) that water vapor forms ice crystals, snow, and graupel through desublimation; in the coexistence area of supercooled water and ice particles, ice particles pass through aggregation, the Bergeron process, coagulation, and collision and are transformed into each other, while rain is formed by melting and falling. It can be seen from the whole process that the coagulation and collision processes play a significant role in the plateau’s precipitation, while the condensation of rainwater also plays an important role in forming graupel particles.

6. Conclusions and Discussions

In this paper, a convective precipitation process in the Yushu area of the Tibetan Plateau, monitored from 11 to 12 August 2020, is analyzed using multiple observational data, reanalysis data, and WRF simulation data. The conclusions are as follows:
(1)
The WRF model with a Lin microphysics parameterization scheme was able to simulate the convective precipitation process in the Yushu area of the TP.
(2)
The spatiotemporal distribution of the phase particles shows that the three-phase particles of solid, liquid, and gas are distributed over different height layers. The gaseous particles are mainly distributed in the lower layer. The liquid particles are distributed primarily in the middle and low layers, and the solid particles are mainly distributed on the upper floors. Gaseous hydrates have the highest mixing ratio, liquid hydrates the second highest, and solid hydrates have the lowest mixing ratio.
(3)
In the cloud microphysics process, the contribution of rainwater to precipitation is the largest, and it collides, grows, and solidifies. This process is the primary process for the growth of graupel particles and is also essential for producing precipitation. From the evolution characteristics of the microphysical process, it can be seen that the ice particles play a significant role in the TP precipitation process. Condensation contributes less to the formation of hail.
Numerical models such as WRF are widely used in the study of cloud microphysical processes. The above conclusions confirm the results of previous studies [43]. This study reveals the microphysical process of convective cloud and the transformation law of hydrometeors over the Plateau, which is of great significance for further understanding of the microphysical mechanism of precipitation formation and water-cycle characteristics over the Plateau, improving the parameterization of modeled cloud physical processes, and improving the level of numerical prediction. However, due to data discretization, initial and boundary conditions, and parameterization uncertainty [44], the deterministic prediction of the WRF model has a large error. Among them, the uncertainty of the parameterization scheme has a great impact on precipitation forecast technology because the microphysics scheme, convection scheme, radiation scheme, and PBL scheme in the parameterization schemes have a great impact on the accuracy of simulation of temperature, humidity, and wind field [45]. In addition, this paper only explores a case of convective cloud precipitation over the TP in summer. However, the plateau area is vast, and the terrain is complex and changeable. The conclusions drawn from this process may not be widely representative. Besides, this experiment only selects a small part of the many parameterization schemes; there are many schemes that have not been compared, such as those of Kesser and Ferrier. Therefore, the results of this experiment are not enough to show that the selected scheme is better than other schemes at any time and in any place. On the contrary, each parameterization scheme has its own advantages and disadvantages, and for different occasions and moments, the simulation results are also different. Therefore, it is necessary to study the TP in the future. More simulations of cloud precipitation processes must be performed to obtain robust microphysical mechanisms that further enhance the capabilities of the models.

Author Contributions

Writing and data analysis, M.H.; supervision and project administration, S.Z.; data preparation, X.Y.; methodology, S.Y. All authors have read and agreed to the published version of the manuscript.

Funding

This work was funded by the National Natural Science Foundation of China (Grant No. 42105034, 41975130), and Chengdu University of Information Technology Introduces Talent Research Start-up Project (KYTZ201737).

Institutional Review Board Statement

Not applicable.

Informed Consent Statement

Not applicable.

Data Availability Statement

The CFSR reanalysis data can be found here: https://rda.ucar.edu/datasets/ds094.0/ accessed on 10 May 2022.

Conflicts of Interest

The authors declare no conflict of interest.

References

  1. Ma, Y.; Ma, W.; Zhong, L.; Hu, Z.; Li, M.; Zhu, Z.; Han, C.; Wang, B.; Liu, X. Monitoring and modeling the Tibetan Plateau’s climate system and its impact on east asia. Sci. Rep. 2017, 7, 44574. [Google Scholar] [CrossRef] [PubMed]
  2. Nan, S.; Zhao, P.; Chen, J.; Liu, G. Links between the thermal condition of the Tibetan Plateau in summer and atmospheric circulation and climate anomalies over the eurasian continent. Atmos. Res. 2021, 247, 105212. [Google Scholar] [CrossRef]
  3. Zhou, X.; Zhao, P.; Chen, J.; Chen, L.; Li, W. Impacts of thermodynamic processes over the Tibetan Plateau on the northern hemispheric climate. Sci. China Ser. D-Earth Sci. 2009, 52, 1679–1693. [Google Scholar] [CrossRef]
  4. Xu, X.; Lu, C.; Shi, X.; Gao, S. World water tower: An atmospheric perspective. Geophys. Res. Lett. 2008, 35, L20815. [Google Scholar] [CrossRef]
  5. Bothe, O.; Fraedrich, K.; Zhu, X. Large-scale circulations and Tibetan Plateacu summer drought and wetness in a high-resolution climate model. Int. J. Climatol. 2011, 31, 832–846. [Google Scholar] [CrossRef]
  6. Ding, Y.; Chan, J. The east asian summer monsoon: An overview. Meteorol. Atmos. Phys. 2005, 89, 117–142. [Google Scholar]
  7. Ji, C.; Zhang, Y.; Cheng, Q.; Li, Y.; Jiang, T.; Liang, X. On the relationship between the early spring Indian ocean’s sea surface temperature (SST) and the Tibetan Plateau atmospheric heat source in summer. Glob. Planet. Chang. 2018, 164, 1–10. [Google Scholar] [CrossRef]
  8. Chen, J.; Wu, X.; Yin, Y.; Lu, C. Large-scale circulation environment and microphysical characteristics of the cloud systems over the Tibetan Plateau in boreal summer. Earth Space Sci. 2020, 7, e2020EA001154. [Google Scholar] [CrossRef]
  9. Wang, X.; Pang, G.; Yang, M. Precipitation over the Tibetan Plateau during recent decades: A review based on observations and simulations. Int. J. Climatol. 2018, 38, 1116–1131. [Google Scholar] [CrossRef]
  10. Kukulies, J.; Chen, D.; Wang, M. Temporal and spatial variations of convection and precipitation over the Tibetan Plateau based on recent satellite observations. part I: Cloud climatology derived from CloudSat and CALIPSO. Int. J. Climatol. 2019, 39, 5396–5412. [Google Scholar] [CrossRef]
  11. Hu, L.; Deng, D.; Gao, S.; Xu, X. The seasonal variation of tibetan convective systems: Satellite observation. J. Geophys. Res. Atmos. 2016, 121, 5512–5525. [Google Scholar] [CrossRef]
  12. Zhang, X.; Shen, W.; Zhuge, X.; Yang, S.; Chen, Y.; Wang, Y.; Chen, T.; Zhang, S. Statistical characteristics of mesoscale convective systems initiated over the Tibetan Plateau in summer by fengyun satellite and precipitation estimates. Remote Sens. 2021, 13, 1652. [Google Scholar] [CrossRef]
  13. Chen, J.; Wu, X.; Yin, Y.; Lu, C.; Xiao, H.; Huang, Q.; Deng, L. Thermal effects of the surface heat flux on cloud systems over the Tibetan Plateau in boreal summer. J. Clim. 2019, 32, 4699–4714. [Google Scholar] [CrossRef]
  14. Gao, Y.; Chen, F.; Miguez-Macho, G.; Li, X. Understanding precipitation recycling over the Tibetan Plateau using tracer analysis with WRF. Clim. Dyn. 2020, 55, 2921–2937. [Google Scholar] [CrossRef]
  15. Yan, Y.; Liu, Y. Vertical structures of convective and stratiform clouds in boreal summer over the Tibetan Plateau and its neighboring regions. Adv. Atmos. Sci. 2019, 36, 1089–1102. [Google Scholar] [CrossRef]
  16. Gao, W.; Sui, C.; Fan, J.; Hu, Z.; Zhong, L. A study of cloud microphysics and precipitation over the Tibetan Plateau by radar observations and cloud-resolving model simulations. J. Geophys. Res. Atmos. 2016, 121, 13735–13752. [Google Scholar] [CrossRef]
  17. Gao, W.; Liu, L.; Li, J.; Lu, C. The microphysical properties of convective precipitation over the Tibetan Plateau by a subkilometer resolution cloud-resolving simulation. J. Geophys. Res. Atmos. 2018, 123, 3212–3227. [Google Scholar] [CrossRef]
  18. Tang, J.; Guo, X.; Chang, Y. A numerical investigation on microphysical properties of clouds and precipitation over the Tibetan Plateau in summer 2014. J. Meteorol. Res. 2019, 33, 463–477. [Google Scholar] [CrossRef]
  19. Jankov, I.; Grasso, L.; Sengupta, M.; Neiman, P.J.; Zupanski, D.; Zupanski, M.; Lindsey, D.; Brummer, R. An evaluation of five ARW-WRF microphysics schemes using synthetic GOES imagery for an atmospheric river event affecting the california coast. J. Hydrometeorol. 2011, 12, 618–633. [Google Scholar] [CrossRef]
  20. Maussion, F.; Scherer, D.; Finkelnburg, R.; Richters, J.; Yang, W.; Yao, T. WRF simulation of a precipitation event over the Tibetan Plateau, China-an assessment using remote sensing and ground observations. Hydrol. Earth Syst. Sci. 2011, 15, 1795–1817. [Google Scholar] [CrossRef]
  21. Maussion, F.; Scherer, D.; Molg, T.; Collier, E.; Curio, J.; Finkelnburg, R. Precipitation seasonality and variability over the Tibetan Plateau as resolved by the high asia reanalysis. J. Clim. 2014, 27, 1910–1927. [Google Scholar] [CrossRef]
  22. Li, L.; Gochis, D.J.; Sobolowski, S.; Mesquita, M.D.S. Evaluating the present annual water budget of a himalayan headwater river basin using a high-resolution atmosphere-hydrology model. J. Geophys. Res. Atmos. 2017, 122, 4786–4807. [Google Scholar] [CrossRef]
  23. Lv, M.; Xu, Z.; Yang, Z. Cloud resolving WRF simulations of precipitation and soil moisture over the central Tibetan Plateau: An assessment of various physics options. Earth Space Sci. 2020, 7, e2019EA000865. [Google Scholar] [CrossRef]
  24. Xu, J.; Ma, Z.; Tang, G.; Ji, Q.; Min, X.; Wan, W.; Shi, Z. Quantitative evaluations and error source analysis of fengyun-2-based and gpm-based precipitation products over mainland China in summer, 2018. Remote Sens. 2019, 11, 2992. [Google Scholar] [CrossRef]
  25. Zhang, J.; Chen, H.; Zhao, S. A tripole pattern of summertime rainfall and the teleconnections linking northern China to the Indian subcontinent. J. Clim. 2019, 32, 3637–3653. [Google Scholar] [CrossRef]
  26. Liu, L.; Zheng, J.; Ruan, Z.; Cui, Z.; Hu, Z.; Wu, S.; Dai, G.; Wu, Y. Comprehensive radar observations of clouds and precipitation over the Tibetan Plateau and preliminary analysis of cloud properties. J. Meteorol. Res. 2015, 29, 546–561. [Google Scholar] [CrossRef]
  27. Wang, H.; Guo, X. Comparative analyses of vertical structure of deep convective clouds retrieved from satellites and ground-based radars at naqu over the Tibetan Plateau. J. Meteorol. Res. 2019, 33, 446–462. [Google Scholar] [CrossRef]
  28. Zhang, T.; Zheng, J.; Liu, Y. A study on the vertical structure and microphysical characteristic of convective cloud and precipitation over Tibetan Plateau by using ka-band cloud radar. J. Infrared Millim. Waves 2019, 38, 777–789. [Google Scholar]
  29. Zhou, R.; Wang, G.; Zhaxi, S. Cloud vertical structure measurements from a ground-based cloud radar over the southeastern Tibetan Plateau. Atmos. Res. 2021, 258, 105629. [Google Scholar] [CrossRef]
  30. Liu, L.; Gao, W. Statistical analysis of microphysical and dynamical parameters for clouds and precipitation over nauq Tibetan Plateau in summertime using ka-band cloud radar. Atmosphere 2020, 11, 818. [Google Scholar] [CrossRef]
  31. Stamnes, K.; Tsay, S.-C.; Wiscombe, W.; Jayaweera, K. Numerically stable algorithm for discrete-ordinate-method radiative transfer in multiple scattering and emitting layered media. Appl. Opt. 1988, 27, 2502–2509. [Google Scholar] [CrossRef]
  32. Dudhia, J.; Moncrieff, M.W. A three-dimensional numerical study of an oklahoma squall line containing right-flank supercells. J. Atmos. Sci. 1989, 46, 3363–3391. [Google Scholar] [CrossRef]
  33. Grell, G.A.; Dévényi, D. A generalized approach to parameterizing convection combining ensemble and data assimilation techniques. Geophys. Res. Lett. 2002, 29, 38-1–38-4. [Google Scholar] [CrossRef]
  34. Mellor, G.L.; Yamada, T. Development of a turbulence closure model for geophysical fluid problems. Rev. Geophys. 1982, 20, 851–875. [Google Scholar] [CrossRef]
  35. Janjić, Z.I. The step-mountain coordinate: Physical package. Mon. Weather Rev. 1990, 118, 1429–1443. [Google Scholar] [CrossRef]
  36. Smirnova, T.G.; Brown, J.M.; Benjamin, S.G.; Kenyon, J.S. Modifications to the rapid update cycle land surface model (ruc lsm) available in the weather research and forecasting (WRF) model. Mon. Weather Rev. 2016, 144, 1851–1865. [Google Scholar] [CrossRef]
  37. Fu, Y.; Liu, G.; Wu, G.; Yu, R.; Xu, Y.; Wang, Y.; Li, R.; Liu, Q. Tower mast of precipitation over the central Tibetan Plateau summer. Geophys. Res. Lett. 2006, 33, L05802. [Google Scholar] [CrossRef]
  38. Li, X.; Wang, Y.; Tian, L.; Xu, J.; Qu, S.; Wei, F.; Pan, X. High-resolution precipitation simulation with WRF for the Three-River headwaters region in China. IOP Conf. Ser. Earth Environ. Sci. 2020, 612, 012046. [Google Scholar] [CrossRef]
  39. Jiang, Y.; Chen, F.; Gao, Y.; He, C.; Barlage, M.; Huang, W. Assessment of uncertainty sources in snow cover simulation in the Tibetan Plateau. J. Geophys. Res. Atmos. 2020, 125, e2020JD032674. [Google Scholar] [CrossRef]
  40. Gao, Y.; Li, K.; Chen, F.; Jiang, Y.; Lu, C. Assessing and improving Noah-MP land model simulations for the central Tibetan Plateau. J. Geophys. Res. Atmos. 2015, 120, 9258–9278. [Google Scholar] [CrossRef]
  41. Li, J. Hourly station-based precipitation characteristics over the Tibetan Plateau. Int. J. Climatol. 2018, 38, 1560–1570. [Google Scholar] [CrossRef]
  42. Kukulies, J.; Chen, D.; Wang, M. Temporal and spatial variations of convection, clouds and precipitation over the Tibetan Plateau from recent satellite observations. part II: Precipitation climatology derived from global precipitation measurement mission. Int. J. Climatol. 2020, 40, 4858–4875. [Google Scholar] [CrossRef]
  43. Gong, M.; Li, M.; Shu, L.; Chang, N.; Xu, P.; Ma, Y.; Sun, F.; Yang, Y. Microphysical analysis of precipitation in the central and eastern margins of the Tibetan Plateau. Atmos. 2022, 13, 1082. [Google Scholar] [CrossRef]
  44. Du, Y.; Xu, T.; Che, Y.; Yang, B.; Chen, S.; Su, Z.; Su, L.; Chen, Y.; Zheng, J. Uncertainty quantification of WRF model for rainfall prediction over the Sichuan basin, China. Atmosphere 2022, 13, 838. [Google Scholar] [CrossRef]
  45. Zan, B.; Yu, Y.; Dong, L.; Li, J.; Zhao, G.; Zhang, T. Numerical study of the impact of complex terrain and soil moisture on convective initiation. Atmosphere 2020, 11, 871. [Google Scholar] [CrossRef]
Figure 1. Site geographic distribution information (the red five-pointed star represents Yushu, and the black origin represents Qumalai, Zhiduo, Zaduo, Nangqian, Qingshuihe, respectively) (left) and Ka-band millimeter-wave cloud radar system (photo from Yushu meteorological station) (right).
Atmosphere 13 01311 g001
Figure 2. The model domain and topography (unit: m). The first nested area contains most of the TP area, the second nested area is located in the eastern part of the TP, and the third nested area focuses on the concentration of observation sites in the eastern part of Yushu Tibetan Autonomous Prefecture in southern Qinghai Province. The area average of the black dashed area in the figure is used for comparison with the radar profile.
Atmosphere 13 01311 g002
Figure 3. (a) The blackbody brightness temperature (TBB) at 17:00 on 11 August 2020, (b) the reflectivity factor in Yushu, (c) the time variation of precipitation intensity in Yushu, and (d) photograph of the observed hail.
Atmosphere 13 01311 g003aAtmosphere 13 01311 g003b
Figure 4. The simulated spatial distribution of the 24h precipitation results from 08:00 on 11 August to 08:00 on 12 August; (af) show the Lin, WSM5, WSM6, New Thompson, Morrison, and Eta results, respectively (unit: mm).
Atmosphere 13 01311 g004
Figure 5. The simulated reflectivity factors (af) were for Lin, WSM5, WSM6, New Thompson, Morrison, and Eta, respectively (unit: dbz). This figure is obtained by the regional averaging of the black dashed area (32.5–33.5° E, 96.5–97.5° N) in Figure 2.
Atmosphere 13 01311 g005
Figure 6. The mixing ratios of particles in each phase: (a) ice, (b) snow, (c) graupel, (d) cloud water, (e) rainwater, (f) water vapor (unit: 10 6 kg/kg). This figure is obtained via regional averaging of the black dashed area (32.5–33.5° E, 96.5–97.5° N) in Figure 2.
Atmosphere 13 01311 g006
Figure 7. Conversion rate of the water source item to a horizontally averaged figure: (a) rainwater source item, (b) snow source item, (c) graupel primary source item, (d) graupel growth source item. This figure is obtained by the regional averaging of the black dashed area (32.5–33.5° E, 96.5–97.5° N) in Figure 2.
Atmosphere 13 01311 g007
Figure 8. Microphysical process timing characteristics. (a) Sublimation and Bergeron, (b) ice phase particle aggregation, (c) coagulation, and (d) melt (unit:   10 5 g · kg 1 · s 1 ). This figure is obtained by regional averaging of the black dashed area (32.5–33.5° E, 96.5–97.5° N) in Figure 2.
Atmosphere 13 01311 g008
Table 1. Cumulative spatial precipitation error index of six microphysical schemes.
LinWSM5WSM6New ThompsonMorrisonEta
R0.84890.54670.6220−0.08640.85800.5618
MRE0.73581.04380.54341.33170.86920.5640
BIAS0.15670.1403−0.1135−0.0242−0.8650−0.5691
Publisher’s Note: MDPI stays neutral with regard to jurisdictional claims in published maps and institutional affiliations.

