Article

Research on the Influence of Weather Patterns on Ozone Concentration: A Case Study in Tianjin

1
Tianjin Eco-Environmental Monitoring Center, Tianjin 300191, China
2
China Automotive Technology and Research Center Co., Ltd., Tianjin 300300, China
3
Wenjiang Monitoring Station, Chengdu Pollution Source Monitoring Center, Chengdu 610011, China
*
Authors to whom correspondence should be addressed.
Atmosphere 2022, 13(8), 1312; https://doi.org/10.3390/atmos13081312
Submission received: 4 June 2022 / Revised: 11 August 2022 / Accepted: 15 August 2022 / Published: 18 August 2022
(This article belongs to the Special Issue Advances in Understanding Ozone Pollution)

Abstract

:
Ozone (O3) is an important secondary substance that plays a significant role in atmospheric chemistry and climate change. Although O3 is essential in the stratosphere, it is harmful to human health in the troposphere, where this study was conducted. In recent years, O3 pollution in the Beijing-Tianjin-Hebei (BTH), Yangtze River Delta (YRD), and Pearl River Delta (PRD) regions has deteriorated, which has become an important environmental problem. The generation of O3 is closely related to meteorological factors. In this study, the weather classification method was adopted to study the effect of meteorological conditions on O3 concentration. In the BTH region, Tianjin was selected as the representative city for the research. The real-time pollutants data, meteorological re-analysis data, and meteorological data in 2019 were combined for the analysis. The subjective weather classification method was adopted to investigate the effects of different weather types on O3 concentration. The backward trajectory tracking model was used to explore the characteristics and changes of O3 pollution under two extreme weather types. The results indicate there is a good correlation between O3 concentration and ambient temperature. Under the control of low pressure on the ground and the influence of southwest airflow in the upper air for Tianjin, heavy O3 pollution occurred frequently. The addition of external transport and local generation will cause high O3 values when the weather system is weak. The O3 concentration is closely related to ambient temperature. Continuous high-temperature weather is conducive to the photochemical reaction. The multi-day O3 pollution process would occur when the weather system is robust. The first and second types of extreme weather are more likely to cause persistent O3 pollution processes. Under the premise of stable emission sources, the change in weather patterns was the main reason affecting the O3 concentration. This study aims to improve O3 pollution control and air quality prediction in the BTH region and large cities in China.

1. Introduction

Urban near-ground ozone (O3) is a secondary pollutant formed by a series of photochemical reactions of precursors, such as nitrogen oxides (NOX) and volatile organic compounds (VOCs) under sunlight conditions [1,2,3]. As a strong atmospheric oxidant, it greatly affects human health and plant growth [4,5]. The high concentrations of O3 not only affect the normal growth of organisms, but change the local atmospheric environment, which plays a pivotal role in global climate change [5,6,7,8]. In addition, O3 also has adverse effects on the human body. Inhalation of O3 could cause respiratory diseases [9]. Prolonged exposure to high concentrations of O3 could destroy the immune system’s defensive capabilities and induce lymphocyte chromosomal lesions [10]. Long-term exposure to a high-O3 environment will lead to nervous system poisoning and damage to the immune defense capabilities. In severe cases, it will induce chromosomal lesions of lymphocytes, cancerous cells, and neonatal malformations [11,12,13].
The rapid development of urbanization and industrialization in China has resulted in the massive emission of atmospheric active substances into the environment. As a result, most cities are facing severe photochemical pollution problems characterized by high concentrations of O3. Previous studies have shown that the characteristics of air pollution dominated by PM2.5 in China are changing to O3 pollution. Many cities in China are becoming new hot spots for O3 pollution in the world [14]. There are three central photochemical regions in China, including Beijing-Tianjin-Hebei (BTH), Yangtze River Delta (YRD), and Pearl River Delta (PRD). From 2013 to 2018, the average annual concentration of PM2.5 decreased by more than 40% in those areas, but the O3 concentration increased sharply, with the average yearly concentration rising by 10%. O3 pollution in super-large urban agglomerations, mainly in the BTH, YRD, PRD and their surrounding areas, has deteriorated significantly. It has become another serious environmental problem in China. Therefore, the issue of O3 pollution has attracted extensive attention from domestic and foreign researchers. As a secondary photochemical reaction product, the formation of near-surface O3 not only requires sufficient precursor emissions, but its chemical conversion and diffusion processes are closely related to meteorological conditions [15]. A study has shown that meteorological conditions unfavorable to the diffusion of pollutants are the main reason for heavy pollution events [16]. Considering meteorological factors, strong radiation, less cloud cover, high temperature, long durations of sunshine, and low humidity conditions are favorable for the photochemical reaction and could promote the formation of O3 [17]. Low wind speed is beneficial to the accumulation of local O3 concentration, and wind direction affects the regional transport of O3 pollution [18]. In general, atmospheric circulation directly affects cloud cover, temperature, wind speed, humidity, rainfall, and other meteorological conditions. Different circulation backgrounds lead to various photochemical reaction efficiencies and pollution transport processes, which have disparate effects on O3 concentration. Therefore, O3 pollution is closely related to meteorological factors. Determining the weather type could help to better assess the influence of meteorological conditions on O3 pollution [19]. Previous studies have shown that weather typing is an important method for studying the influence of meteorological conditions on O3 concentration [20]. Subjective classification methods classify and study the atmospheric pollution process based on weather maps and synoptic principles. In comparison, objective classification methods mainly depend on the oblique rotation decomposition method, Lamb–Jenkinson algorithm, as well as other objective algorithms. These methods have stronger usability and application values. At present, the subjective classification method has been widely used in Beijing, Shanghai, Ningbo, and Fujian to conduct research on O3 pollution [21,22]. Although there are some studies on the characteristics and sources of O3 pollution in the BTH region, few studies focused on the relationship between different weather patterns and characteristics of O3 [23,24].
Tianjin is located in the north-central part of the BTH region, which is easily affected by sea–land wind circulation. As the largest port city in North China, Tianjin has developed petroleum, chemical, and equipment manufacturing industries. It is one of the cities with heavier O3 pollution in the BTH region. Due to the geographical location and current environmental situation of the prominent O3 pollution problem, it is reasonable to select Tianjin as a representative city to analyze and study the relationship between O3 pollution characteristics and meteorology. Generally, summer is the worst season for O3 pollution. In order to study the influence of meteorological factors on the O3 characteristics under heavy pollution processes, the real-time O3 concentrations dataset and meteorological parameters in Tianjin from June to August were investigated in this study. The backward trajectory tracking model was exploited to explore the characteristics and variations of O3 pollution under two extreme weather types. This research aims to improve the prevention policy of O3 pollution in the BTH region and large urban agglomerations in China during severe O3 pollution periods.

2. Materials and Methods

2.1. Study Area

As the core city of the BTH region, Tianjin is located at 116°43′ E–118°04′ E and 38°34′ N–40°15′ N. It is located on the west coast of the Pacific Ocean, in the northeast of the North China Plain, where the five tributaries of the Haihe River meet. It is the traffic throat and ocean shipping port from Beijing to East China. The energy structure in Tianjin is relatively simple, and oil is the dominant form of energy production. The primary forms of energy consumption mainly concentrate on coal, crude oil, and natural gas. This is similar to the situation in most cities in the BTH region. Tianjin belongs to the north temperate zone, which is dominated by monsoon circulation. The climate type is a semi-humid monsoon climate, with the average annual precipitation being 550–680 mm. Due to the proximity of the Bohai Sea, the marine climate has a significant impact on the urban area of Tianjin. The sea–land wind cycle has a great influence on the composition and distribution of aerosol molecules. As an important port city in the BTH region, Tianjin’s geographical location and urban construction have an essential impact on the regional atmospheric environment. Therefore, the study of O3 pollution characteristics in Tianjin is of great significance for atmospheric pollution management in the BTH region.

2.2. Data Acquisition

The hourly monitoring data of pollutants in the study period were gathered during this research from 14 national air quality monitoring stations in Tianjin. The location of the monitoring stations is shown in Figure 1. The Model 49i O3 analyzer (Thermo corporation, Waltham, MA, USA) was used for O3 monitoring, with a minimum detection limit of 0.5 × 10⁻⁹ and a time resolution of 5 min. This instrument works based on absorbing ultraviolet light (UV) at 254 nm. The intensity of this single ultraviolet light is directly related to the concentration of O3. By measuring the intensity of ultraviolet light, the concentration of O3 can be calculated. The design of the double optical chamber detection system improves the stability of light intensity and the sensitivity of the instrument. The quality control is in strict accordance with the requirements of the “Technical Specification for Operation and Quality Control of Ambient Air Quality Continuous Automated Monitoring System for SO2, NO2, O3, CO” (HJ 818-2018). The meteorological data came from observation stations of the meteorological department in Tianjin, including the real-time temperature, relative humidity, and wind direction and speed. The surface weather maps and 500 hPa weather maps are obtained from the Central Weather Station (www.nmc.cn (accessed on 1 June 2019)). During the study period, all the monitors were scientifically managed and maintained to ensure the regular operation of the equipment. Daily quality control was carried out to ensure the reliability of the monitoring data. The monitoring data during the calibration period or within two hours after the instrument was started up were regarded as invalid data and were removed. Moreover, data with large differences from surrounding observations were considered to be major errors caused by chance and were deleted. Routinely, the data were recorded every 5 min, and 12 groups of data were collected every hour. Hourly averages were done only when there were at least 9 sets of valid data, and the daily mean was calculated only if there were 18 or more sets of effective hourly averages per day.

2.3. Analytical Method

Meteorological elements have a great impact on environmental pollutants. The primary purpose of the weather classification method is to classify a mass of complex weather circulation patterns into several dominant types according to frequency distributions. Through the weather classification method, the impact of atmospheric changes on pollutants were systematically analyzed. Based on the external characteristics and internal mechanism of meteorological parameters, the subjective classification method effectively distinguishes weather types. Generally, researchers analyze the characteristics of atmospheric circulation according to synoptic principles by manually reviewing a large number of weather maps. Thus, several main weather types are summarized, which have strong applicability to different research areas. Based on previous research, this method usually divides weather types into four types: low pressure, high pressure, uniform pressure, and other weather types [25]. Its classification results have strong guidance for the purpose of research [26]. In this study, the subjective weather classification method was adopted. Based on the data of the surface weather and 500 hPa high-altitude weather, the weather patterns during the experiment were divided in detail. Then, combined with the atmospheric diffusion theory, the O3 characteristics under different weather types were analyzed. Additionally, the relationship between meteorological elements and atmospheric pollutants under varying weather types were specifically clarified. Furthermore, the effects of different weather types on the O3 concentration in the BTH area are clearly stated.

2.4. Backward Trajectory Model

The hybrid single-particle Lagrangian integrated trajectory model (HYSPLIT backward trajectory model) is a professional model for calculating and analyzing the transportation and diffusion trajectory of air pollutants [27]. The backward trajectory model is a mixture method of the Lagrangian and Eulerian methods. The Lagrangian method is used for advection and diffusion processing, while the Euler method is adopted for pollutant concentration calculation. This model was developed jointly by the National Oceanic and Atmospheric Administration (NOAA, Washington, DC, USA) Air Resources Laboratory and the Australian Bureau of Meteorology. It is a professional model that is mainly used to calculate and analyze the transport and diffusion trajectories of atmospheric pollutants. Meanwhile, it includes functions for processing the input fields of various meteorological elements, physical processes, and pollutant emission sources, which contains a complete pattern of transport, diffusion, and settlement. The model has been widely used in the world to study the source and transmission path of pollutants [28,29,30]. In this study, the HYSPLIT model was used to track the backward trajectory during the heavy pollution period. Based on Meteoinfo software and Global Data Assimilation System (GDAS) data provided by National Centers for Environmental Prediction (NCEP, College Park, MD, USA), the backward trajectory affecting the atmospheric group in Tianjin was simulated. Furthermore, the hourly backward trajectory of the air mass arriving (starting from 0:00 daily) from June to September was calculated. The trajectory is extended for 24 h, and the simulated height includes 100 m, 500 m, and 1000 m. On the basis of model analysis, a cluster analysis method was used to classify the trajectories in different periods to analyze their origin characteristics.

3. Results and Discussion

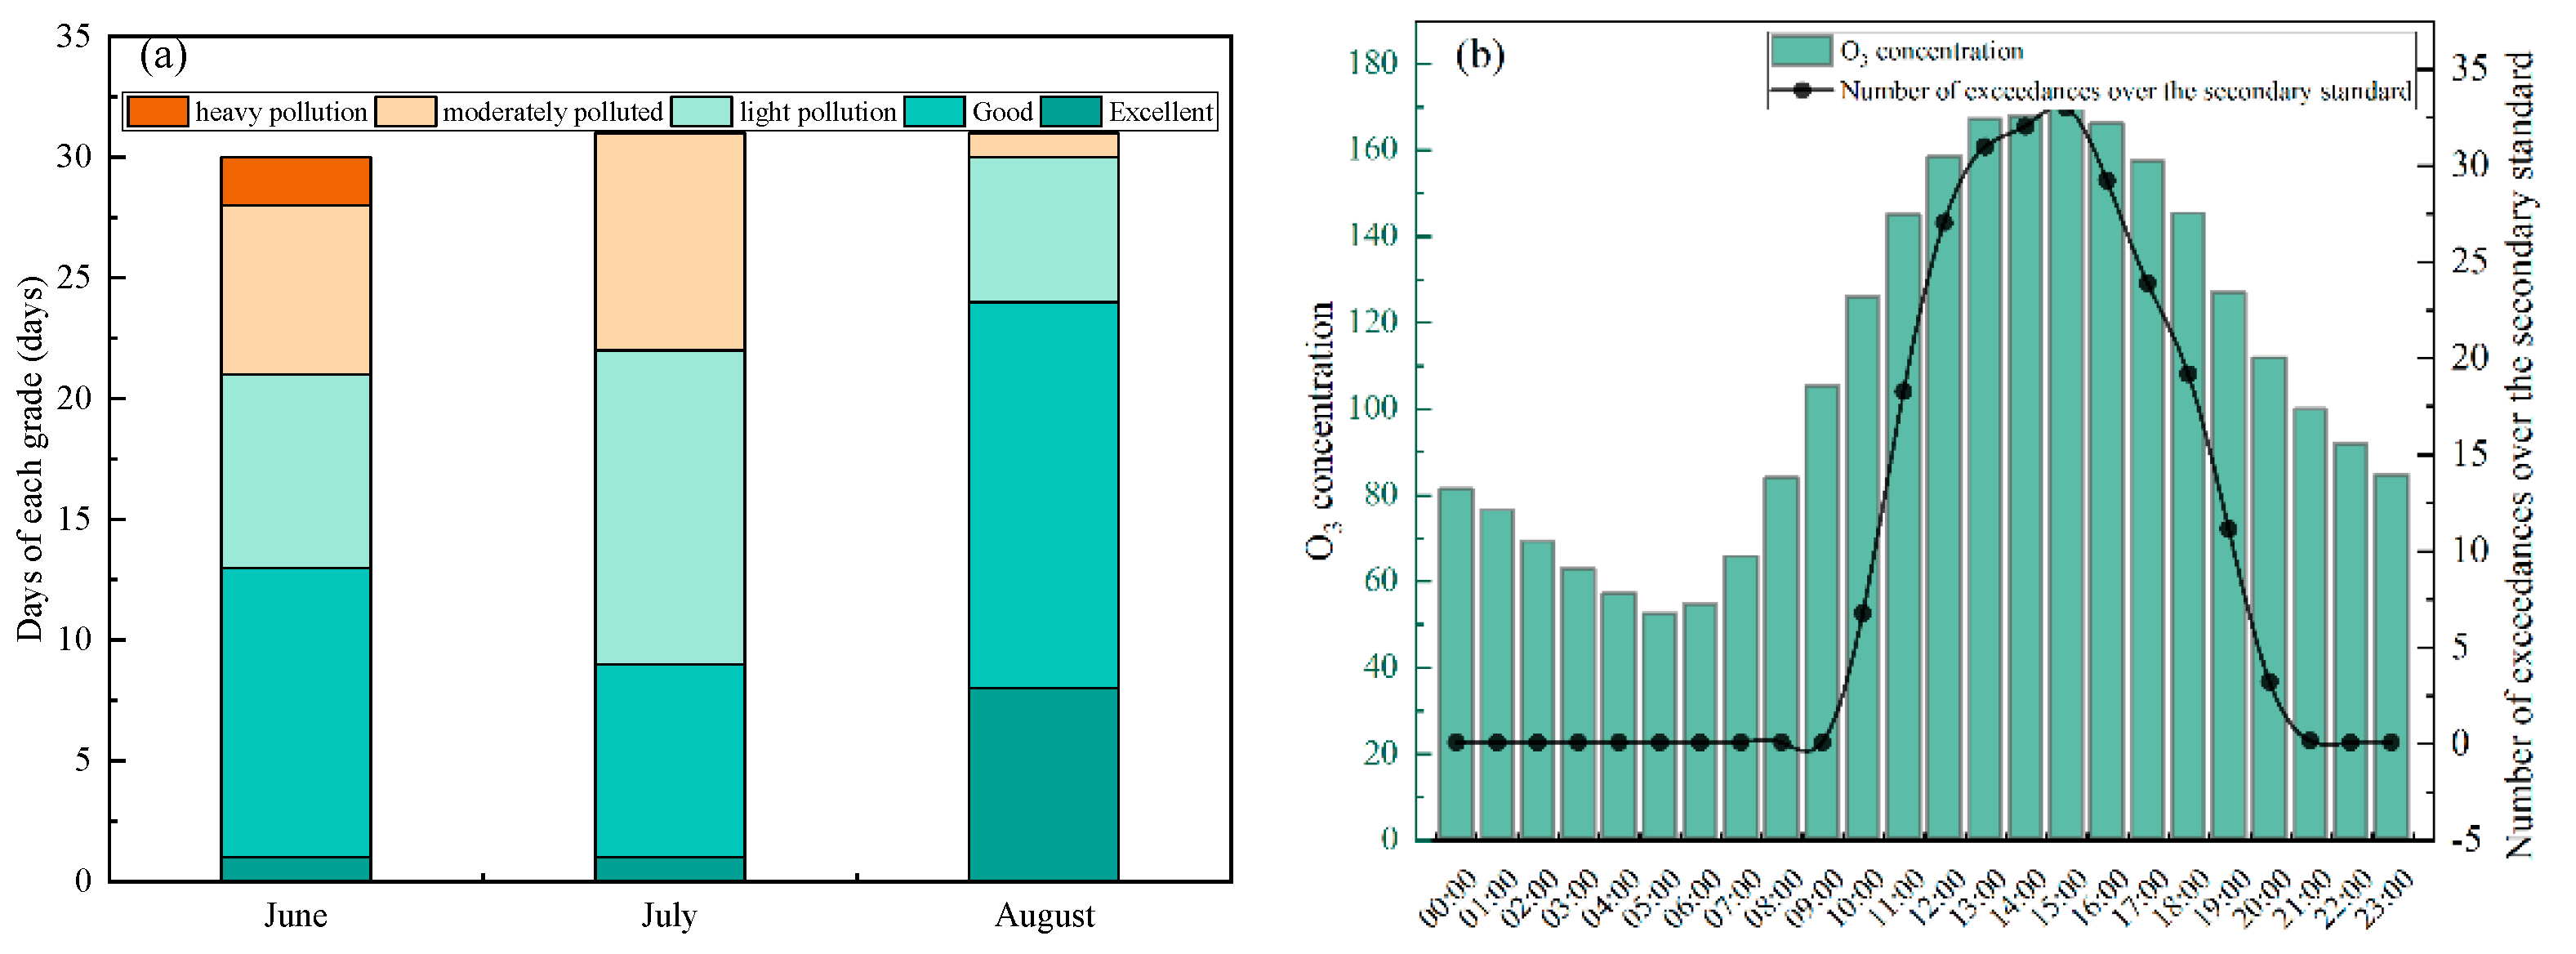
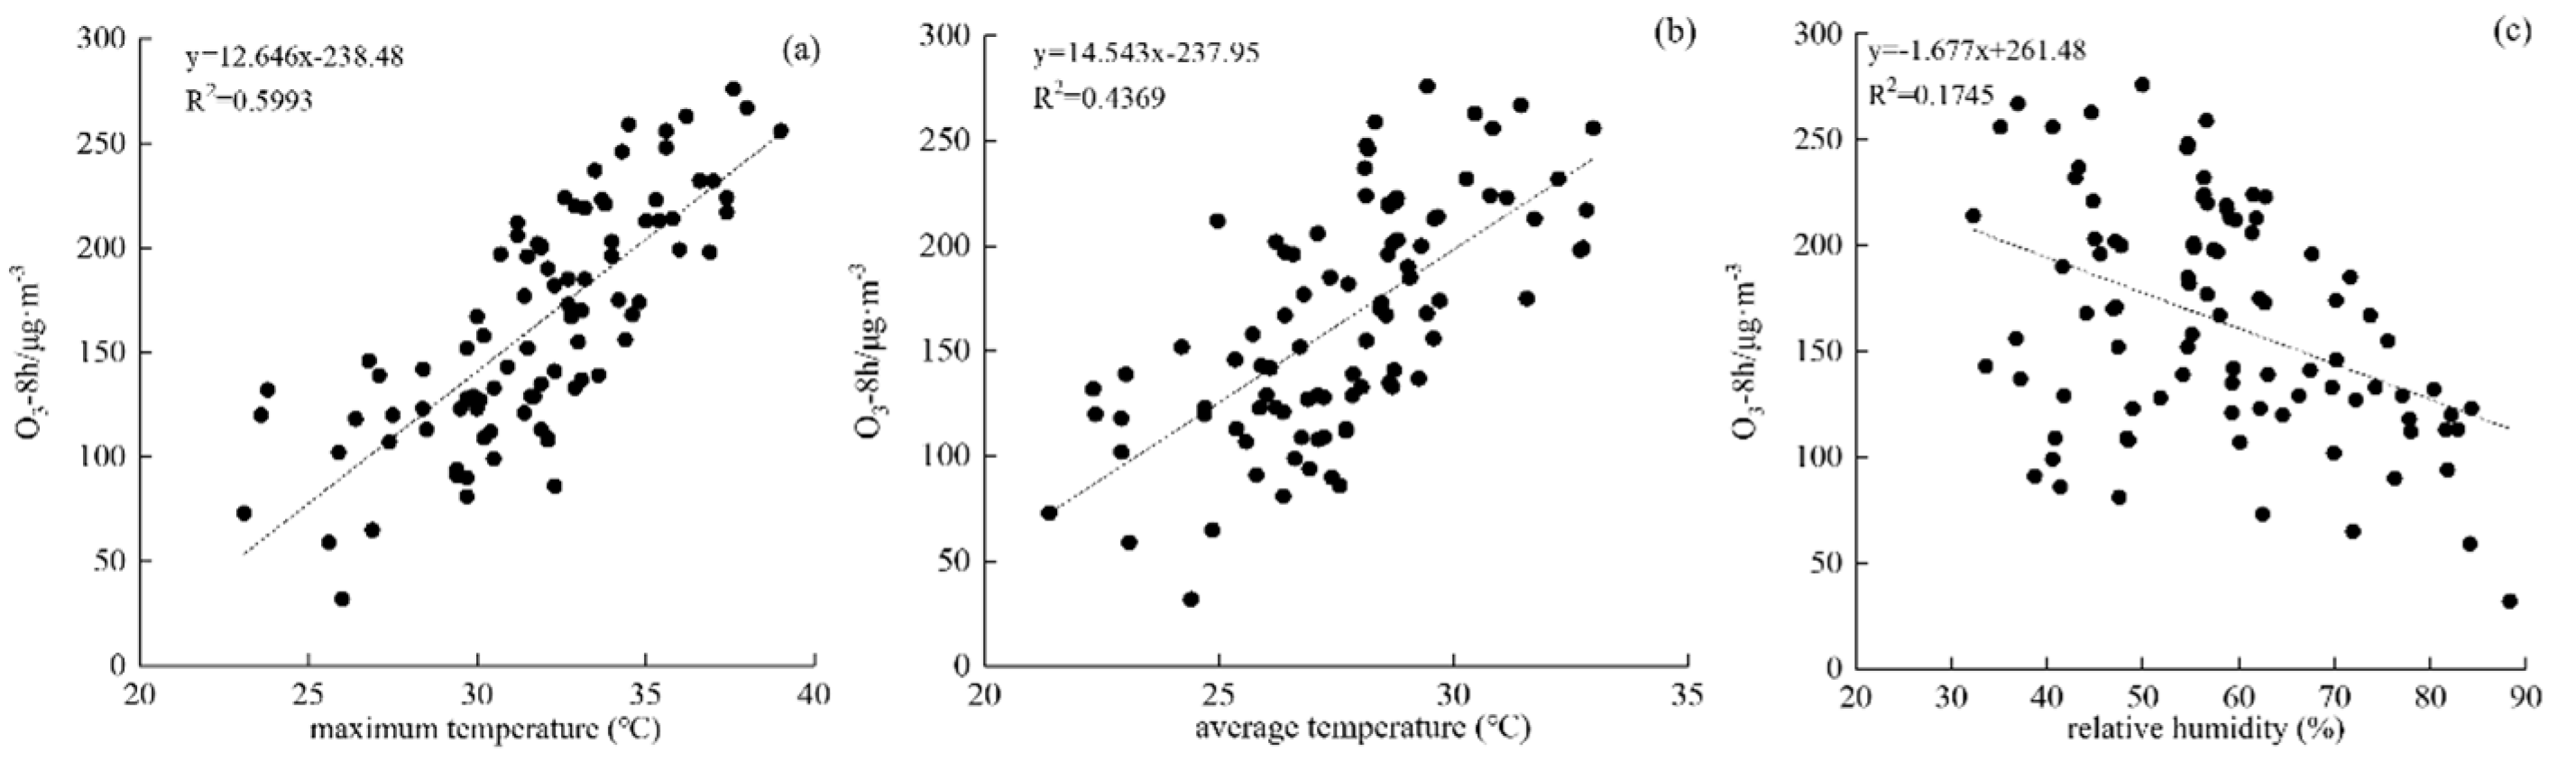
3.1. O3 and Meteorological Parameters

According to the latest China air quality standards (GB 3095-2012), the minimum limit for the daily maximum eight-hour moving average of O3 (O3-MDA8) is 160 μg/m3. The ratio of the number of days exceeding this limit to the total number of monitoring days is the over-standard rate. During this monitoring period, the O3-MDA8 in Tianjin exceeded the secondary concentration limit for a total of 46 days, and the over-standard rate reached 50%. Figure 2a shows the distribution of O3 pollution levels in Tianjin from June to August in 2019. The number of days for excellent (AQI (Air quality index) ≤ 50), good (50 < AQI ≤ 100), light pollution (100 < AQI ≤ 150), moderate pollution (150 < AQI ≤ 200), and severe pollution (AQI > 200) were 10 days, 36 days, 27 days, 17 days, and 2 days, respectively. O3 concentration was generally lower in August, while severe pollution occurred in June, which is due to the more frequent occurrence of adverse weather conditions in June. Figure 2b shows the diurnal variation of hourly O3 concentration and non-attainment frequency during the study period. The diurnal variation of the hourly O3 concentration and the over-standard frequency both showed a single-peak distribution. The O3 concentration in the daytime was significantly higher than that in the night, and the high value of O3 concentration was mainly concentrated at 12:00–17:00, with the peak value at 15:00. The average O3 concentration at 15:00 was 170 μg/m3, and exceeded the national standard by 33-times (160 μg/m3). It indicates that O3 concentrations during the afternoon were significantly higher than at other times of the day.
According to the meteorological data, the mean daily average temperature in Tianjin was 27.7 °C and the mean daily maximum temperature was 31.8 °C during the study period. The average relative humidity was 58.0% and the average wind speed was 1.6 m/s. Southeasterly and southwesterly winds were the prevailing wind direction. The correlation of O3 concentration with air temperature and relative humidity is shown in Figure 3. It can be seen that O3-MDA8 presented a significant positive correlation with air temperature. The correlation coefficient between O3-MDA8 and daily maximum temperature is 0.77. As well, the correlation coefficient between O3-MDA8 and daily mean temperature is 0.66. However, O3-MDA8 had a weak negative correlation with relative humidity, with a correlation coefficient of 0.42. The results show that the daily maximum temperature is one of the critical meteorological factors affecting O3 pollution. Since O3 is generated by photochemical reactions of primary pollutants such as VOCs and NOX under sunlight, high temperatures are conducive to the progress of photochemical reactions, which could lead to an increase in O3 concentration. Chen et al. quantitatively analyzed the effects of eight major meteorological factors on surface O3 concentration in China. They found that temperature, sunshine duration, and evaporation had consistently positive effects on O3 concentration in most cities, while humidity and precipitation had consistently negative effects on O3 concentration [31]. Zhao et al. carried out relevant studies on O3 concentration in Hong Kong and confirmed that O3 concentration increased with the rise of air temperature. The O3 concentration was positively correlated with sunshine duration and negatively correlated with relative humidity [32]. Relative humidity mainly affects O3 concentration in two aspects: On the one hand, higher humidity will lead to precipitation, which will reduce O3 concentration through wet cleaning. However, higher humidity will affect O3 chemistry by reducing the production of oxygen atoms and increasing the production of hydroxyl radicals; then, the O3 concentration would be reduced. In general, higher humidity will inhibit O3 production [33].

3.2. The Relationship between Weather Type and O3

During the study period, there were no significant differences in emission sources in Tianjin. Therefore, the difference in meteorological elements under different weather types is the main factor that affects the O3 concentration. According to the surface weather map and the 500 hPa high-altitude weather map, the weather types in Tianjin during the observation period were divided into four categories, as shown in Table 1. During the research period, the days in case 1 (low-altitude: before low pressure-low pressure, high-altitude: before trough-trough) in Tianjin accounted for 25.0% of the total monitoring days. Moreover, 31.5% of the days were in case 2 (low-altitude: before high pressure-high pressure, high-altitude: after trough-before ridge). Last, 31.5% of the weather was in case 3 (low-altitude: uniform pressure field, high-altitude: ridge-trough-flat). The proportion of days affected by typhoon accounted for 12% of the days.
During case 1, the low-altitude is mainly controlled by a low-pressure system, then the high-altitude is mainly affected by southwesterly airflow. The local emissions of precursors are difficult to diffuse, which is conducive to the generation of localized O3. The wind direction and speed in the four cases are shown in Figure 4a–d, respectively. Due to southwest and southeast being the dominant wind directions (Figure 4a), it was easy to transport pollutants from Hebei, and even Shandong, to Tianjin. Moreover, the blocking effect of the northern mountains also caused pollutants to accumulate. Therefore, local generation and extraneous transport will lead to the occurrence of high O3 concentration in this scenario [34]. In the second scenario, the high-altitude air mass is mainly affected by the southwest airflow, and the low-altitude is mostly controlled by the high-pressure system with low temperatures, which is not conducive to the generation of local O3. At the same time, the dominant wind direction is easterly (Figure 4b), which makes it easy to bring clean air from the sea to Tianjin. It also has a specific scavenging effect on locally-generated pollutants. These combined effects result in lower O3 concentrations in this situation. Under the third scenario, the temperature conditions were between the first and second weather types. The southwesterly and southeasterly winds were the dominant wind directions (Figure 4c). The light breeze and inconspicuous pressure gradient of the uniform pressure field are not conducive to the transmission and diffusion of pollutants. Therefore, the O3 concentration is also in the moderate condition. When in the fourth category, Typhoon Lekima had moved steadily northwest from Zhejiang province to Bohai Bay under the guidance of southeasterly airflow. As the precipitation brought by the typhoon has an excellent removal effect on O3 concentration, the O3 concentration was generally low in the place where the hurricane passed.

3.3. Analysis of Typical O3 Pollution Processes

In order to study the characteristics of weather systems under different pollution scenarios, the process of sustained high/low O3 concentration that occurred in different weather types was investigated. The process of high-concentration O3 from June 12 to 14 and June 22 to 29 under the first weather type were selected as a representative of heavy pollution, while the process of low-concentration O3 from June 15 to 17 under the second weather type were recognized as a representative of great air quality.

3.3.1. Analysis of Typical Serious Pollution Processes

From June 12 to June 14, the mean value of O3 maximum 8-h per day >160 μg/m3 for Tianjin is under the first weather category. Taking 08:00 on the 12th as an example, the ground and upper air weather maps are shown in Figure 5a,b, respectively. The diurnal variation of pollutant concentration and meteorological elements is shown in Figure 6a. During this period, the O3-MDA8 in Tianjin exceeded the standard for three consecutive days, with the highest hourly concentration being 289 μg/m3. The highest temperature on that day reached 37.6 °C. The maximum concentration of O3 appeared in the three days from 15:00 to 16:00, which was the same time as the maximum temperature. The winds are southwesterly or southeasterly with wind speeds of 1–2 m/s in this period. Influenced by the upper southwest airflow, the transported pollutants transported easily converged and sank to the ground under the control of the low-pressure field. Due to the low surface wind speed, the transported pollutants were not easily diffused. Combined with the generation of local pollutants, high O3 concentrations were very likely to occur.
In order to trace the emission source, the HYSPLIT model was used to simulate the backward trajectory for 24 h before 15:00 on the 12th with Tianjin City (39.1° N, 117.2° E) as the endpoint. Figure 7a–c show the 24-h backward trajectory of the air masses at different altitudes for the three O3 processes, respectively. The air mass with a height of 100 m mainly comes from Shandong Province (South of Tianjin) to Tianjin via Cangzhou and other cities. The air masses at elevations 500 m and 1000 m mainly come from the southwestern region, reaching Tianjin from Xingtai, Hengshui, Shijiazhuang, Baoding, etc. After 14:00 on June 11th (06:00, 11th UTC), the high air mass has a clear tendency to sink, resulting in the accumulation of the polluted air mass transmitted from outside. Under the dual influence of foreign transmission and local generation, the O3 concentration in Tianjin reached a severe pollution situation on June 12.
During the pollution process from June 22 to 29, the meteorological conditions in Tianjin were in case 1, as shown in Figure 5c,d. Affected by the high-altitude southwest airflow, the high-temperature weather continued for seven days, and the O3-MDA8 exceeded the national standard for eight days. From June 22 to 28, the maximum daily concentration of O3 appeared at 15:00–16:00—the same time as the maximum daily temperature. Among them, the highest temperature on the 24th was 38.0 °C, and the highest O3 concentration attained was 280 μg/m3. Figure 5c,d show the surface and upper-air synoptic maps for this period, which are dominated by southwesterly or southeasterly winds of magnitude 2. After 10:00 on June 29, the meteorological conditions changed to north wind control, and the O3 concentration was significantly lower than previous periods. The diurnal variation of pollutant concentration and meteorological elements from June 22 to 29 are shown in Figure 6b. The analysis results of the backward trajectory model (Figure 7b) show that the low air mass during this high O3 concentration period mainly came from the southern region. Firstly, it moved westward from Shandong Province, then northwards through Cangzhou to reach Tianjin. The high air mass also primarily came from the south part, moving westward from Shandong Province, then northwards through Hengshui to Tianjin. After 20:00 on June 24 (12:00, 24th UTC), the 100-m high air mass had a clear tendency to sink, but the 500-m high air mass did not drop to the ground. The polluted air mass transmitted from outside had no impact on the local area. The O3 pollution was mainly generated by local photochemical reactions at high temperatures.

3.3.2. Analysis of Typical O3 Low-Value Processes

From June 15 to 17, the value of O3-MDA8 was lower than 100 μg/m3 for three consecutive days. During this period, the meteorological conditions in Tianjin are as is in case 2, as shown in Figure 8. The immense pressure gradient made the weather system active, and the systemic easterly winds delayed the peak O3 concentration. The maximum daily concentration of O3 during these three days all appeared at 17:00, which was obviously lagging behind the typical process in case 1. The diurnal variation of pollutant concentration and meteorological elements from June 15 to 17 are shown in Figure 9. The daily maximum temperature is below 30 °C, and the highest O3 value period is accompanied by southeasterly winds of 1.6–5.4 m/s. The meteorological conditions are conducive to the spread of pollutants. According to the analysis of the backward trajectory at 8:00 on June 16 (9:00, 16th UTC) (Figure 7c), all high-level air masses during the higher O3 concentration period came from the northeastern region via the Bohai Sea. Moreover, the high-level air masses showed no tendency to sink and accumulate. Due to the dilution effect of the marine air mass on the locally generated pollutants, the O3-MDA8 on the day reached its lowest value, which was only 73 μg/m3.

4. Conclusions

In this study, Tianjin was selected as a typical representative city in the BTH region that suffers from severe O3 pollution, and the characteristics of O3 pollution in this region were discussed in detail. The meteorological conditions during the study period were used to analyze the impact of weather types on the O3 concentration. Moreover, the HYSPLIT model was adopted to explore the characteristics and variation of O3 pollution under extreme weather conditions.
In the summer of 2019, the O3-MDA8 of O3 in Tianjin exceeded the second-level concentration limit (160 μg/m3) of the “Ambient Air Quality Standard” (GB 3095-2012) for 46 days, with the failure rate reaching 50.0%. By analyzing the meteorological conditions, the O3 concentration had a relatively significant positive correlation with air temperature, and a weak negative correlation with relative humidity. The daily maximum temperature was a critical meteorological factor affecting O3 pollution. During this period, the days in case 1 accounted for 25.0% of the total monitoring days. Furthermore, 31.5% of the days were in case 2 and 31.5% of the weather was in case 3. The proportion of days affected by Typhoon Lekima was 12.0%. The pollution process generally occurs in the first and second weather types. The first weather type is mainly controlled by low-pressure systems on the ground. Moreover, the high altitude is mainly affected by the southwest airflow. It is the main weather type that causes the high O3 concentration in Tianjin. When the weather system is weak, the external transport pollutants tend to sink and accumulate, which then superimpose the generation of local pollutants, resulting in high O3 concentrations. However, when the weather system is robust, there will be a prolonged period of hot weather. Then, the O3 pollution is generated by local photochemical reaction under high temperatures without accumulation of external transport pollutants. The second weather type is mainly controlled by high-pressure systems on the ground and influenced by northwest airflow in the upper air. In this scenario, the immense pressure gradient makes the weather system active, and the photochemical reaction is relatively weaker. In addition, a systematic easterly wind delayed the peak of O3 concentration. As a result, the O3 concentration is significantly lower than in case 1, reaching excellent air quality levels.
In the current situation of emission sources, the change in weather patterns is the leading cause of the high O3 pollution process. The observation and analysis of meteorological elements could provide practical guidance for predicting O3 pollution, which is of great significance for the prevention and control of O3 pollution in prominent cities and urban agglomerations. In addition, the analysis results of this study have good consistency with the O3 pollution situation in Tianjin during the past five years, and have strong application value for many cities in the BTH region. However, due to differences in geographical conditions, whether the research conclusions are consistent with other regions in China needs further research.

Author Contributions

Conceptualization, Y.L.; methodology, Y.L.; software, Y.B.; investigation, L.L.; resources, J.G.; data curation, J.W.; writing—original draft preparation, Y.L.; writing—review and editing, L.H., M.T. and N.Y. All authors have read and agreed to the published version of the manuscript.

Funding

This work was supported by National Natural Science Foundation of China (42177465) and Tianjin Science and Technology Project (21YFSNSN00200).

Institutional Review Board Statement

Not applicable.

Informed Consent Statement

Not applicable.

Data Availability Statement

The data are not publicly available due to privacy considerations.

Conflicts of Interest

The authors declare no conflict of interest.

References

  1. Swackhamer, D.L. Rethinking the ozone problem in urban and regional air pollution. J. Aerosol Sci. 1991, 24, 977–978. [Google Scholar] [CrossRef]
  2. Zhang, Y.N.; Xiang, Y.R.; Chan, L.Y.; Chan, C.Y.; Sang, X.F.; Wang, R.; Fu, H.X. Procuring the regional urbanization and industrialization effect on ozone pollution in Pearl River Delta of Guangdong, China—ScienceDirect. Atmos. Environ. 2011, 45, 4898–4906. [Google Scholar] [CrossRef]
  3. Schneidemesser, E.V.; Monks, P.S.; Allan, J.D.; Bruhwiler, L.; Forster, P.; Fowler, D.; Lauer, A.; Morgan, W.T.; Paasonen, P.; Righi, M. Chemistry and the Linkages between Air Quality and Climate Change. Chem. Rev. 2015, 115, 3856–3897. [Google Scholar] [CrossRef]
  4. Zelm, R.V.; Preiss, P.; Goethem, T.V.; Dingenen, R.V.; Huijbregts, M. Regionalized life cycle impact assessment of air pollution on the global scale: Damage to human health and vegetation. Atmos. Environ. 2016, 134, 129–137. [Google Scholar] [CrossRef]
  5. Monks, P.S.; Archibald, A.T.; Colette, A.; Cooper, O.; Williams, M.L. Tropospheric ozone and its precursors from the urban to the global scale from air quality to short-lived climate forcer. Atmos. Chem. Phys. 2014, 14, 8889–8973. [Google Scholar] [CrossRef]
  6. Rai, R.; Agrawal, M. Impact of Tropospheric Ozone on Crop Plants. Proc. Natl. Acad. Sci. India Sect. B Biol. Sci. 2012, 82, 241–257. [Google Scholar] [CrossRef]
  7. Feng, Z.; Sun, J.; Wan, W.; Hu, E.; Calatayud, V. Evidence of widespread ozone-induced visible injury on plants in Beijing, China. Environ. Pollut. 2014, 193, 296–301. [Google Scholar] [CrossRef]
  8. Ma, Z.; Hu, X.; Sayer, A.M.; Levy, R.; Liu, Y. Satellite-Based Spatiotemporal Trends in PM2.5 Concentrations: China, 2004–2013. Environ. Health Perspect. 2016, 124, 184–192. [Google Scholar] [CrossRef]
  9. Khaniabadi, Y.O.; Hopke, P.K.; Goudarzi, G.; Daryanoosh, S.M.; Jourvand, M.; Basiri, H. Cardiopulmonary mortality and COPD attributed to ambient ozone. Environ. Res. 2017, 152, 336–341. [Google Scholar] [CrossRef]
  10. Ji, M.; Cohan, D.S.; Bell, M.L. Meta-analysis of the Association between Short-Term Exposure to Ambient Ozone and Respiratory Hospital Admissions. Env. Res. Lett. 2011, 6, 24006–24016. [Google Scholar] [CrossRef]
  11. Lehman, J.; Swinton, K.; Bortnick, S.; Hamilton, C.; Baldridge, E.; Eder, B.; Cox, B. Spatio-temporal characterization of tropospheric ozone across the eastern United States. Atmos. Environ. 2004, 38, 4357–4369. [Google Scholar] [CrossRef]
  12. The short-term effect of ambient ozone on mortality is modified by temperature in Guangzhou, China. Atmos. Environ. 2013, 76, 59–67. [CrossRef]
  13. Barletta, B.; Meinardi, S.; Rowland, F.S.; Chan, C.Y.; Wang, X.; Zou, S.; Chan, L.Y.; Blake, D.R. Volatile organic compounds in 43 Chinese cities. Atmos. Environ. 2005, 39, 5979–5990. [Google Scholar] [CrossRef]
  14. Xiao, L.; Hong, J.; Lin, Z.; Cooper, O.R.; Schultz, M.G.; Xu, X.; Tao, W.; Gao, M.; Zhao, Y.; Zhang, Y. Severe Surface Ozone Pollution in China: A Global Perspective. Environ. Sci. Technol. 2018, 5, 487–494. [Google Scholar]
  15. Wang, T.; Xue, L.; Brimblecombe, P.; Lam, Y.F.; Li, L.; Zhang, L. Ozone pollution in China: A review of concentrations, meteorological influences, chemical precursors, and effects. Sci. Total Environ. 2016, 575, 1582–1596. [Google Scholar] [CrossRef]
  16. Zheng, X.Y.; Fu, Y.F.; Yang, Y.J.; Liu, G.S. Impact of atmospheric circulations on aerosol distributions in autumn over eastern China: Observational evidence. Atmos. Chem. Phys. 2015, 15, 3285–3325. [Google Scholar] [CrossRef]
  17. Wang, Y.; Luo, H.; Jia, L.; Ge, S. Effect of particle water on ozone and secondary organic aerosol formation from benzene-NO2-NaCl irradiations. Atmos. Environ. 2016, 140, 386–394. [Google Scholar] [CrossRef]
  18. Liu, J.; Wu, D.; Fan, S.J.; Liao, Z.H.; Deng, T. Impacts of precursors and meteorological factors on ozone pollution in Pearl River Delta. Zhongguo Huanjing Kexue/China Environ. Sci. 2017, 37, 813–820. [Google Scholar]
  19. Xu, X.; Lin, W.; Wang, T.; Yan, P.; Tang, J.; Meng, Z.; Wang, Y. Long-term trend of surface ozone at a regional background station in eastern China 1991–2006: Enhanced variability. Atmos. Chem. Phys. 2008, 8, 2595–2607. [Google Scholar] [CrossRef]
  20. Directory, U. Annals of the New York Academy of Science; New York Academy of Science: New York, NY, USA, 2017. [Google Scholar]
  21. Briffa, K.R.; Jones, P.D.; Kelly, P.M. Principal component analysis of the Lamb Catalogue of Daily Weather Types: Part 2, seasonal frequencies and update to 1987. Int. J. Climatol. 2010, 10, 147–157. [Google Scholar] [CrossRef]
  22. Pattison, I.; Lane, S.N. The relationship between Lamb weather types and long-term changes in flood frequency, River Eden, UK. Int. J. Climatol. 2011, 32, 1971–1989. [Google Scholar] [CrossRef]
  23. Cheng, G.; Hong, L. A typical weather pattern for ozone pollution events in North China. Atmos. Chem. Phys. 2019, 19, 13725–13740. [Google Scholar]
  24. Fang, X.; Xiao, H.; Sun, H.; Liu, C.; Zhang, Z.; Xie, Y.; Liang, Y.; Wang, F. Characteristics of Ground-Level Ozone from 2015 to 2018 in BTH Area, China. Atmosphere 2020, 11, 130. [Google Scholar] [CrossRef]
  25. Tang, G.; Li, X.; Wang, X.; Xin, J.; Hu, B.; Wang, L.; Ren, Y.; Wang, Y. Effects of Weather Patterns on Surface Ozone Pollution in Beijing. Environ. Sci. 2010, 31, 6. [Google Scholar]
  26. Lam, K.S.; Wang, T.J.; Wu, C.L.; Li, Y.S. Study on an ozone episode in hot season in Hong Kong and transboundary air pollution over Pearl River Delta region of China—ScienceDirect. Atmos. Environ. 2005, 39, 1967–1977. [Google Scholar] [CrossRef]
  27. Wang, L.T.; Wei, Z.; Yang, J.; Zhang, Y.; Zhang, F.F.; Su, J.; Meng, C.C.; Zhang, Q. The 2013 severe haze over southern Hebei, China: Model evaluation, source apportionment, and policy implications. Atmos. Chem. Phys. 2014, 14, 3151–3173. [Google Scholar] [CrossRef]
  28. Yassin, M.F.; Almutairi, S.K.; Ali, A.H. Dust storms backward Trajectories’ and source identification over Kuwait. Atmos. Res. 2018, 212, 158–171. [Google Scholar] [CrossRef]
  29. Szkop, A.; Pietruczuk, A. Analysis of aerosol transport over southern Poland in August 2015 based on a synergy of remote sensing and backward trajectory techniques. J. Appl. Remote Sens. 2017, 11, 016039. [Google Scholar] [CrossRef]
  30. Maldonado, P.G.; Campa, A.; Gonzalez-Castanedo, Y.; Castell, N.; Rosa, J.; Stein, A.; Chen, B. Size distribution and concentrations of heavy metals in atmospheric aerosols originating from industrial emissions as predicted by the HYSPLIT model. Atmos. Environ. 2013, 71, 234–244. [Google Scholar]
  31. Chen, Z.; Zhuang, Y.; Xie, X.; Chen, D.; Cheng, N.; Yang, L.; Li, R. understanding long-term variations of meteorological influences on ground ozone concentrations in beijing during 2006–2016. Environ. Pollut. 2019, 245, 29–37. [Google Scholar] [CrossRef]
  32. Zhao, W.; Gao, B.; Liu, M.; Qing, L.U.; She-Xia, M.A.; Sun, J.R.; Chen, L.G.; Fan, S.J. Impact of Meteorological Factors on the Ozone Pollution in Hong Kong. Environ. Sci. 2019, 40, 55–66. [Google Scholar]
  33. Zhao, W.; Chen, L.; Fan, S.; Gao, B.; Guo, H. Assessing the impact of local meteorological variables on surface ozone in Hong Kong during 2000–2015 using quantile and multiple line regression models. Atmos. Environ. 2016, 144, 182–193. [Google Scholar] [CrossRef]
  34. Yuan, L.I.; Kong, J.; Hong, X.U.; Gao, J.; Wenkai, B.I.; Yang, N. Analysis of ozone pollution characteristic in Tianjin and its source apportionment. Environ. Pollut. Control 2019, 41, 647–651. [Google Scholar]
Figure 1. The national air quality monitoring station in Tianjin.
Atmosphere 13 01312 g001
Figure 2. (a) Air quality classification during monitoring (b) Hourly-mean O3 concentration of Tianjin (average of the hourly concentration from all monitors at each hour) and the number of exceedances over the secondary standard (160 μg/m3) for each hour during monitoring.
Atmosphere 13 01312 g002
Figure 3. Correlation of O3-MDA8 with (a) maximum temperature, (b) average temperature, and (c) relative humidity.
Atmosphere 13 01312 g003
Figure 4. Meteorological parameters during different weather types: (a) case 1, (b) case 2, (c) case 3, and (d) case 4.
Atmosphere 13 01312 g004
Figure 5. (a) Surface weather map and (b) 500 hPa weather map at 08:00 on June 12. (c) Surface weather map and (d) 500 hPa weather map at 08:00 on June 24.
Atmosphere 13 01312 g005
Figure 6. Diurnal variation of pollutant concentration and meteorological element from (a) June 12 to 14 and (b) June 22 to 29.
Atmosphere 13 01312 g006
Figure 7. 24-h backward air mass trajectory at 100 m, 500 m, and 1000 m altitudes during different research periods: (a) June 12th, (b) June 24th, and (c) June 16th.
Atmosphere 13 01312 g007
Figure 8. (a) Surface and (b) 500 hPa weather map at 08:00 on 16 June 2019.
Atmosphere 13 01312 g008
Figure 9. Diurnal variation of pollutant concentration and meteorological element from June 15 to 17.
Atmosphere 13 01312 g009
Table 1. Statistics of weather types in summer 2019.
ScenarioWeather TypesDays (D)Maximum Temperature (°C)Average Temperature (°C)Average Relative Humidity (%)O3-MDA8 (μg/m3)Exceeding Rate (%)
Low-AltitudeHigh-Altitude
case 1before low pressure-low pressurebefore trough-trough2334.229.352.020687.0
case 2before high pressure-high pressureafter trough-before ridge2930.126.357.112813.8
case 3uniform pressure fieldridge-trough-flat(little pressure gradient)2932.528.156.118772.4
case 4typhoontyphoon1130.026.777.61119.1
Publisher’s Note: MDPI stays neutral with regard to jurisdictional claims in published maps and institutional affiliations.

