Article

How Nanoparticle Aerosols Transport through Multi-Stenosis Sections of Upper Airways: A CFD-DPM Modelling

1
Department of Biomedical Engineering, Islamic University, Kushtia 7003, Bangladesh
2
School of Mechanical and Mechatronic Engineering, Faculty of Engineering and IT, University of Technology Sydney, Ultimo, NSW 2007, Australia
3
Department of Information and Communication Technology, Islamic University, Kushtia 7003, Bangladesh
4
School of Aerospace Engineering, Huazhong University of Science and Technology, Wuhan 430074, China
5
Department of Biomedical Engineering, Arsanjan Branch, Islamic Azad University, Arsanjan 6134937333, Iran
6
School of Engineering, STEM College, RMIT University, Melbourne, VIC 3083, Australia
7
School of Mechanical, Medical and Process Engineering, Faculty of Engineering, Queensland University of Technology, Brisbane, QLD 4000, Australia
*
Author to whom correspondence should be addressed.
Atmosphere 2022, 13(8), 1192; https://doi.org/10.3390/atmos13081192
Submission received: 26 June 2022 / Revised: 24 July 2022 / Accepted: 25 July 2022 / Published: 28 July 2022

Abstract

:
Airway stenosis is a global respiratory health problem that is caused by airway injury, endotracheal intubation, malignant tumor, lung aging, or autoimmune diseases. A precise understanding of the airflow dynamics and pharmaceutical aerosol transport through the multi-stenosis airways is vital for targeted drug delivery, and is missing from the literature. The object of this study primarily relates to behaviors and nanoparticle transport through the multi-stenosis sections of the trachea and upper airways. The combination of a CT-based mouth–throat model and Weibel’s model was adopted in the ANSYS FLUENT solver for the numerical simulation of the Euler–Lagrange (E-L) method. Comprehensive grid refinement and validation were performed. The results from this study indicated that, for all flow rates, a higher velocity was usually found in the stenosis section. The maximum velocity was found in the stenosis section having a 75% reduction, followed by the stenosis section having a 50% reduction. Increasing flow rate resulted in higher wall shear stress, especially in stenosis sections. The highest pressure was found in the mouth–throat section for all flow rates. The lowest pressure was usually found in stenosis sections, especially in the third generation. Particle escape rate was dependent on flow rate and inversely dependent on particle size. The overall deposition efficiency was observed to be significantly higher in the mouth–throat and stenosis sections compared to other areas. However, this was proven to be only the case for a particle size of 1 nm. Moreover, smaller nanoparticles were usually trapped in the mouth–throat section, whereas larger nanoparticle sizes escaped through the lower airways from the left side of the lung; this accounted for approximately 50% of the total injected particles, and 36% escaped from the right side. The findings of this study can improve the comprehensive understanding of airflow patterns and nanoparticle deposition. This would be beneficial in work with polydisperse particle deposition for treatment of comprehensive stenosis with specific drugs under various disease conditions.

1. Introduction

Air pollution is a major public concern and significantly affects human health, especially the respiratory system. According to the World Health Organization (WHO), 9 out of 10 people in the world breathe polluted air, resulting in death for around 8 million people each year (outdoor—4.2 million, and household/indoor—3.8 million) [1]. Around 47% of deaths were due to lung diseases, including 7–8% due to lung cancer, 19% due to chronic obstructive pulmonary disease, and 21% due to pneumonia [2]. Currently, researchers are showing interest in the health status of lungs and various lung diseases based on air pollutant sources [3,4]. To analyze the mechanisms of particle transport, particle deposition, dropping pressure, and other parameters in the respiratory tract, several techniques have been adopted to provide more realistic and anatomical models. Inhalation and exhalation, airflow, and particle transport are significant processes of respiratory functions. The inhalation and exhalation processes of the human lung airways have attracted the attention of researchers. Several studies have been performed to determine the drop in pressure and have marked its relation to the breathing rate [5,6,7]. However, it is difficult to access the human lung for investigation of particle deposition patterns due to its complex geometrical structure [8,9]. For further simplification, a wide range of studies have been undertaken into the characteristics of airflow and particle transport of lung airways in idealized [10,11,12] and realistic models [13,14,15,16]. Kim et al. [17] found that aging effects reduce the diameter of respiratory airways, thus limiting airflow. Islam et al. [18] studied the effect of airway reduction due to aging, and found that smaller airways have higher particle deposition rates. Several other studies have been performed on respiratory diseases that also cause airway inflammation and obstruct the lung airways [19,20]. All of the above studies have improved the knowledge regarding airflow and particle transport in lung airways. However, these studies have only considered particle depositions and airflow characteristics within healthy airways.
Several methods have been adopted to study airflow and particle transport inside human lungs, including experimental methods [21,22] and theoretical methods [23,24]. Some studies have been performed using accurate airway modeling [25,26,27], which is based on computed tomography (CT) and magnetic resonance imaging (MRI) scans. Based on the CT and MRI scans, simple lung models have been used to compare airflow characteristics within normal lung airways [28,29,30,31,32]. The model of the airways was also employed to study the particle deposition fraction [33,34,35]. Furthermore, some researchers also focused on studying the symmetric lung [36,37] and asymmetric lung [26,38,39,40]. They found that the sudden change in the cross-sectional area, and unusual airways added to the bends, generate intense turbulence. To study the variations in turbulent intensity in the human respiratory system, several methods have been adopted, including direct numerical simulation (DNS), large eddy simulation (LES) [26,41], Reynolds-averaged equations [24,25,42], and detached eddy simulation (DES) [43]. To simulate the turbulent intensity, a previous study the used k-∈ method, which is suitable for a small pressure gradient [44].
In 1976, Hawkings [45] studied the stenosis airways of the trachea and classified them into two levels: the glottic level and subglottic level. Another paper examined infantile subglottic stenosis [46]. A case study [47] of severe subglottic stenosis in children and infants was managed conservatively. In their statistical study, Papsidero [48] confirmed that acquired stenosis of the upper airway in neonates is a major problem leading to long-term disability. A review article reported that, although subglottic stenosis has a wide range of surgical options, stenosis close to the vocal cords remains a challenge [49]. However, they did not mention tracheal stenosis. In a survey of stenosis of the central airways in school-aged children [50], it was found that patients having a congenital obstruction in the laryngeal or tracheal region may show the first symptoms. In a blinded controlled trial, Hoppe et al. [51] found a high sensitivity for both central and segmental airway stenosis. However, multi-row detector CT virtual bronchoscopy enables high-resolution endoluminal imaging of the airways downward to the segmental bronchi. Interventional bronchoscopy should be feasible for the management of tuberculous trachea-bronchial stenosis [52]. Therefore, the long Dumon Y-stent is suitable for treating diffuse trachea-bronchial stenosis due to tuberculous. The study of early endoscopic treatment of acute inflammatory airways [53] raised the tantalizing possibility of favorable modification in the case of the natural history of postintubation tracheal injury. Freitag et al. [54] proposed a classification of central airway stenosis and reported the outcome of the infinite approaches taken in the treatment of trachea-bronchial stenosis. A recommended model for subglottic stenosis is wound healing because Mitomycin is a superior approach and does not produce any side effects [55]. Advanced lung cancer can be treated with photodynamic therapy combined with chemotherapy, which is a safe approach for the removal of the central and peripheral bronchial stenosis and obstruction [56]. A three-dimensional post-transplant complex airway stenosis can be treated with a computer-assisted customized airway stent [57]. A computational analysis of airflow and transport in a CT-based model has been used to predict the velocity flow field for different breathing conditions [58]. However, this study did not consider the oral airways. Another investigation of the particle deposition that reported the micro-particle deposition in the upper airways did not focus on nanoparticle flow in the respiratory tract [59]. Larpruenrudee et al. [60] studied the micro-particle deposition and airflow characteristics within the human lung airways under stenosis conditions. They found that the airflow velocity in the stenosis area was usually higher than that in other areas, and that most of the particles were usually trapped by the wall of bifurcations for all lung generations.
Recently, Lintermann and Schröder [61] studied the pressure variation and flow behavior in tracheal stenosis. Then, they showed that the value of the flow velocity was less than 100 m/s for a tracheal diameter of 1 mm. In a numerical analysis of airflow, they considered the volumetric flow rate, pressure drop, and energy loss rate in the respiratory cycle in the tracheal stenosis section [62]. However, they did not consider the oral or primary airways in the lung. A dynamic study [63] described the pressure variation within the upper lung airways and the effect of the stenosis section on the flow velocity. The result showed that the stenosis section significantly affects the flow velocity. The maximum velocity was found in the stenosis area for all flow rates (3 to 10 L/min). However, this study did not consider the oral airways or the effect of the stenosis area on the particle deposition. Another study [64] undertook airflow and particle flow analysis for large-scale models, but was not able to show the flows of different particles in the lung airways. A numerical simulation [65] detailed airflow and particle transport through a secondary stenosis section. However, the study did not focus on bronchial airways having extensive stenosis conditions of the lung. Furthermore, it did not explain or focus on the size of transporting particles for different breathing conditions.
In the available literature, most studies have investigated the effect of stenosis conditions at various positions of the human lung airways on the airflow characteristics and particle transport and deposition. The studied areas of the stenosis section have included the trachea, and upper and lower airways. Focusing on the stenosis section at the trachea, most studies have only investigated the airflow and particle deposition in one stenosis section. There is still a lack of understanding of the airflow characteristics and particle deposition in multiple stenosis sections in this area. Therefore, the aim of the current study was to focus on the abnormality of the bronchial airways in the lung by focusing on multiple stenosis sections having different sizes, at the trachea and other stenosis sections in the upper airway. Moreover, the study also aimed to analyze the details of particle transport, airflow conditions, deposition fraction, and deposition efficiency of various nanoparticle sizes through the comprehensive bronchial stenosis sections for several airflow rates of the selected area with a smooth flow of the particles.

2. Methods

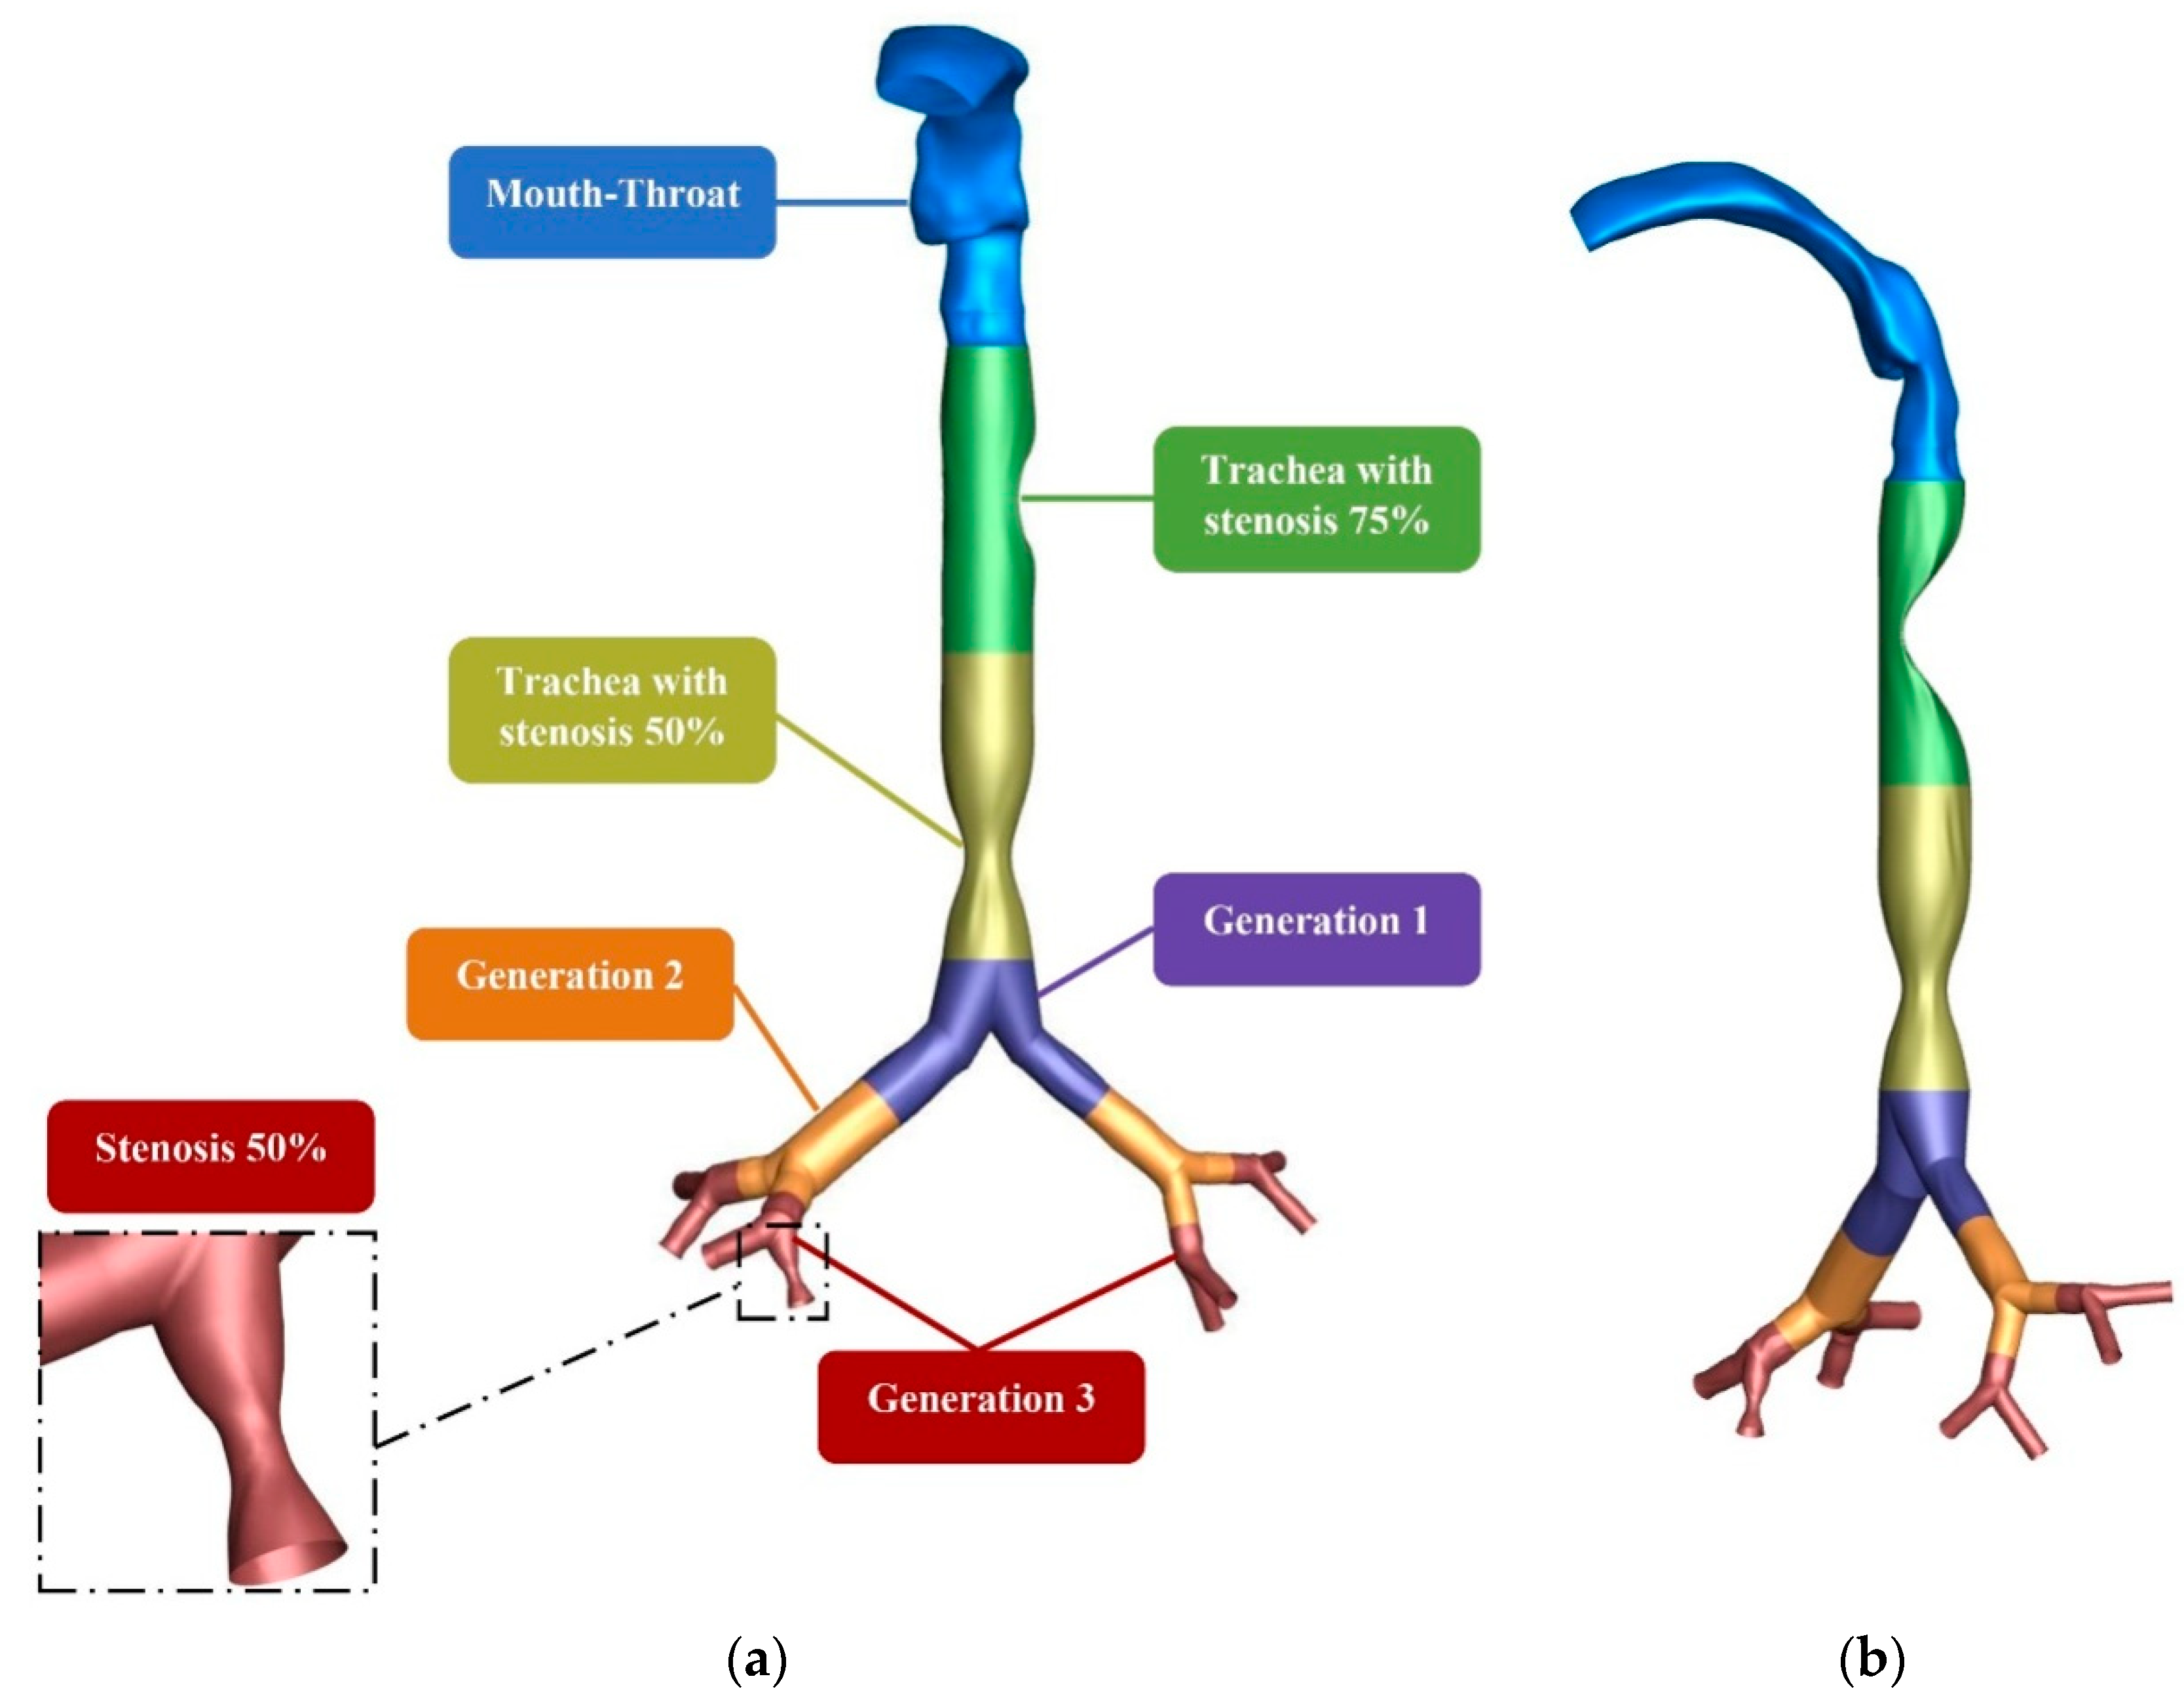
2.1. Geometrical Development

The reconstruction of the mouth–throat model was obtained from computed tomography (CT) images of a 50-year-old man. The trachea and upper airways were generated based on Weibel’s lung dimensions [66]. Figure 1 presents the construction models of the lung geometry with 75% and 50% of stenosis at the trachea, and 50% of stenosis at the third generation of the lung airway. Figure 1a represents the front view of the lung geometry, and Figure 1b shows the side view of the lung geometry. The regenerated model was developed using SolidWorks.

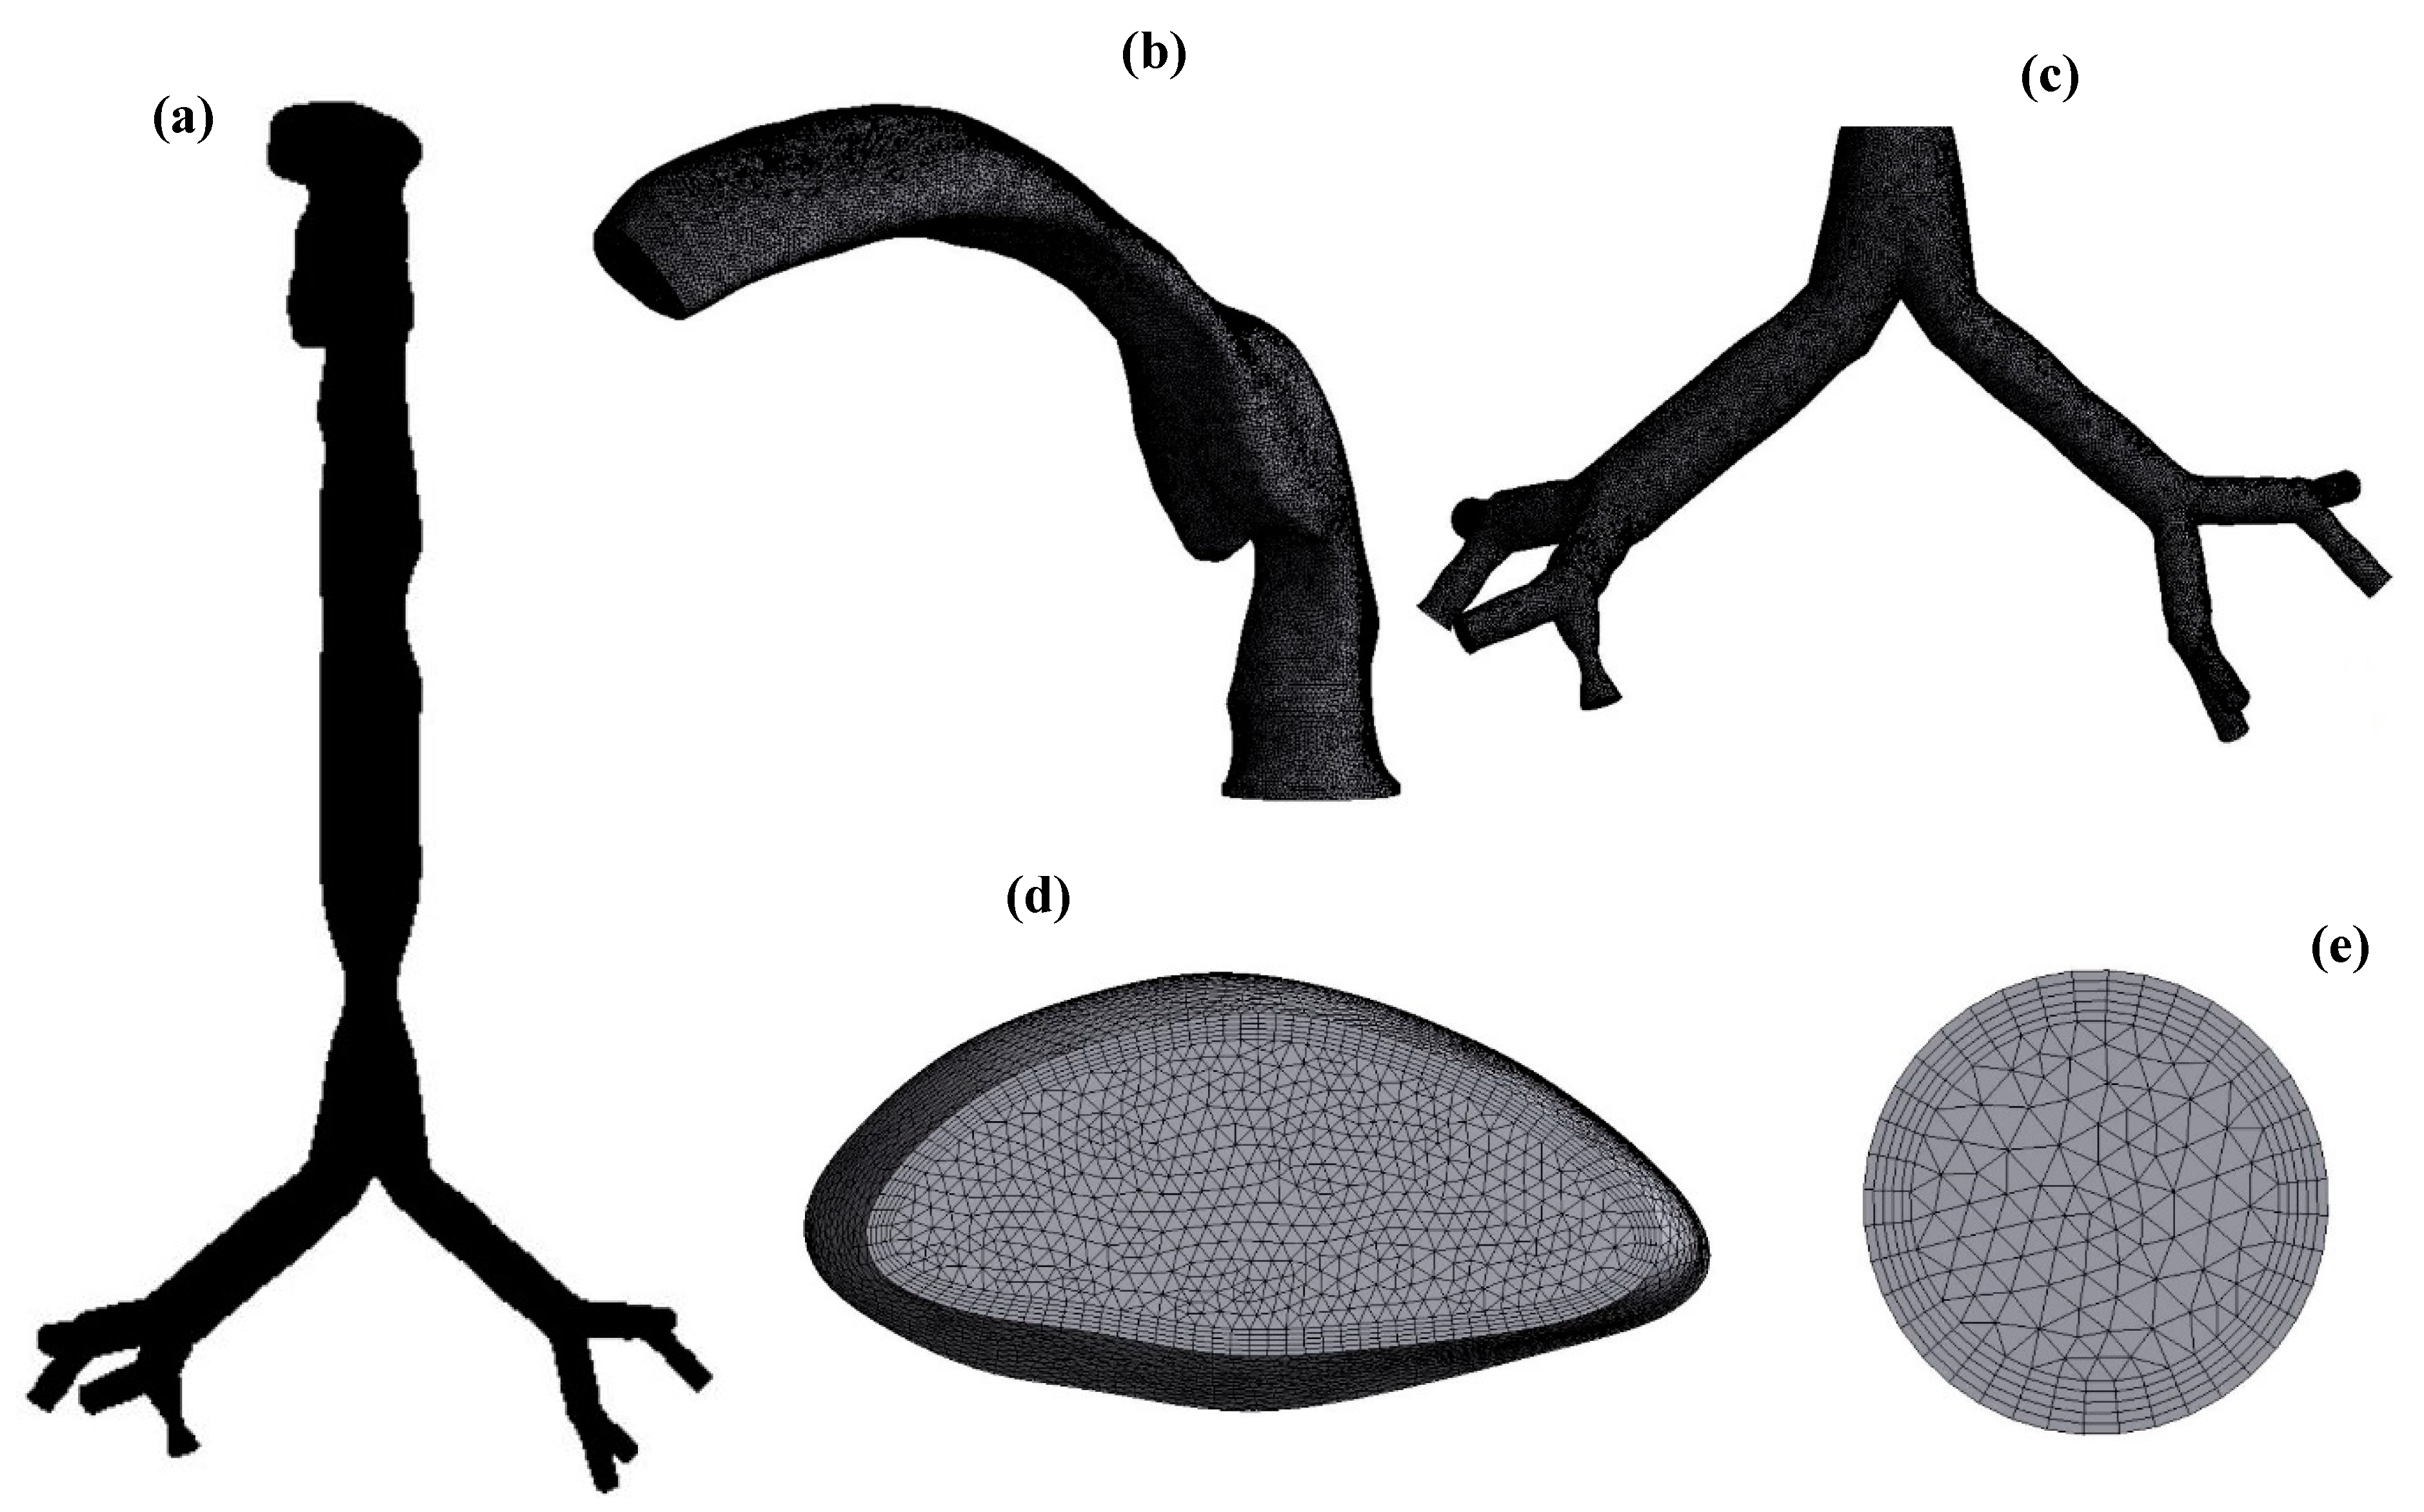
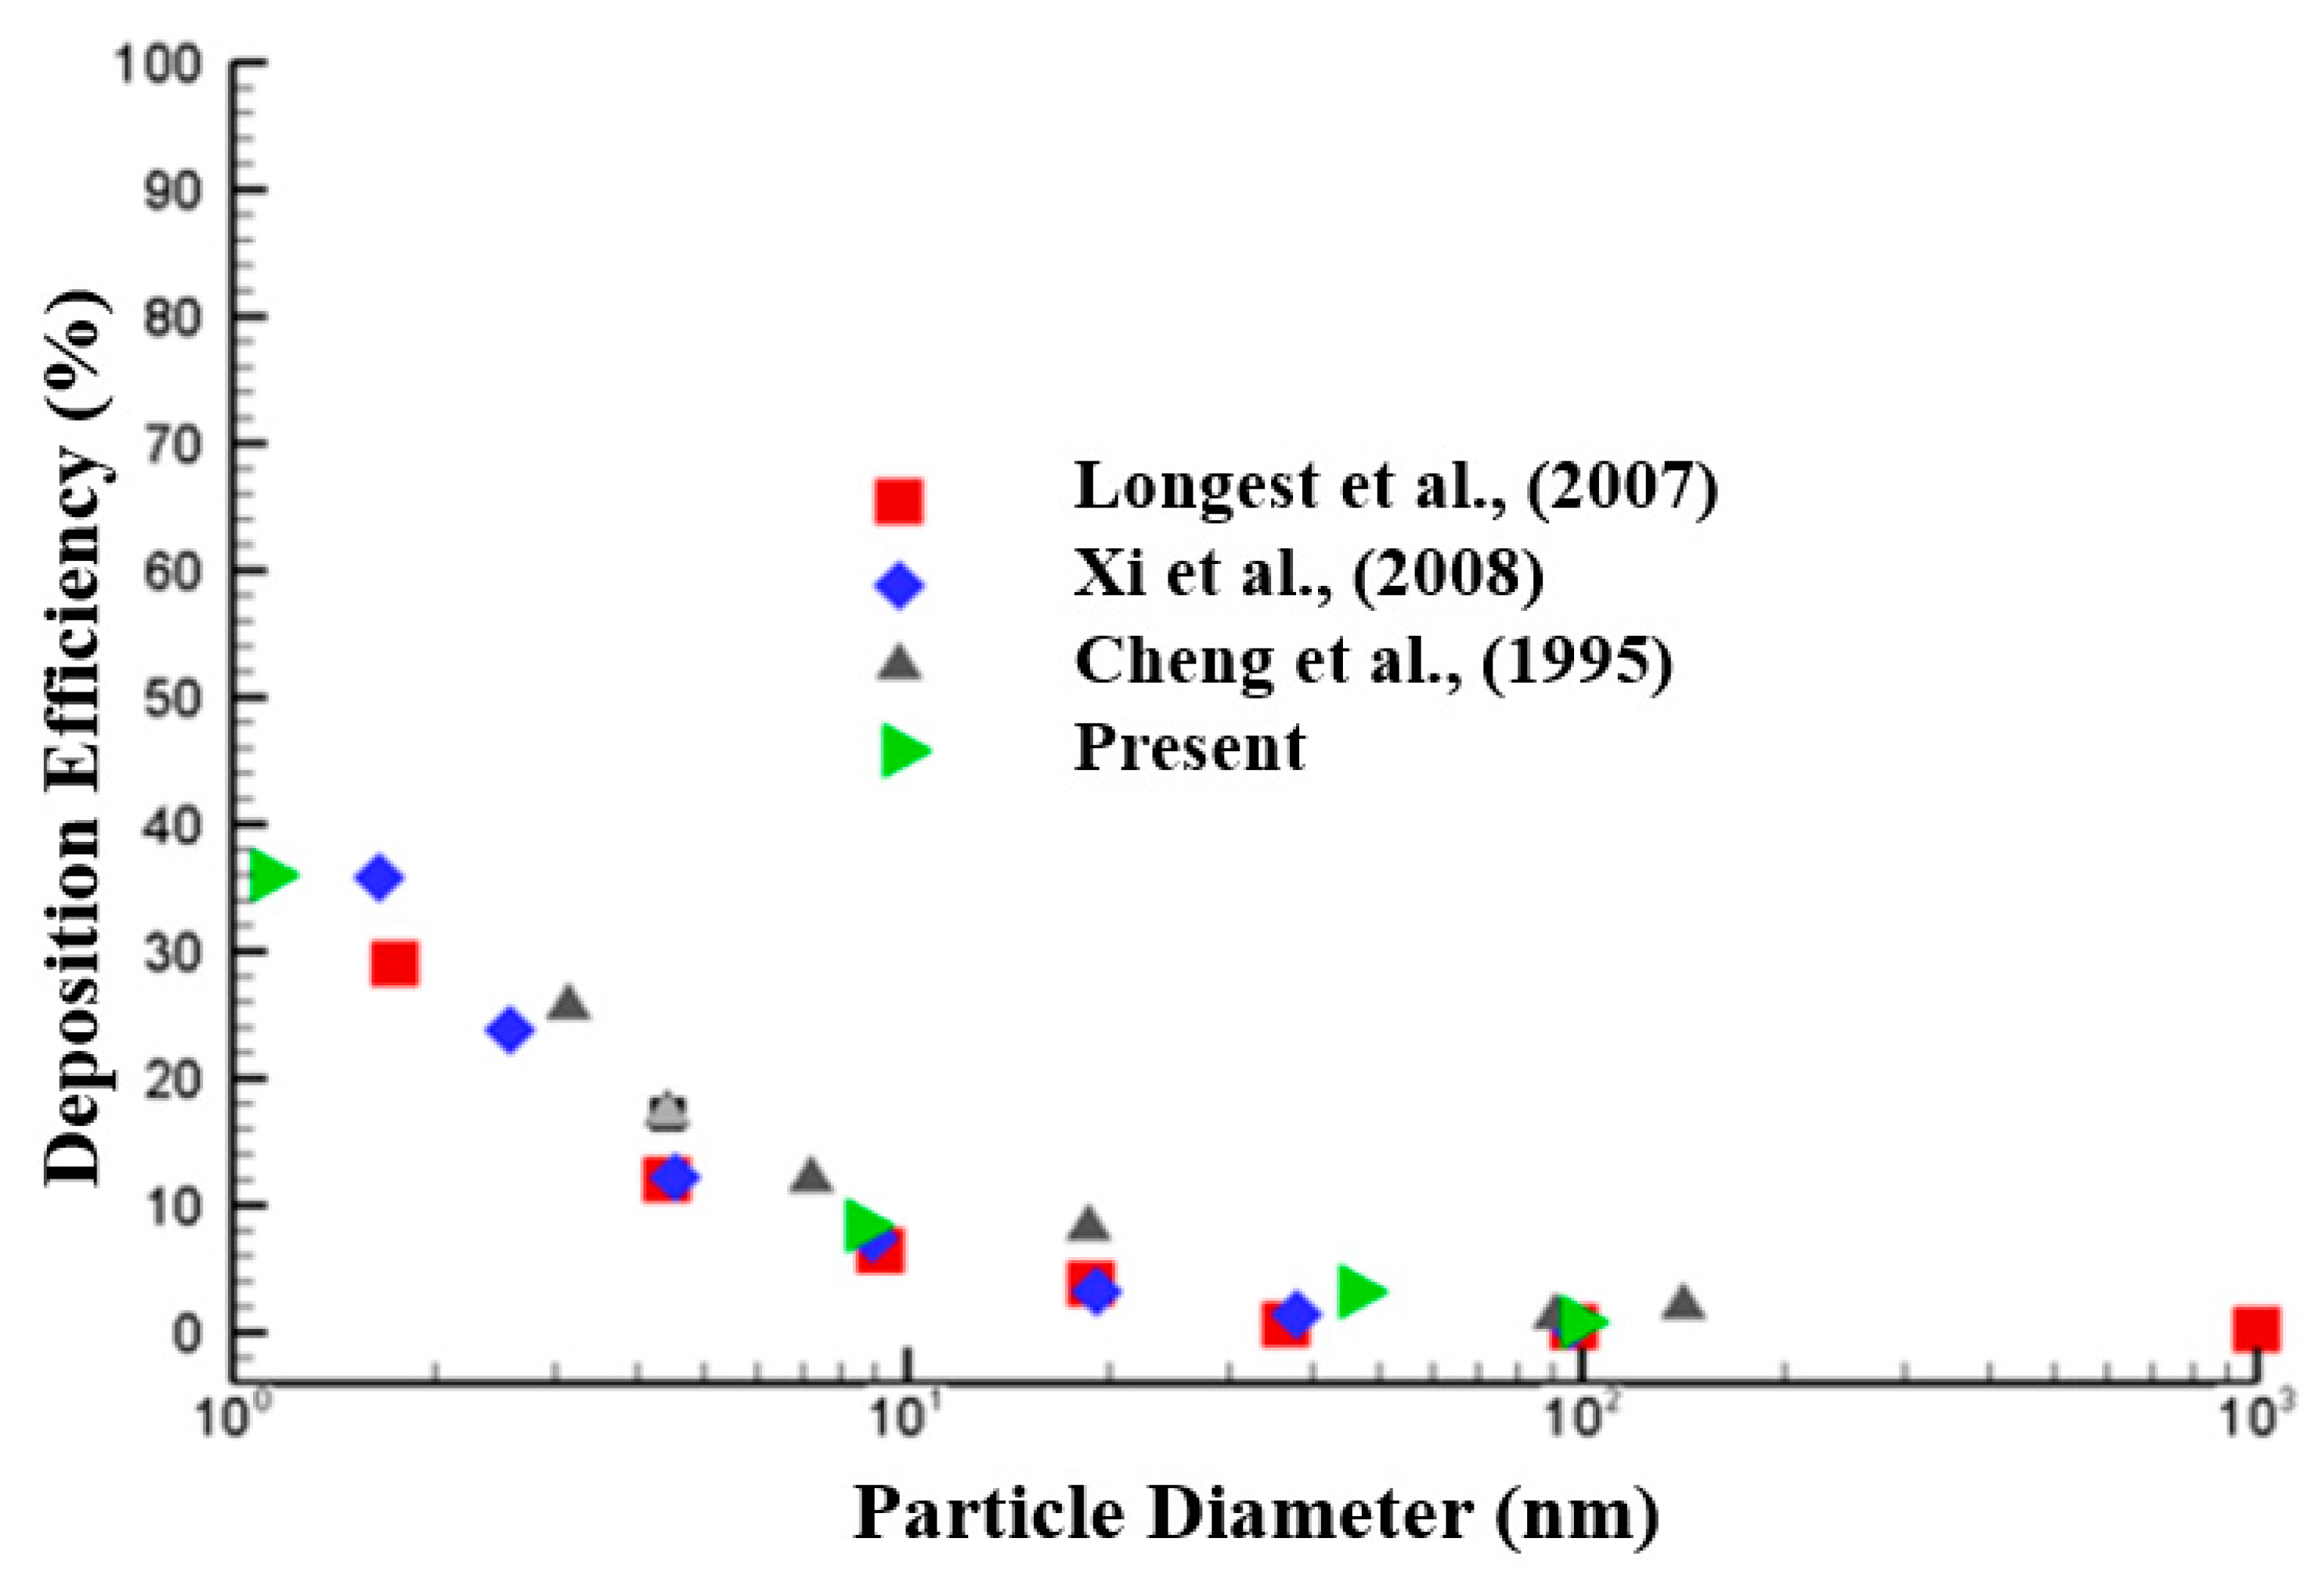
2.2. Mesh Generation and Validation

The ANSYS Meshing module was employed for the mesh generation. Figure 2 represents the unstructured mesh for selected sections of the lung model. These selected sections are plotted for the whole lung with stenosis (Figure 2a), the mouth–throat part (Figure 2b), the bifurcation branch (Figure 2c), the inlet of the mouth–throat (Figure 2d), and the outlet of the 3rd generation (Figure 2e). These elements are connected in an irregular pattern in unstructured meshing, and more complicated domains can be captured [67]. For constructing the mouth–throat and bifurcating branch of bronchial airways, an inflation layer mesh was used. Figure 2d,e shows the cross-sectional view of the inflation layer mesh at the inlet of the mouth–throat section and the outlet of the 3rd generation.
In the boundary wall of the inflation layer, the salient flow can be captured well. The mesh refinement was accomplished for the whole lung model, and 0.302 million computational cells were used for the final model.
The numerical model was validated by the available literature [68,69,70] and is presented in Figure 3. The deposition efficiency (DE) of nanoparticles having different diameters was calculated and compared with the available findings in the literature. The DE of the nanoparticles was calculated at the mouth–throat section, rather than for the whole model presented in Figure 1. The overall comparison showed a good match with the literature.

2.3. Numerical Methods

Three different sections of stenosis in the lung were generated by CT-based bronchus models for comparison. ANSYS-FLUENT (v.19.2) was used to solve the fluid flow and particle transport equation based on the Lagrangian scheme and finite volume-based discretization techniques. The fluid flow was considered as a steady laminar flow using the steady mass and momentum relationships in the following equations:
· ( ρ v ) = 0
· ( ρ v v ) = p + · ( μ ( v + v T ) ) + ρ g ,
where p denotes the static pressure, and ρ g and μ are the gravitational body force and molecular viscosity, respectively.
The internal energy equation was solved based on the following:
· ( ρ v e ) = · j
where e refers to the specific internal energy. The summation of all contributions from the heat condition and the enthalpy diffusion effects is expressed as j or the heat flux.
In general, the uniform flow field is a turbulent flow in the mouth–throat area having a flow rate of >30 L/min [18,33,71,72]. Then, the flow will become parabolic at the trachea and upper airways [73]. Due to the high complexity in the mouth–throat area, there is no established velocity profile for inhalation conditions. Thus, most recent studies prefer using uniform inlet conditions for one-way [23,74,75,76,77] and parabolic [78,79,80,81] inhalation. Therefore, this study used uniform inlet conditions at the mouth–throat inlet.
Due to the smaller size of nanoparticles, Brownian motion was selected in this study [67]:
d v i p d t = F D + F B r o w n i a n + F L i f t + ρ p ρ g ρ p g i ,
F D = 1 C c C D A p ρ g | v i g v i p | ( v i g v i p ) 2 m p = 18 μ g ρ p d p 2 C c ( v i g v i p ) ,  
C c = 1 + 2 λ d p ( 1.257 + 0.4 e 1.1 d p 2 λ ) ,
where F D denotes the drag force per unit mass m p . C D and A p are the drag coefficient and cross-sectional area of the particle, respectively. C c refers to the Cunningham correction factor. λ is for the mean free path of the gas molecules. v i refers to velocity with the i -th component of the time-average of g , which refers to gas (air), and p , which refers to particle. The density of particle material and gas are expressed as ρ p and ρ g , respectively. g i is the gravitational component and μ g is the gas (air) viscosity. d p is defined as the particle diameter. The drag coefficient C D for a low Reynolds number ( R e p ), that is, less than 0.5, is calculated by [82]:
C D = 24 R e p ,   R e p < 0.5 .
The particle Reynolds number is expressed as:
R e p = ρ g d p | v r | μ g
where v r denotes the relative velocity.
The amplitude for the Brownian force is calculated by:
F B r o w n i a n = ζ π S o t ,
where ζ is the unit variance for an independent Gaussian random number, and the time step integration of the particle is defined as ∆t. S o is the spectral intensity, which is determined by:
S o = 216 μ k B T π 2 ρ p d p 5 ( ρ p ρ g ) 2 C c ,
where T refers to the fluid absolute temperature, k B is the Boltzmann constant, and ρ g is the gas density.
Saffman’s lift force was used [83] to calculate the lift force in the present study. The equation is expressed as [84]:
F L i f t = 2 K v 1 / 2 ρ d i j ρ p d p ( d l k d k l ) 1 / 4 ( u u p )
where K = 2.594 and d i j is the deformation tensor.
The numerical investigation was carried out for monodisperse particles. The various particles having different diameters (1, 10, 50, and 100 nm) were injected at three different flow rates of 7.5, 15, and 25 L/m, where the C c values for 1, 10, 50, and 100 nm particles were found to be 21.5, 22.5, 4.949, and 3.11, respectively. Three velocities were calculated based on three different flow rates and the cross-sectional areas at the inlet. For 7.5 L/min, the inlet velocity was 1.04 m/s, whereas the inlet velocities of 15 and 25 L/min were 2.08 and 3.47 m/s, respectively. The calculated Reynolds number was less than 1000 for all flow rates. For the stenosis sections, the velocity increased as per the Bernoulli principle, and the Reynolds number was less than 4000 for all cases. The air was set to be the continuous phase as the primary component, having a density of 1.225 kg/m3 and viscosity of 1.7893 × 10⁻⁵ kg/m·s. The nanoparticles were employed as a discrete phrase for secondary components having a density of 1000 kg/m3.
Particles having different sizes were engrafted from the mouth–throat surface and the boundary conditions were taken as the inlet velocity at the mouth–throat section and outlet outflow at the 3rd generation. Stable walls and no-slip walls were used considering the boundary wall and, under the discrete phase model, a heat flux thermal condition was used at the wall. The “trap” boundary condition was used at the wall to trap particles when they touched the wall. The local deposition convergence test was performed for three sets of particles (comprising 766, 1532, and 3064 particles). However, it was found that the difference in the local deposition between the last two groups was less than 1%. Finally, a total of 1532 particles was used to save computational time. The particle deposition efficiency (DE), which refers to the number of deposited particles in a certain area when travelling through the airways, was calculated by:
DE = Number   of   deposited   particles   in   the   wall Number   of   total   particles   entering   the   mouth
Various groups of particles were applied to test the convergence of the local deposition.
The SIMPLE coupling scheme and second-order pressure discretization technique were used in this study. The second-order upwind technique was also selected to solve the energy and momentum equations [85]. The convergence criteria of 0.0001 was applied for the velocity components and momentum equation, and the criteria of the energy equation was 1 × 10⁻⁶.

3. Result and Discussion

3.1. Velocity Analysis

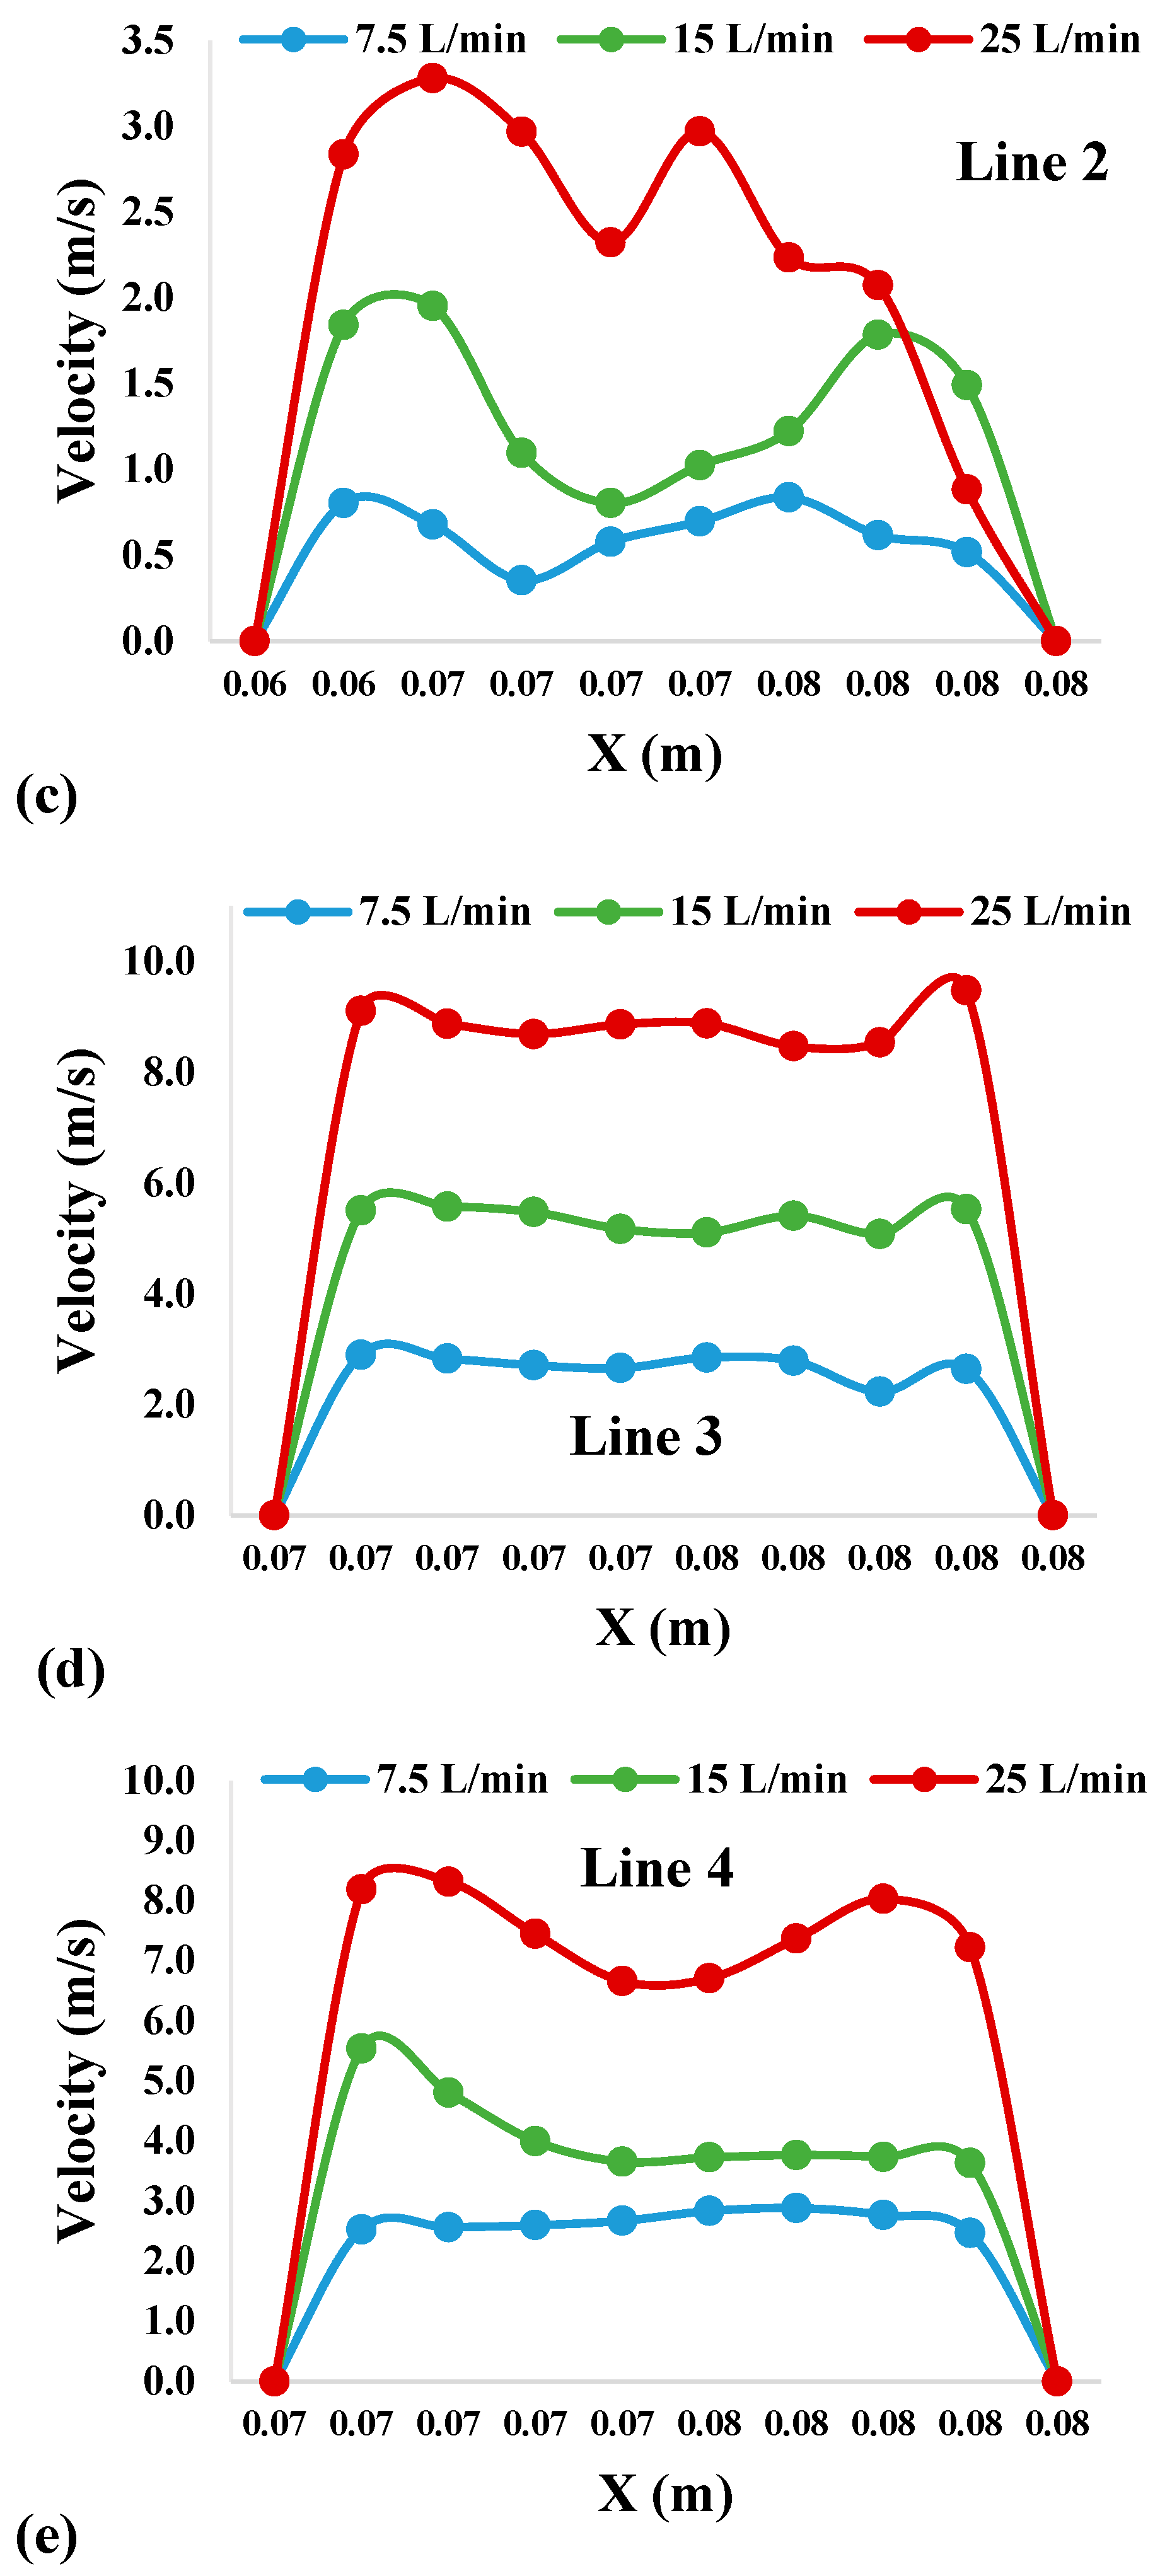
3.1.1. Velocity Profiles

The airflow velocity profile for the three different airflow rates at four selected cross-sections of the oral airways is shown in Figure 4a. Figure 4b–e presents the velocity profiles of bisecting airway portions, which are imprinted at the mouth area (Line 1), throat (Line 2), trachea with 75% stenosis (Line 3), and trachea with 50% stenosis (Line 4), for a better understanding of the flow field. For Figure 4b–e, the x-axis for each line refers to the distance from the wall on one side to the wall on another side, whereas the y-axis refers to the velocity magnitude for each selected location. In the mouth area (Figure 4b), the flow is fully developed and parabolic for all flow rates. Due to the highly asymmetric region of the throat area (Figure 4c), the flow becomes locally transitional and more complex than the flow at the mouth area, especially at the centerline of the airway. Similarly, the flow in the stenosis section (Figure 4d,e) is also more complex and significantly higher than that in other areas, which satisfies the Bernoulli principle. However, the flow at the stenosis location is also lower at the centerline of the airway. It can be summarized that the flow generally passes the out-of-central area of the upper airway. For the effect of the stenosis section on the velocity fields, it can be seen that both stenosis sections generate a higher flow velocity compared to the mouth–throat area. The maximum velocity in this section was observed to be 8–10 m/s.
For further analysis, the velocity contours at four selected locations (refer to Figure 4a for the locations) are presented in Figure 5. These contours represent the velocity fields and velocity vectors at all three flow rates. From this figure, it can be seen that the velocity is usually higher in the stenosis sections for all flow rates. The velocity is lower at the inlet of the mouth area and becomes higher around the throat area (bending airway). However, velocity significantly increases at the trachea with stenosis having a 75% reduction. Then, the velocity becomes lower and higher again at the trachea with stenosis having a 50% reduction. From the velocity vector, there is one vortex on the left side of the mouth area. More complex flows with two vertices are found in both stenosis sections. However, small vertices are observed around the throat area.

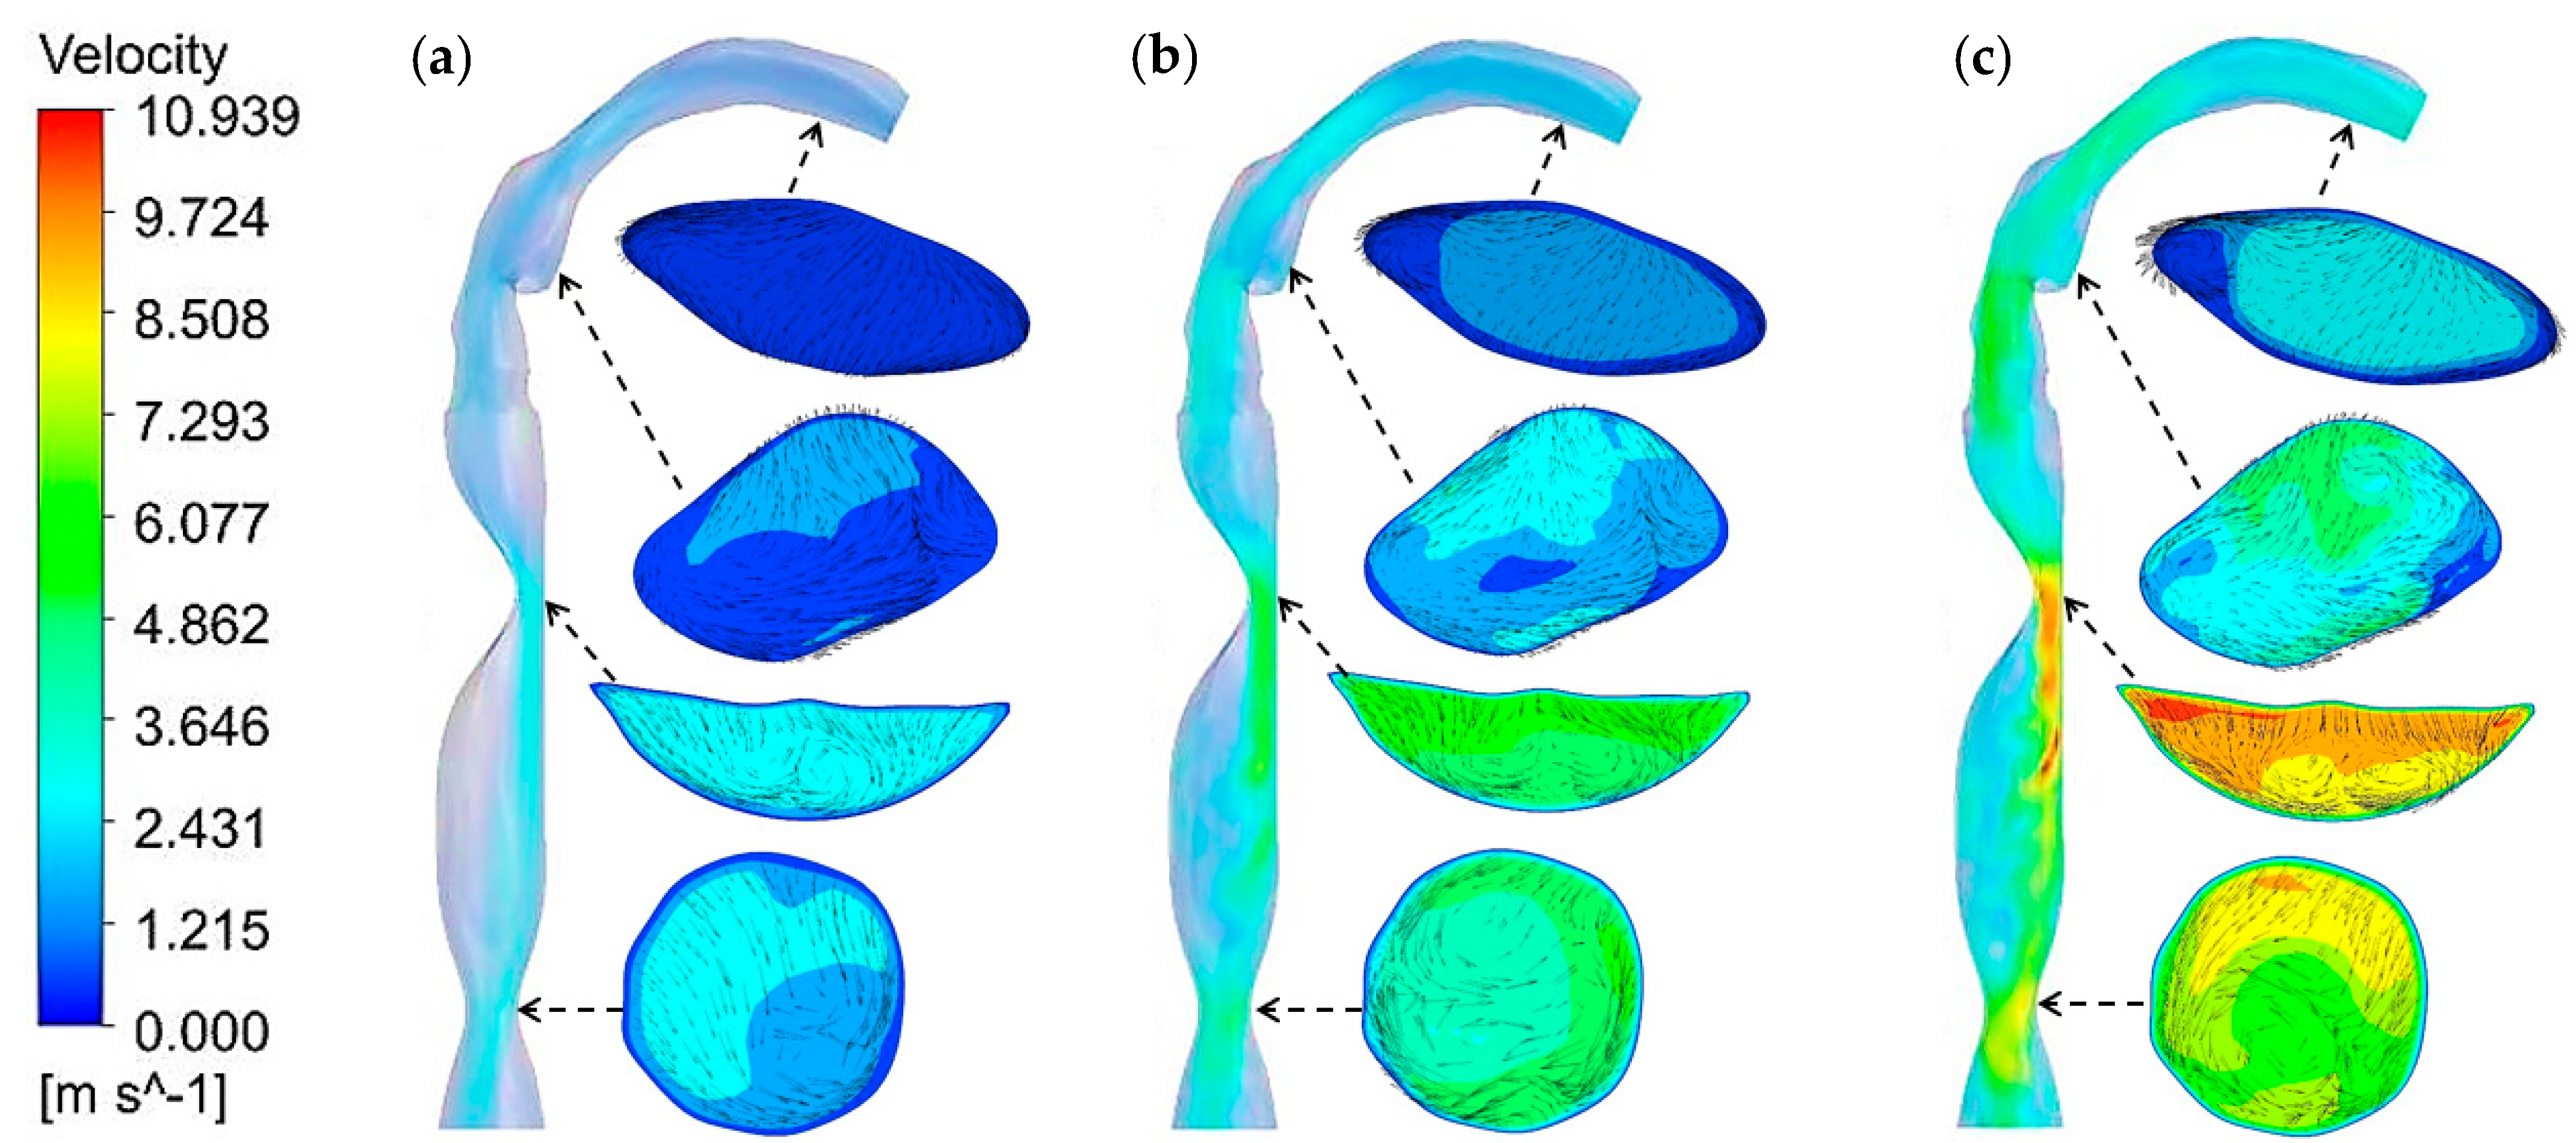
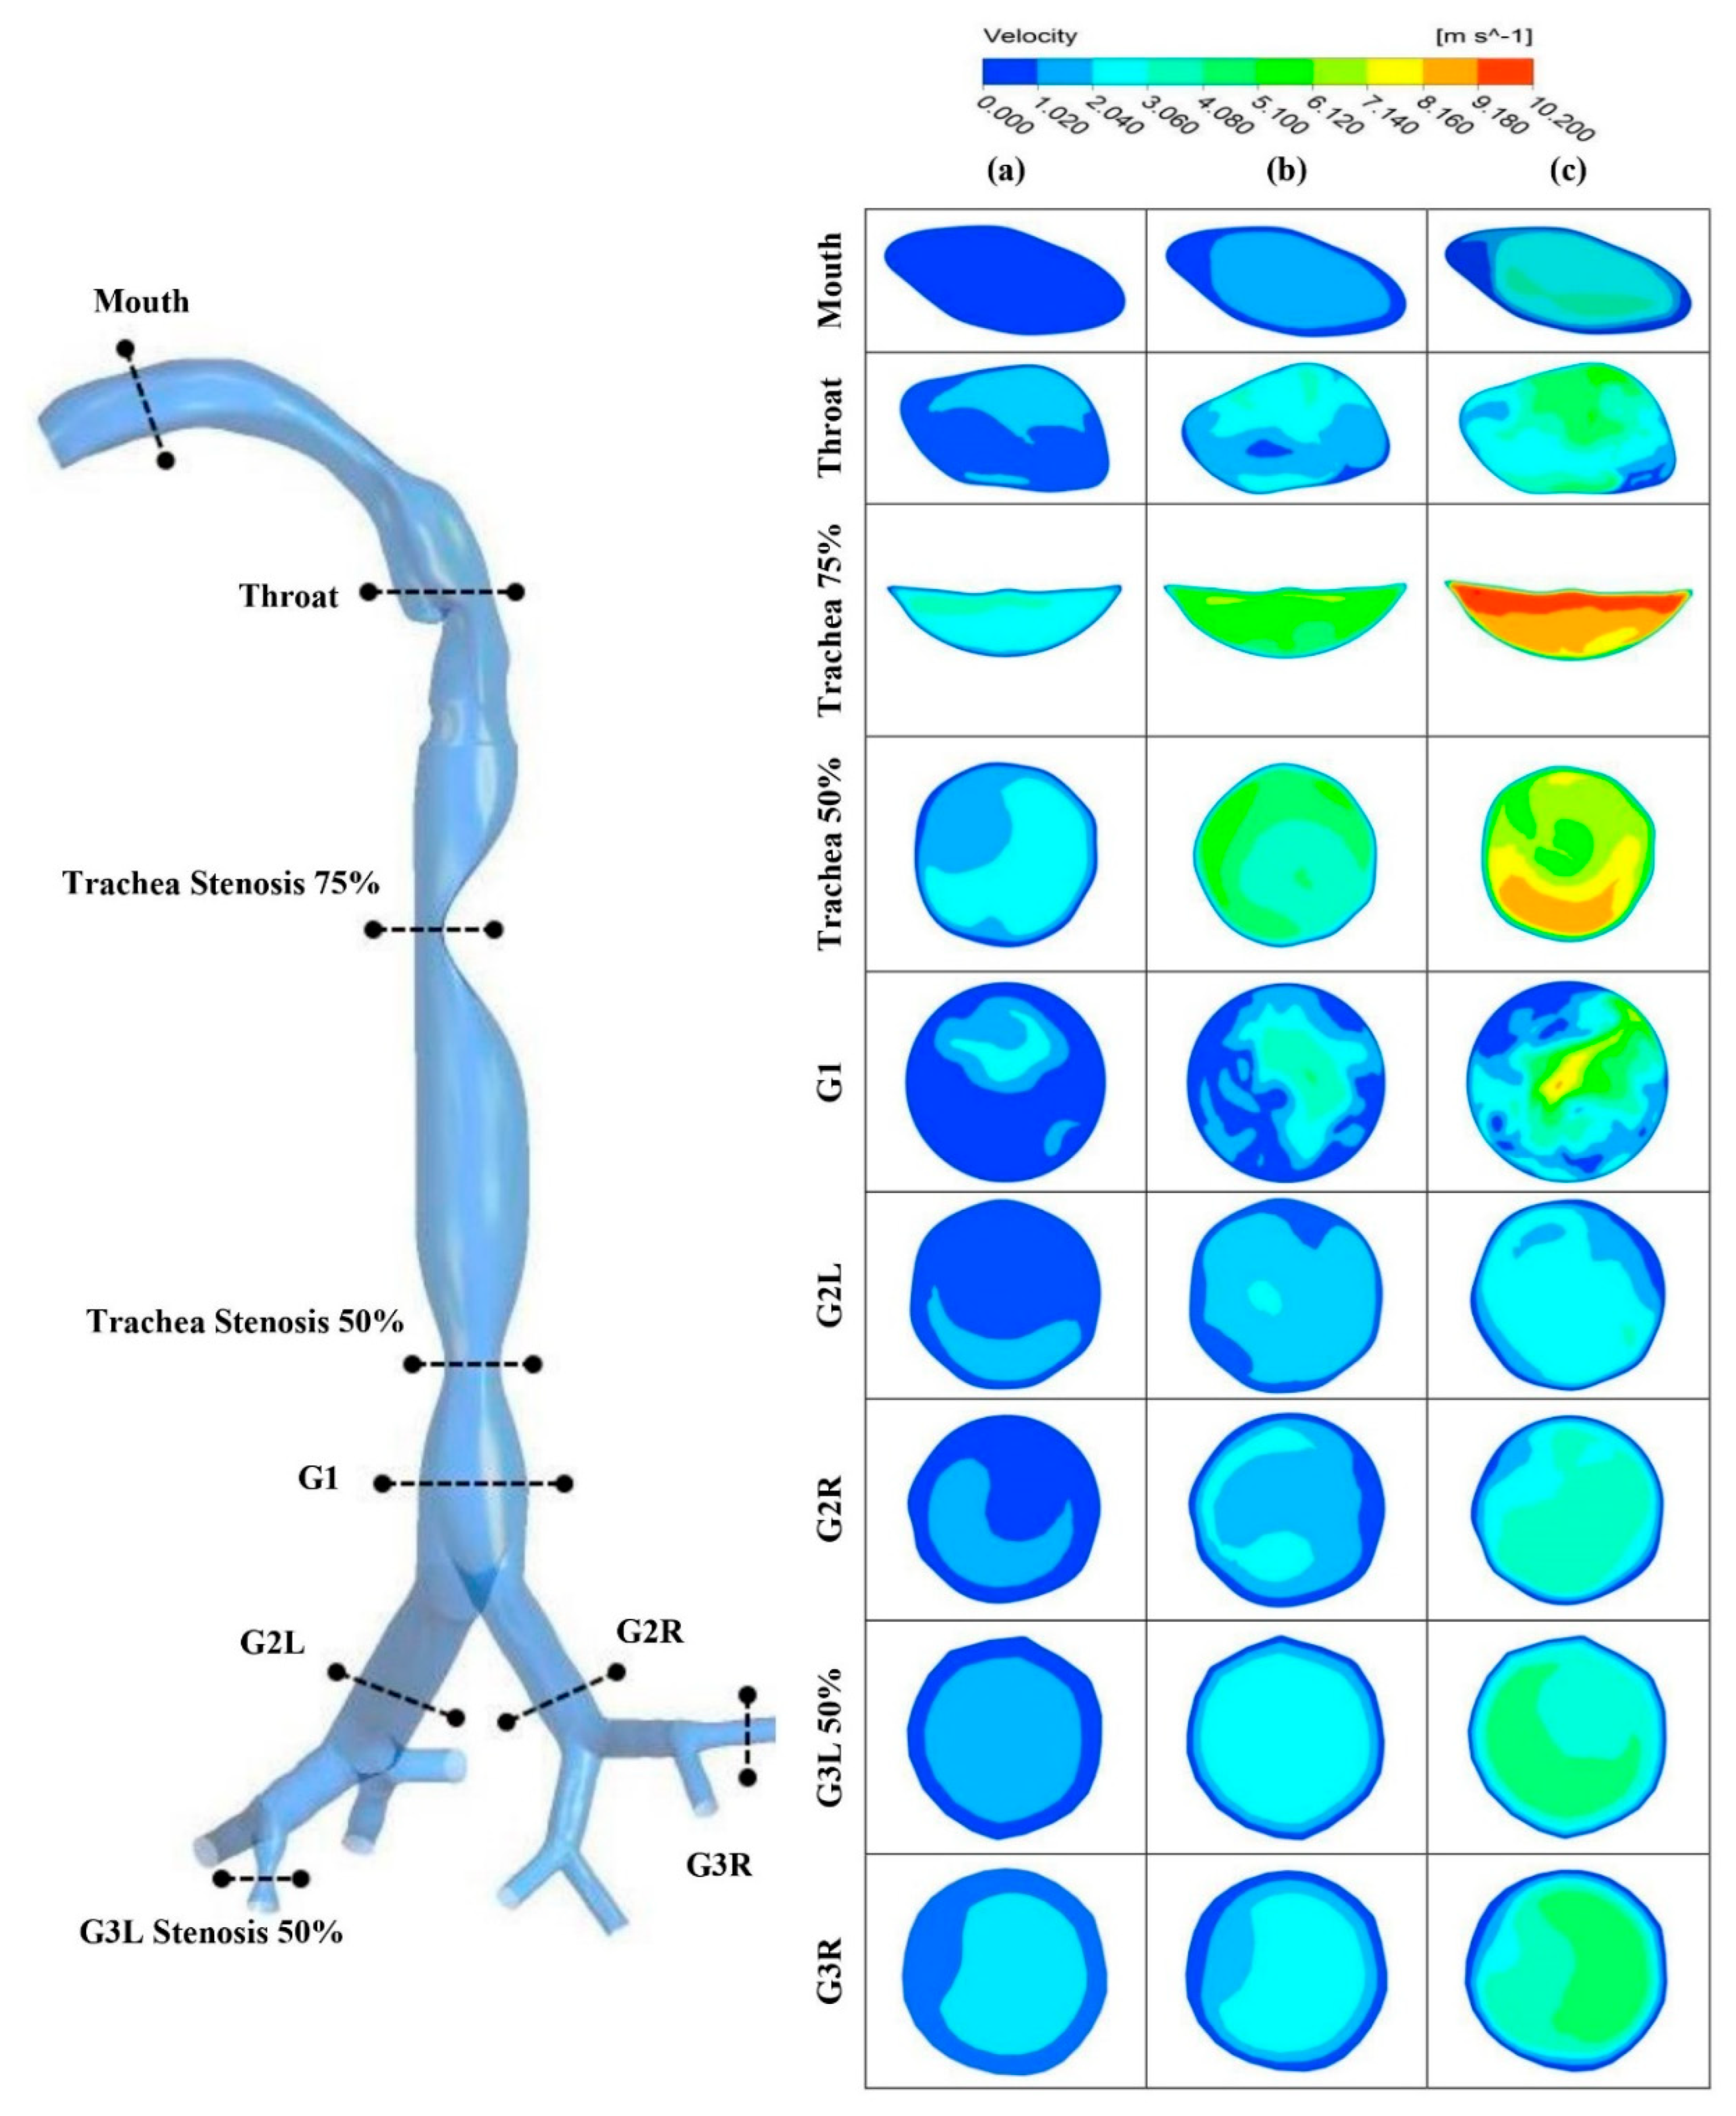
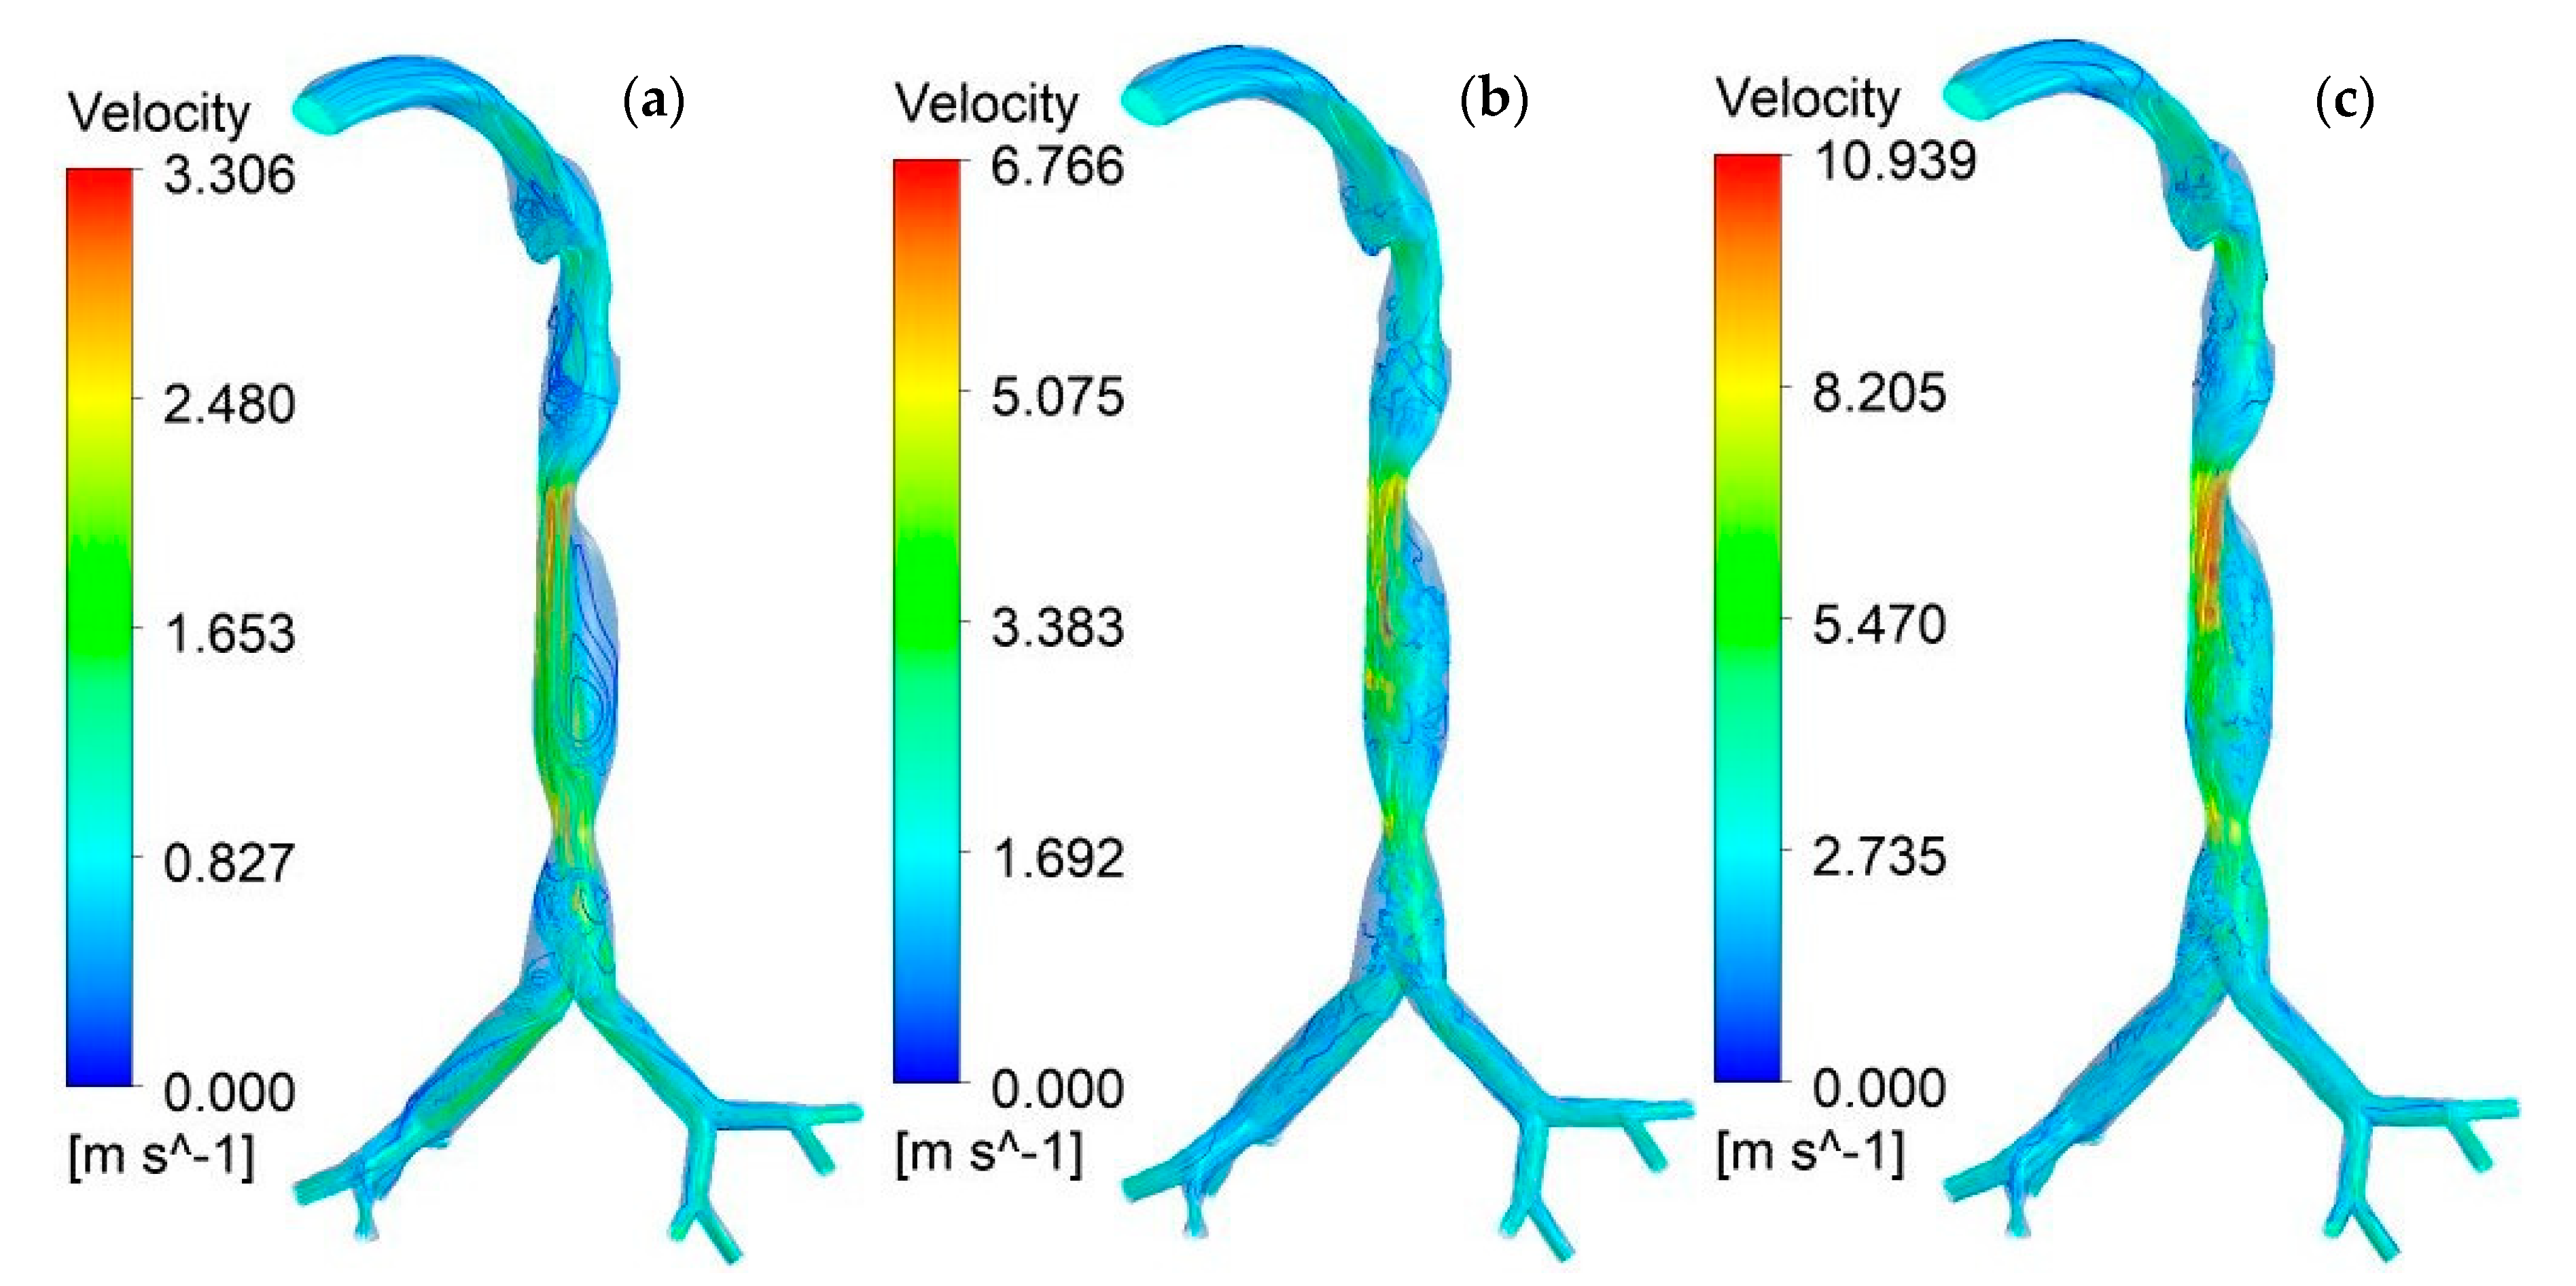
3.1.2. Velocity Contours

The velocity contour section was examined based on the cross-sectional contour in the lung airways. Various selected zones were created at different locations from the mouth–throat area to the 3rd generation to calculate the velocity contours. Figure 6a–c presents the velocity contours for three different flow rates at nine different locations. From Figure 6a–c, the velocity contours in the mouth–throat sections were found to be dissimilar for each of the three flow cases. Similarly, the velocity contours in the mouth–throat sections, trachea with stenosis (75% and 50%), and generation-1 to generation-3 were found to be dissimilar for all three flow cases. However, the highest levels were found in the trachea 75% and trachea 50% regions having a flow rate of 25 L/min. Moreover, a complex flow pattern was also found in both portions compared to other parts of the lung. There was a sudden change in the flow pattern in both sections due to the contractions of 75% and 50% of the normalized diameter of the trachea. Therefore, a greater change was observed in the diameters of the lung airway sections influenced by the velocity contour.

3.2. Pressure Analysis

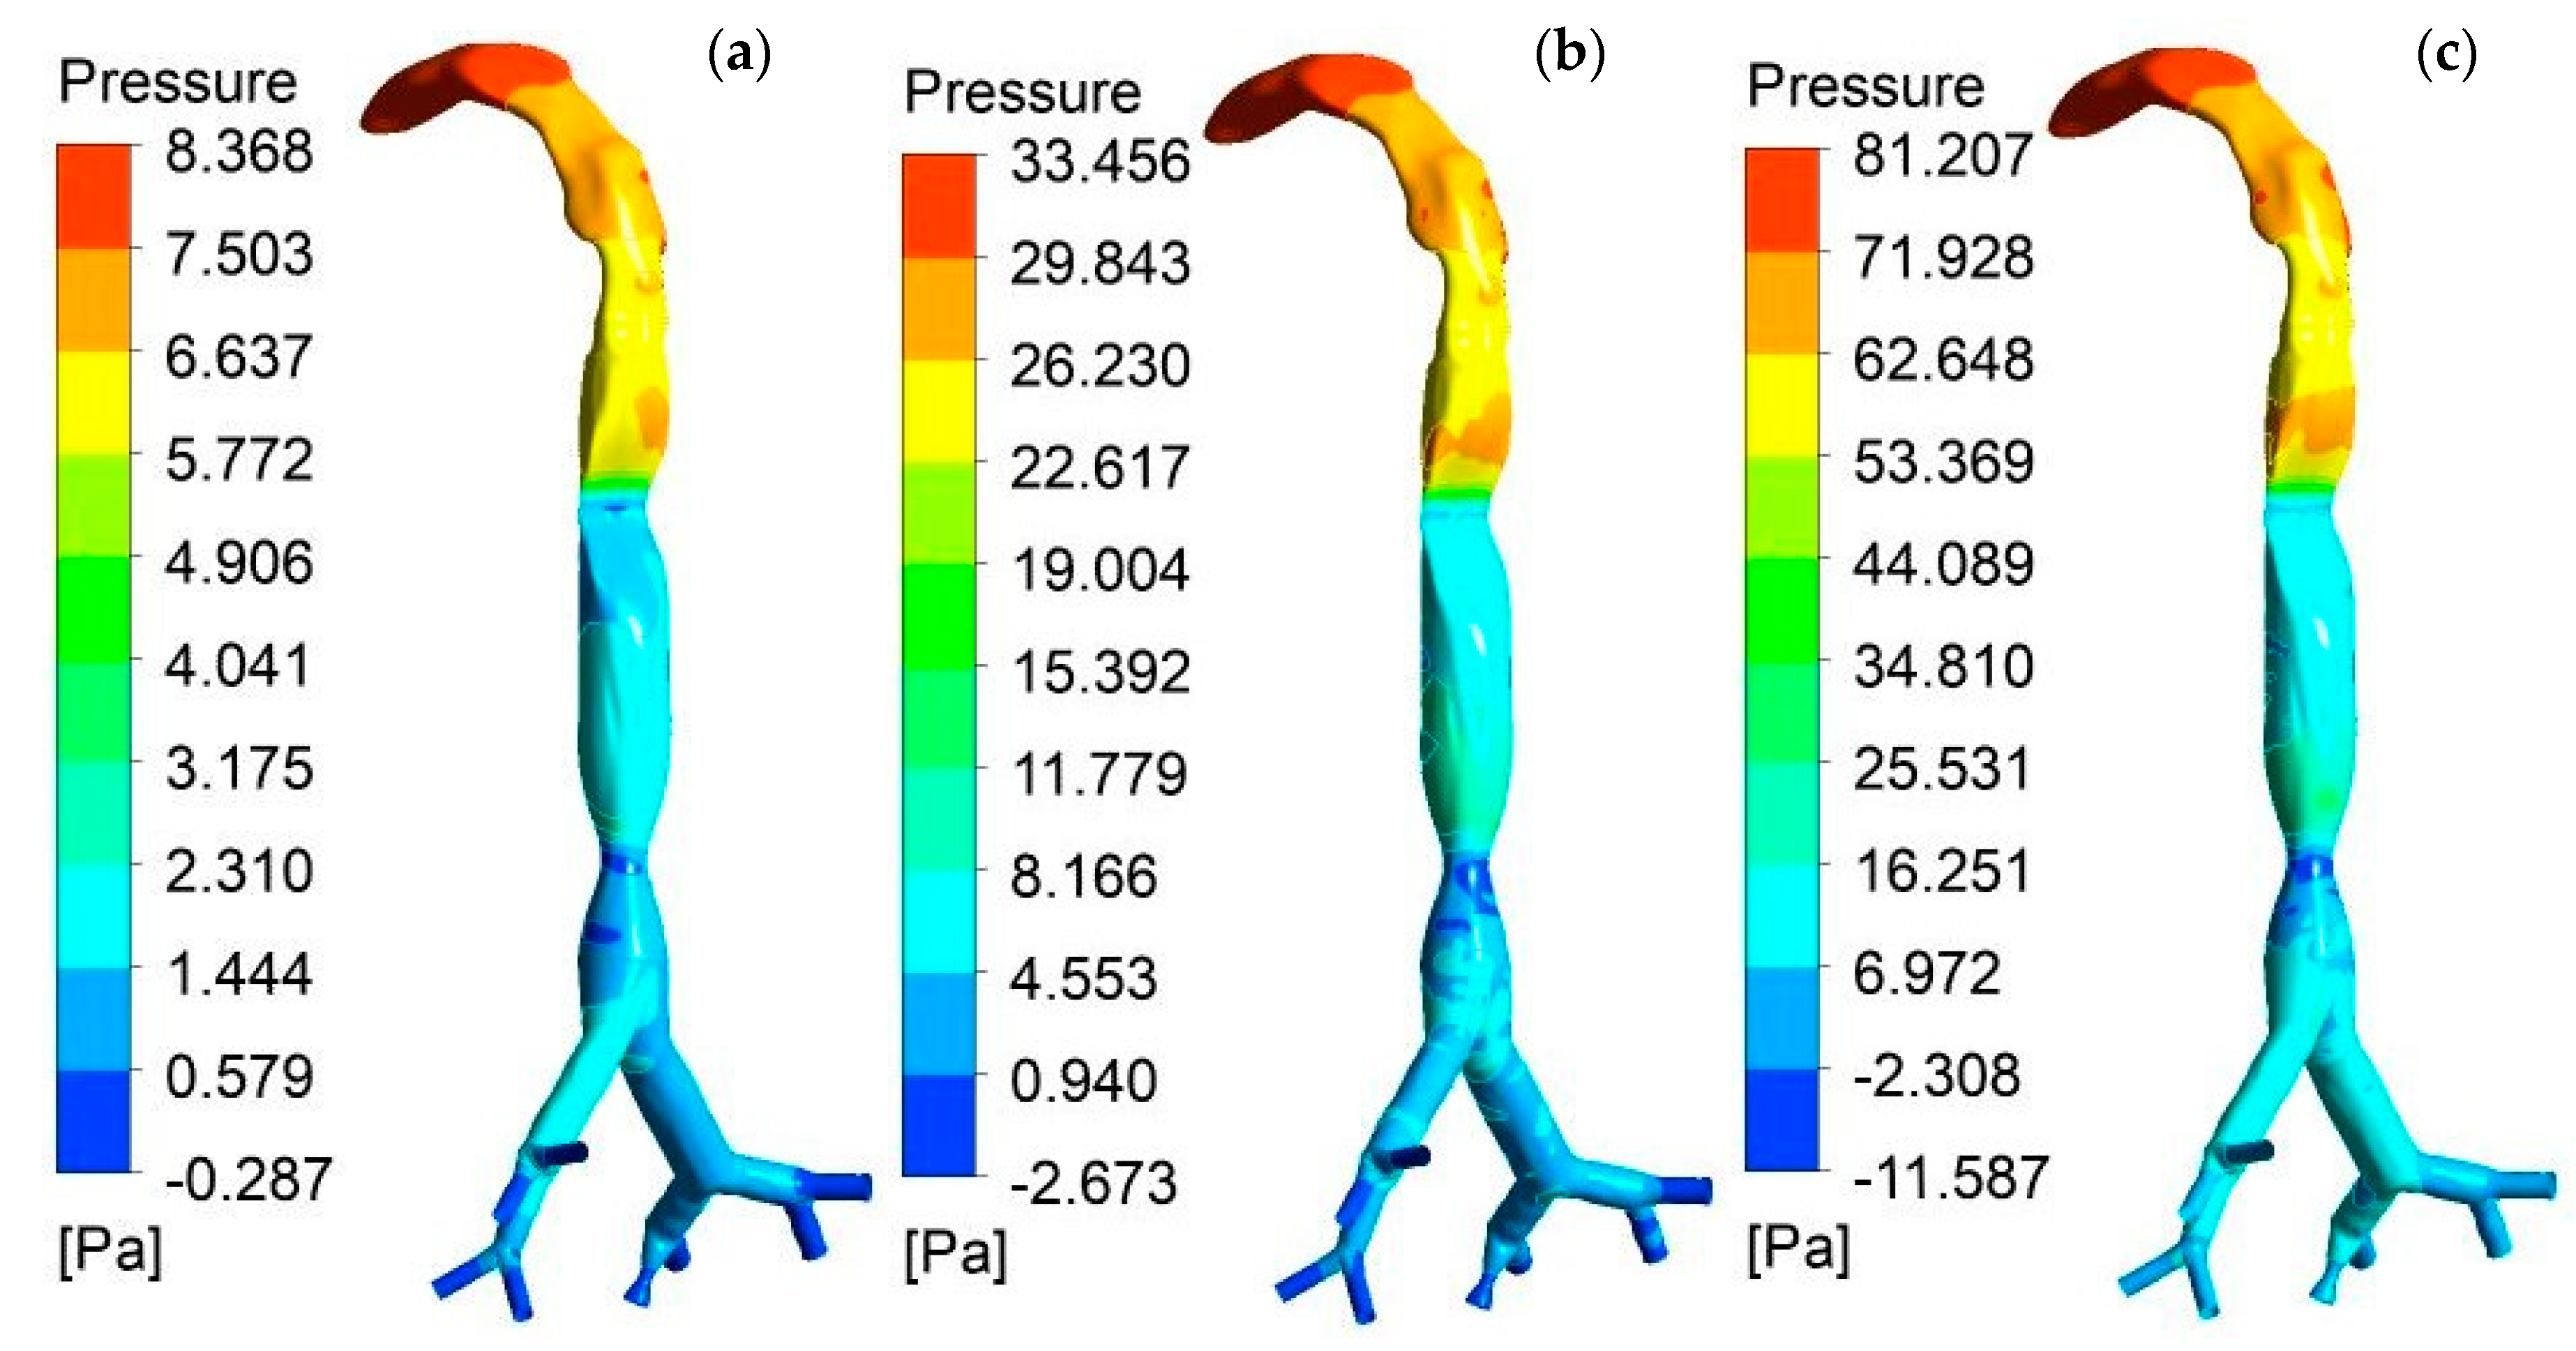
3.2.1. Pressure Contours

Figure 7 illustrates the pressure contour in the lung model for three different flow rates. The higher pressure rate is usually located in the mouth–throat area for all rates. Figure 7a–c also indicates that the pressure in the upper part of the lung model is comparatively higher than that in the lower part of the lung model for all three flow rates (7.5, 15, and 25 L/min). The highest flow rate at 25 L/min generated the highest pressure. At the stenosis section, there was a sudden change in pressure at the trachea 75% section due to the contraction of 75% of the average diameter of the trachea. Furthermore, the value of pressure decreased rapidly in all three models in the throat region. By increasing the flow rate, the pressure in different parts of the lung model gradually increased.

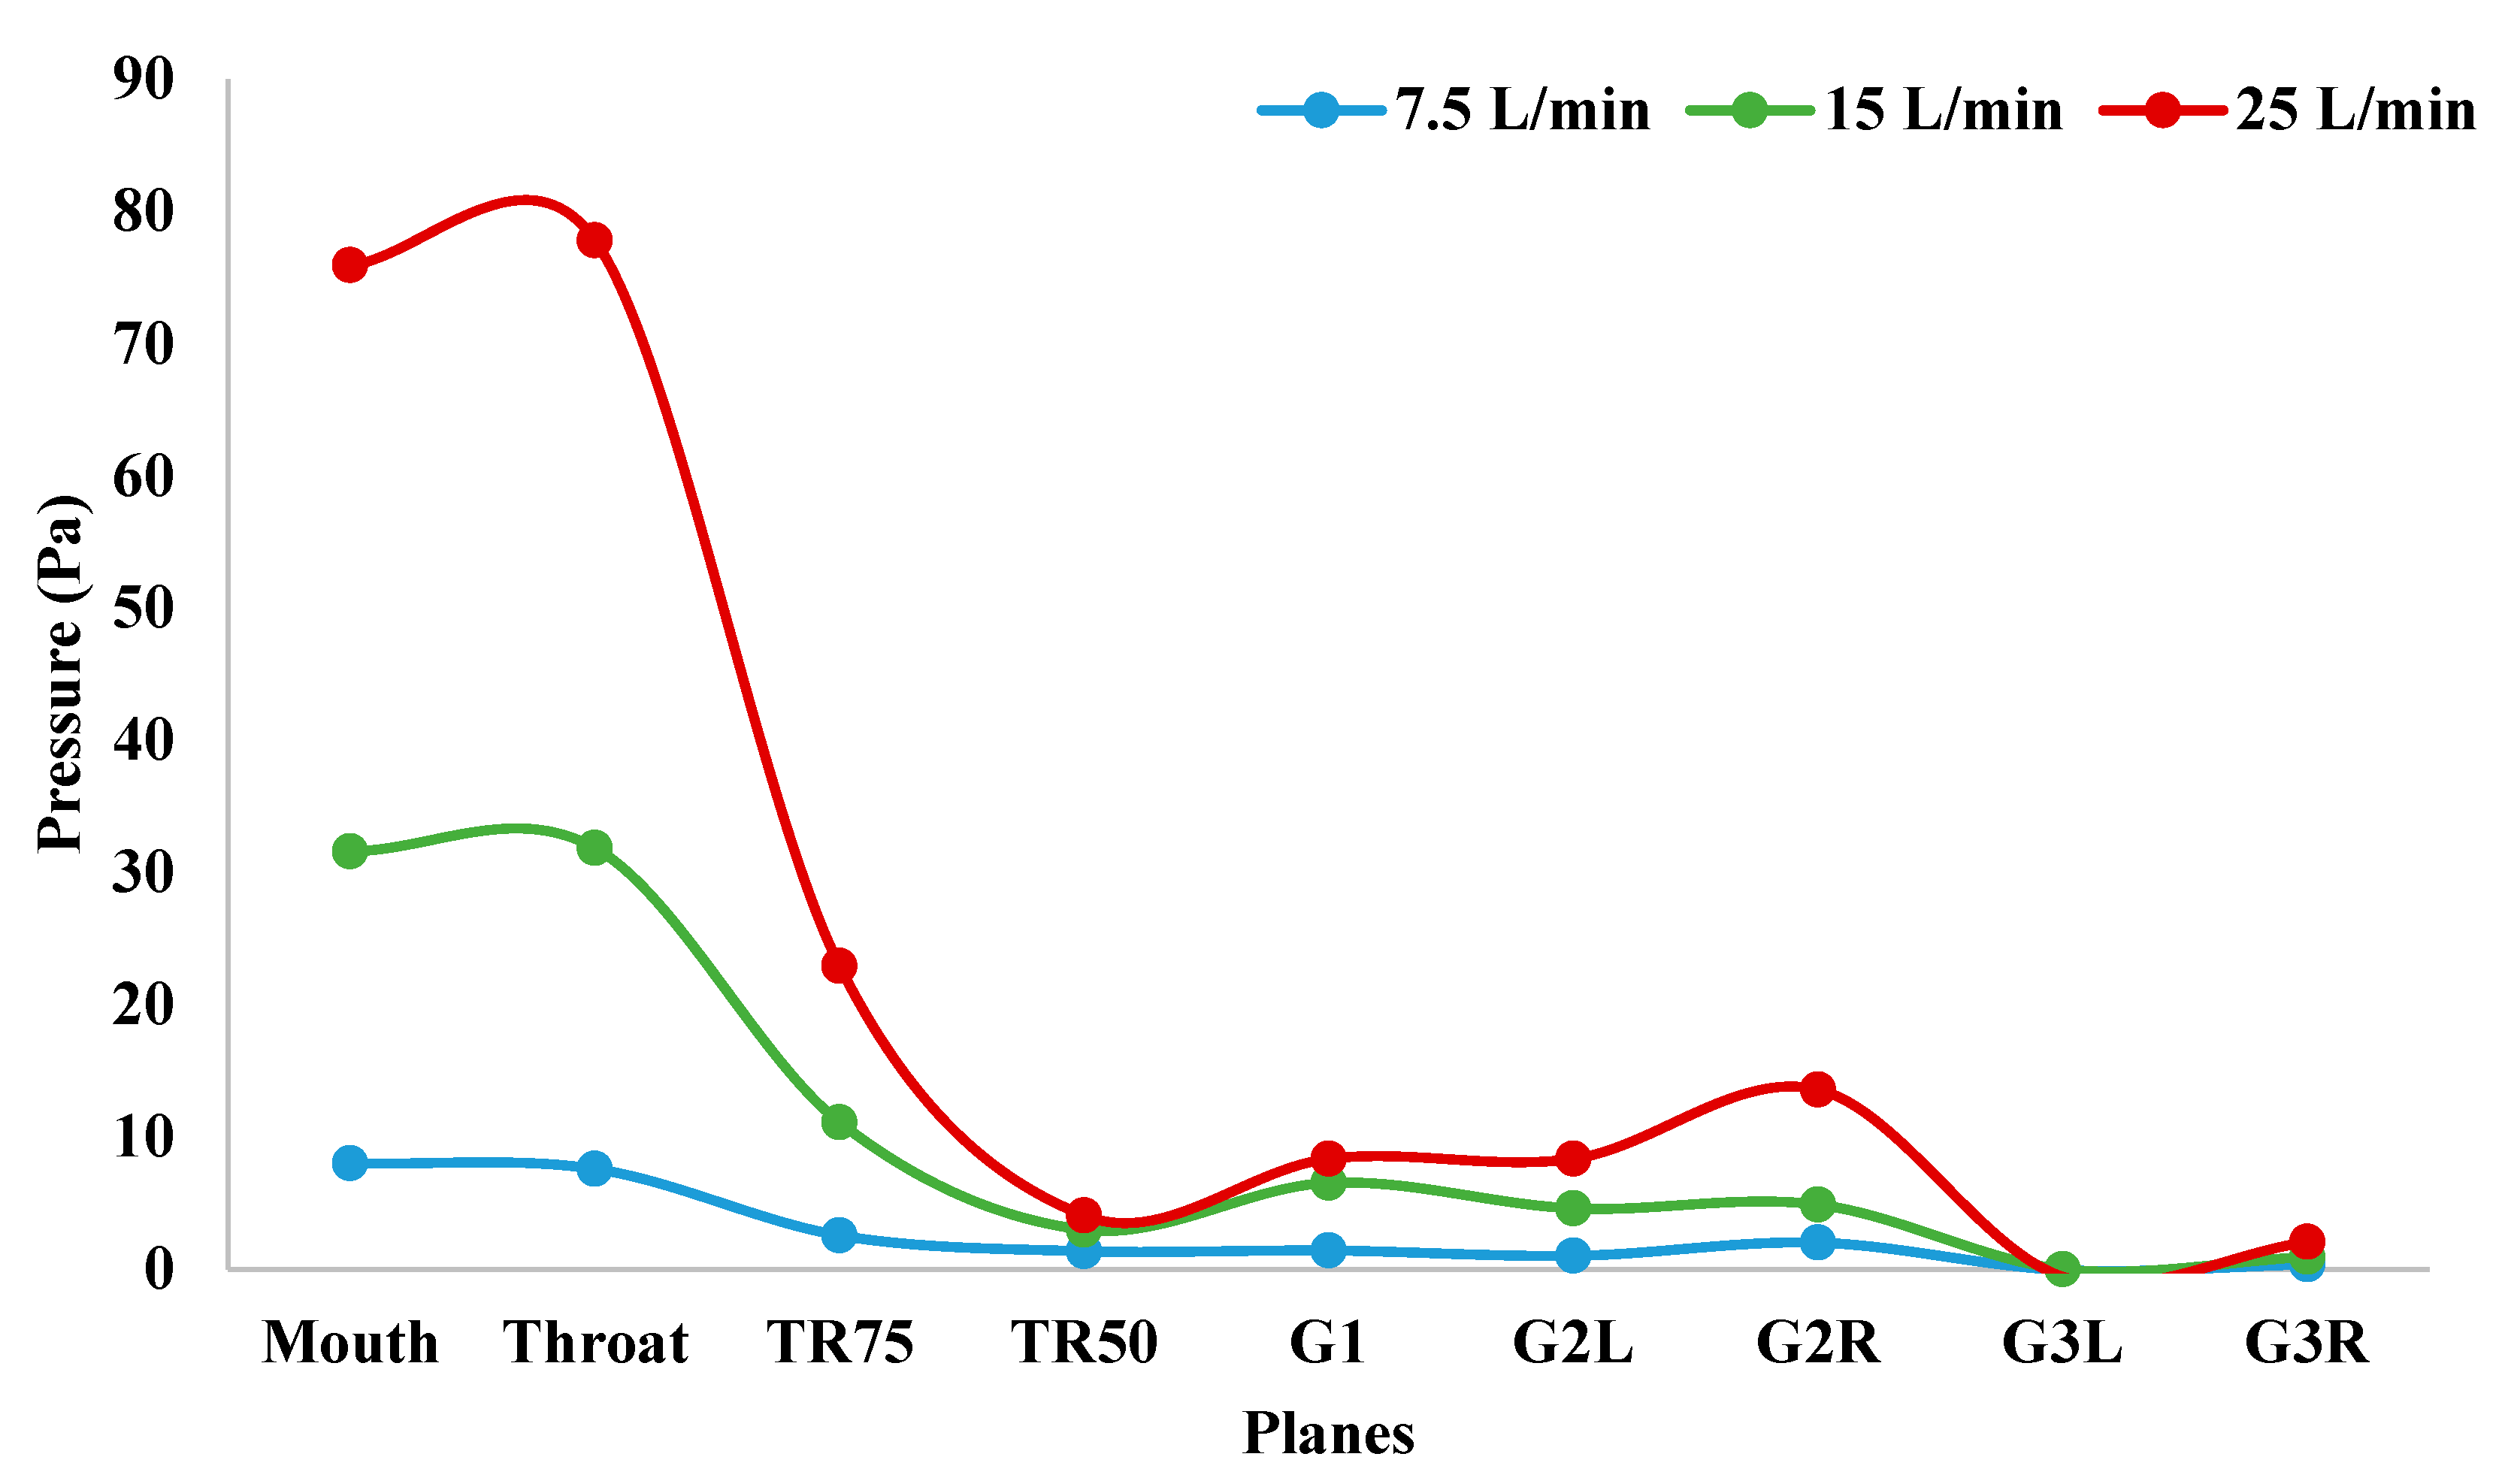
3.2.2. Pressure Variation

Breathing depends on the air pressure inside the lungs and, if this pressure varies for any reason, the breathing is disturbed. Differences in pressure at three different airflow rates at specific positions of the entire lung are depicted in Figure 8. The pressure was present in the first two positions for the 7.5 L/min flow rate (i.e., mouth and throat), then was close to zero at TR75, which was consistent up to TR50, G1, G2L, G2R, G3L, and G3R. The differences in the airflow rates of 15 and 25 L/min were noticeable in each position. At the 15 L/min flow rate, the pressure in the mouth and throat was almost the same; at the flow rate of 25 L/min, the pressure in the throat was slightly higher than that in the mouth. At each airflow rate, the pressure in the throat and TR75 was significantly condensed. With a flow rate of 25 L/min, the pressure difference between the throat and TR75 was high at 7.5 L/min, and the difference for the 15 L/min flow rate was much less than that for the 25 L/min flow rate. The pressure of the TR50 position was almost equal for 7.5 and 15 L/min flow rates; however, for the 25 L/min flow rate, the pressure was approximately doubled. The value of this pressure was almost the same at G1, G2L, and G2R positions at the 7.5 L/min flow rate. At the G3L section, the pressure was close to zero for the 15 L/min flow rate, but at flow rates of 15 and 25 L/min, the pressure was less than zero, which means negative pressure was present.
In Figure 7, the pressure on the G3L position at the rate of 25 L/min shows the highest negative value. The effect of the pressure spreads in every other section of the lung at 25 L/min, and is higher than that at the 7.5 and 15 L/min flow rates. However, at 7.5 and 15 L/min rates, the change in pressure between each position is extremely small and, at a flow rate of 25 L/min, the difference between the throat and TR75 is higher than that of the other two flow rates.
The variations in lung pressure during breathing were observed, and the highest and lowest pressure values found for the 25 L/min flow rate were 77.81 and −0.57 Pa, respectively. The highest difference in pressure, of 54.88 Pa between the throat and TR75, was also found at a flow rate of 25 L/min. We may conclude that the pressure showed the highest value for almost all selected positions of the lung airways.

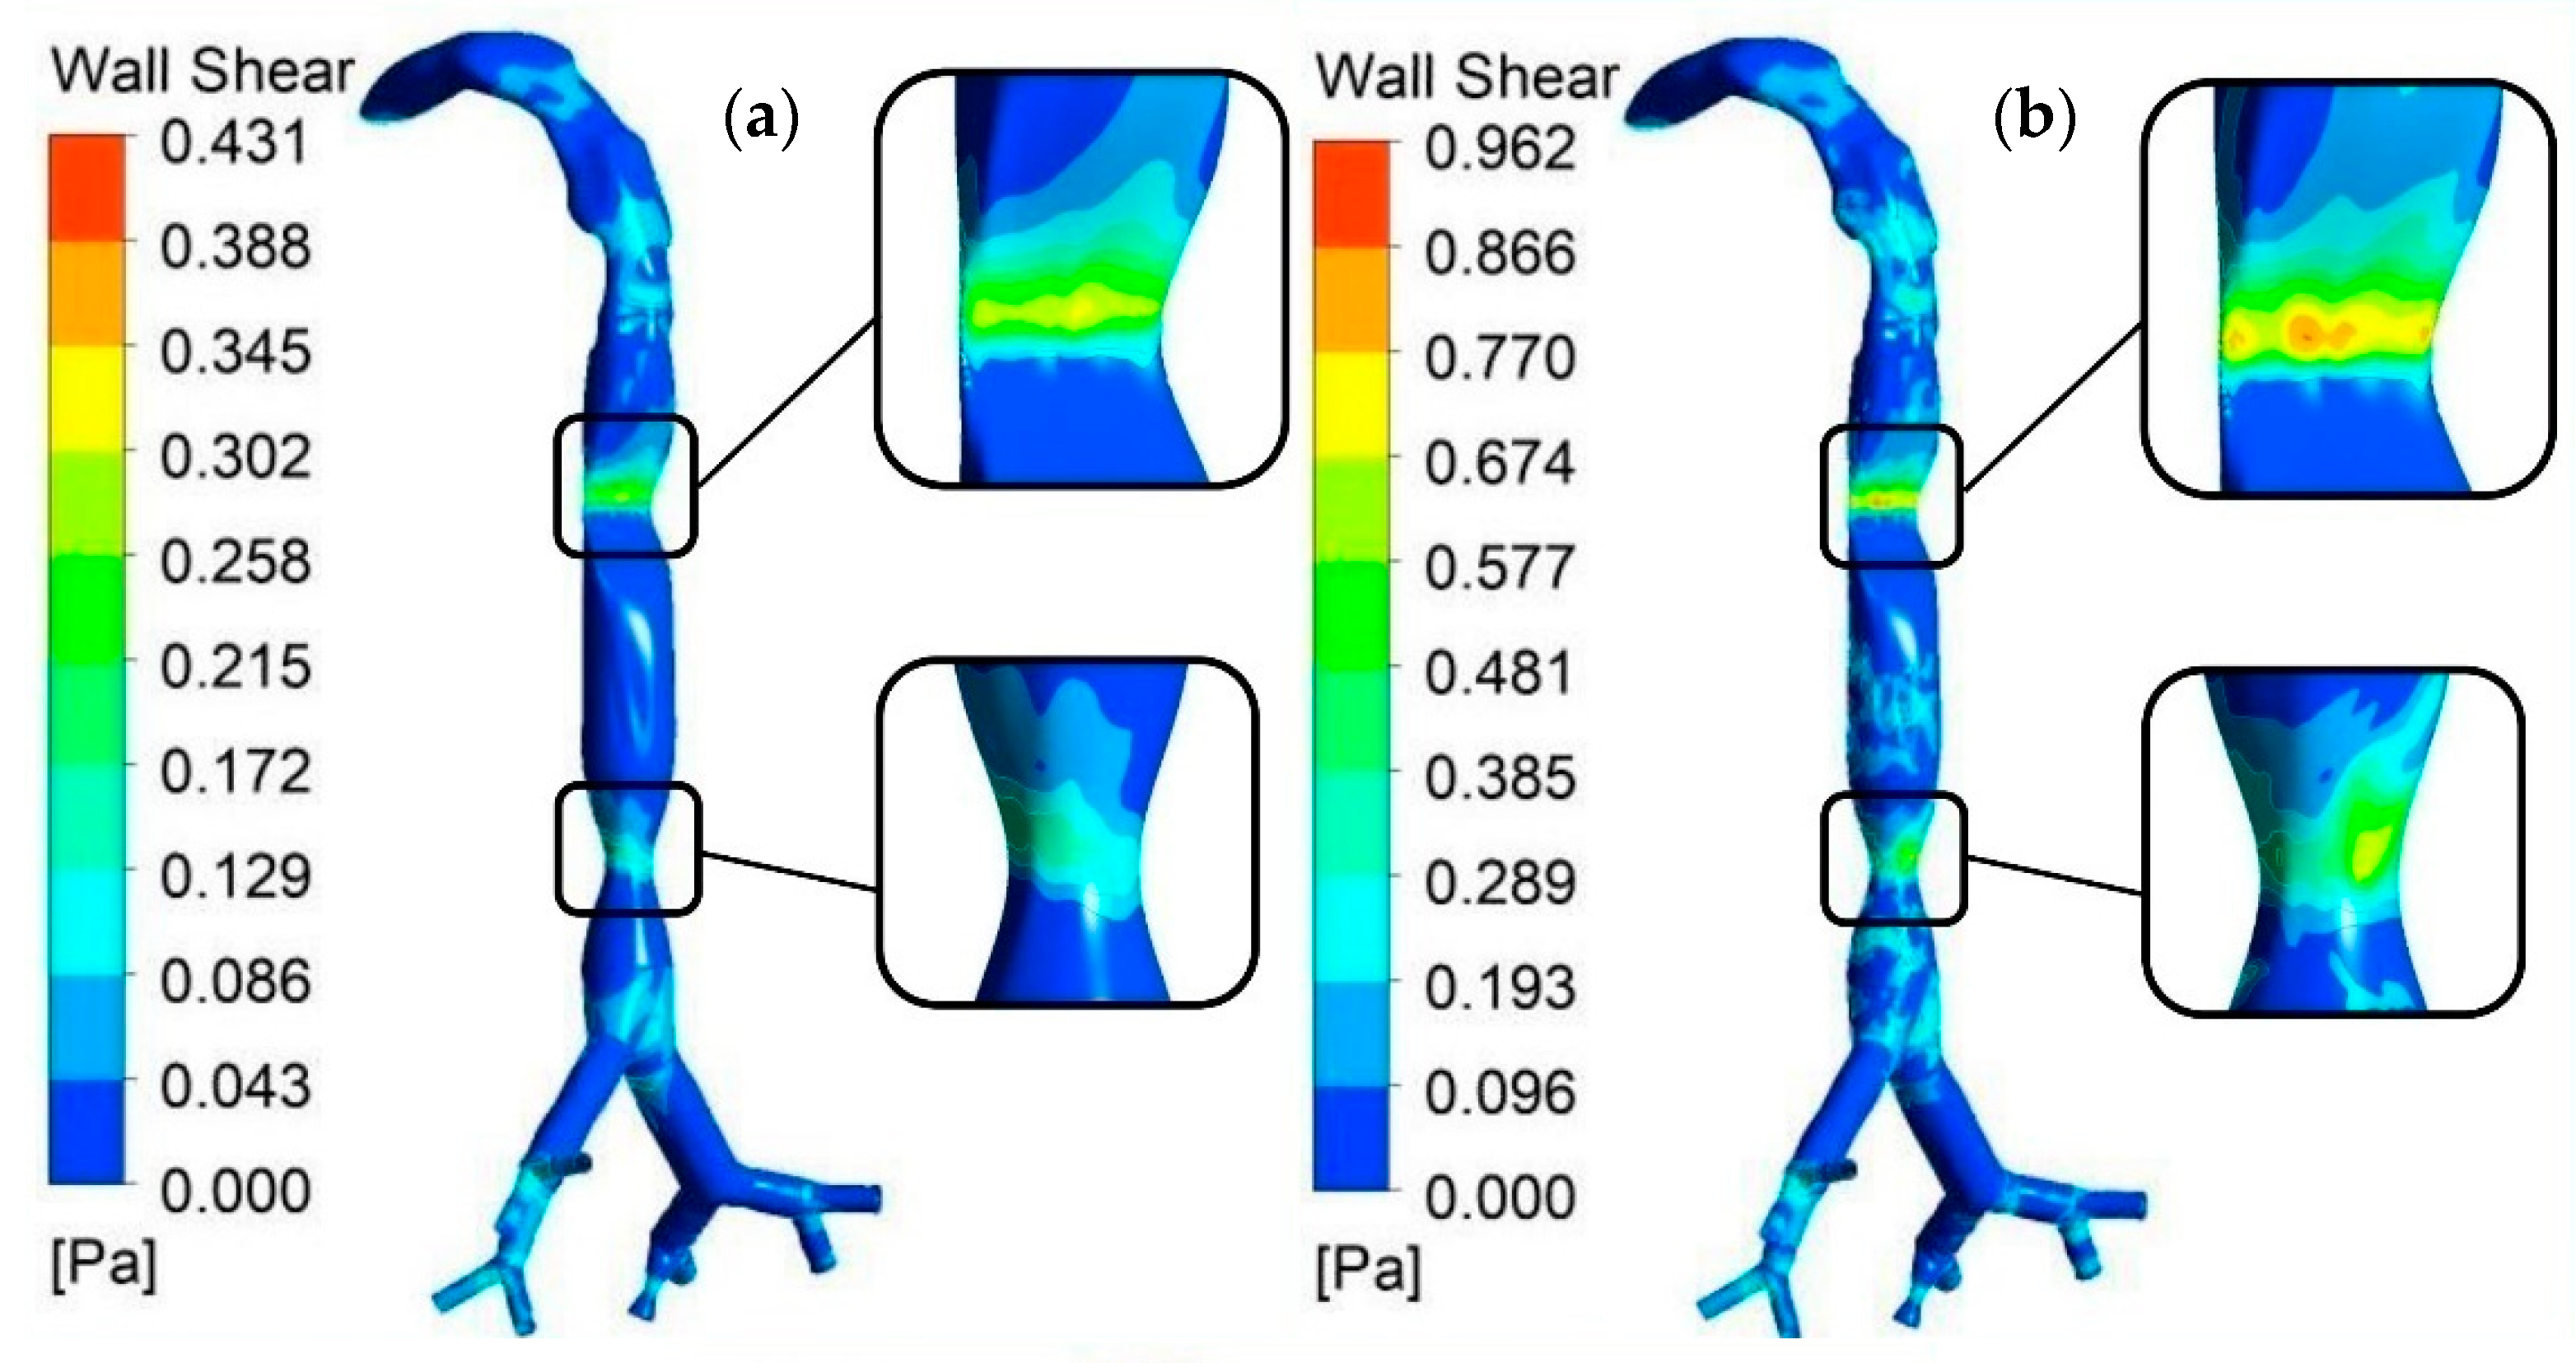
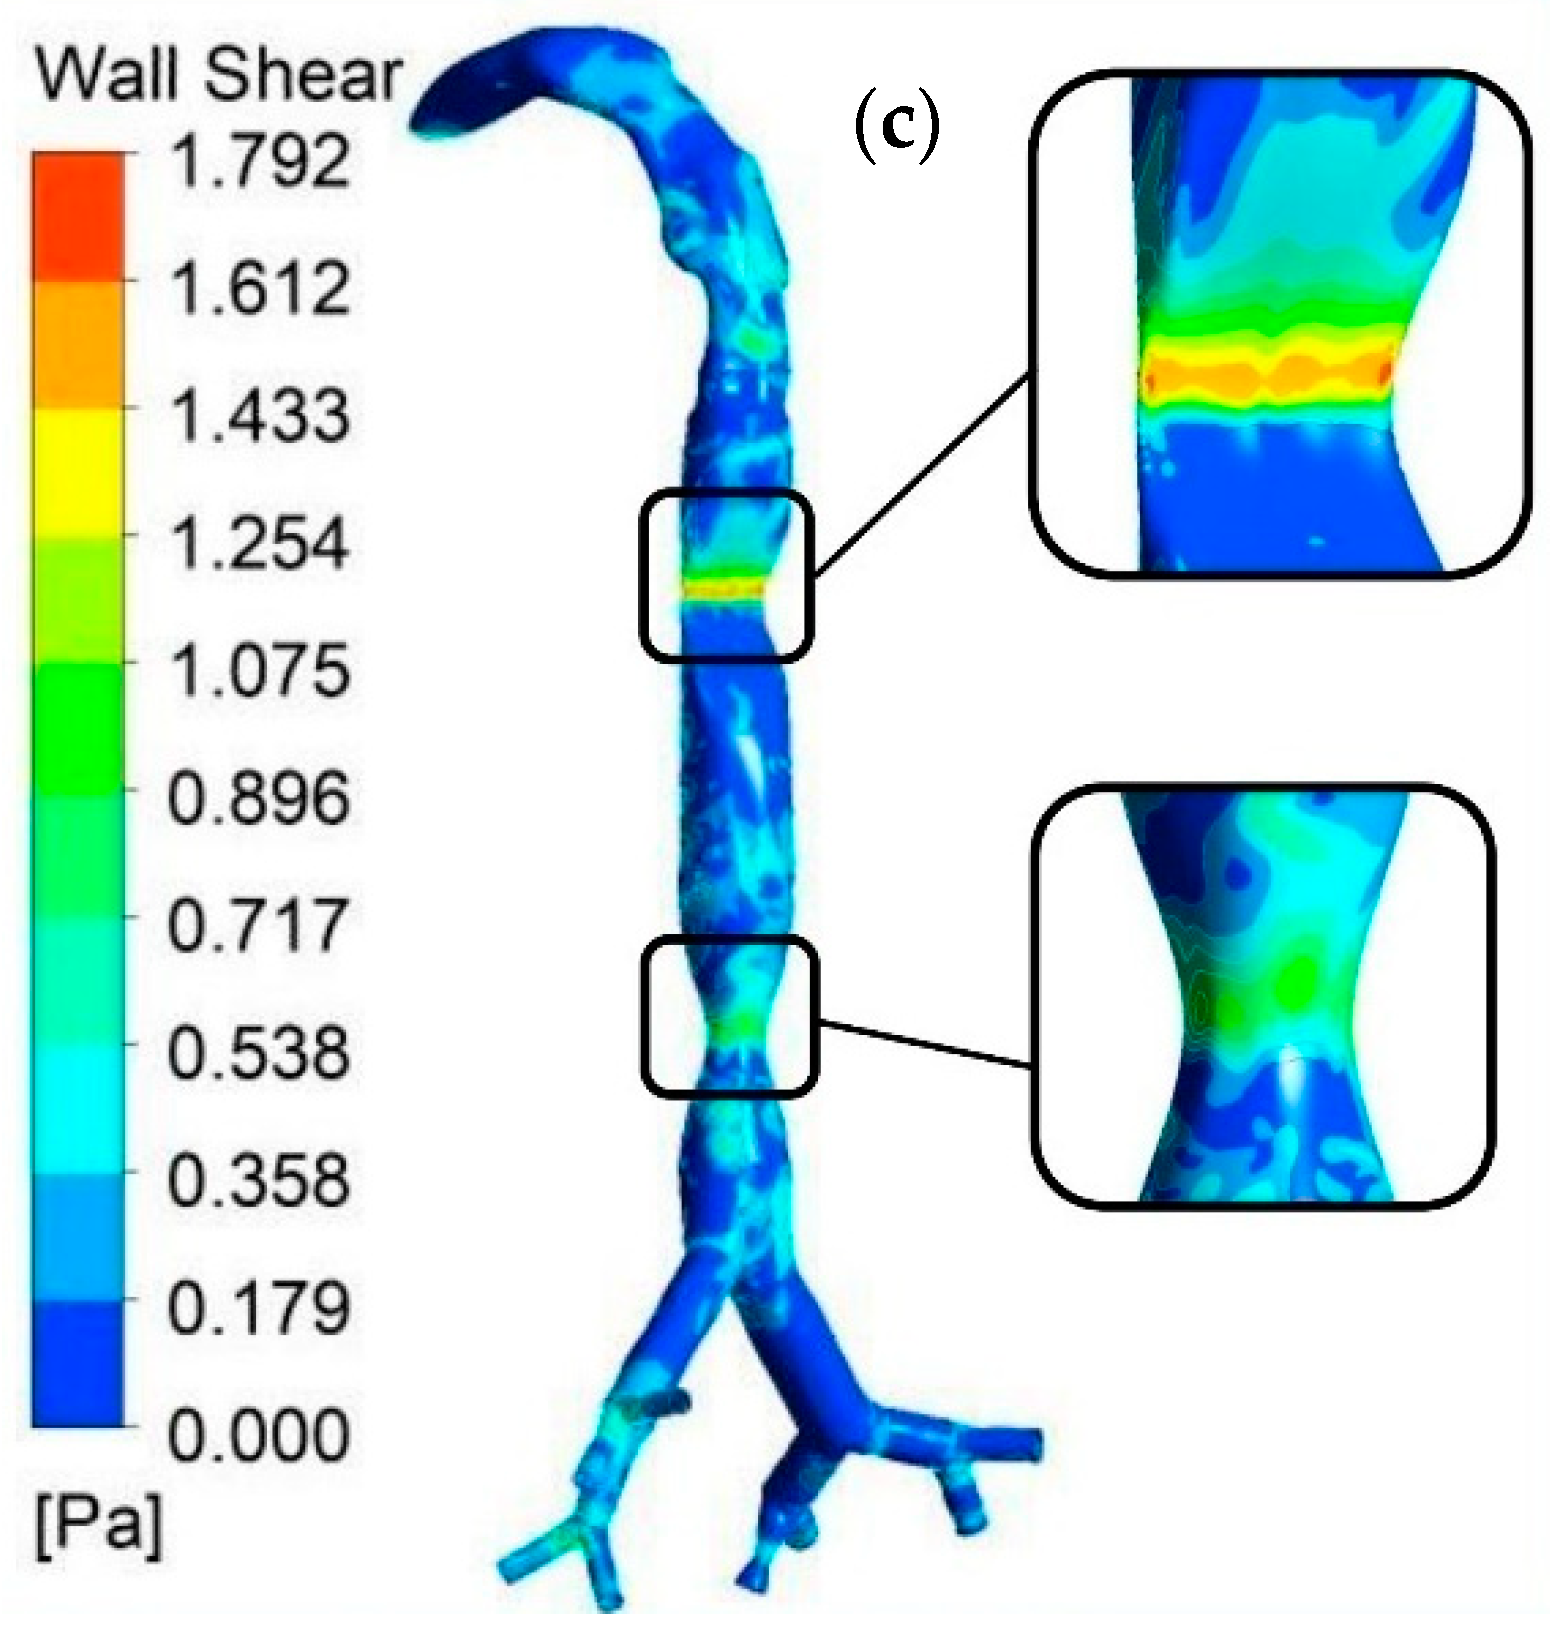
3.3. Wall Shear Analysis

Figure 9 shows the CT-based wall shear realistic model with three different flow rates. Figure 9a–c separately demonstrates the wall shear contour for the whole lung model at three different flow rates (7.5, 15, and 25 L/min). From this figure, the highest wall share stress was found to exist in the upper stenosis section for a 25 L/min flow rate (Figure 9c). Wall shear is increased by the motion of passing fluid, and is a velocity-dependent force acting on the solid airway wall. At the position of TR75 in Figure 4d, the value of velocity is higher than that in the other stenosis areas of this model. However, an increase was found in the wall shear stress with the increase in the flow rate at different parts of the lung. Moreover, the highest wall shear was also found in the stenosis region (trachea) for all flow rates.

3.4. Airflow Streamline Analysis

The value of the airflow streamline was calculated using three different models during inhalation conditions. Figure 10a–c shows the airflow streamlines for three different flow rates (7.5, 15, and 25 L/min). Each of these models depicted a complex flow path between two stenosis sections compared to the other sections of the lung. The most complex flow path was found to exist in the upper stenosis section (trachea with 75%) and beyond for a 25 L/min flow rate (Figure 10c). The maximum velocity was found to be different for all lung models. With an increasing flow rate in selected parts of the lung, an increase in the value of the velocity and the complexity of the flow path was observed.

3.5. Particle Analysis

3.5.1. Particle Deposition

During inhalation, the particles are assumed to be injected into the mouth and through the airway. The particle deposition efficiency (DE) in the present study was calculated based on the total number of particles that were injected into the mouth, corresponding to the number of particles that were trapped along the lung walls in a certain area during travel through the airways. A higher percentage of DE means a higher number of particles that were trapped in each area. Figure 11 presents the nanoparticle DE comparison in a different position in the airflow tract at different flow rates. The DE was more effective in the MT position for each flow rate. The lowest flow rate, of 7.5 L/min, had higher DE for all particle sizes, and especially for 1 nm. This value was about 69.26% for 1 nm particles in the MT position, and about 0.13% for 100 nm particles in the TR with a 50% stenosis section. Overall, DE values for particles having a diameter of 1 nm were much higher at each flow rate. However, in the case of 25 L/min, the DE of each particle was more effective. The DE of particles having a diameter of 1 nm was higher than that of the other particles of the lung model for almost every section at the three compared flow rates (Figure 11a–c). In the case of the particle size of 1 nm with a 25 L/min flow rate, the value of DE per section was higher than that of the other particle sizes, and the value decreased at a parabolic rate (non-linear), which can be observed in Figure 10. Thus, the size and DE of the particles were inversely proportional to each other.

3.5.2. Particle Deposition Scenario

Figure 12 shows the particle deposition scenario at a 25 L/min flow rate. The overall deposition pattern indicates that particles appeared more in the mouth–throat section than in the other sections. The different diameters of the particle sizes are presented in different colors. The enlarged portion of section A shows a higher deposition concentration in the mouth–throat section. At a 25 L/min flow rate, the deposition concentration in the upper airways of particles having a smaller diameter is significantly higher than that of the larger diameter nanoparticles. The overall size-specific nanoparticle deposition validates the ultrafine particle deposition mechanism in the upper airways. The Brownian diffusion is highly effective for the smaller diameter particles. If the particle size is small, the particles experience a spontaneous random motion due to Brownian forces, and deviate from the particle path line. This scenario significantly increases the deposition concentration of the smaller diameter particles in the upper airways. Figure 12 shows that the deposition concentration of 100 nm particles in the mouth–throat area is significantly lower than that of 1 nm particles, which sufficiently aligns with the hypothesis of Brownian motion. However, in the stenosis section (section B), a considerable quantity of larger diameter particles (100 nm) is deposited compared to the 1 nm particles. The flow becomes highly complex and chaotic in the stenosis section. At a 25 L/min flow rate, larger diameter particles experience a complex flow trajectory in the stenosis section and deviate from the path line due to large inertia. This scenario increases the overall deposition concentration of the larger diameter particles in the stenosis section. This specific finding can be used for the transport of pharmaceutical aerosols to the targeted position of the stenosis airways.

3.5.3. Escaped Particles

Escaped particles (EPs) in the present study refer to the number of particles that escaped from the outlet at the 3rd generation and travelled through lower lung generations. The percentage of EPs was calculated by the number of escaped particles divided by the total number of particles entering the mouth. To provide a better understanding of the escaped particles, all outlets at the 3rd generation were identified for the left and right airways for three different flow rates, and are presented in Figure 13a. For the particle size of 1 nm (Figure 13b), the rate of EPs increased with the increase in the flow rate. This was the case for both outlets. In Figure 10, for particles having a diameter of 1 nm, the value of particle DE steadily declined in the case of different flow rates. From both Figure 11 and Figure 13, it can be noted that EP and DE are opposite to each other. However, the maximum value is displayed in the left outlet for a 50 nm particle size and a 7.5 L/min flow rate (Figure 13d). The minimum value was found in the right outlet for a 1 nm particle size and a 7.5 L/min flow rate (Figure 13b). Similarly, a continuum of similar behavior can also be observed in Figure 13c for the right outlet. For the left outlet, the value of EP for intermediate flow rates decreased insignificantly. Figure 13e clearly shows that the value of EP on both left and right outlets gradually decreased with an increase in flow rate. EP and efficiency are connected inversely: when efficiency shows a high value, EP provides a lower value for both outlets.

4. Conclusions and Future Perspectives

In this study, airflow and particle transport were analyzed through the multi-stenosis sections of the upper airways, and the numerical study considered a wide range of particle sizes and flow rates for the overall investigation. The key findings are listed below:
The overall velocity field in the upper section of the mouth–throat model showed a fully developed profile. However, the velocity profile in the stenosis section was found to be highly complex. In the 75% stenosis section, the flow becomes highly chaotic with the increase in the flow rate and velocity magnitude. In the 50% stenosis section, the velocity flow field is less chaotic than that in the 75% stenosis section. A higher velocity magnitude was observed in the upper stenosis section than in the lower stenosis section.
The overall pressure drops in the mouth–throat section and upper airways showed a non-linear trend irrespective of the flow rates. The maximum pressure was observed in the upper part of the mouth. The maximum pressure decrease was observed in the 50% stenosis section. The overall drop in pressure increased with the flow rates.
At a high flow rate (25 L/min), the wall shear at the stenosis section was higher than that in the healthy part of the mouth–throat section and upper airways. The wall shear in the 75% stenosis section was higher than that in the 50% stenosis section of the airways.
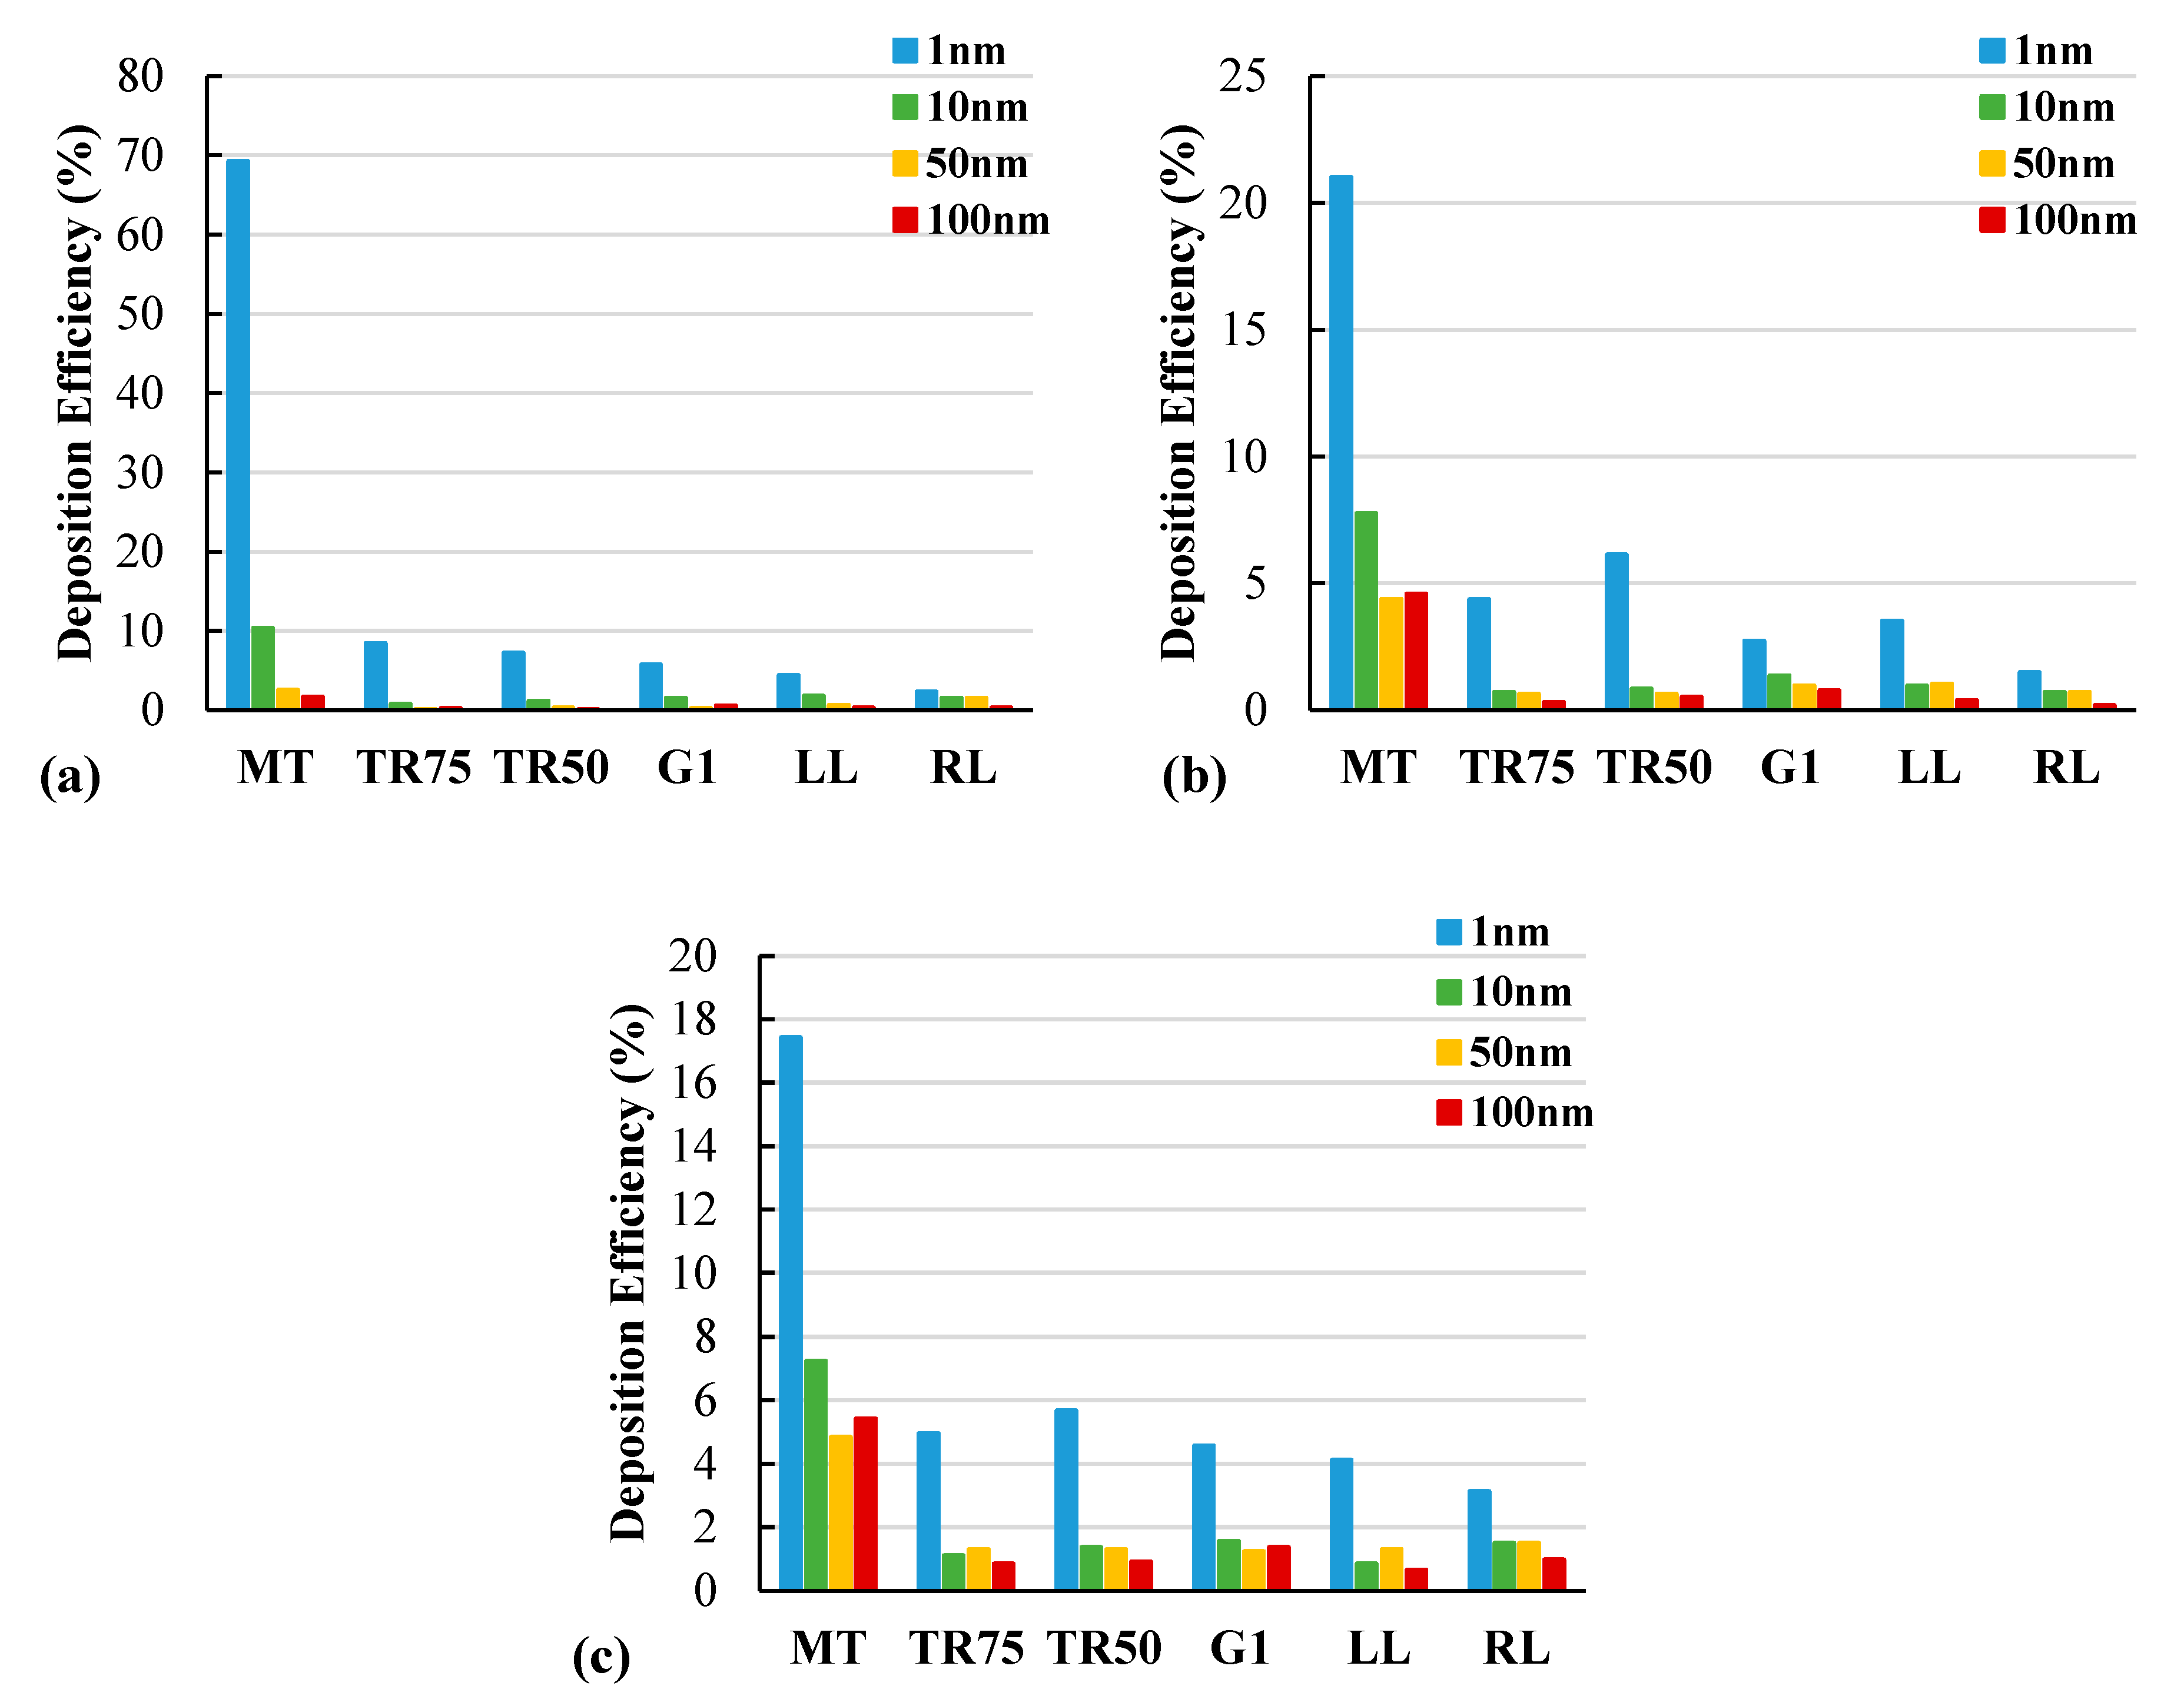
The DE was non-linear for different flow rates of different particle diameters. The overall DE indicates that the Brownian motion and diffusion mechanism are dominant for the smaller diameter nanoparticles. The percentage of DE decreased proportionally with the increase in the flow rate. At 7.5 L/min, around 70% of nanoparticles having a size of 1 nm were trapped in the mouth–throat area. At other flow rates, around 20% of the particles having this size were trapped in this area. The DE in the stenosis sections was found to be less than 10% for both 75% and 50% reductions, and all flow rates.
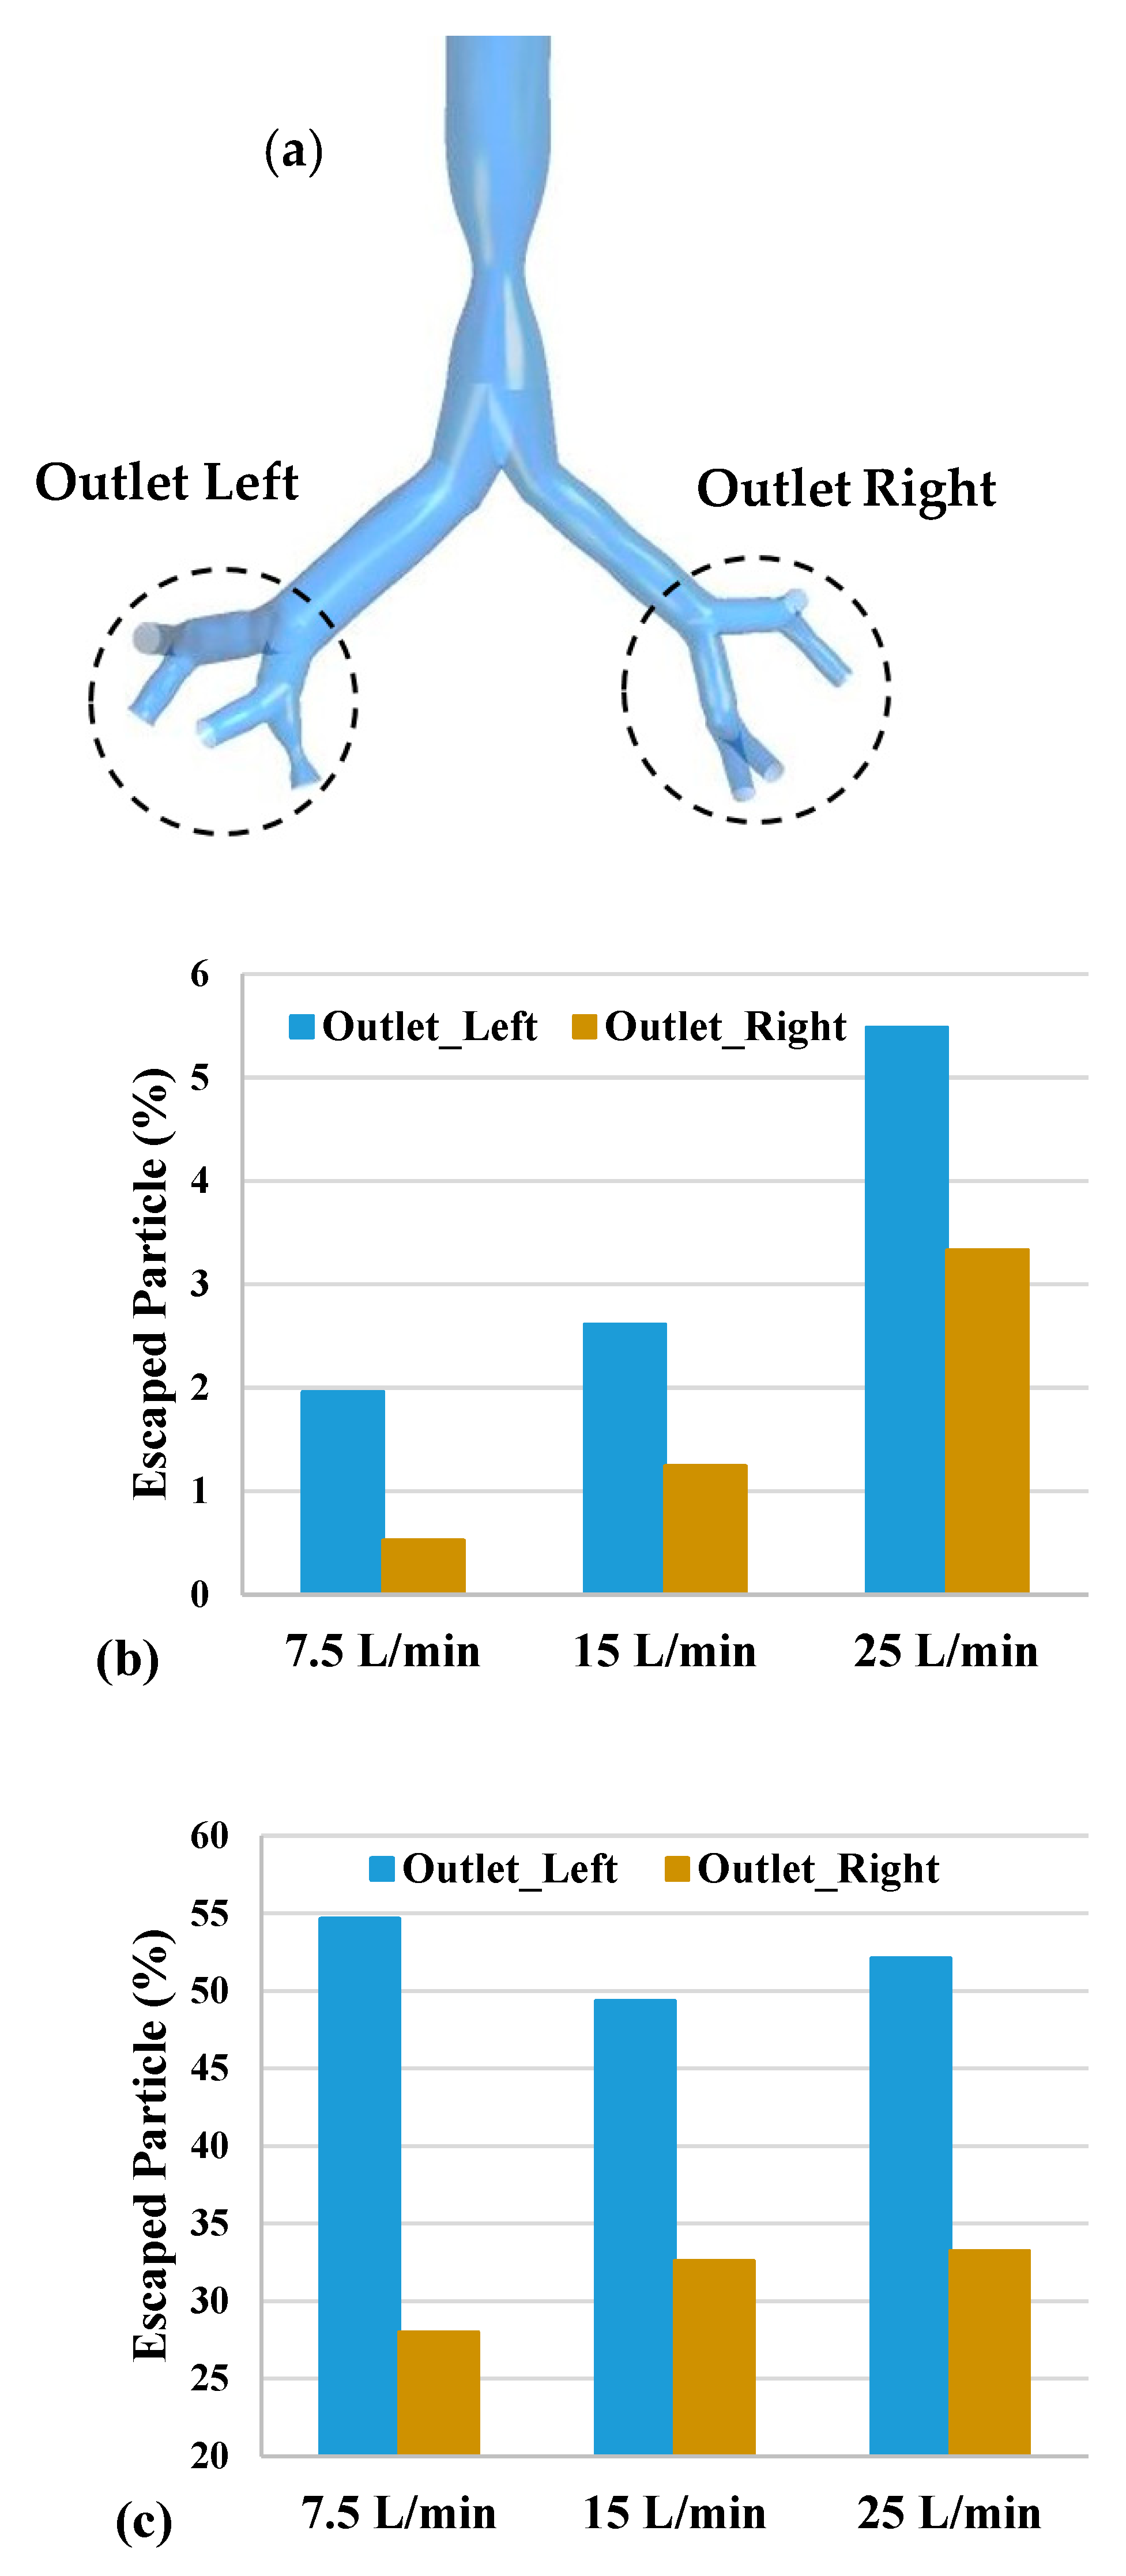
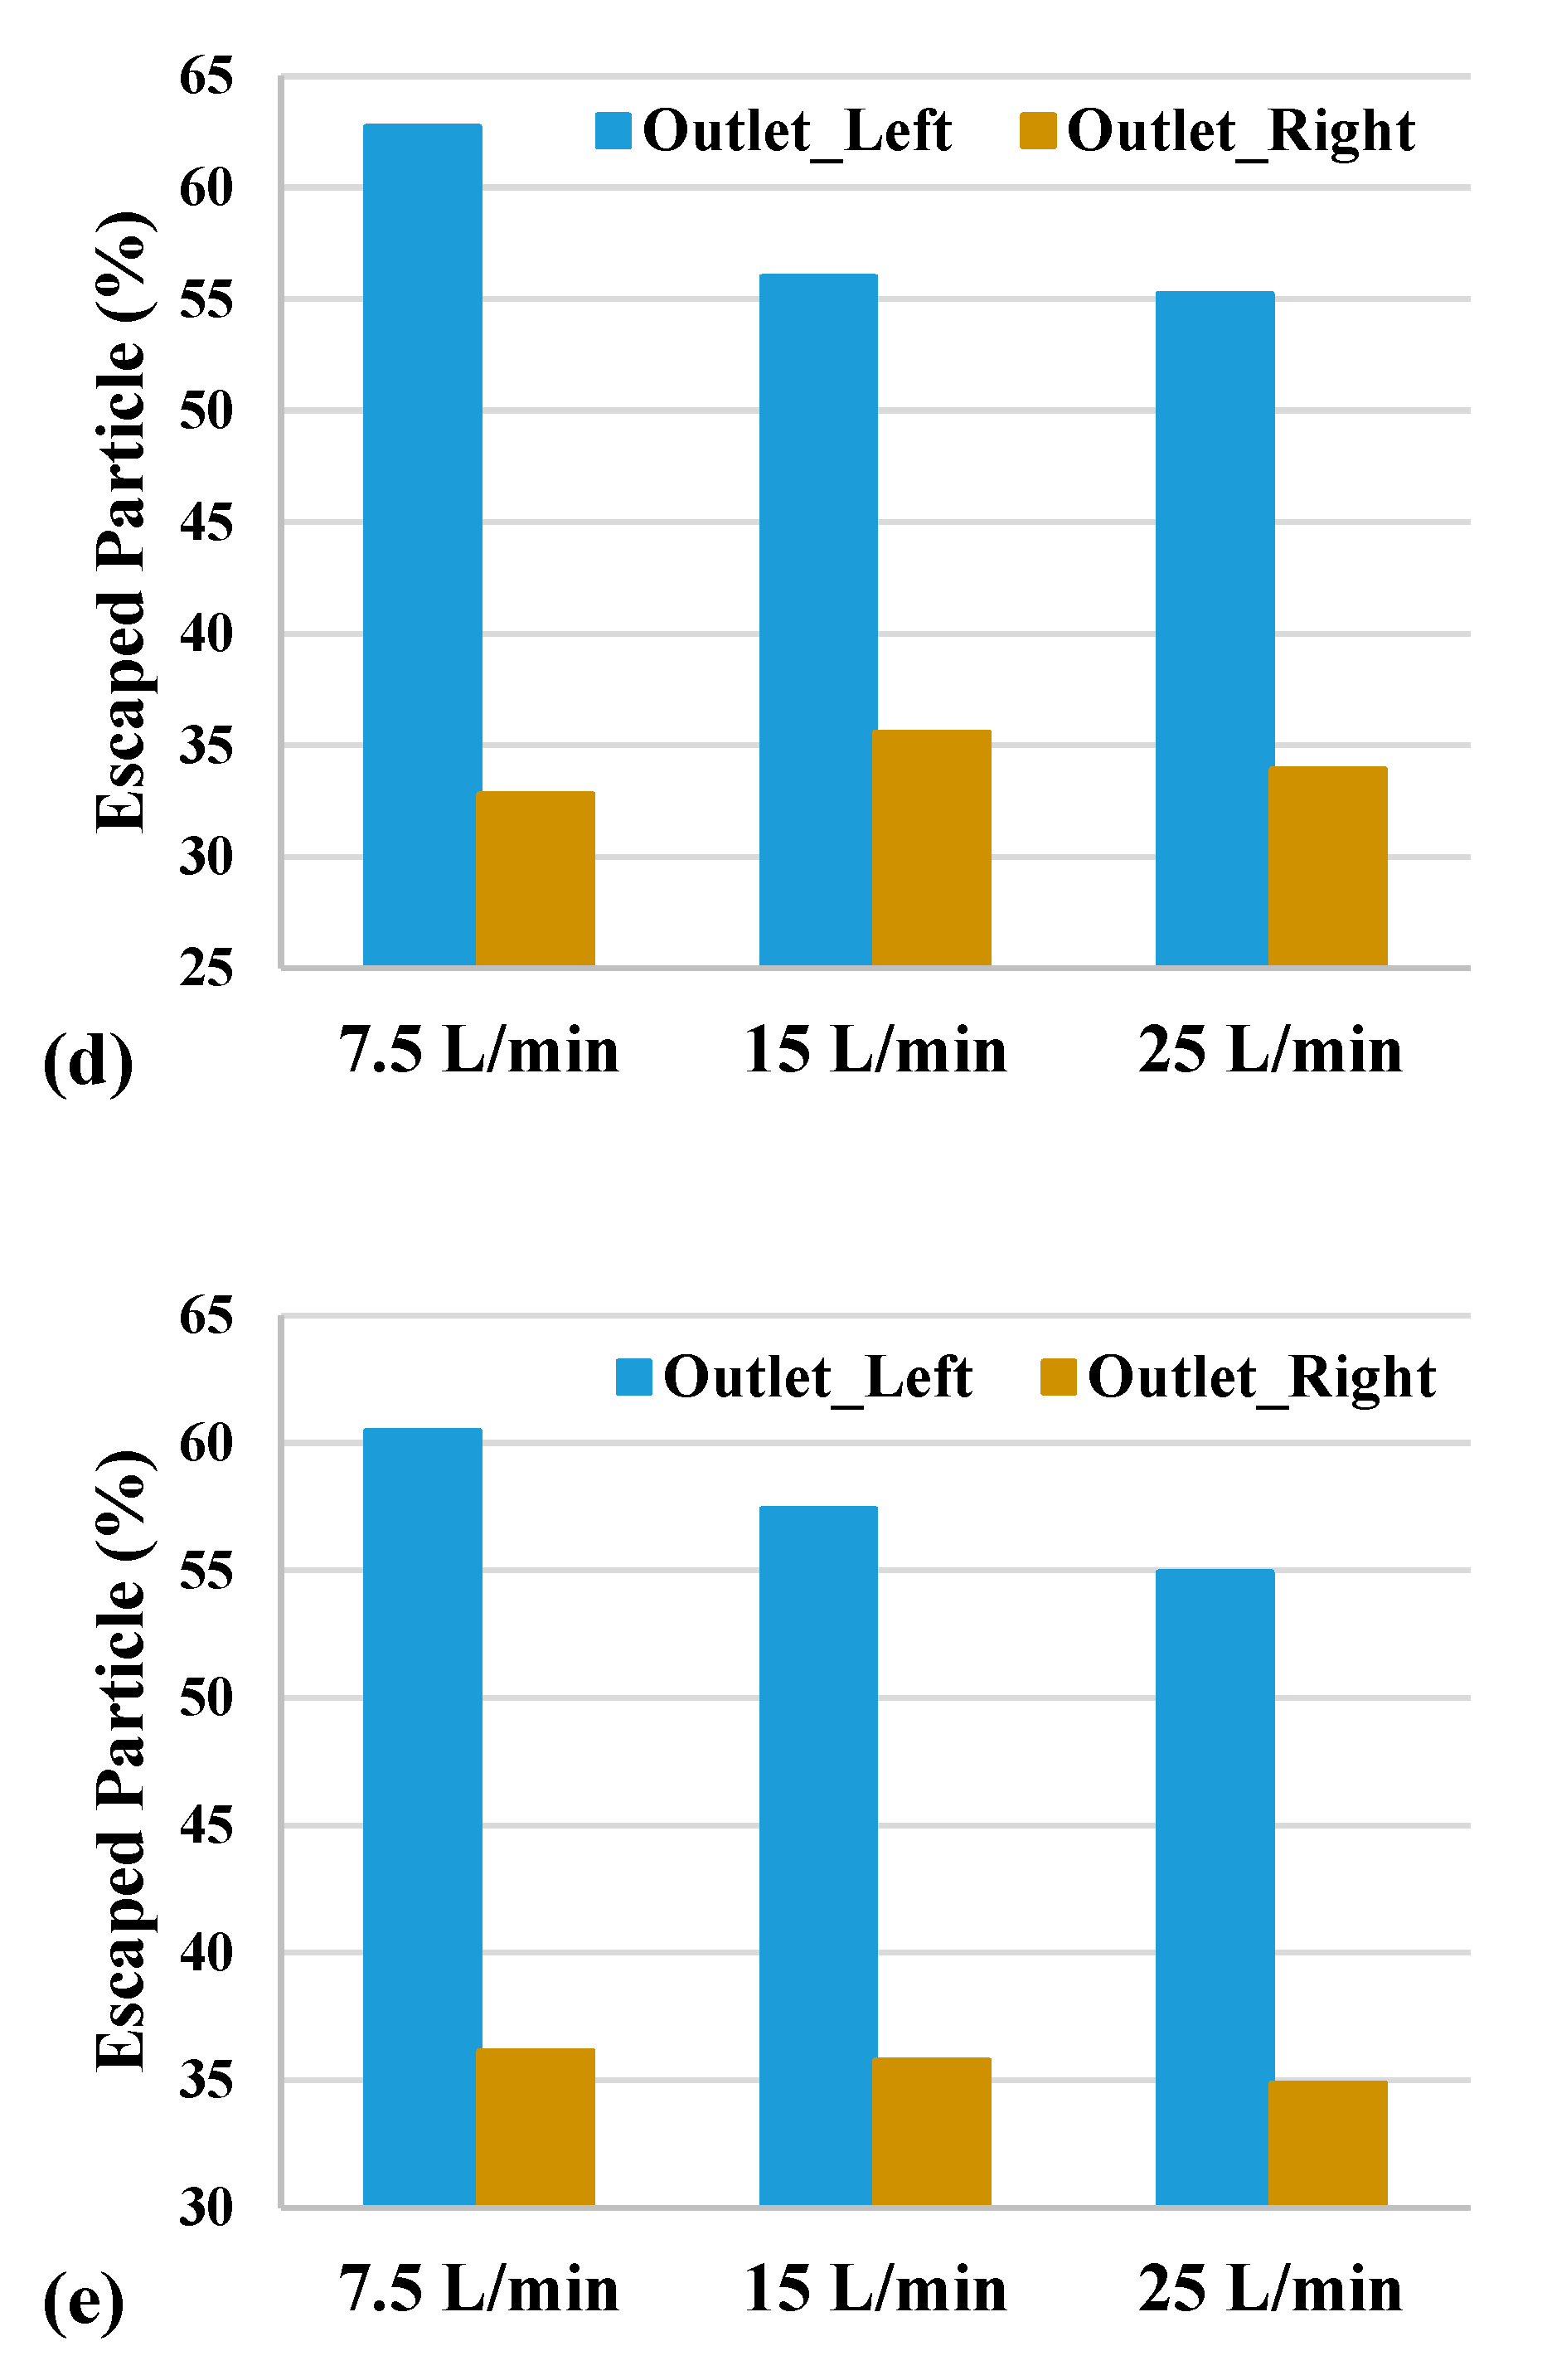
More than 50% of the nanoparticles having a size of 10–100 nm escaped through the outlet at the left lung of the 3rd generation. For the outlet at the right lung of the same generation, less than 36% of escaped particles had a size of 10–100 nm. For the nanoparticles having a size of 1 nm, the proportion of escaped particles was less than 6% for both outlets.
This novel study analyzed the nanoparticle transport and airflow behavior through multi-stenosis sections having different sizes in the trachea and other stenosis sections in the upper airway (third generation). The study identified critical flow and particle behavior that may help in the health risk assessment of diseased airways. The findings of this study provide a precise understanding of the pressure variation and wall shear of diseased upper airways. The comprehensive DE data can potentially improve the knowledge of the ultrafine particle transport through diseased airways. This study, along with more case-specific analysis, will improve respiratory health assessments and targeted delivery of drugs through multi-stenosis airways. Future research will analyze the flow dynamics and particle behavior through patient-specific airways. Furthermore, special stenosis will be considered and compared with the healthy lung. A comprehensive investigation of the effect of particle shape and size after collision will also be considered in future study.

Author Contributions

Data curation, M.R.I., P.L., X.C., H.M.B. and M.S.I.; Formal analysis, J.D.; Funding acquisition, M.S.I.; Investigation, S.U. and Y.G.; Methodology, K.I.; Project administration, T.K.G.; Supervision, Y.G. and M.S.I.; Validation, M.S.I.; Writing—original draft, M.R.I., P.L., M.M.R., S.U. and H.M.B.; Writing—review & editing, P.L., T.K.G., X.C., K.I., J.D., Y.G. and M.S.I. All authors have read and agreed to the published version of the manuscript.

Funding

This research received no external funding.

Institutional Review Board Statement

All procedures performed in studies involving human participants were in accordance with the institutional and/or national research committee’s ethical standards and with the 1964 Helsinki declaration and its later amendments or comparable ethical standards.

Informed Consent Statement

Informed consent was obtained from all subjects involved in the study.

Data Availability Statement

Data will be available upon reasonable request.

Acknowledgments

The authors acknowledge the computational facility at UTS.

Conflicts of Interest

The authors declare no conflict of interest.

References

  1. Newsroom. Who. Int. Published 2021. Available online: https://www.who.int/news-room/air-pollution#:~:text=WHO%20estimates%20that%20around%207,deaths%20in%20the%20same%20period (accessed on 3 August 2021).
  2. Household Air Pollution and Health. Who. Int. Published 2021. Available online: https://www.who.int/news-room/fact-sheets/detail/household-air-pollution-and-health (accessed on 3 August 2021).
  3. Larpruenrudee, P.; Surawski, N.C.; Islam, M.S. The Effect of Metro Construction on the Air Quality in the Railway Transport System of Sydney, Australia. Atmosphere 2022, 13, 759. [Google Scholar] [CrossRef]
  4. Duong, B.V.; Larpruenrudee, P.; Fang, T.; Hossain, S.I.; Saha, S.C.; Gu, Y.; Islam, M.S. Is the SARS-CoV-2 Omicron Variant Deadlier and More Transmissible than Delta Variant? Int. J. Environ. Res. Public Health 2022, 19, 4586. [Google Scholar] [CrossRef] [PubMed]
  5. Van Ertbruggen, C.; Hirsch, C.; Paiva, M. Anatomically based three-dimensional model of airways to simulate flow and particle transport using computational fluid dynamics. J. Appl. Physiol. 2005, 98, 970–980. [Google Scholar] [CrossRef] [PubMed] [Green Version]
  6. Katz, I.M.; Martin, A.R.; Muller, P.-A.; Terzibachi, K.; Feng, C.-H.; Caillibotte, G.; Sandeau, J.; Texereau, J. The ventilation distribution of helium–oxygen mixtures and the role of inertial losses in the presence of heterogeneous airway obstructions. J. Biomech. 2011, 44, 1137–1143. [Google Scholar] [CrossRef]
  7. Borojeni, A.A.; Noga, M.L.; Martin, A.R.; Finlay, W.H. Validation of airway resistance models for predicting pressure loss through anatomically realistic conducting airway replicas of adults and children. J. Biomech. 2015, 48, 1988–1996. [Google Scholar] [CrossRef]
  8. Kumar, H.; Tawhai, M.; Hoffman, E.; Lin, C.-L. The effects of geometry on airflow in the acinar region of the human lung. J. Biomech. 2009, 42, 1635–1642. [Google Scholar] [CrossRef] [PubMed] [Green Version]
  9. Soni, B.; Aliabadi, S. Large-scale CFD simulations of airflow and particle deposition in lung airway. Comput. Fluids 2013, 88, 804–812. [Google Scholar] [CrossRef]
  10. Heenan, A.F.; Matida, E.; Pollard, A.; Finlay, W.H. Experimental measurements and computational modeling of the flow field in an idealized human oropharynx. Exp. Fluids 2003, 35, 70–84. [Google Scholar] [CrossRef]
  11. Ghosh, A.; Islam, M.S.; Saha, S.C. Targeted Drug Delivery of Magnetic Nano-Particle in the Specific Lung Region. Computation 2020, 8, 10. [Google Scholar] [CrossRef] [Green Version]
  12. Islam, M.S.; Saha, S.C.; Sauret, E.; Ong, H.; Young, P.; Gu, Y. Euler–Lagrange approach to investigate respiratory anatomical shape effects on aerosol particle transport and deposition. Toxicol. Res. Appl. 2019, 3, 2397847319894675. [Google Scholar] [CrossRef] [Green Version]
  13. Rahimi-Gorji, M.; Pourmehran, O.; Gorji-Bandpy, M.; Gorji, T. CFD simulation of airflow behavior and particle transport and deposition in different breathing conditions through the realistic model of human airways. J. Mol. Liq. 2015, 209, 121–133. [Google Scholar] [CrossRef]
  14. Asgharian, B.; Price, O.; Hofmann, W. Prediction of particle deposition in the human lung using realistic models of lung ventilation. J. Aerosol Sci. 2006, 37, 1209–1221. [Google Scholar] [CrossRef]
  15. Islam, M.; Saha, S.; Sauret, E.; Gu, Y.; Ristovski, Z. Numerical Investigation of Aerosol Particle Transport and Deposition in Realistic Lung Airway. In 6th International Conference on Computational Methods, 2015; ScienTech Publisher: Auckland, New Zealand, 2015; pp. 1–9. [Google Scholar]
  16. Arsalanloo, A.; Abbasalizadeh, M.; Khalilian, M.; Saniee, Y.; Ramezanpour, A.; Islam, M.S. A computational approach to understand the breathing dynamics and pharmaceutical aerosol transport in a realistic airways. Adv. Powder Technol. 2022, 33, 103635. [Google Scholar] [CrossRef]
  17. Kim, J.; Heise, R.L.; Reynolds, A.M.; Pidaparti, R.M. Aging effects on airflow dynamics and lung function in human bronchioles. PLoS ONE 2017, 12, e0183654. [Google Scholar] [CrossRef]
  18. Islam, M.; Larpruenrudee, P.; Hossain, S.; Rahimi-Gorji, M.; Gu, Y.; Saha, S.; Paul, G. Polydisperse Aerosol Transport and Deposition in Upper Airways of Age-Specific Lung. Int. J. Environ. Res. Public Health 2021, 18, 6239. [Google Scholar] [CrossRef] [PubMed]
  19. Morin, C.; Proteau, S.; Rousseau, E.; Brayden, J. Organ-Cultured Airway Explants: A New Model of Airway Hyperresponsiveness. Exp. Lung Res. 2005, 31, 719–744. [Google Scholar] [CrossRef]
  20. Khaddaj-Mallat, R.; Rousseau, É. MAG-EPA and 17,18-EpETE target cytoplasmic signalling pathways to reduce short-term airway hyperresponsiveness. Pflüg. Arch.-Eur. J. Physiol. 2015, 467, 1591–1605. [Google Scholar] [CrossRef]
  21. Cheng, Y.-S.; Zhou, Y.; Chen, B.T. Particle Deposition in a Cast of Human Oral Airways. Aerosol Sci. Technol. 1999, 31, 286–300. [Google Scholar] [CrossRef]
  22. Cheng, K.-H.; Cheng, Y.-S.; Yeh, H.-C.; Swift, D.L. Deposition of Ultrafine Aerosols in the Head Airways During Natural Breathing and During Simulated Breath Holding Using Replicate Human Upper Airway Casts. Aerosol Sci. Technol. 1995, 23, 465–474. [Google Scholar] [CrossRef]
  23. Martin, A.R.; Finlay, W.H. A general, algebraic equation for predicting total respiratory tract deposition of micrometer-sized aerosol particles in humans. J. Aerosol Sci. 2007, 38, 246–253. [Google Scholar] [CrossRef]
  24. Stahlhofen, W.; Rudolf, G.; James, A. Intercomparison of Experimental Regional Aerosol Deposition Data. J. Aerosol Med. 1989, 2, 285–308. [Google Scholar] [CrossRef]
  25. Jayaraju, S.; Brouns, M.; Verbanck, S.; Lacor, C. Fluid flow and particle deposition analysis in a realistic extrathoracic airway model using unstructured grids. J. Aerosol Sci. 2007, 38, 494–508. [Google Scholar] [CrossRef]
  26. Luo, H.; Liu, Y. Modeling the bifurcating flow in a CT-scanned human lung airway. J. Biomech. 2008, 41, 2681–2688. [Google Scholar] [CrossRef] [PubMed]
  27. Xi, J.; Longest, P.W. Transport and Deposition of Micro-Aerosols in Realistic and Simplified Models of the Oral Airway. Ann. Biomed. Eng. 2007, 35, 560–581. [Google Scholar] [CrossRef] [PubMed]
  28. Zhang, Z.; Kleinstreuer, C.; Kim, C.S. Comparison of analytical and CFD models with regard to micron particle deposition in a human 16-generation tracheobronchial airway model. J. Aerosol Sci. 2009, 40, 16–28. [Google Scholar] [CrossRef]
  29. Ilie, M.; Matida, E.A.; Finlay, W.H. Asymmetrical Aerosol Deposition in an Idealized Mouth with a DPI Mouthpiece Inlet. Aerosol Sci. Technol. 2008, 42, 10–17. [Google Scholar] [CrossRef] [Green Version]
  30. Sul, B.; Wallqvist, A.; Morris, M.J.; Reifman, J.; Rakesh, V. A computational study of the respiratory airflow characteristics in normal and obstructed human airways. Comput. Biol. Med. 2014, 52, 130–143. [Google Scholar] [CrossRef]
  31. Beni, H.M.; Mortazavi, H.; Tashvighi, E.; Islam, M.S. Investigation of the Upper Respiratory Tract of a Male Smoker with Laryngeal Cancer by Inhaling Air Associated with Various Physical Activity Levels. Atmosphere 2022, 13, 717. [Google Scholar] [CrossRef]
  32. Rahman, M.; Zhao, M.; Islam, M.S.; Dong, K.; Saha, S.C. Aging effects on airflow distribution and micron-particle transport and deposition in a human lung using CFD-DPM approach. Adv. Powder Technol. 2021, 32, 3506–3516. [Google Scholar] [CrossRef]
  33. Zhang, Z.; Kleinstreuer, C.; Donohue, J.; Kim, C. Comparison of micro- and nano-size particle depositions in a human upper airway model. J. Aerosol Sci. 2005, 36, 211–233. [Google Scholar] [CrossRef]
  34. Zhang, L.; Cheng, H.; Zhang, C.; Xu, Z.; Ye, J. Deposition Fraction of Aerosol Particles in a Human Oral Airway Model on Stable Condition. Aerosol Air Qual. Res. 2006, 6, 259–267. [Google Scholar] [CrossRef] [Green Version]
  35. Zhang, Z.; Kleinstreuer, C. Airflow structures and nano-particle deposition in a human upper airway model. J. Comput. Phys. 2004, 198, 178–210. [Google Scholar] [CrossRef]
  36. Schroter, R.; Sudlow, M. Flow patterns in models of the human bronchial airways. Respir. Physiol. 1969, 7, 341–355. [Google Scholar] [CrossRef]
  37. Farkas, Á.; Balásházy, I. Simulation of the effect of local obstructions and blockage on airflow and aerosol deposition in central human airways. J. Aerosol Sci. 2007, 38, 865–884. [Google Scholar] [CrossRef]
  38. Li, Z.; Kleinstreuer, C.; Zhang, Z. Simulation of airflow fields and microparticle deposition in realistic human lung airway models. Part II: Particle transport and deposition. Eur. J. Mech.–B/Fluids 2007, 26, 650–668. [Google Scholar] [CrossRef]
  39. Kim, C.S.; Iglesias, A.J. Deposition of Inhaled Particles in Bifurcating Airway Models: I. Inspiratory Deposition. J. Aerosol Med. 1989, 2, 1–14. [Google Scholar] [CrossRef]
  40. Luo, H.; Liu, Y.; Yang, X. Particle deposition in obstructed airways. J. Biomech. 2007, 40, 3096–3104. [Google Scholar] [CrossRef]
  41. Jayaraju, S.; Brouns, M.; Lacor, C.; Belkassem, B.; Verbanck, S. Large eddy and detached eddy simulations of fluid flow and particle deposition in a human mouth–throat. J. Aerosol Sci. 2008, 39, 862–875. [Google Scholar] [CrossRef]
  42. Stapleton, K.; Guentsch, E.; Hoskinson, M.; Finlay, W. On the suitability of k–ε turbulence modeling for aerosol deposition in the mouth and throat: A comparison with experiment. J. Aerosol Sci. 2000, 31, 739–749. [Google Scholar] [CrossRef]
  43. Longest, P.; Kleinstreuer, C.; Buchanan, J.R. Efficient computation of micro-particle dynamics including wall effects. Comput. Fluids 2004, 33, 577–601. [Google Scholar] [CrossRef]
  44. Lilley, G. Turbulence Modelling for CFD DC Wilcox DCW Industries, 5354 Palm Drive, La Canada, CA 91011, USA. 1993. 460pp+ software diskette. Illustrated. $75. Aeronaut. J. 1994, 98, 405. [Google Scholar] [CrossRef]
  45. Hawkins, D.B. Glottic and subglottic stenosis from endotracheal intubation. Laryngoscope 1977, 87, 339–346. [Google Scholar] [CrossRef] [PubMed]
  46. Parkin, J.L.; Stevens, M.H.; Jung, A.L. Acquired and Congenital Subglottic Stenosis in the Infant. Ann. Otol. Rhinol. Laryngol. 1976, 85, 573–581. [Google Scholar] [CrossRef]
  47. Fearon, B.; Cotton, R. Surgical Correction of Subglottic Stenosis of the Larynx in Infants and Children; Progress Report. Ann. Otol. Rhinol. Laryngol. 1974, 83, 428–431. [Google Scholar] [CrossRef]
  48. Papsidero, M.J.; Pashley, N.R.T. Acquired Stenosis of the Upper Airway in Neonates an Increasing Problem. Ann. Otol. Rhinol. Laryngol. 1980, 89, 512–514. [Google Scholar] [CrossRef] [PubMed]
  49. Hartley, B.; Cotton, R. Paediatric airway stenosis: Laryngotracheal reconstruction or cricotracheal resection? Clin. Otolaryngol. 2000, 25, 342–349. [Google Scholar] [CrossRef]
  50. Linna, O.; Hyrynkangas, K.; Lanning, P.; Nieminen, P. Central airways stenosis in school-aged children: Differential diagnosis from asthma. Acta Paediatr. 2002, 91, 399–402. [Google Scholar] [CrossRef] [PubMed]
  51. Hoppe, H.; Dinkel, H.-P.; Walder, B.; von Allmen, G.; Gugger, M.; Vock, P. Grading Airway Stenosis Down to the Segmental Level Using Virtual Bronchoscopy. Chest 2004, 125, 704–711. [Google Scholar] [CrossRef]
  52. Iwamoto, Y.; Miyazawa, T.; Kurimoto, N.; Miyazu, Y.; Ishida, A.; Matsuo, K.; Watanabe, Y. Interventional Bronchoscopy in the Management of Airway Stenosis Due to Tracheobronchial Tuberculosis. Chest 2004, 126, 1344–1352. [Google Scholar] [CrossRef] [Green Version]
  53. Nakagishi, Y.; Morimoto, Y.; Fujita, M.; Ozeki, Y.; Maehara, T.; Kikuchi, M. Rabbit Model of Airway Stenosis Induced by Scraping of the Tracheal Mucosa. Laryngoscope 2005, 115, 1087–1092. [Google Scholar] [CrossRef] [PubMed]
  54. Freitag, L.; Ernst, A.; Unger, M.; Kovitz, K.; Marquette, C.H. A proposed classification system of central airway stenosis. Eur. Respir. J. 2007, 30, 7–12. [Google Scholar] [CrossRef] [PubMed] [Green Version]
  55. Nouraei, S.A.R.; Singh, A.; Patel, A.; Ferguson, C.; Howard, D.J.; Sandhu, G.S. Early Endoscopic Treatment of Acute Inflammatory Airway Lesions Improves the Outcome of Postintubation Airway Stenosis. Laryngoscope 2006, 116, 1417–1421. [Google Scholar] [CrossRef] [PubMed]
  56. Hirshoren, N.; Eliashar, R. Wound-healing modulation in upper airway stenosis-Myths and facts. Head Neck 2009, 31, 111–126. [Google Scholar] [CrossRef] [PubMed]
  57. Kimura, M.; Miyajima, K.; Kojika, M.; Kono, T.; Kato, H. Photodynamic Therapy (PDT) with Chemotherapy for Advanced Lung Cancer with Airway Stenosis. Int. J. Mol. Sci. 2015, 16, 25466–25475. [Google Scholar] [CrossRef] [PubMed] [Green Version]
  58. Guibert, N.; Didier, A.; Moreno, B.; Mhanna, L.; Brouchet, L.; Plat, G.; Hermant, C.; Mazieres, J. Treatment of Post-transplant Complex Airway Stenosis with a Three-Dimensional, Computer-assisted Customized Airway Stent. Am. J. Respir. Crit. Care Med. 2017, 195, e31–e33. [Google Scholar] [CrossRef] [PubMed]
  59. Islam, M.S.; Saha, S.C.; Young, P.M. Aerosol particle transport and deposition in a CT-based lung airway for helium-oxygen mixture. In Proceedings of the 21st Australasian Fluid Mechanics Conference, Adelaide, Australia, 10–13 December 2018. [Google Scholar]
  60. Larpruenrudee, P.; Islam, M.S.; Paul, G.; Paul, A.R.; Gu, Y.T.; Saha, S.C. Model for Pharmaceutical aerosol transport through stenosis airway. In Handbook of Lung Targeted Drug Delivery Systems: Recent Trends and Clinical Evidences; CRC Press: Boca Raton, FL, USA, 2021; pp. 91–128. [Google Scholar]
  61. Lintermann, A.; Schröder, W. Simulation of aerosol particle deposition in the upper human tracheobronchial tract. Eur. J. Mech.–B/Fluids 2017, 63, 73–89. [Google Scholar] [CrossRef]
  62. Tsuboi, N.; Matsumoto, S.; Nishimura, N.; Nakagawa, S.; Kobayashi, H. Fluid dynamics approach to airway obstruction. Med. Hypotheses 2019, 132, 109341. [Google Scholar] [CrossRef]
  63. Zhu, L.; Shen, J.; Gong, X.; Liu, L.; Liu, J.; Xu, Z. Effects of Different Modes of Mechanical Ventilation on Aerodynamics of the Patient-specific Airway: A Numerical Study. In Proceedings of the 2019 41st Annual International Conference of the IEEE Engineering in Medicine and Biology Society (EMBC), Berlin, Germany, 23–27 July 2019; pp. 4961–4964. [Google Scholar] [CrossRef]
  64. Islam, M.S.; Saha, S.C.; Gemci, T.; Yang, I.A.; Sauret, E.; Gu, Y.T. Polydisperse Microparticle Transport and Deposition to the Terminal Bronchioles in a Heterogeneous Vasculature Tree. Sci. Rep. 2018, 8, 16387. [Google Scholar] [CrossRef]
  65. Singh, P.; Raghav, V.; Padhmashali, V.; Paul, G.; Islam, M.S.; Saha, S.C. Airflow and Particle Transport Prediction through Stenosis Airways. Int. J. Environ. Res. Public Health 2020, 17, 1119. [Google Scholar] [CrossRef] [PubMed] [Green Version]
  66. Weibel, E.R. Morphometry of the Human Lung; Academic Press: Cambridge, MA, USA, 1963; ISBN 978-1-4832-0076-7. [Google Scholar]
  67. Inthavong, K.; Tu, J.; Ahmadi, G. Computational Modelling of Gas-Particle Flows with Different Particle Morphology in the Human Nasal Cavity. J. Comput. Multiph. Flows 2009, 1, 57–82. [Google Scholar] [CrossRef] [Green Version]
  68. Longest, P.W.; Xi, J. Effectiveness of Direct Lagrangian Tracking Models for Simulating Nanoparticle Deposition in the Upper Airways. Aerosol Sci. Technol. 2007, 41, 380–397. [Google Scholar] [CrossRef]
  69. Xi, J.; Longest, P.W. Effects of Oral Airway Geometry Characteristics on the Diffusional Deposition of Inhaled Nanoparticles. J. Biomech. Eng. 2008, 130, 011008. [Google Scholar] [CrossRef] [PubMed]
  70. Cheng, K.-H.; Swift, D.L. Calculation of Total Deposition Fraction of Ultrafine Aerosols in Human Extrathoracic and Intrathoracic Regions. Aerosol Sci. Technol. 1995, 22, 194–201. [Google Scholar] [CrossRef]
  71. Islam, M.S.; Saha, S.C.; Gemci, T.; Yang, I.A.; Sauret, E.; Ristovski, Z.; Gu, Y.T. Euler-Lagrange Prediction of Diesel-Exhaust Polydisperse Particle Transport and Deposition in Lung: Anatomy and Turbulence Effects. Sci. Rep. 2019, 9, 12423. [Google Scholar] [CrossRef] [PubMed] [Green Version]
  72. Kleinstreuer, C.; Zhang, Z. Laminar-to-turbulent fluid-particle flows in a human airway model. Int. J. Multiph. Flow 2003, 29, 271–289. [Google Scholar] [CrossRef]
  73. Gemci, T.; Ponyavin, V.; Chen, Y.; Chen, H.; Collins, R. Computational model of airflow in upper 17 generations of human respiratory tract. J. Biomech. 2008, 41, 2047–2054. [Google Scholar] [CrossRef] [PubMed]
  74. Kuprat, A.; Jalali, M.; Jan, T.; Corley, R.; Asgharian, B.; Price, O.; Singh, R.; Colby, S.; Darquenne, C. Efficient bi-directional coupling of 3D computational fluid-particle dynamics and 1D Multiple Path Particle Dosimetry lung models for multiscale modeling of aerosol dosimetry. J. Aerosol Sci. 2020, 151, 105647. [Google Scholar] [CrossRef] [PubMed]
  75. Zhao, J.; Feng, Y.; Tian, G.; Taylor, C.; Arden, N.S. Influences of puff protocols and upper airway anatomy on cannabis pharmacokinetics: A CFPD-PK study. Comput. Biol. Med. 2021, 132, 104333. [Google Scholar] [CrossRef]
  76. Islam, M.S.; Larpruenrudee, P.; Paul, A.R.; Paul, G.; Gemci, T.; Gu, Y.; Saha, S.C. SARS-CoV-2 aerosol: How far it can travel to the lower airways? Phys. Fluids 2021, 33, 061903. [Google Scholar] [CrossRef]
  77. Islam, M.S.; Larpruenrudee, P.; Saha, S.; Pourmehran, O.; Paul, A.; Gemci, T.; Collins, R.; Paul, G.; Gu, Y. How severe acute respiratory syndrome coronavirus-2 aerosol propagates through the age-specific upper airways. Phys. Fluids 2021, 33, 081911. [Google Scholar] [CrossRef] [PubMed]
  78. Bass, K.; Thomas, M.L.; de Corput, M.P.C.K.-V.; Tiddens, H.A.W.M.; Longest, P.W. Development of characteristic airway bifurcations in cystic fibrosis. Aerosol Sci. Technol. 2021, 55, 1143–1164. [Google Scholar] [CrossRef]
  79. Chen, W.-H.; Chang, C.-M.; Mutuku, J.K.; Lam, S.S.; Lee, W.-J. Aerosol deposition and airflow dynamics in healthy and asthmatic human airways during inhalation. J. Hazard. Mater. 2021, 416, 125856. [Google Scholar] [CrossRef]
  80. Fan, Z.; Holmes, D.W.; Sauret, E.; Islam, M.S.; Saha, S.C.; Ristovski, Z.; Gu, Y.T. A multiscale modeling method incorporating spatial coupling and temporal coupling into transient simulations of the human airways. Int. J. Numer. Methods Fluids 2021, 93, 2905–2920. [Google Scholar] [CrossRef]
  81. Hayati, H.; Feng, Y.; Hinsdale, M. Inter-species variabilities of droplet transport, size change, and deposition in human and rat respiratory systems: An in silico study. J. Aerosol Sci. 2021, 154, 105761. [Google Scholar] [CrossRef]
  82. Haider, A.; Levenspiel, O. Drag coefficient and terminal velocity of spherical and nonspherical particles. Powder Technol. 1989, 58, 63–70. [Google Scholar] [CrossRef]
  83. Li, A.; Ahmadi, G. Dispersion and Deposition of Spherical Particles from Point Sources in a Turbulent Channel Flow. Aerosol Sci. Technol. 1992, 16, 209–226. [Google Scholar] [CrossRef]
  84. Saffman, P.G. The lift on a small sphere in a slow shear flow. J. Fluid Mech. 1965, 22, 385–400. [Google Scholar] [CrossRef] [Green Version]
  85. Kumar, B.; Srivastav, V.K.; Jain, A.; Paul, A.R. Study of Numerical Schemes for the CFD Simulation of Human Airways. Int. J. Integr. Eng. 2019, 11, 32–40. [Google Scholar]
Figure 1. Construction of models from a CT-based mouth–throat model and Weibel’s model of a bronchial airway with stenosis conditions: (a) front view and (b) side view.
Atmosphere 13 01192 g001
Figure 2. Unstructured mesh for selected sections of the lung model: (a) mesh for the whole lung model; (b) tetrahedral elements for the mouth–throat section; (c) mesh for a bifurcation branch; (d) inflation mesh at the inlet of the mouth–throat; and (e) inflation mesh at the outlet of the 3rd generation.
Atmosphere 13 01192 g002
Figure 3. Deposition efficiency comparison with the published literature [68,69,70].
Atmosphere 13 01192 g003
Figure 4. Velocity profiles for the three airflow rates at four selected cross-sections of the mouth-throat and trachea: (a) locations of cross-sections of the oral airways; (b) Line 1 at mouth area; (c) Line 2 at throat area; (d) Line 3 at trachea with 75% stenosis section; and (e) Line 4 at trachea with 50% stenosis section.
Atmosphere 13 01192 g004aAtmosphere 13 01192 g004b
Figure 5. Velocity fields and velocity contours at four selected locations, namely, the mouth, throat, trachea with stenosis 75% and 50% reductions, at (a) 7.5 L/min; (b) 15 L/min; and (c) 25 L/min.
Atmosphere 13 01192 g005
Figure 6. Velocity contours at selected positions of the lung airways: (a) 7.5 L/min; (b) 15 L/min; and (c) 25 L/min. Trachea 75%, Trachea with stenosis 75%; Trachea 50%, Trachea with stenosis 50%; G1, Generation 1; G2L, Generation-2 at left lung; G2R, Generation-2 at right lung; G3L 50%, Generation-3 at left lung with stenosis 50%; and G3R, Generation-3 at right lung.
Atmosphere 13 01192 g006
Figure 7. Pressure contours on the whole lung model for different flow rates: (a) 7.5 L/min; (b) 15 L/min; and (c) 25 L/min.
Atmosphere 13 01192 g007
Figure 8. Pressure at selected positions of the whole lung airways with three different airflow rates. TR75, Trachea with stenosis 75%; TR50, Trachea with stenosis 50%; G1, Generation-1; G2L, Generation-2 at left lung; G2R, Generation-2 at right lung; G3L, Generation-3 at left lung; G3R, Generation-3 at right lung.
Atmosphere 13 01192 g008
Figure 9. Wall shear on the whole lung model with stenosis sections for different flow rates: (a) 7.5 L/min; (b) 15 L/min; and (c) 25 L/min.
Atmosphere 13 01192 g009aAtmosphere 13 01192 g009b
Figure 10. Airflow streamlines during inhalation conditions with three different airflow rates: (a) 7.5 L/min; (b) 15 L/min; and (c) 25 L/min.
Atmosphere 13 01192 g010
Figure 11. Particle deposition efficiency (DE) at various airway positions with three airflow rates: (a) 7.5 L/min; (b) 15 L/min; and (c) 25 L/min. MT, Mouth–throat; TR75, Trachea with stenosis 75%; TR50, Trachea with stenosis 50%; G1, Generation 1; LL, Left lung; and RL, Right lung.
Atmosphere 13 01192 g011
Figure 12. Particle deposition scenario with hotspot regions at a 25 L/min airflow rate.
Atmosphere 13 01192 g012
Figure 13. Escaped particles through the outlets of left and right lung airways with three airflow rates: (a) outlet definition; (b) 1 nm; (c) 10 nm; (d) 50 nm; and (e) 100 nm.
Atmosphere 13 01192 g013aAtmosphere 13 01192 g013b
Publisher’s Note: MDPI stays neutral with regard to jurisdictional claims in published maps and institutional affiliations.

