Review

Cooking Particulate Matter: A Systematic Review on Nanoparticle Exposure in the Indoor Cooking Environment

1
Division of Occupational Medicine, Department of Medical Sciences and Public Health, University of Cagliari, Cittadella Universitaria, 09042 Monserrato, Italy
2
Smart-Health Initiative (SHI) and Red Sea Research Center (RSRC), Division of Biological and Environmental Sciences and Engineering (BESE), King Abdullah University of Science and Technology (KAUST), Thuwal 23955-6900, Saudi Arabia
3
Department of Public Health, Experimental and Forensic Medicine, University of Pavia, 27100 Pavia, Italy
4
Department of Sciences for Health Promotion and Mother and Child Care “Giuseppe D’Alessandro”, University of Palermo, 90127 Palermo, Italy
*
Author to whom correspondence should be addressed.
Atmosphere 2023, 14(1), 12; https://doi.org/10.3390/atmos14010012
Submission received: 12 October 2022 / Revised: 29 November 2022 / Accepted: 16 December 2022 / Published: 21 December 2022

Abstract

:
Background: Cooking and fuel combustion in the indoor environment are major sources of respirable suspended particulate matter (RSPM), which is an excellent carrier of potentially harmful absorbed inorganic and organic compounds. Chronic exposure to RSPM can lead to acute pulmonary illness, asthma, cardiovascular disease, and lung cancer in people involved in cooking. Despite this, questions remain about the harmfulness of different particulate matter (PM) sources generated during cooking, and the factors influencing PM physico-chemical properties. The most reliable methods for sampling and analyzing cooking emissions remain only partially understood. Objectives: This review aims to comprehensively assess the risks of PM generated during cooking, considering the main sources of PM, PM chemical composition, and strategies for PM physico-chemical analysis. We present the first systematic analysis of PM sources and chemical composition related to cooking. We highlight significant differences between studies using different experimental conditions, with a lack of a standard methodology. Methods: Following the Preferred Reporting Items for Systematic Reviews and Meta-Analyses (PRISMA) statement rules and the Patient, Intervention, Comparison, and Outcome (PICO) strategy for scientific research, three different scientific databases (PubMed, Scopus, and Web of Science) were screened to find scientific articles that measure, collect, and analyze the chemical composition of nanometer- and micrometer-sized PM generated during cooking activities under different conditions. Data are summarized to assess risk, evaluating the main sources and factors influencing PM generation, their chemical composition, and how they have been collected and analyzed in changing experimental conditions. Results: From 2474 search results, there were 55 studies that met our criteria. Overall, the main variable sources of PM in cooking activities relate to the stove and fuel type. The concentration and chemical–physical properties of PM are also strongly influenced by the food and food additive type, food processing type, cooking duration, temperature, and utensils. The most important factor influencing indoor PM concentration is ventilation. The PM generated during cooking activities is composed mainly of elemental carbon (EC) and its derivatives, and the porous structure of PM with high surface-to-volume ratio is a perfect carrier of inorganic and organic matter. Conclusions: This review reveals a growing interest in PM exposure during cooking activities and highlights significant variability in the chemical–physical properties of particles, and thus variable exposure risks. Precise risk characterization improves possible preventive strategies to reduce the risk of indoor pollutant exposure. However, comprehensive PM analysis needs proper sampling and analysis methods which consider all factors influencing the physico-chemical properties of PM in an additive and synergistic way. Our analysis highlights the need for method standardization in PM environmental analyses, to ensure accuracy and allow deeper comparisons between future studies.

1. Introduction

Cooking and fuel/tobacco combustion are the main sources of respirable suspended particulate matter (RSPM) in the indoor environment [1]. Household air pollution (HAP) produced by solid fuels used in domestic cooking is a leading environmental risk factor for global mortality and morbidity, exceeding 3.5 million incidents annually [2] and ranking fifth in the global burden of disease estimate in 2010. Fine particulate matter (PM2.5; particulate matter with aerodynamic diameter ≤ 2.5 μm) penetrates deeply into the lungs, causing irritation and corrosion of the alveolar wall and consequently impairing proper lung function [3]. The exposure to solid cooking fuels resulted in nearly 60 million disability-adjusted life years in 2017, including 1.6 million premature deaths [4]. Growing household exposure to harmful compounds is significant, while people spend almost 80% of their time indoors [5]. Among half of the world’s population is exposed to HAP, with women and children experiencing particularly high HAP exposures [6].
The burning of solid biofuels (SBFs) in traditional cooking stoves leads to incomplete combustion and emission of a mixture of pollutants in the form of particles, gases, and vapors [7,8]. Over 2.6 billion people worldwide rely on biomass for cooking and heating [9,10]. For instance, over 85% of rural Indian households use SBFs for daily cooking. In addition, unplanned and poorly designed cooking spaces increase the accumulation of smoke [7].
CO, PM2.5, black carbon, and ultrafine particles (UFPs, particles with diameters less than 100 nm) are the main products of incomplete combustion [11,12]. HAP from incomplete biomass combustion contains health-damaging pollutants such as polycyclic aromatic hydrocarbons (PAHs) [13]. Of note, RSPM is an excellent carrier of absorbed inorganic and organic compounds, particularly PAHs.
PM is generated during cooking by both fuel combustion and meal preparation. The PM production depends on multiple factors [14] such as type of fuel, type of kitchen set-up, house architecture, ventilation, geographical conditions, and exposure time (Figure 1). A recent study by Kumar et al. [15] in 60 low-income homes across 12 cities placed in all continents showed that fuel type, kitchen size, cooking type, duration, and ventilation conditions were the most crucial factors significantly affecting aerosol particles in kitchen exposure. Importantly, mechanical ventilation can decrease the in-kitchen exposure by a factor of two compared with natural ventilation.
Short-term exposure to air pollution from cookstoves can increase systolic pressure in 24 h, depending on the stove type and PM2.5 concentration, and even low-level exposure may have adverse cardiovascular effects [16].
Chronic exposure to carcinogenic PAHs present in air pollution in the form of RSPM may lead to acute pulmonary illness, asthma, pulmonary tuberculosis, and lung cancer in people involved in the cooking activity [17]. HAP exposure from indoor solid fuel combustion is associated with cardiovascular disease [18]. There are numerous mechanistic pathways which associate particulate matter exposure with cardiovascular disease, for instance systemic inflammation, endothelial dysfunction, and oxidative stress [19,20]. Supporting evidence exists for exposure to ambient air pollution and increased levels of circulating C-reactive protein, which is an indication of systemic general inflammatory activity and a predictor of future cardiovascular disease as well as all-cause mortality [21,22]. Additional biomarkers of increased endothelial inflammation and cardiovascular disease, such as Serum Amyloid A, Interleukin 1-β, Interleukin-8, Tumor Necrosis Factor-α, Intercellular Adhesion Molecule 1, and Vascular Cell Adhesion Molecule, [23] are also associated with cleaner-burning stoves and measured HAPs [24,25].
Inhaled nanoparticles may translocate to the brain through axonal transport from the olfactory mucosa into the olfactory bulb and/or the blood circulation after alveolar deposition [26]. Recent epidemiological studies reported associations between exposure to UFPs and brain cancer [27], as well as neurodegenerative diseases [28]. The study of Torkmahalleh et al. [29] suggests that chronic exposure to high concentrations of cooking aerosol might progress toward Alzheimer Disease (AD). Electroencephalograph monitoring of healthy adults exposed to cooking UFPs showed that the ratio of brain slow-wave bands to fast-wave bands (theta/beta ratio) increased during and after exposure (the peak ultrafine particle concentrations were approximately 3 × 10⁵ particle/cm3, and the average level was 1.64 × 10⁵ particle/cm3), similar to early stage AD patients.
As discussed above, exposure to particulate matter due to cooking activity in the indoor environment is a major concern for public health, considering the relevant consequences for the exposed people worldwide. Growing scientific awareness of PM exposure and correlated health effects during the last 10 years was accompanied by the increased development of new and easy-to-prepare sampling and analysis methods. The literature from the last decade presents bulk data on PM size, in correlation to a few sources and/or factors. Nowadays, there is no standard procedure to approach PM studies in different environments, and thus the literature reports different sampling and analysis methods, considers few factors, and shows incomplete physico-chemical data. Moreover, the scientific literature lacks a comprehensive and systematic overview of all PM sources and factors and how they influence all physico-chemical properties of PM. Several questions remain unsolved, such as what type of fuel should be preferred to reduce pollutants, what kind of stove is less harmful for health, and how indoor pollution can be reliably assessed. In particular, the pollutants generated by the cooking activity are a direct consequence of the method used for cooking, the fuel used, and the indoor environment, and moreover those differences should have health consequences.
To understand the risk associated with exposure to fine and UPFs from cooking, this review systematically analyzes the main sources of exposure and the factors influencing physico-chemical properties of the PM, as well as the methods used to collect and analyze pollutants from cooking activity. The review evidence elevated exposure on PM in both the home and work environment where cooking is performed daily. Moreover, we emphasize the need to standardize sampling and analysis protocols, since data are difficult to compare and do not present comprehensive analyses of PM exposure.

2. Methods

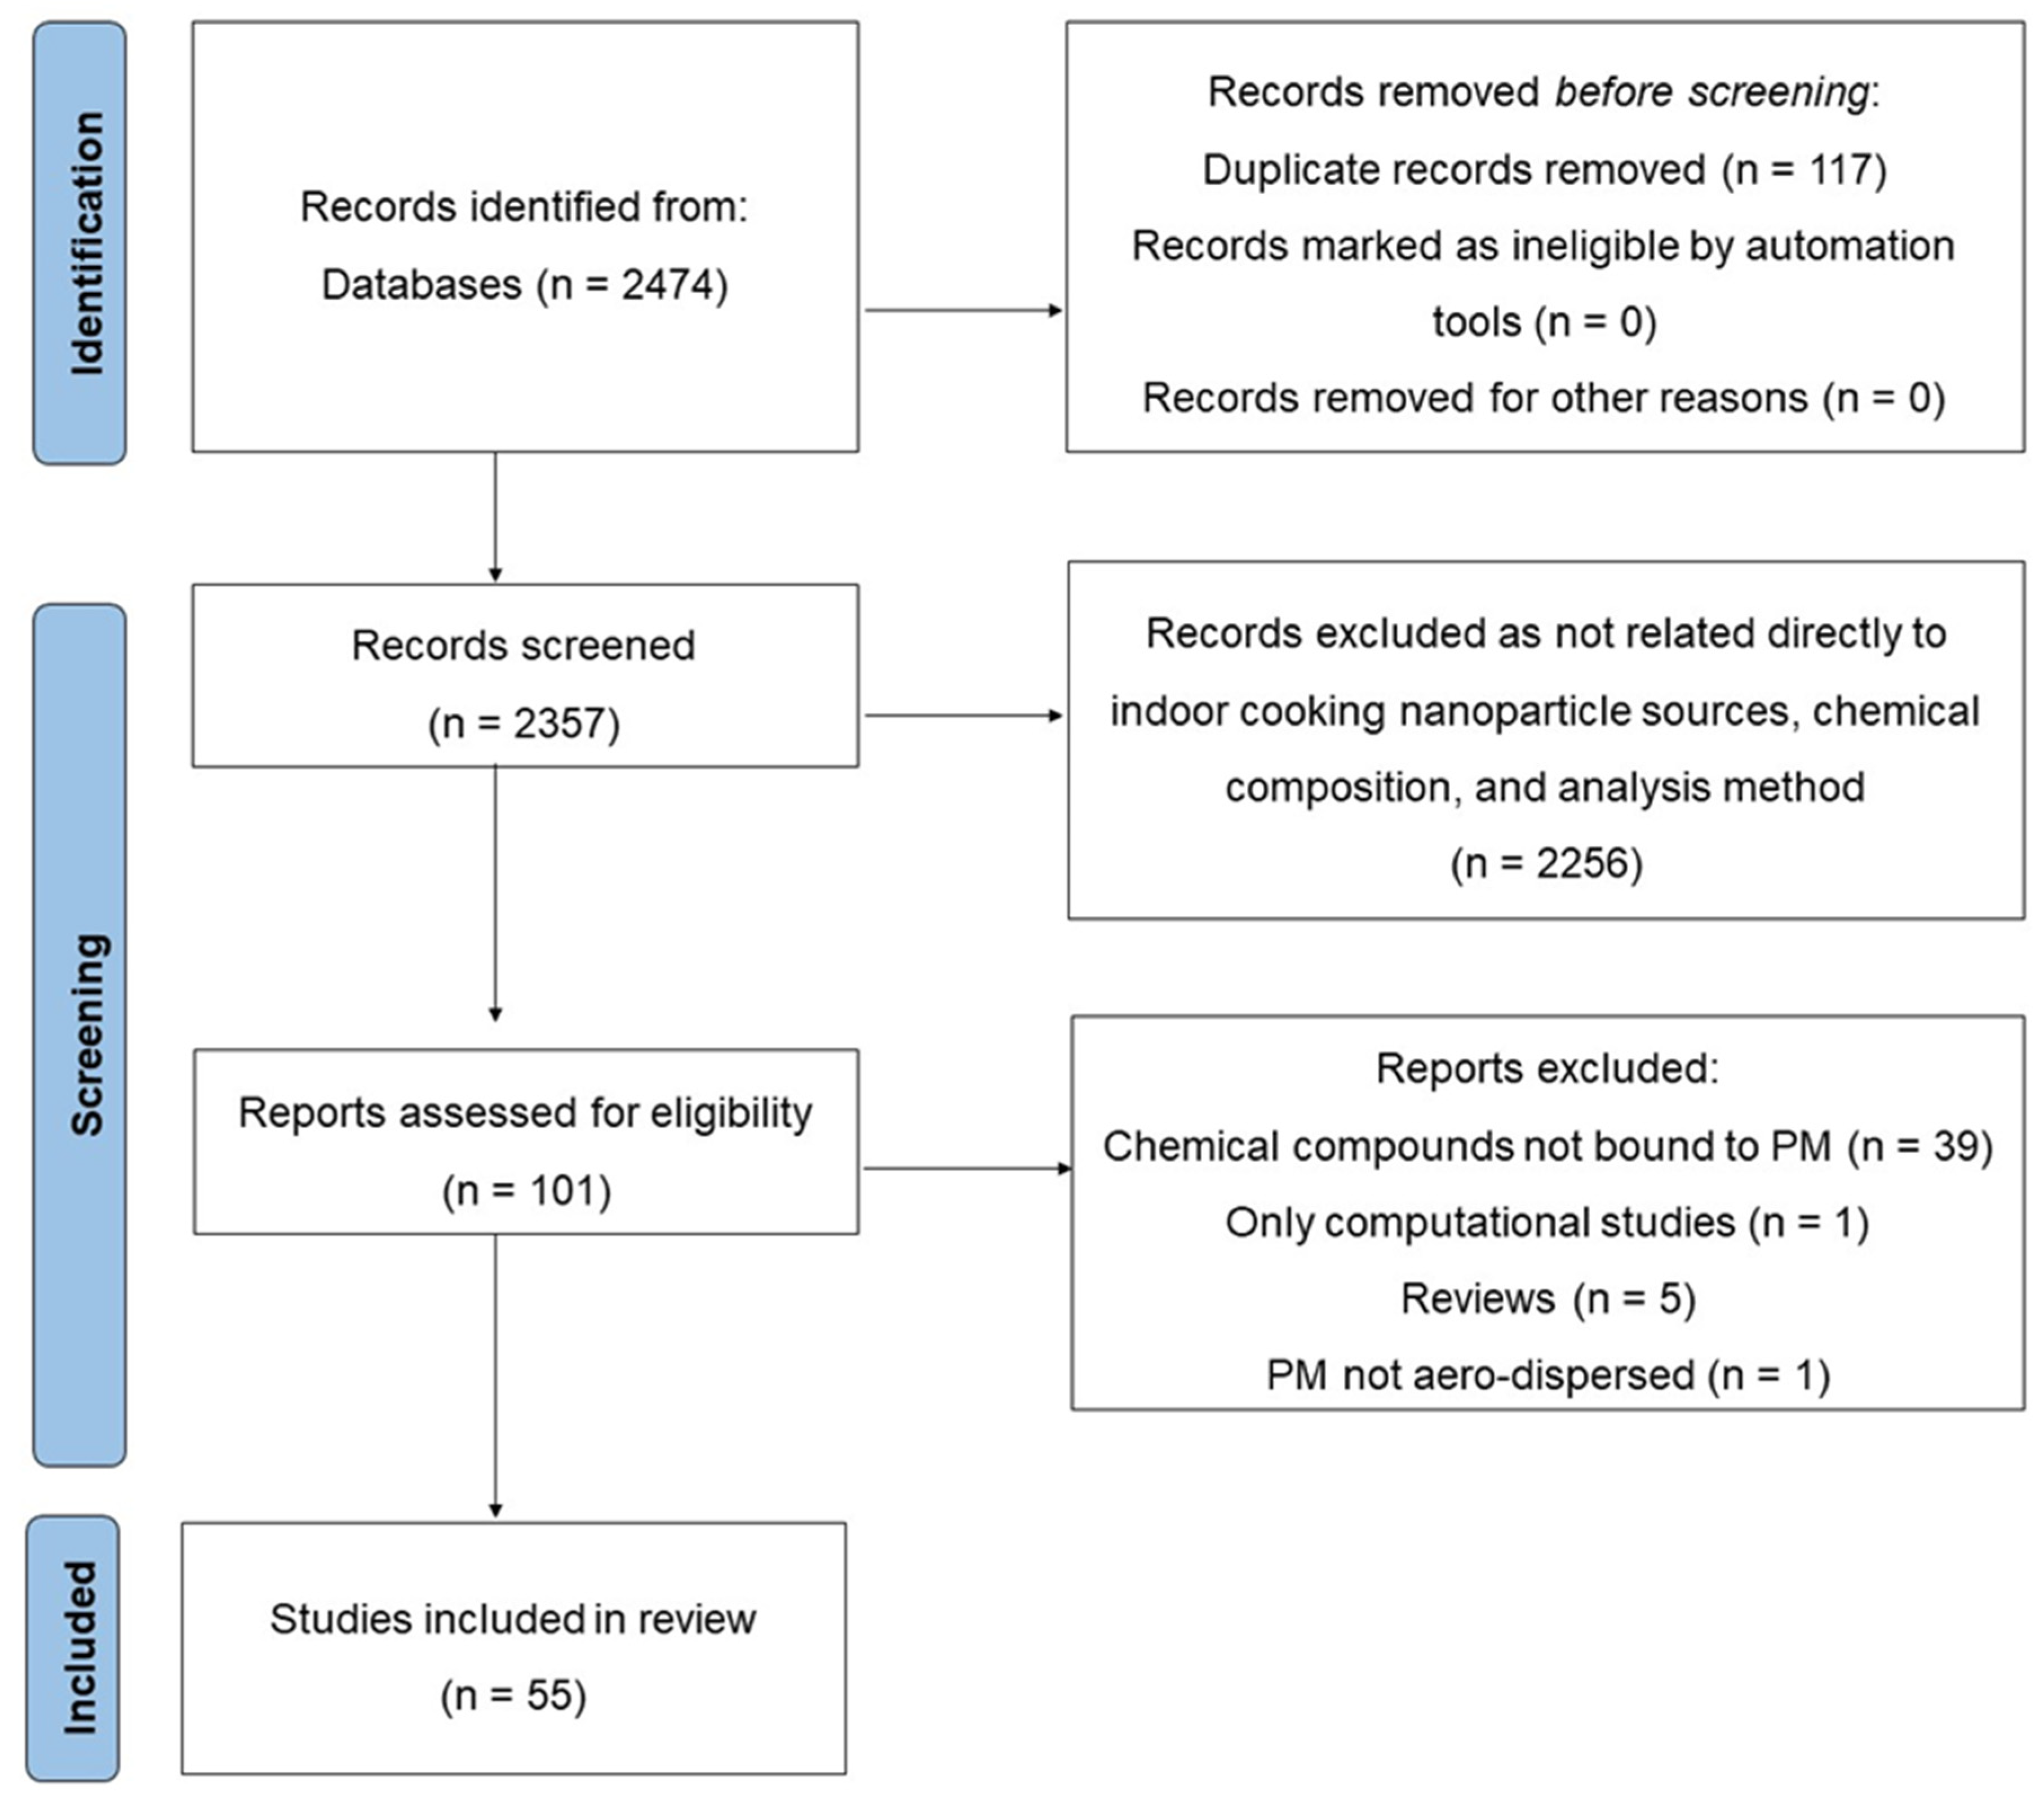
2.1. Search Strategy

This systematic review was prepared according to the PRISMA statement [30,31,32,33,34]. We used PubMed, Scopus, and Web of Science databases for the data search ranging from 1 January 2000 to 1 August 2022 for scientific articles published in English that report and analyze the sources, chemical composition, and analysis methods of particulate matter generated during cooking activities in the indoor environment. Only English-edited studies published in scientific journals in the form of letters to the editor, comments, book chapters, and review articles in the last ten years were included. The review protocol was not registered as PROSPERO, while it accepts systematic review registrations reporting a health-related outcome. Our review protocol and search terms are presented in Supplementary Materials.

2.2. Study Selection

We included any study where particulate matter sources, chemical composition, and analysis methods were the main object of the studies. Moreover, only studies related to cooking environment were included, while those reporting collective indoor particulate matter were excluded. Studies analyzing methods of intervention to lower-particulate-matter generation in the cooking environment were also excluded. Studies were excluded if reporting only health effects under particulate matter exposure.
The study selection was first based on a review of titles and abstracts by J.I.L, S.M., and L.I.L. Papers that met the selection criteria in their title or abstract then had their full text screened to review whether they met the inclusion criteria above. Only peer-reviewed published journal articles and reports were included in this review.

2.3. Data Extraction

Following the PICO strategy for scientific research [35,36,37], we used a specific search string. We combined several search terms belonging to each PICO section (Population: general population, occupationally exposed people; Intervention: cooking activity with the use of stove; Comparison: not exposed people; Outcome: exposure to fine and ultrafine particulate matter). Search terms were combined by means of Boolean operators in different search-term strings, as follows: Population: workers, occupational group, working population, work, job, and job task. Intervention: kitchen, cooking, stove, cook, baking, bake, cookery, galley, gastronomy, cookhouse, fitted kitchen, hob, stovetop, canteen. Outcome: nanoparticles, nanoparticulate, nanoscale, UFP, PM10, PM2.5, particulate matter, fumes, ultrafine, UFPs, steam, smoke, PM0.1. Data were extracted using a pre-established template in Microsoft Excel (SI.1). The key outputs for each paper were extracted by one author (J.I.L.) and included sample size, study location, cooking category (i.e., type of cooking oil used, type of fuel), season, time resolution of monitoring, quality assurance and control protocols, and summary statistics of ambient concentrations. The measurement methodology was also recorded based on analysis methods. The outputs were then validated (by L.I.L.), with any disagreements in outputs resolved through discussion.

3. Results

The final research string (available in the electronic supplementary material) selected 2474 articles, which were successively screened in the title/abstract analysis. Only articles that directly related to occupational and domestic cooking activity were included and considered for a full-text content analysis (articles that considered exposure in childhood were excluded). A full-text content analysis selected 55 of the most relevant articles which met our criteria and were related to the exposure sources, chemical composition, and sampling and analysis. Figure 2 presents a flow diagram of the literature search strategy and the review process following PRISMA 2020 flow diagram rules [38].

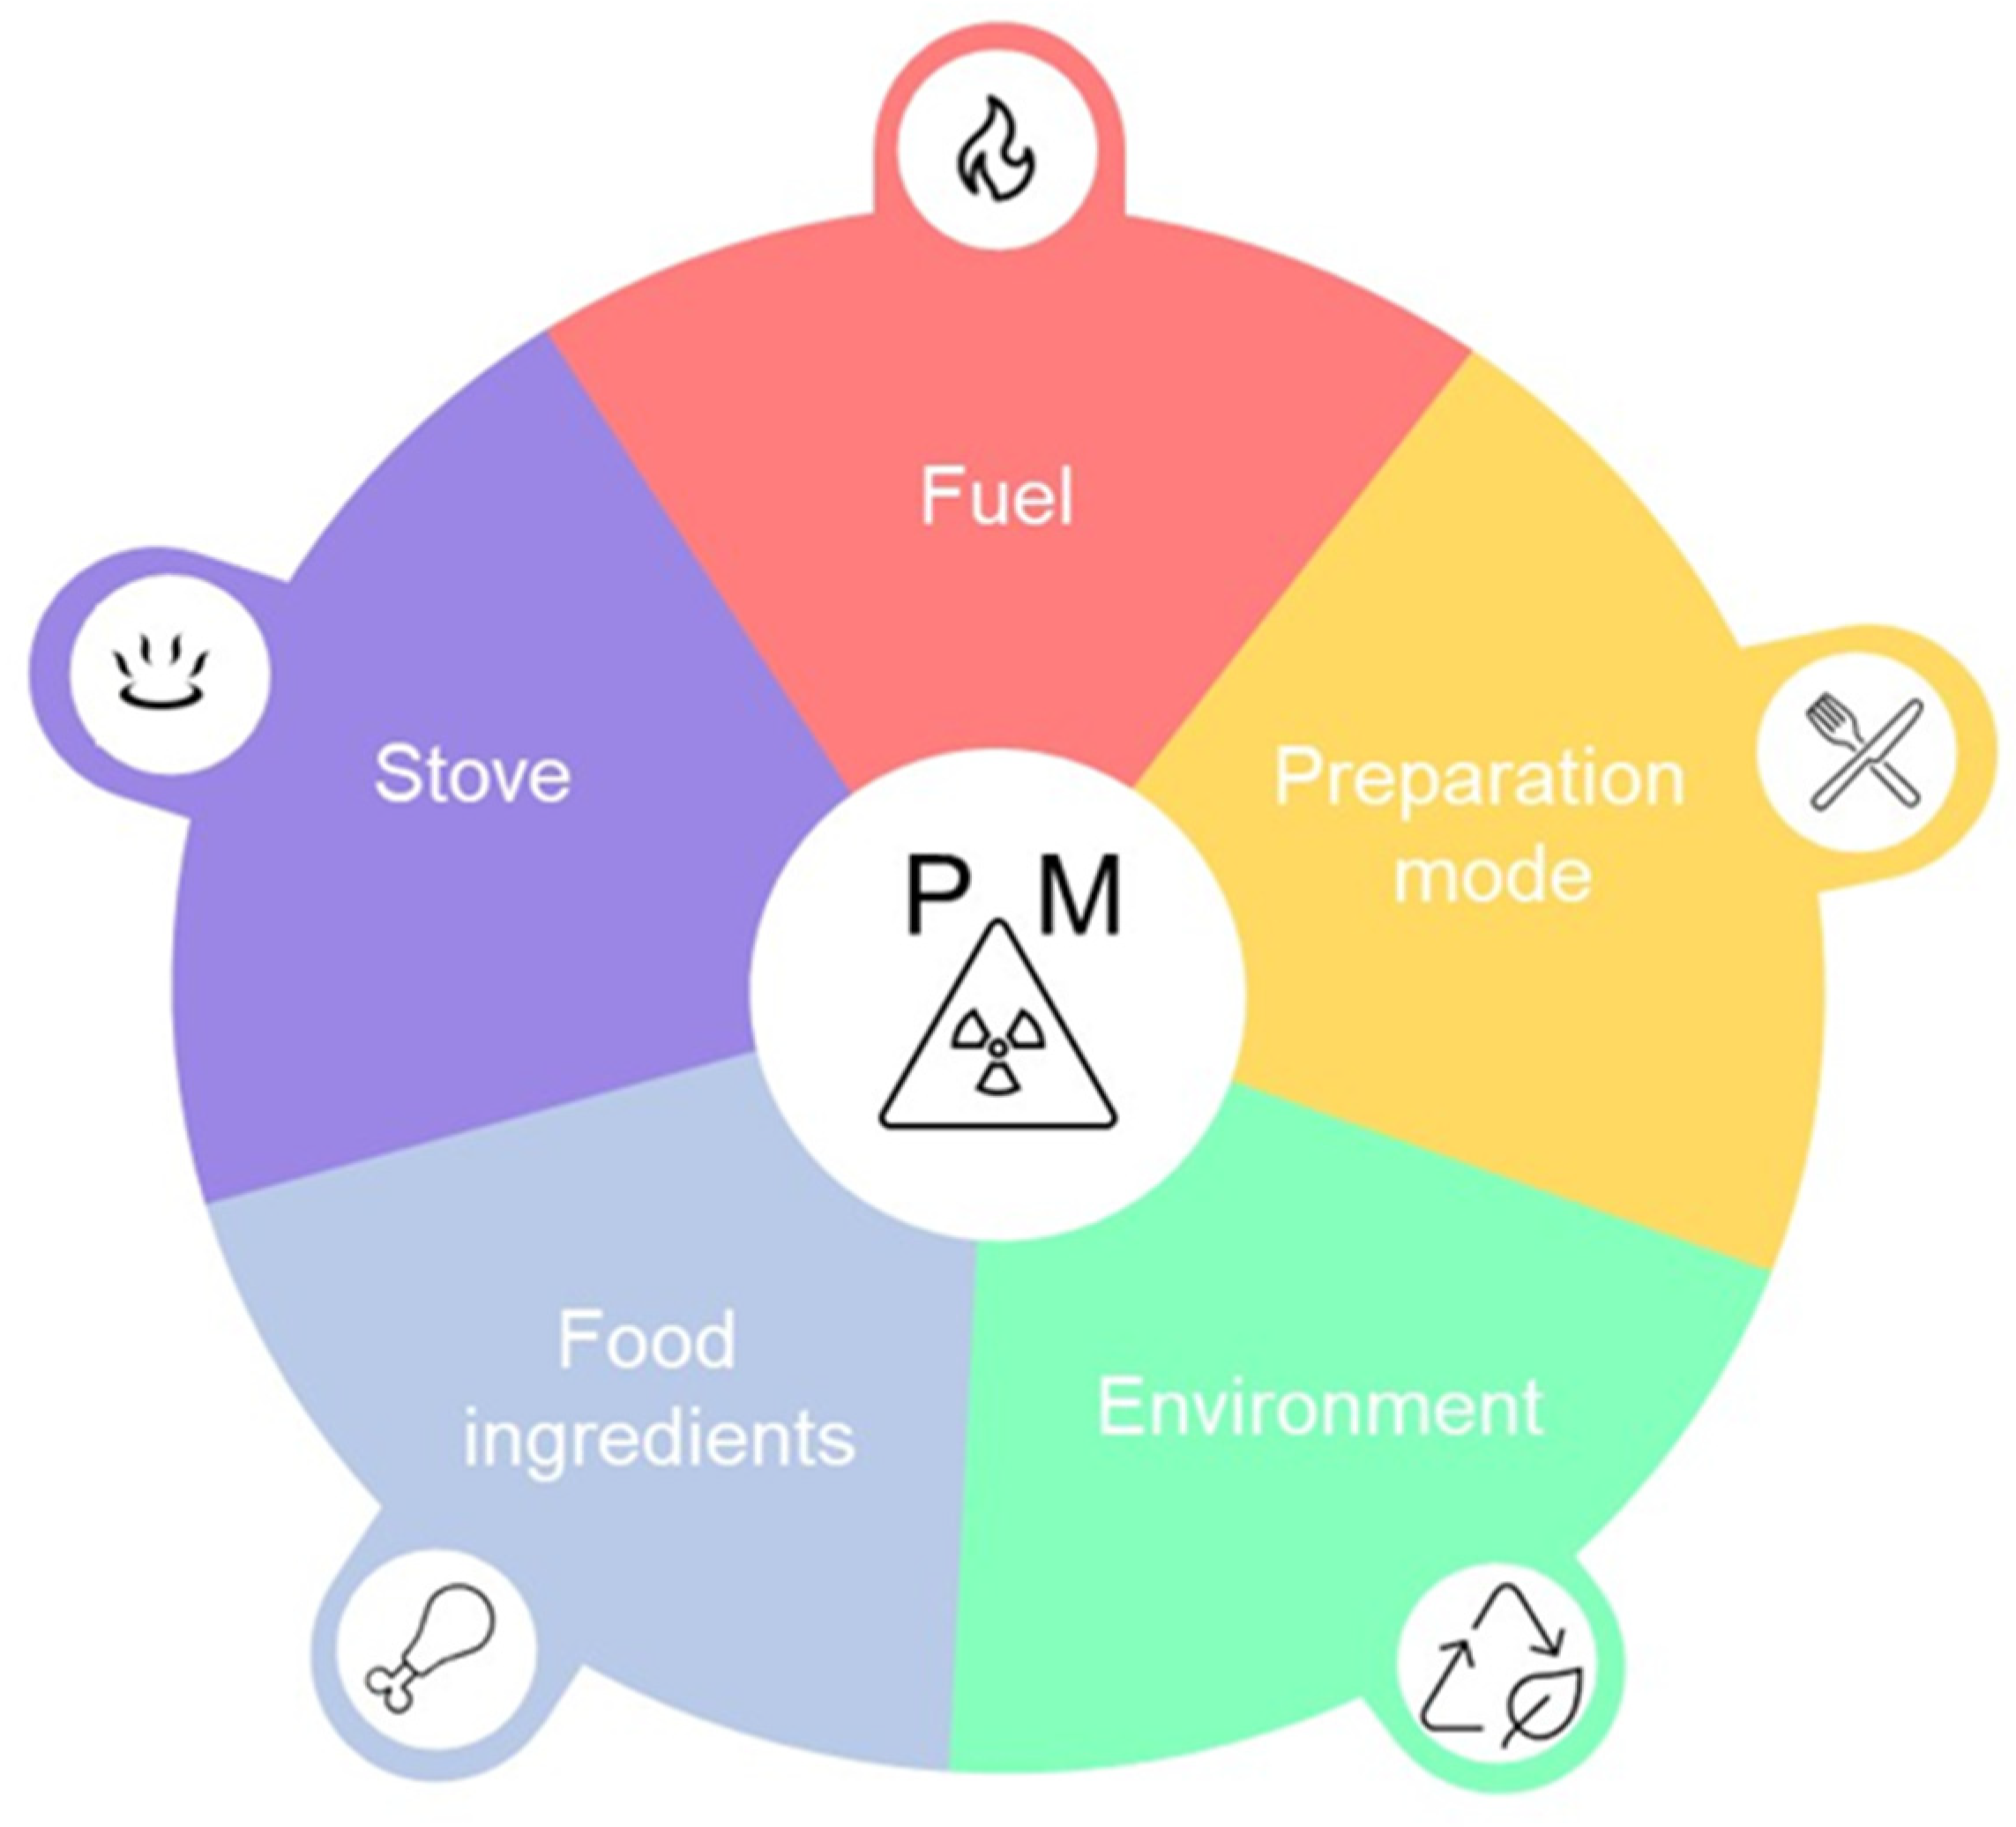
3.1. Exposure Sources and Factors Influencing Particulate Matter Concentration

A summary of the studies focusing on different PM sources and factors influencing the PM characteristics in indoor cooking activities is presented in Table S1, while the complete dataset can be consulted in the Supplementary Table S3.

3.1.1. Type of Kitchen and Fuel as Factors Influencing PM Size and Concentration

The study of Sidhu et al. [39], conducted in 60 rural households in Punjab (India), confirmed that the concentration of indoor environmental pollutants changes with kitchen type, fuel type, and the indoor cooking location. Their analysis of exposure index values showed that cooks using SBF have a four-times higher exposure index than cooks using clean fuel (such as liquefied petroleum gas, LPG). Moreover, SBF users have higher occupational risks than the clean-fuel users. Additionally, studies conducted by James D. Johnston et al. [40] in 19 brick workers’ homes in Nepal showed that fuel type and study location remained significantly associated with mean PM2.5 concentration, where mean PM2.5 concentration in the woodstove household is nearly 10 times higher with respect to the LPG stove households. Of note with the use of a firewood stove is that the ignition mode considerably impacts emissions. As shown by Brandelet et al. [41], most emissions can be reduced when traditional stove ignition with paper is replaced by the top-down ignition mode.
Deepthi et al. [42] showed that there are significant variations of PM10, PM2.5, and PM1 concentrations with varying fuel type and kitchen type in rural households of southern India. The PM concentrations in biomass households were 2.1 times higher compared to biomass/LPG combination, and 3.8 times higher compared to PM concentrations in LPG households. Further, the PM2.5/PM10 ratio was higher during cooking using biomass (0.75) when compared to LPG (0.32). The PM10 and PM2.5 concentrations were higher in indoor enclosed kitchens than in outdoor and open kitchens, due to poor ventilation and lower dispersion area. Moreover, the winter concentrations were 77% and 41% higher compared to monsoon and summer seasons, respectively.
The data of Nayek and Padhy [7] (Table 1) collected in a poor rural area of West Bengal (India) confirm that in winter PM exposure is highest. However, the openness of rural kitchens is the only determining factor, which alone explained about 94% of the fine particulate exposure variability during cooking. An outdoor kitchen location in poor rural areas likely experiences lower exposures to air-dispersed particulate matter, but is not sufficient in areas with high concentrations of outdoor pollutants [43].
A laboratory analysis of 11 fuel–stove combinations by Shen et al. [44] showed that the burning of LPG and alcohol had the lowest PM2.5 mass emissions, UFP number emissions, and fractions of particles smaller than 30 nm (F30) (13−21% for LPG and 35−41% for alcohol). Kerosene has a low emission of PM2.5 and UFP compared to solid fuel burning, but nevertheless has a relatively high F30 value (73−80%). In comparison, the UFP emissions deriving from the combustion of solid fuels (charcoal, rice hulls, wood, and pellets) (∼1014 particles/MJ) are about 1−3 orders higher than the emissions from liquid fuels or gas. In the same stove, the UFP emissions from high-moisture wood are much higher than from low-moisture wood. Other factors influencing UFP emissions are fuel mass and energy, useful energy delivered, and time (emission rate). Emission trends with respect to fuel type correspond to the molecular structure of fuel. For instance, LPG has mostly light hydrocarbons and lacks aromatic compounds, and thus produces less soot. Oxygenated liquid fuels generally burn cleaner than hydrocarbon analogues, given that the oxygen content enables more complete combustion. Nevertheless, in the simple kerosene-fueled cookstove, this advantage is partially decreased by the use of a wick (rather than spray injectors).
The studies of Kumar et al. [15] in 60 household kitchens across the world showed that charcoal fuel increased the average PM2.5 exposure during cooking sessions by 1.3- and 3.1-fold to those observed for kitchens using natural gas and LPG, respectively. In addition, small kitchens (<15 m3), despite using cleaner fuels, showed increased cooking exposure compared with their larger volume counterparts. The studies conducted by Fatmi et al. [45] in rural Pakistan showed that in kitchens using natural gas, the daily average PM2.5 concentrations were substantially higher than in kitchens that used biomass in a chimney stove.

3.1.2. Cooking Conditions as Factors of PM Size and Concentration

Abdullahi et al. reviewed the emission range of particle number and mass concentration with different cooking conditions [46], such as cooking oils, styles, and temperature. Of note, PM2.5 mass concentrations from cooking fumes ranged from 0.4–1.8 mg/m3, and were 4.3 to 20.2 times higher than ambient air [47], while particle number concentrations increased from 1.2–6.2 × 10³ particles/cm3 (background) to 1.4 × 10⁶ particles/cm3 during cooking hours [47].
Of note, there is an inverted correlation between particle size and the time of production. Zhai and Albritton [48] analyzed six cooking oils (vegetable, canola, corn, olive, peanut, and coconut oils) and showed that the concentration of smaller particles begins to plateau and thereafter decreases, while the larger particles simultaneously begin to increase as temperatures near the smoke point. For instance, olive and coconut oils produce PM at the lowest temperature (~150 °C), while peanut and canola oil produce PM at a higher temperature (205–215 °C). Moreover, olive oil and coconut oil did not reach as high a concentration of PM2 emission as the other oils. Different emission trends between oils could be assigned to the inherent chemical composition of tested oils. Oils with a lower quantity of unsaturated fatty acids exhibit less dipole–dipole intermolecular forces, thus leading to the emission of PM at lower temperatures. In addition, unsaturated fats become volatile at low temperatures with respect to saturated fats. Food products containing unsaturated fat produce much higher PM10 and PM2.5 concentrations during cooking [49]. For example, in mackerel, unsaturated fat accounts for 70–80% unsaturated fat, whereas in pork belly it is approximately 50%.
In another study, Shuangde Li et al. [50] analyzed the relationship between particulate mass and number concentration with heating time and particle size, by using four commercial oils (rapeseed, sunflower, soybean, and corn oils). The higher fume emission time was between 400 and 460 s, with the average PM2.5 mass concentration ranging from 4.65–6.19 μg/m3 in the following order: rapeseed > sunflower > soybean > corn oil. However, the order of maximum PM2.5 number concentration was as follows: soybean (7.8 × 10⁵) > corn (7.5 × 10⁵) > rapeseed (6.8 × 10⁵) > sunflower (5.7 × 10⁵). Of note, the mass concentration of PM0.030–0.109 and PM0.109–0.655 accounted for 6.88–10.85% and 31.66–42.80% of PM2.5; however, their concentration accounted for 46.71–59.81% and 30.155–37.12% of PM2.5, respectively.
Torkmahalleh et al. [51] investigated the emission rates from seven commercial cooking oils, including soybean, safflower, canola, and peanut oils, and showed that peanut oils have lower PM2.5 emission fluxes (~105 [μg/(min·m2)]) than corn, coconut, and olive oils (~106 [μg/(min·m2)]) at 197 °C in the laboratory. Cooking type can increase indoor particle concentrations by more than five times, while PM2.5 concentrations could be increased up to 3, 30, and 90 times respective of background during smoking, frying, and grilling, respectively [52]. In household kitchens, frying is generally the most particle-emitting activity during cooking [15]. In 2017, Li et al. [50] monitored the real-time mass and number concentration distribution of fume particles during frying with the use of four different oil types. They reported that the average PM2.5 mass concentration was 4.65–6.19 μg/m3 at the higher fume emission time (between 400 and 460 s). The order of maximum PM2.5 concentration was soybean (7.8 × 10⁵) > corn (7.5 × 10⁵) > rapeseed (6.8 × 10⁵) > sunflower (5.7 × 10⁵).
In 2013, Jørgensen et al. [53] studied the exposure of restaurant employees to PAHs, mutagenic aldehydes, and particles generated during the process of bacon frying. Their results showed that total PAHs were in the range of 270–300 ng/m3 in the air, with the level of particulate PAH higher when frying smoked bacon, compared to fresh bacon. The level of total particles was between 2.2 and 4.2 mg/m3, while the levels of trans, trans-2,4-decadienal were between 34 and 54 μg/m3 in the air. The mobility diameter at peak particle concentration ranged from 74.1 nm (frying fresh bacon on a gas stove) to 153.5 nm (frying bacon on an electric stove). The authors concluded that the cooking method that exposes the cook to the highest level of particles in the ultrafine range does not necessarily cause exposure to the highest levels of total particles, higher aldehydes, or PAHs.
A recent study by Sofuoglu et al. [54] showed that high levels of particulate matter exposure could occur during deep-frying with margarine, which is commonly used in small-scale establishments. While volatile organic compounds (VOCs) and aldehyde concentrations did not increase significantly during deep-frying with margarine, PM10 reached significantly increased levels—1.85- to 6.6-fold background. The average PM2.5 concentration during the monitoring activity ranged between 76 and 249 μg/m3; thus, PM exposures during deep-frying with margarine may cause health effects in chronically exposed cooks.
Preparing and cooking flour products, mainly in bakeries and pizzerias, is a source of significant PM concentration. Work by Karjalainen et al. [55] in a traditional Finnish bakery showed that micrometer- to nanometer-sized particulate matter ranged in concentration from 6.8–145 mg/m3, with medium values exceeding Finland’s 8 hr occupational exposure limit for inhalable flour dust (2 mg/m3).
In a recent study, Wallace et al. [56] hypothesized that UFPs, produced by the electric heating of stoves and empty metal cooking pans, are created from a surface film of semi-volatile organic compounds (SVOCs) absorbed from the surrounding air. Finally, they raised the possibility that a substantial portion of the UFP observed during cooking may arise from the release of SVOCs on the cooking surface, rather than from the cooking oil or food itself. However, further studies are needed to determine whether this is indeed an important contributor to UFP observed during cooking. In addition, both stove-wall and cooking-pot temperatures affect the concentration and size of particles emitted from biomass cooking stoves [57]. In particular, cooking-pot temperatures affect particle size distributions.
Cooking activities that require a longer time, more fuel, and intense heat lead to higher emission rates of PM. For instance, Wangchuk et al. [58] showed that activities related to liquor distillation have higher emission rates for PM2.5 than other cooking activities.
Tryneret al. [59] showed that cookstove operational modes influence aerosol formation and oxidation processes, thus changing the range of PM emissions. For instance, refueling and shut-down events accounted for 29% and 59% of the total mass of PM emitted, respectively, during the experiments.
The concentration of the PM during cooking and food preparation is strongly influenced by the type of ventilation. A proper exhaust hood can significantly reduce personal PM exposure. The correct positioning of cooking appliances assures thermal fume flow within the size of the exhaust hood and the best capturing performance. Thus, heavy-load cooking appliances must be positioned near the center of the cooking appliance line. Cooking appliances must be moved from the end to the middle of the hood, and the gap between the wall and the rear of the appliance must be reduced as much as possible. The front overhang of the hood must also be increased by pushing appliances toward the back. Moreover, adding diverse attachment components (e.g., a separation plate) can increase the capture and containment efficiency of the hood. In addition, the flow field is affected by the oblique angle of the hood’s set-up, and thus increasing the depth and height of the hood can improve ventilation. A detailed discussion of the effects of ventilation on particulate matter and health effects is outside of the focus of this article, and more information can be found in the recent review by Zhao et al. [60].
Table 1. Comparison of PM concentration in different cooking environments and conditions. ND denotes not defined.
LocationUrban or RuralDomestic/RestaurantKitchen TypeStove TypeFuel TypePM Size [µm]Concentration Range (µg/m3)Mean/Median (µg/m3)Reference
India; Fatehgarh Sahib
district located in south-eastern part of Punjab
state and lying between 30°25′00″ and 30°45′45″ N and 76°04′30″ and
76°35′00″ E.
RuralDomesticIndoor kitchen with/out partition; outdoor enclosed kitchen; outdoor open-air kitchen; outdoor semi-open air kitchen.NDAgricultural residue; firewood; biogas; liquefied petroleum gas.2.552.2–25,9491328.28[39]
India; Kishannagar village in Mahbubnagar district of southern Telangana, (17.3850° N, 78.4867° E).RuralDomesticIndoor kitchen with partition; indoor kitchen without partition; separate enclosed kitchen outside the house and open kitchen (meaning open-air cooking).NDBiomass and LPG.1; 2.5; 10 Biomass; Biomass and LPG; LPG, respectively: (PM10) 179.51 ± 21; 101.99 ± 21; 77.48 ± 9; (PM2.5) 102.95 ± 18; 45.77 ± 13; 26.51 ± 5; (PM1) 67.66 ± 12; 32.15 ± 9; 14.47 ± 5.[42]
Australia; BrisbaneUrbanDomesticNDNDNDTwo size ranges: from
0.007 to 0.808 mm (called submicrometer particles for the purpose of this study) and from 0.5 to 20 mm (called supermicrometer particles).
13–735Frying (median peak value: 745), grilling (718).[52]
China; BeijingUrbanDomesticNDGas stovenatural gas.2.5Stir-frying, pan-frying, deep-frying, steaming, and boiling were 680–990, 290–480, 140–240, 40, 80, respectively.ND[61]
BhutanRuralDomesticMainly separately structured kitchen outside the main house.Traditional stoves, built mostly from mud; stone; tripod stove; and the simplest
open fire stove, where firewood can be fed from more than one direction.
Biomass, LPG (1), and electricity (1).2.51.5 × 103–2 × 1051 × 103[58]
India; West
Bengal
RuralDomesticKitchen space with at least a roof, kitchen without any artificial ventilation, or chimney set-up, and cooking occurs on traditional earthen-cook stoves.NDMixed biomass fuels (dung, crop residues, husk, firewood) predominated with cow-dung cake.2.5 974[7]
Burkina Faso; Nouna UrbanDomesticNDThree-stone and charcoal stoves.Wood and charcoal.0.1–1029–26562537[43]
Nepal; Bhaktapur UrbanDomesticNDNDLPG, wood.2.519.37–1384.44118.46[40]
South KoreaNDDomesticNDNDND2.5; 10.0PM2.5: 13.24 (SD 13.54)–96.25 (36.62); PM10: 16.95 (SD 18.76)–127.01 (57.36).ND[49]
China; Lanzhou (36° N; 103°40′ E) UrbanDomesticNDNDND2.5Heating season: 48~279; non-heating: 9~388125 ± 51 (heating season), and 80 ± 67 (non-heating season)[62]
Northern TaiwanUrbanDomesticNDGas stoveGas0.101–10PM10, PM2.5, PM1, and PM0.1 up to around 500, 100, 50, and 5 mg/m3, respectively; PM18: 163 to 2680.ND[63]
Bangladesh; Dhaka, India; Chennai, China; Nanjing, Colombia; Medellín, Brazil; Sao Paulo; Egypt; Cairo, Iraq; Sulaymaniyah, Ethiopia; Addis Ababa, Nigeria; Akure, Malawi; Blantyre, Tanzania; Dar es Salaam, Kenya; Nairobi. UrbanDomesticVariableVariableNatural gas, LPG, charcoal, kerosene, electric, ethanol.2.5; 10.01–16539–254[15]
Honduras; La Esperanza, Department of Intibucá, RuralDomesticVariable30 households with a traditional cookstove and 17 households with just a cookstoveGathered wood, including split logs and sticks, as the primary fuel; burning small sticks of a local wood called ocote (a species of pine) and corncobs to start the fire.2.5; UFP (<0.6)11–1467180[64]
Pakistan; Sindh. RuralDomesticNDTraditional stove using biomass; improved stove using biomass; LPG stove.Biomass, LPG.2.5Biomass: 4.2–4930; LPG (4.2–2580)Biomass: 531; LPG 69.9[45]
USA; San Francisco Bay Area of CaliforniaUrbanDomesticNDGas stove (cooktop, oven bottom burner, and broiler top burner, as available).Natural gas0.006–2.5NDND[65]
India, UdaipurUrban and ruralDomesticSeparated from other rooms.Traditional three-stone cookstove.Biomass (e.g., wood)2.5335–101,9209835[62]
Canada; Halifax and Edmonton UrbanDomesticNDThe cooktop fuel type (78% electric, 22% gas) was in general agreement with the responses from the nationwide Canadian Human Activity Pattern Survey 2 (84% electric, 16% gas).8% electric, 22% gas.2.5NDND[66]
Portugal, Aveiro UrbanDomesticNDGas; electric.Gas, electricity.2.5ND14–30[67]
China; Beilin District (within second ring road area) of Xi’anUrbanRestaurantAll kitchens were separated from the dining areas,
while the kitchen doors were kept open all the time.
Gas stoveNatural gas, except electricity, was used for two Western fast-food restaurants.2.541.5–280139[68]
China; Shanghai UrbanRestaurantNDND 2.5325–693ND[69]
USA; San Francisco Bay AreaUrbanRestaurantNDNDND2.5; <0.0101.5–454 36.3[70]
Northwestern ChinaUrbanRestaurantNDGas and electric stove.Gas or electric.2.5ND41.5–280[68]
Portugal; Aveiro UrbanRestaurantNDGas; electric.Gas; electric.2.5ND27–127[71]
China; Hong KongUrbanRestaurantNDGas and electric stove.Town gas; electric.2.5ND177.4 ± 50.6 to 711.5 ± 222.6[72]
China; west of
Lijiang city in Yunnan, at roughly 2700 m elevation in the Hengduan Mountains (N 2652¢, E10006¢).
RuralDomesticSome kitchens enclosed, while others have windows or 20–50 cm gaps between the wall and ceiling.Stoves consisting of an enclosed combustion chamber with a small sliding metal door for adding fuelwood.Biomass2.5Average personal 24 h PM2.5 exposure among participants ranged from 9 to 492 ug/m3 in summer and 22 to 634 ug/m3 in winter. [73]

3.2. Chemical Composition

Cooking fumes are a source of volatile organic compounds (VOCs), PM, carbonyl compounds, PAHs, and heavy metals [74]. Organic matter (OM) is the predominant component in cooking-emitted PM2.5 [68]. There are over 300 different classes of organic compounds found in cooking fumes, including VOCs [75], airborne carbonyls [76], particle-bounded monocarboxylic acids, dicarboxylic acids, alkanes, esters, and PAHs [61,69]. Black carbon (BC) is a constituent of PM and one of the by-products of the incomplete combustion of carbon-based fuels. Emissions of BC are correlated with other pollutants such as volatile organics, secondary organics, and poly-aromatic hydrocarbon [77]. Importantly, BC acts as a carrier of toxic chemicals of varying toxicity levels [78]. Studies conducted by Saito et al. [79] showed that most PAHs present in cooking fumes are absorbed onto PM, especially particles with aerodynamic equivalent diameters of less than 0.43 μm. In this review, we present data on the chemical composition of particulate matter, and thus only inorganic and organic matter bound and/or absorbed on PM were analyzed.
In 2019, Bilsback et al. [74] analyzed the production of 120 gas- and particle-phase constituents—including organic carbon, EC, UFPs (10−100 nm), inorganic ions, carbohydrates, and volatile/semivolatile organic compounds (e.g., alkanes, alkenes, alkynes, aromatics, carbonyls, and PAHs) produced by 26 stove/fuel combinations during the Firepower Sweep Test (Table S2). On average, organic aerosol constituted the largest fraction of PM2.5 emitted for all stoves, and the emissions ranged from improved wood stoves were 72−81% lower (510−578 mg/MJd), charcoal stoves were 86−87% lower (611−620 mg/MJd), and fossil fuel stoves were >99% lower (709−710 mg/MJd) than with the three-stone fire. On average, the highest inorganic ion emissions came from biomass stoves that were tested with pre-processed fuels (e.g., charcoal and pellets).

3.2.1. Organic Constituents of Particulate Matter

Recently, Xu et al. [68] characterized PM2.5-bound organic compounds and associated potential cancer risks from cooking. Alkanols, alkanes, monocarboxylic acids, dicarboxylic acids, and PAHs were analyzed in the most popular types of restaurants in north-western China. The mean concentration of total quantified organic compounds (ΣPM_O) ranged from 1.1 to 32 × 103 ng/m3, with the highest values in the barbecue-type restaurants. The ΣPM_O accounted for an average of 11% of PM2.5. Hexadecanoic acid (C16) and 1-hexadecanol (C16) were used as tracers of stir-frying and steaming, while 1-undecanol (C11), 9-fluorenone, and indeno [1,2,3-cd] pyrene were markers of grilling and deep-frying. The estimated carcinogenic risks for the restaurants using different oils in high-temperature cooking (e.g., barbecuing and deep-frying) exceeded 2.6–4.2 times the international safety limit.
Among different cooking methods, grilling has the highest temperature and thus generates dominant cooking-fume emissions compared with other food-preparation methods [80]. During the grilling process, the carbohydrates or sugars (including oligosaccharides, disaccharides) present in the food undergo water hydrolysis. Continued heating leads to degradation reactions, where the rings of sugar open up and generate new molecules, i.e., aldehydes and acids [81], which further react with amino acids forming VOCs and/or chain-like molecules.
Aldehyde formation pathways from oils are not well understood. Recent studies by Takhar et al. [82] suggested that gaseous aldehyde emissions are driven by radical-mediated autoxidation reactions, and thus the chemical composition of cooking oils directly influences the reaction. For instance, antioxidants present in canola oil inhibit aldehyde emissions. Overall, antioxidants can suppress peroxy radical formation in oils with more C=C double bonds (canola oil), while oils with fewer C=C double bonds (sunflower and olive oil) can promote aldehyde formation. Katragadda et al. [83] studied the influence of oil types on volatile aldehyde emissions produced from heated cooking oils. They showed that the emission of volatile aldehyde compounds was much higher when using extra virgin olive oil.
Complexed carbon nanostructures (CNs) can be spontaneously formed during high-temperature food processing or baking (200–250 °C) through self-assembling or the polymerization of partially combusted lipids, proteins, and other macromolecules with synthetic food additives. Such complexed nanostructures may lead to potential health risks and/or adverse health effects. A recent study by Al-Hadi et al. [84] identified and characterized nanostructures isolated from bread crusts. Their results showed that bread crusts contain complexed CNs, with moderate toxic effects in the human mesenchymal stem cells at a high dose (400 μg/mL).
The emission of PAHs in cooking fumes depends on the cooking method and the ingredients present in the food (Table 2). In general, cooking meat produces more PAHs than frying vegetables. In meat cooking, palmitic acid, stearic acid, oleic acid, and cholesterol are the most concentrated compounds, next to oxidation products such as nonanal and 2-octadecanone dominant in cooking with seed oils. Pei et al. [69] reported that oleic acid was the most abundant organic species in emissions from Sichuan-style and Italian restaurants, while linoleic acid was demonstrated as a marker for Shanghai-style cuisine.
Additives are widely applied in different cooking methods. Of note, the synergistic and/or additive effect of spices as additives and different cooking methods can lead to the formation of a specific aroma. Thermal processes during cooking catalyze a wide range of complex chemical reactions involving lipid oxidation and pyrolysis reactions, thiamine degradation, proteolysis reactions, the Maillard reaction, and Maillard–lipid interactions [85]. Torkmahalleh et al. [86] studied the effect of additives on PM2.5 and total particle number emissions during the heating of cooking oils. Their results showed that sea-salt addition reduces the PM2.5 concentration by 86–91% and total particle number by 45–53% compared with the control group. Recent results presented by Liu et al. [79] showed that the application of garlic powder, white pepper, mixed spices, and salt significantly reduce the emissions of total particle mass concentration (TPM) during meat grilling by 32.87%, 65.07%, 56.01%, and 47.86%, respectively.
Xu et al. analyzed PM2.5-bound organic compounds, namely alkanols, alkanes, monocarboxylic acids, dicarboxylic acids, and PAHs in the emissions in different cuisine restaurants in China [68] (Table 2 and Table S2). The mean concentration of total quantified organic compounds (ΣPM_O) in different restaurants ranged between 1112 and 32,016 ng/m3, and the highest mean value was observed in the Chinese barbecue restaurants. ΣPM_O accounted for an average of 11% of PM2.5 mass. Cooking, stir-frying, steaming, and boiling produced hexadecanoic acid (C16) and 1-hexadecanol (C16), while 1-undecanol (C11), 9-fluorenone, and indeno [1,2,3-cd]pyrene were produced during grilling and deep-frying, and could be used as potential markers of these processes. Of note, the PAH diagnostic ratios were characteristic of different cuisine types.
In 2022, Fadel et al. [87] (Table 3) published a study focusing on the chemical profiles of PM2.5 generated by a non-road diesel generator, wood burning, and different cooking activities (Table 2 and Table S2). The characterization included the carbonaceous fraction (organic carbon/elemental carbon; OC/EC), water-soluble ions (Table 3), elements, and organic species (in particular n-alkanes, polycyclic aromatic hydrocarbons, carboxylic acids, levoglucosan, dioxins, furans, and dioxin-like polychlorinated biphenyls). Carbonaceous matter was the main component of PM2.5, with a mass contribution to PM2.5 of 49% for cooking activities, 53% for wood burning, 66% for beef grilling, 72% for chicken grilling, and 74% for diesel generator. Importantly, diagnostic ratios and indexes of organic compounds revealed significant differences between the PM2.5 sources. For instance, the water-soluble ions had the highest contribution in the cooking activities and the lowest contribution during the chicken grilling.
The OC/EC ratio is an essential tool to precisely differentiate combustion sources or even meat type. For instance, chicken grilling has a much higher OC/EC ratio (621) than beef grilling (45) due to the difference in fat content. In general, food products with high fat percentages generate higher OC emission rates.
Wood burning emits five times more PAHs than other sources (e.g., charcoal that has more complete combustion). In addition, the volatilization and the pyrolysis of the volatile matter during the production of charcoal, and its low water content, could also lower the content of aromatic compounds. Low PAH concentrations were observed for the different cooking profiles and were mostly generated during grilling activities with coal combustion, in which ashes are rich in 4-ring PAHs with fluoranthene and pyrene (Table 2).
Carboxylic acids were the most abundant organic species of cooking activities, accounting for 24% of the OM mass during general cooking activities, while accounting for 19% in beef grilling and 11% in chicken grilling. During food processing at a high temperature, sugar degradation, pyrolysis of proteins and amino-acids, and the degradation of fats take place. These processes lead to the generation of free fatty acids, glycerol, and glycerides.
Levoglucosan or 1,6-anhydro-β-D-glucopyranose is a molecular marker of biomass burning, while it originates from the pyrolysis of cellulose. It is the most abundant organic molecule during wood burning (17% of the OM mass); thus, the levoglucosan/OC ratio is frequently used to distinguish softwood and hardwood burning.
Alves et al. [67] showed the presence of PAHs and plasticizers bound to PM2.5 generated in domestic kitchens in Aveiro, Portugal. Total concentrations in the kitchens of eight phthalate plasticizers and one non-phthalate plasticizer [bis(2-ethylhexyl) adipate] ranged from 44 to 171 ng/m3, 3 to 12 times more concentrated than in outdoor air. On the contrary, PAH concentrations were much higher in the outdoor environment. Scanning electron microscopy—energy dispersive spectroscopy (SEM-EDS) analysis showed that soot masses are formed by ultrafine aggregates of spherical particles, composed predominantly of carbon, oxygen, and sulfur, which is typical of combustion.
Table 2. Comparison of the most studied organic components of particulate matter in different food preparation conditions.
Compound NameClassificationMax. ConcentrationUnitFood Preparation DescriptionReference
acenaphthenePAHs1.6 ± 1.4ng m−3seven different cuisine types[68]
0.006 ± 0.004mg g−1general cooking activities[87]
2μg g−1poultry cooking and grilling[71]
12.5 ± 13.1ng m−3seven different cuisine types[68]
0.672μg g−1poultry cooking and grilling[71]
0.101ng m−3general cooking activities[67]
anthracene30.5 ± 4.7ng m−3seven different cuisine types[68]
10.5μg g−1poultry cooking and grilling[71]
0.0473ng m−3general cooking activities[67]
benz[a]anthracene0.001 ± 0.000mg g−1sets of duplicate cooking samples were collected using the five most-used types of oil[88]
9.1 ± 11.5ng m−3seven different cuisine types[68]
0.02 ± 0.01mg g−1general cooking activities[87]
20.1ug g−1poultry cooking and grilling[71]
0.194ng m−3general cooking activities[67]
benzo[a]pyrene13.5 ± 8.9ng m−3seven different cuisine types[68]
0.001 ± 0.000mg g−1sets of duplicate cooking samples were collected using the five most-used types of oil[88]
0.009 ± 0.005mg g−1general cooking activities[87]
10.7μg g−1poultry cooking and grilling[71]
0.668ng m−3general cooking activities[67]
benzo[b]fluoranthene18.8 ± 15.3ng m−3seven different cuisine types[68]
0.002 ± 0.000mg g−1sets of duplicate cooking samples were collected using the five most-used types of oil[88]
0.03 ± 0.02mg g−1general cooking activities[87]
20.5μg g−1poultry cooking and grilling[71]
0.83ng m−3general cooking activities[67]
benzo[e]pyrene10.5 ± 6.9ng m−3seven different cuisine types[68]
0.001 ± 0.000mg g−1sets of duplicate cooking samples were collected using the five most-used types of oil[88]
28.5μg g−1poultry cooking and grilling[71]
0.665ng m−3general cooking activities[67]
benzo[g,h,i]perylene0.002 ± 0.001mg g−1sets of duplicate cooking samples were collected using the five most-used types of oil[88]
1.05ng m−3general cooking activities[67]
20.3 ± 17.2ng m−3seven different cuisine types[68]
9.5μg g−1poultry cooking and grilling[71]
benzo[k]fluoranthene5.5 ± 3.2ng m−3seven different cuisine types[68]
0.02 ± 0.01mg g−1general cooking activities[87]
4.75μg g−1poultry cooking and grilling[71]
0.813ng m−3general cooking activities[67]
cholesterollipid; alcohols; sterols; and other compounds with OH group260.8 ± 117.1ng m−3seven different cuisine types[68]
0.979μg g−1poultry cooking and grilling[71]
chrysenePAHs11.1 ± 6.6ng m−3seven different cuisine types[68]
0.001 ± 0.000mg g−1sets of duplicate cooking samples were collected using the five most-used types of oil[88]
0.02 ± 0.01mg g−1general cooking activities[87]
37.9μg g−1poultry cooking and grilling[71]
0.33ng m−3general cooking activities[67]
dibenzo[a,h]anthracene7.6 ± 2.4ng m−3seven different cuisine types[68]
1.34μg g−1poultry cooking and grilling[71]
0.122ng m−3general cooking activities[67]
docosane (n-C22)alcanes0.40 ± 0.14mg g−1general cooking activities[87]
24.8 ± 14.1ng m−3seven different cuisine types[68]
docosanoic acid (C22)carboxylic acids
saturated fatty acids
27.8 ± 12.8mg g−1general cooking activities[87]
137.4 ± 111.5ng m−3seven different cuisine types[68]
dodecanoic acid (C12)4.42 ± 4.18mg g−1general cooking activities[87]
239.4 ± 266.8ng m−3seven different cuisine types[68]
dotriacontane (n-C32)alcanes0.46 ± 0.32mg g−1general cooking activities[87]
11.0 ± 9.2ng m−3seven different cuisine types[68]
eicosanoic acid (C20)carboxylic acids
saturated fatty acids
7.9 ± 2.6mg g−1general cooking activities[87]
172.8 ± 79.8ng m−3seven different cuisine types[68]
fluoranthenePAHs
PAHs
18.5 ± 10.7ng m−3seven different cuisine types[68]
0.005 ± 0.001mg g−1sets of duplicate cooking samples were collected using the five most-used types of oil[88]
0.02 ± 0.01mg g−1general cooking activities[87]
53.2μg g−1poultry cooking and grilling[71]
0.183ng m−3general cooking activities[67]
fluorene8.2 ± 5.4ng m−3seven different cuisine types[68]
0.002 ± 0.000mg g−1sets of duplicate cooking samples were collected using the five most-used types of oil[88]
7.52μg g−1poultry cooking and grilling[71]
0.0219ng m−3general cooking activities[67]
hexacosane (n-C26)alcanes0.39 ± 0.10 mg g−1general cooking activities[87]
15.8 ± 22.6ng m−3seven different cuisine types[68]
hexadecane (n-C16)0.07 ± 0.05mg g−1general cooking activities[87]
2.5 ± 3.8ng m−3seven different cuisine types[68]
98 ± 31 mg g−1general cooking activities[87]
33.6ug g−1poultry cooking and grilling[71]
6731.3 ± 3279.7ng m−3seven different cuisine types[68]
indeno [1,2,3-c,d]pyrenePAHs0.001 ± 0.001mg g−1sets of duplicate cooking samples were collected using the five most-used types of oil[88]
25.3 ± 25.6ng m−3seven different cuisine types[68]
6.45μg g−1poultry cooking and grilling[71]
1.05ng m−3general cooking activities[67]
levoglucosancarbohydrates225.9 ± 115.8ng m−3seven different cuisine types[68]
14.2 ± 20.2mg g−1general cooking activities[87]
linoleic acid (C18:2)unsaturated fatty acids6567.0 ± 5331.2ng m−3seven different cuisine types[68]
37.1 ± 17.2ng m−3seven different cuisine types[68]
naphthalene PAHs18.4 ± 15.5ng m−3seven different cuisine types[68]
767μg g−1poultry cooking and grilling[71]
1.93ng m−3general cooking activities[67]
nonacosane (n-C29)alcanes0.89 ± 0.39mg g−1general cooking activities[87]
26.7 ± 19.4ng m−3seven different cuisine types[68]
nonadecane (n-C19)0.07 ± 0.04mg g−1general cooking activities[87]
8.2 ± 8.2ng m−3seven different cuisine types[68]
octadecane (n-C18)0.06 ± 0.09mg g−1general cooking activities[87]
4.6 ± 5.1ng m−3seven different cuisine types[68]
octadecanoic acid (C18)carboxylic acids
saturated fatty acids
109 ± 48mg g−1general cooking activities[87]
28.5μg g−1poultry cooking and grilling[71]
3386.2 ± 2117.8ng m−3seven different cuisine types[68]
oleic acid (C18:1)unsaturated fatty acids
carboxylic acids
9820.7 ± 6106.8ng m−3seven different cuisine types[68]
11.5μg g−1poultry cooking and grilling[71]
perylenePAHs2.1 ± 2.2ng m−3seven different cuisine types[68]
0.132ug g−1poultry cooking and grilling[71]
0.314ng m−3general cooking activities[67]
phenanthrene16.0 ± 6.0ng m−3seven different cuisine types[68]
0.006 ± 0.001mg g−1sets of duplicate cooking samples were collected using the five most-used types of oil[88]
0.003 ± 0.003mg g−1general cooking activities[87]
63.1μg g−1poultry cooking and grilling[71]
0.0415ng m−3general cooking activities[67]
pyrene31.5 ± 24.1ng m−3seven different cuisine types[68]
0.005 ± 0.002mg g−1sets of duplicate cooking samples were collected using the five most-used types of oil[88]
0.02 ± 0.01mg g−1general cooking activities[87]
40μg g−1poultry cooking and grilling[71]
0.188ng m−3general cooking activities[67]
retene13.4 ± 6.3ng m−3seven different cuisine types[68]
1.56μg g−1poultry cooking and grilling[71]
0.136ng m−3general cooking activities[67]
stigmasterollipid, alcohols, sterols, and other compounds with OH group279.8 ± 181.1ng m−3seven different cuisine types[68]
0.206μg g−1poultry cooking and grilling[71]
tetracosane (n-C24)alcanes0.72 ± 0.13mg g−1general cooking activities[87]
30.6 ± 13.1ng m−3seven different cuisine types[68]
tetracosanoic acid (C24)carboxylic acids,
saturated fatty acids
4.9 ± 4.2mg g−1general cooking activities[87]
62.5 ± 46.6ng m−3seven different cuisine types[68]
tetradecanoic acid (C14)carboxylic acids, saturated fatty acids5.65 ± 3.87mg g−1general cooking activities[87]
8.95μg g−1poultry cooking and grilling[71]
770.3 ± 683.6ng m−3seven different cuisine types[68]
triacontane (n-C30)alcanes0.26 ± 0.09mg g−1general cooking activities[87]
10.3 ± 8.0ng m−3seven different cuisine types[68]
tricosane (n-C23)0.65 ± 0.40mg g−1general cooking activities[87]
28.5 ± 21.5ng m−3seven different cuisine types[68]
β-sitosterollipid, alcohols, sterols, and other compounds with OH group803.2 ± 398.1ng m−3seven different cuisine types[68]
0.367μg g−1poultry cooking and grilling[71]

3.2.2. Inorganic Constituents of Particulate Matter

Water-soluble ions have the highest share of PM2.5 in general cooking activities (17%), accounting for more than 85% of the ionic mass of sulfate, nitrate, and ammonium ions.
The recent studies of Zhou et al. [89] confirmed that indoor cooking and smoking were the main sources of Cd, Cr, Mn, Ni, Pb, Sb, V, and Zn, as well as stable carbon isotopes in indoor dust.
PM2.5-bound heavy metals were analyzed by Dai et al. [76] in restaurant kitchens creating different cuisines in north-western China during December 2011 to January 2012 (namely, Szechuan hotpot, Hunan, Shaanxi noodle, Chinese barbecue, Chinese vegetarian, Korean barbecue, Italian, and Indian). Pb was the most abundant element in all restaurants (>60%), followed by Hg (~20%), Cr, Ni, and Co. Cd was detected in the samples collected in the Indian restaurant, while no As or Se were detectable in all restaurants. There was no significant difference in the metal concentrations, mass per capita, or elemental compositions among the four restaurants. Higher Ni concentrations and compositions were found in the smoking dining units (i.e., Hunan and Chinese barbecue restaurants), most probably due to the Ni presence in the stainless-steel kitchen utensils and cookware. Other anthropogenic factors, e.g., cooking fuels, could contribute to the emissions of the metallic elements such as Hg [90]. However, no additional chemical tests (e.g., flame or emission tests and coating examinations) have been conducted on both cookware or fuels due to study limitations in a real-world environment.
In 2013, Taner et al. [91] studied the metal content in cooking fumes in 14 restaurants in Kocaeli (the second largest city in Turkey). All of the metal contents (except for Mn) were higher for fine particles (PM2.5) than coarse particles (PM > 2.5), and V, Se, Zn, Cr, As, Cu, Ni, and Pb were the major trace elements identified in the PM2.5. Of note, the Se, As, Cd, and V contents were highly enriched (enrichment factor; EF > 100). Charcoal combustion, indoor activities, crustal components, and road dust were the main factors determining the sources of PM2.5. Overall, the PM2.5 total hazard quotient was 4.09, which is four times greater than the acceptable limit (i.e., 1.0). In addition, the PM2.5 excess lifetime cancer risk was 1.57 × 10⁻⁴, which is higher than the acceptable limit of 1.0 × 10⁻⁶. Among all the carcinogenic elements present in the PM2.5, the cancer risks resulting from Cr and As exposure were the highest (i.e., 1.16 × 10⁻⁴ and 3.89 × 10⁻⁵, respectively).
The complete qualitative analysis of organic and inorganic compounds bound to PM generated during indoor cooking activities is presented in Table S2. Moreover, the sampling and analysis methods are briefly described. Of note, the concentration of the organic and inorganic compounds is quantified in relation to the air-sampling volume or to the mass of particulate matter. The lack of standards in the quantification method prevent direct data comparison.
Table 3. Comparison of the most studied inorganic components of particulate matter in different food preparation conditions.
Compound NameMax. ConcentrationUnitFood Preparation DescriptionReference
Aluminum16.7 ± 5.9mg g−1general cooking activities[87]
Ammonium ion35.0 ± 18.7mg g−1general cooking activities[87]
Antimony0.02 ± 0.01mg g−1general cooking activities[87]
Arsenic0.006 ± 0.001mg g−1sets of duplicate cooking samples were collected using the five most-used types of oil[88]
Arsenic0.006 ± 0.001mg g−1general cooking activities[87]
Bismuth0.002 ± 0.001mg g−1general cooking activities[87]
Cadmium0.001 ± 0.000mg g−1sets of duplicate cooking samples were collected using the five most-used types of oil[88]
0.002 ± 0.001mg g−1general cooking activities[87]
0.004μg m−3general cooking activities[92]
Calcium1.9 ± 1.0mg g−1sets of duplicate cooking samples were collected using the five most-used types of oil[88]
43.8 ± 39.34mg g−1general cooking activities[87]
Calcium ion31.8 ± 15mg g−1general cooking activities[87]
Cerium0.03 ± 0.02mg g−1general cooking activities[87]
Chloride0.25 ± 0.08mg g−1sets of duplicate cooking samples were collected using the five most-used types of oil[88]
Chloride ion12.1mg g−1general cooking activities[87]
Cobalt0.007 ± 0.006mg g−1general cooking activities[87]
Copper0.014 ± 0.006mg g−1sets of duplicate cooking samples were collected using the five most-used types of oil[88]
0.10 ± 0.06mg g−1general cooking activities[87]
0.188μg m−3general cooking activities[92]
Chromium0.064 ± 0.019mg g−1sets of duplicate cooking samples were collected using the five most-used types of oil[88]
0.092μg m−3general cooking activities[92]
Iron1.1 ± 0.1mg g−1sets of duplicate cooking samples were collected using the five most-used types of oil[88]
7.56 ± 4.16mg g−1general cooking activities[87]
9.82μg m−3general cooking activities[92]
Lanthanum0.016 ± 0.008mg g−1general cooking activities[87]
Lead0.016 ± 0.005mg g−1sets of duplicate cooking samples were collected using the five most-used types of oil[88]
0.55 ± 0.11mg g−1general cooking activities[87]
0.052μg m−3general cooking activities[92]
Magnesium0.76 ± 0.30mg g−1sets of duplicate cooking samples were collected using the five most-used types of oil[88]
3.71 ± 1.20mg g−1general cooking activities[87]
Magnesium ion0.9 ± 0.2mg g−1general cooking activities[87]
Manganese0.013 ± 0.005mg g−1sets of duplicate cooking samples were collected using the five most-used types of oil[88]
0.13 ± 0.06mg g−1general cooking activities[87]
Nickel0.006 ± 0.002mg g−1sets of duplicate cooking samples were collected using the five most-used types of oil[88]
0.30 ± 0.20mg g−1general cooking activities[87]
Niobium0.009 ± 0.004mg g−1general cooking activities[87]
Nitrate1.6 ± 0.0mg g−1sets of duplicate cooking samples were collected using the five most-used types of oil[88]
22.2 ± 1.8mg g−1general cooking activities[87]
Phosphate0.83 ± 0.16mg g−1general cooking activities[87]
Phosphorous0.16 ± 0.02mg g−1sets of duplicate cooking samples were collected using the five most-used types of oil[88]
Potassium1.1 ± 0.0mg g−1sets of duplicate cooking samples were collected using the five most-used types of oil[88]
17mg g−1general cooking activities[87]
Potassium ion3.1 ± 0.8mg g−1general cooking activities[87]
Rubidium0.007 ± 0.003mg g−1general cooking activities[87]
Silver0.17 ± 0.11mg g−1general cooking activities[87]
Sodium2.0 ± 1.0mg g−1sets of duplicate cooking samples were collected using the five most-used types of oil[88]
13.5 ± 4.3mg g−1general cooking activities[87]
Sodium ion2.8 ± 1.2mg g−1general cooking activities[87]
Strontium0.11 ± 0.07mg g−1general cooking activities[87]
Sulfate1.8 ± 1.0mg g−1sets of duplicate cooking samples were collected using the five most-used types of oil [88]
41.8 ± 19.5mg g−1general cooking activities[87]
Sulfate ion109 ± 58mg g−1general cooking activities[87]
Titanium1.05 ± 0.60mg g−1general cooking activities[87]
Vanadium0.24 ± 0.17mg g−1general cooking activities[87]
Zinc0.14 ± 0.06mg g−1sets of duplicate cooking samples were collected using the five most-used types of oil[88]
10.296μg m−3general cooking activities[92]
1.05 ± 0.57mg g−1general cooking activities[87]

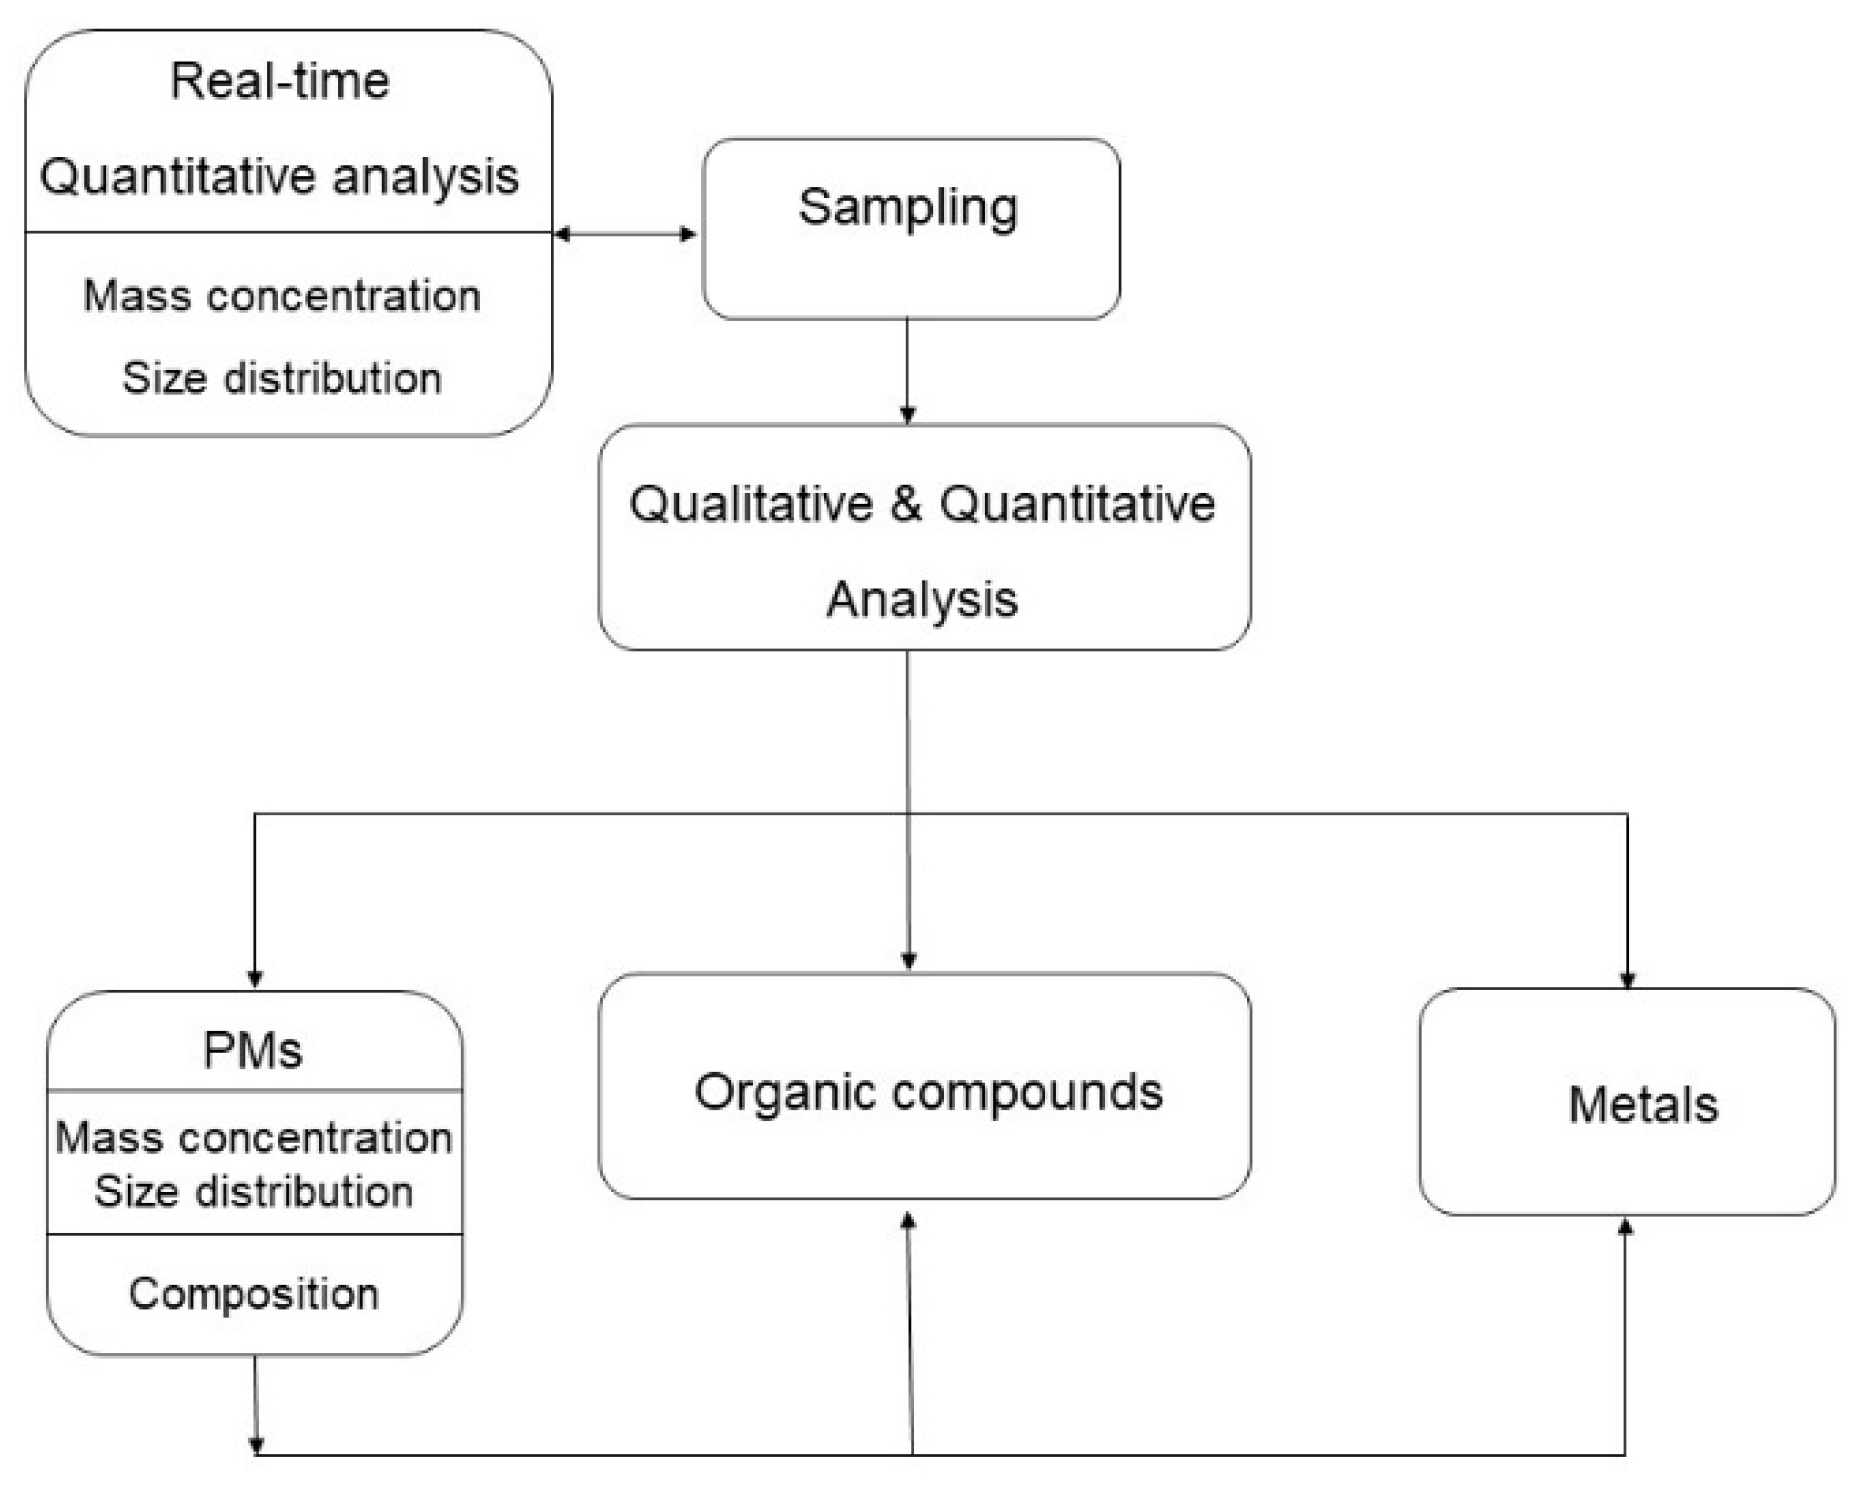
3.3. Sampling and Analysis

Household pollutant measurements that are time-weighted averages (TWAs for 8 or 24 h) underestimate rather than reflect properly personal exposure [73], because cooking activities are not spread across 8 or 24 h. Thus, it is better to measure personal exposures during the cooking period directly.
The investigation of air quality in the cooking area comprises qualitative and quantitative analysis of gases, vapors, and PM (Figure 3). The analysis can be made directly in the moment (e.g., particle mass concentration measurement) or samples need to be collected (e.g., with the use of filters) and then analyzed in the laboratory later (e.g., gas chromatography analysis of volatile organic compounds) (Figure 2, Table S2).
The PM emission characteristics (mass concentration and size distribution) can be measured in real-time by a DustTrak DRX aerosol monitor [73]. For instance, the TSI Model 8533 DustTrak-DRX aerosol monitor (St. Paul, MN, USA) has PM1.0, PM2.5, PM4.0, PM10, and total particle mass concentration inlets. However, the DustTrak aerosol monitor captures only a limited portion of PM mass concentration [51].
Recently, Deepthi et al. [42] characterized PM concentrations in varied fuel-kitchen set-ups followed by an estimation of respiratory dosage with the use of a 16-channel optical particle counter (Model 1.108, with a semiconductor laser as the light source, Grimm Labortechnik Ltd., Ainring, Germany). This counted both the number and mass distribution of particles ranging from 300 nm to 20 μm using light-scattering technology (single particle count).
In the studies of Baumgartner [73], which determined the emission of PM and VOCs during meat grilling in the presence of different additives, a JCH-2400 dual-channel constant current air sampler (Qingdao Juchuang Environmental Protection Group Co, Ltd., Qingdao, China) was applied to sample carbonyl compounds. The PM mass concentration and size distribution emitted from the grilled meat were analyzed using the light-scattering method [93]. The PM mass concentration and the size distribution of PM1.0, PM2.5, PM4.0, and PM10, as well as the total concentration, were measured using a DustTrak Aerosol Monitor (8533, TSI, St. Paul, MN, USA) equipped with an electrostatic prevention hose. The electrostatic prevention hose was installed at the sampling site to monitor the PM concentration.
The electrical low-pressure impactor (ELPI) is widely used for size distribution and density measurements of fine aerosol from wood combustion sources, urban/rural air, pharmaceutical aerosols, or motor vehicle exhaust emissions (Coudray et al., 2009; Glover and Chan, 2004; Held et al., 2008; Maricq et al., 2000). ELPI has a unique advantage to count particulate matter ranging from the nanoscale to microscale in real-time and collect PM on filters, which can be used for further qualitative and quantitative analysis. The particles pass through a unipolar corona charger, where particle surfaces are saturated with positive charges according to their Stokes diameters. Successively, the particles are impacted in different stages in relation to their inertia and aerodynamic diameters. Finally, the measured current values are recalculated into particle number concentrations. Mass concentration represents the total mass of all particles in each size range. Due to the dependence of the particle-charging efficiency on the Stokes diameter, the particle density must be provided.
Alternatively, PM mass concentration can be obtained using the gravimetric analysis and weighing the filters before and after the sampling. Prior to weighing, all filters must be equilibrated in a chamber at a temperature of 20–23 °C and relative humidity of 30–35% for at least 24 h [68].
Qualitative and quantitative analysis of PM-bound organic compounds such as alkanes (n-alkanes and branched alkanes), PAHs, organic acids (i.e., mono- and dicarboxylic acids), alkanols, and sugars can be made on quartz-fiber filters with solvent extraction–gas chromatography–mass spectrometry (SE-GC/MS) [68] or with the use of thermal extraction–gas chromatography−mass spectrometry (TEx-GC−MS) (e.g., the Gerstel TDSA2/TDS/Agilent 6890/5973 MS system). The TEx-GC−MS equipment and methodology have been described extensively elsewhere [94]. The morphology and aggregate formation propensity of UFP and PM can be investigated using electronic microscopy, namely SEM and transmission electron microscopy (TEM). The metal content of PM and UFP can be analyzed using X-rays (i.e., electron microscopy with X-ray probe) or inductively coupled plasma (ICP; namely ICP-OES or ICP-MS), but the latter requires a metal-content transfer from the filter into the solution before analysis.
Gaseous CO, CO2, and CH4 can be measured continuously using infrared and flame ionization detector analyzers (e.g., models 200, 300-HFID, and 300M-HFID, California Analytical; Orange, CA) [95]. The gas analyzers must be calibrated daily with zero and span checks before and after the measurements. At the same time, PM2.5 can be sampled isokinetically on quartz-fiber (Qf) and polytetrafluoroethylene (PTFE) membrane filters positioned in a parallel downstream of PM2.5 cyclones (University Research Glassware; Chapel Hill, NC). A second quartz filter can be placed downstream of the PTFE filter, in order to estimate the positive artifacts due to gas-phase adsorption of semi-volatile organics.
The correlation of cooking with general indoor dust can be studied using δ13C analysis [89]. Samples for δ13C analysis must be wrapped in tin cups, then an elemental analyzer–stable isotope mass spectrometer (e.g., Vario ISOPOTE Cube-Isoprime, Elementar) can be used for the determination of δ13C values in each sample.
Tests of cookstove emissions and thermal efficiency can be conducted using the water boiling test (WBT) protocol [96]. The test protocol includes three phases: a cold-start high-power phase, a hot-start high-power phase, and a low-power simmer phase, in that order. Filter sampling and real-time/online measurements must be conducted for each phase of the protocol.

4. Discussion

This systematic review highlights the growing interest in risks from particulate matter in the cooking environment. Despite this, data in the literature are still incomplete.
Among 55 analyzed studies, 18 experiments were conducted in laboratories, focusing on a few controlled PM sources. Thirty-seven studies occurred in the real cooking environment (twenty-three of which were in urban areas), and therefore were influenced by numerous factors (Figure 1) not considered in detail. Of note, a few studies conducted an outdoor PM analysis and reported the indoor baseline PM. Most of the ambient studies were conducted in Asia (16 studies), America, and Africa, while a few were conducted in Europe. The ambient studies were prevalently conducted in domestic conditions (22 studies).
Each study used a different sample number and time of sampling. The dimensions of the measured particulate matter ranged from nanometric (PM0.006) to micrometric (PM10), with a prevalence of micrometric PM (PM1.0, PM2.5, and PM10). Only eleven studies collected particulate matter to analyze chemical–physical properties, among which one study analyzed only inorganic components, while six studies exclusively analyzed organic matter. There were few electron microscopy studies of the PM morphology that could significantly influence the PM-related toxicity [97].
Table 1 shows a wide range of different sized PM concentrations; however, it is not possible to correlate the concentration to the exact factor, as each study was prepared in different experimental conditions. Furthermore, comparative analysis of PM chemical composition (Table 2 and Table 3) fails, as the available data are reported in different units referring to the mass of PM or sampled air volume.
Besides different experimental conditions among selected studies, general assumptions can be defined. Biomass fuel generates a higher PM concentration than clean fuel, for instance, LPG or ethanol. The overall PM generation related to cooking activities is higher during the winter, due to reduced natural ventilation (e.g., closed windows and doors). The time of cooking and temperature used for food processing are positively correlated with the PM concentration. The food ingredients and additives, as well as food processing type (e.g., boiling, steaming, smoking, frying, and grilling), not only influence PM concentration, but also chemical composition and morphology.
This systematic review shows that cooking generates significant quantities of PM, which has both organic and inorganic toxic constituents. The high variability of experimental protocols prevents exhaustive analysis of the main sources and factors determining PM size, concentration, and physico-chemical properties. Moreover, it is not clear whether different factors have additive or even synergistic effects on PM quantity and quality.
The data here indicate which sources and factors need to be considered during PM monitoring, how and for how long the samples should be collected, and the best practices for qualitative and quantitative PM analysis.

5. Limitations

This review has some limitations. The experimental data in the selected studies vary significantly, with different locations, methodologies, and exposure durations. Moreover, the selected studies focus on different PM sources and factors influencing PM generation. Any of the selected studies took all variables into experimental consideration.
We only used three electronic databases and included studies published in English. However, we believe we have covered the majority of high-quality studies on PM sources, chemical composition, and the best analytical techniques for sampling and chemical–physical analysis.
Quality assessment of the selected papers was based on subjective criteria and considered specific review criteria.

6. Conclusions

Most food preparation activities require fuel combustion, thus generating RSPM. Indoor environmental pollutants change with kitchen type, fuel type, and the indoor cooking location. Carbon monoxide, particulate matter (<2.5μm), black carbon, and UFPs are the main products of incomplete combustion. HAP from cooking with incomplete combustion contains health-damaging pollutants. These pollutants include metals (e.g., Cd, Cr, Mn, Ni, Pb, Sb, V, and Zn) and volatile organic compounds, mainly PAHs, which are absorbed and actively transported by RSPM. The exposure to particulate matter from cooking in the indoor environment is a major concern for worldwide public health. Investigations of air quality in the cooking area comprise qualitative and quantitative analyses of gases, vapors, and PM. Analyses can be made at the moment in real-time, or by sample collection and later laboratory experimentation.
This review provides evidence of the significant PM generation during cooking activities, and the presence of harmful organic and inorganic constituents of PM. The data available nowadays on the PM sources and factors influencing the physico-chemical properties of PM are incomplete, and do not permit data comparison among different studies. There is an urgent need to unify PM analysis protocols for better risk assessment in the future. The presented findings here could be used when choosing the best and exhaustive protocols for PM sampling and analysis.

Supplementary Materials

The following supporting information can be downloaded at: https://www.mdpi.com/article/10.3390/atmos14010012/s1, the file Supplementary Material.docx contains the research string; List of ambient and laboratory studies analysing stove and fuel type as the main sources of particulate matter (Table S1); List of organic and inorganic compounds bound to particulate matter generated during indoor cooking activities (Table S2). Supplementary Table S3.xlsx contains a complete set of data gather during the systematic data analysis and used for the final data analysis.

Author Contributions

Conceptualization, J.I.L. and M.C.; methodology, L.I.L.; validation, S.M., L.I.L. and M.C.; data curation, J.I.L. and S.M.; writing—original draft preparation, J.I.L.; writing—review and editing, J.I.L., S.M., M.J., E.O., E.C., L.C. and G.M.; supervision, M.C.; All authors have read and agreed to the published version of the manuscript.

Funding

This research received no external funding.

Conflicts of Interest

The authors declare no conflict of interest.

Abbreviations

BC black carbon; EC elemental carbon; ELPI electrical low-pressure impactor; F30 fractions of particles smaller than 30 nm; HAP household air pollution; LPG liquefied petroleum gas; OC organic carbon; OM organic matter; PAHs polycyclic aromatic hydrocarbons; PM particulate matter; RSPM respirable suspended particulate matter; SBFs solid biofuels; SEM-EDS scanning electron microscopy—energy dispersive spectroscopy; TEM transmission electron microscopy; UFP ultrafine particles; VOCs volatile organic compounds; WBT water boiling test.

References

  1. Zhang, J.; Smith, K.R. Indoor air pollution: A global health concern. Br. Med. Bull. 2003, 68, 209–225. [Google Scholar] [CrossRef] [PubMed] [Green Version]
  2. Lozano, R.; Naghavi, M.; Foreman, K.; Lim, S.; Shibuya, K.; Aboyans, V.; Abraham, J.; Adair, T.; Aggarwal, R.; Ahn, S.Y. Global and regional mortality from 235 causes of death for 20 age groups in 1990 and 2010: A systematic analysis for the Global Burden of Disease Study 2010. Lancet 2012, 380, 2095–2128. [Google Scholar] [CrossRef] [PubMed]
  3. Xing, Y.-F.; Xu, Y.-H.; Shi, M.-H.; Lian, Y.-X. The impact of PM2. 5 on the human respiratory system. J. Thorac. Dis. 2016, 8, E69. [Google Scholar] [PubMed]
  4. Stanaway, J.D.; Afshin, A.; Gakidou, E.; Lim, S.S.; Abate, D.; Abate, K.H.; Abbafati, C.; Abbasi, N.; Abbastabar, H.; Abd-Allah, F. Global, regional, and national comparative risk assessment of 84 behavioural, environmental and occupational, and metabolic risks or clusters of risks for 195 countries and territories, 1990–2017: A systematic analysis for the Global Burden of Disease Study 2017. Lancet 2018, 392, 1923–1994. [Google Scholar]
  5. Stabile, L.; Fuoco, F.C.; Marini, S.; Buonanno, G. Effects of the exposure to indoor cooking-generated particles on nitric oxide exhaled by women. Atmos. Environ. 2015, 103, 238–246. [Google Scholar] [CrossRef]
  6. Martin, W.J.; Glass, R.I.; Balbus, J.M.; Collins, F.S. A major environmental cause of death. Science 2011, 334, 180–181. [Google Scholar] [CrossRef] [Green Version]
  7. Nayek, S.; Padhy, P.K. Approximation of personal exposure to fine particulate matters (PM2. 5) during cooking using solid biomass fuels in the kitchens of rural West Bengal, India. Environ. Sci. Pollut. Res. 2018, 25, 15925–15933. [Google Scholar] [CrossRef]
  8. WHO. Indoor Air Pollution and Health; Fact Sheet 292; 2011. [Google Scholar]
  9. World Health Organization. Air Pollution, Ambient Air Pollution. 2020. Available online: https://www.who.int/airpollution/ambient/pollutants/en/ (accessed on 1 October 2022).
  10. International Energy Agency (IEA). SDG7: Data and Projections; IEA: Paris, France, 2020; Available online: https://www.iea.org/reports/sdg7-data-and-projections (accessed on 1 October 2022).
  11. Smith, K.R.; Bruce, N.; Balakrishnan, K.; Adair-Rohani, H.; Balmes, J.; Chafe, Z.; Dherani, M.; Hosgood, H.D.; Mehta, S.; Pope, D. Millions dead: How do we know and what does it mean? Methods used in the comparative risk assessment of household air pollution. Annu. Rev. Public Health 2014, 35, 185–206. [Google Scholar] [CrossRef] [Green Version]
  12. Alexander, L.; Anderson, H.R.; Bachman, V.F.; Biryukov, S.; Brauer, M.; Burnett, R.T.; Collaborators, G.R.F. Global, regional, and national comparative risk assessment of 79 behavioural, environmental and occupational, and metabolic risks or clusters of risks in 188 countries, 1990–2013: A systematic analysis for the Global Burden of Disease Study 2013. Lancet 2015, 386, 2287–2323. [Google Scholar]
  13. Jalava, P.I.; Salonen, R.O.; Nuutinen, K.; Pennanen, A.S.; Happo, M.S.; Tissari, J.; Frey, A.; Hillamo, R.; Jokiniemi, J.; Hirvonen, M.-R. Effect of combustion condition on cytotoxic and inflammatory activity of residential wood combustion particles. Atmos. Environ. 2010, 44, 1691–1698. [Google Scholar] [CrossRef]
  14. Torkmahalleh, M.A.; Gorjinezhad, S.; Unluevcek, H.S.; Hopke, P.K. Review of factors impacting emission/concentration of cooking generated particulate matter. Sci. Total Environ. 2017, 586, 1046–1056. [Google Scholar] [CrossRef] [PubMed]
  15. Kumar, P.; Hama, S.; Abbass, R.A.; Nogueira, T.; Brand, V.S.; Wu, H.-W.; Abulude, F.O.; Adelodun, A.A.; Anand, P.; de Fatima Andrade, M. In-kitchen aerosol exposure in twelve cities across the globe. Environ. Int. 2022, 162, 107155. [Google Scholar] [CrossRef] [PubMed]
  16. Fedak, K.M.; Good, N.; Walker, E.S.; Balmes, J.; Brook, R.D.; Clark, M.L.; Cole-Hunter, T.; Devlin, R.; L’Orange, C.; Luckasen, G. Acute effects on blood pressure following controlled exposure to cookstove air pollution in the STOVES study. J. Am. Heart Assoc. 2019, 8, e012246. [Google Scholar] [CrossRef] [PubMed]
  17. Goel, A.; Ola, D.; Veetil, A.V. Burden of disease for workers attributable to exposure through inhalation of PPAHs in RSPM from cooking fumes. Environ. Sci. Pollut. Res. 2019, 26, 8885–8894. [Google Scholar] [CrossRef]
  18. Yu, K.; Qiu, G.; Chan, K.-H.; Lam, K.-B.H.; Kurmi, O.P.; Bennett, D.A.; Yu, C.; Pan, A.; Lv, J.; Guo, Y. Association of solid fuel use with risk of cardiovascular and all-cause mortality in rural China. JAMA 2018, 319, 1351–1361. [Google Scholar] [CrossRef] [PubMed]
  19. Davila-Roman, V.; Wise, R.; Herrera, P.; Checkley, W.; Gilman, R.; Miranda, J.; Miele, C.; Mongilardi, N.; de Ferrari, A.; Caravedo, M. Chronic exposure to biomass fuel smoke and markers of endothelial inflammation. Indoor Air 2016, 26, 768–775. [Google Scholar]
  20. Pope III, C.A.; Bhatnagar, A.; McCracken, J.P.; Abplanalp, W.; Conklin, D.J.; O’Toole, T. Exposure to fine particulate air pollution is associated with endothelial injury and systemic inflammation. Circ. Res. 2016, 119, 1204–1214. [Google Scholar] [CrossRef] [Green Version]
  21. Johnson, B.D.; Kip, K.E.; Marroquin, O.C.; Ridker, P.M.; Kelsey, S.F.; Shaw, L.J.; Pepine, C.J.; Sharaf, B.; Bairey Merz, C.N.; Sopko, G. Serum amyloid A as a predictor of coronary artery disease and cardiovascular outcome in women: The National Heart, Lung, and Blood Institute–Sponsored Women’s Ischemia Syndrome Evaluation (WISE). Circulation 2004, 109, 726–732. [Google Scholar] [CrossRef] [Green Version]
  22. Li, W.; Dorans, K.S.; Wilker, E.H.; Rice, M.B.; Ljungman, P.L.; Schwartz, J.D.; Coull, B.A.; Koutrakis, P.; Gold, D.R.; Keaney Jr, J.F. Short-term exposure to ambient air pollution and circulating biomarkers of endothelial cell activation: The Framingham Heart Study. Environ. Res. 2019, 171, 36–43. [Google Scholar] [CrossRef]
  23. Teixeira, B.C.; Lopes, A.L.; Macedo, R.C.O.; Correa, C.S.; Ramis, T.R.; Ribeiro, J.L.; Reischak-Oliveira, A. Inflammatory markers, endothelial function and cardiovascular risk. J. Vasc. Bras. 2014, 13, 108–115. [Google Scholar] [CrossRef] [Green Version]
  24. Olopade, C.O.; Frank, E.; Bartlett, E.; Alexander, D.; Dutta, A.; Ibigbami, T.; Adu, D.; Olamijulo, J.; Arinola, G.; Karrison, T. Effect of a clean stove intervention on inflammatory biomarkers in pregnant women in Ibadan, Nigeria: A randomized controlled study. Environ. Int. 2017, 98, 181–190. [Google Scholar] [CrossRef] [Green Version]
  25. Lachowicz, J.I.; Lecca, L.I.; Meloni, F.; Campagna, M. Metals and Metal-Nanoparticles in Human Pathologies: From Exposure to Therapy. Molecules 2021, 26, 6639. [Google Scholar] [CrossRef] [PubMed]
  26. Weichenthal, S.; Olaniyan, T.; Christidis, T.; Lavigne, E.; Hatzopoulou, M.; Van Ryswyk, K.; Tjepkema, M.; Burnett, R. Within-city spatial variations in ambient ultrafine particle concentrations and incident brain tumors in adults. Epidemiology 2020, 31, 177. [Google Scholar] [CrossRef] [PubMed]
  27. Loane, C.; Pilinis, C.; Lekkas, T.D.; Politis, M. Ambient particulate matter and its potential neurological consequences. Rev. Neurosci. 2013, 24, 323–335. [Google Scholar] [CrossRef]
  28. Amouei Torkmahalleh, M.; Naseri, M.; Nurzhan, S.; Gabdrashova, R.; Bekezhankyzy, Z.; Gimnkhan, A.; Malekipirbazari, M.; Jouzizadeh, M.; Tabesh, M.; Farrokhi, H. Human exposure to aerosol from indoor gas stove cooking and the resulting nervous system responses. Indoor Air 2022, 32, e12983. [Google Scholar] [CrossRef] [PubMed]
  29. Page, M.J.; McKenzie, J.E.; Bossuyt, P.M.; Boutron, I.; Hoffmann, T.C.; Mulrow, C.D.; Shamseer, L.; Tetzlaff, J.M.; Akl, E.A.; Brennan, S.E. The PRISMA 2020 statement: An updated guideline for reporting systematic reviews. Syst. Rev. 2021, 10, 1–11. [Google Scholar] [CrossRef]
  30. Available online: https://prisma-statement.org/ (accessed on 1 October 2022).
  31. Moher, D.; Liberati, A.; Tetzlaff, J.; Altman, D.G.; Group, T. Linee guida per il reporting di revisioni sistematiche e meta-analisi: Il PRISMA Statement. PLoS Med 2009, 6, e1000097. [Google Scholar] [CrossRef] [Green Version]
  32. Rethlefsen, M.L.; Kirtley, S.; Waffenschmidt, S.; Ayala, A.P.; Moher, D.; Page, M.J.; Koffel, J.B. PRISMA-S: An extension to the PRISMA statement for reporting literature searches in systematic reviews. Syst. Rev. 2021, 10, 1–19. [Google Scholar] [CrossRef]
  33. Sarkis-Onofre, R.; Catalá-López, F.; Aromataris, E.; Lockwood, C. How to properly use the PRISMA Statement. Syst. Rev. 2021, 10, 1–3. [Google Scholar] [CrossRef]
  34. Huang, X.; Lin, J.; Demner-Fushman, D. Evaluation of PICO as a knowledge representation for clinical questions. In AMIA Annual Symposium Proceedings; American Medical Informatics Association: Bethesda, MD, USA, 2006; p. 359. [Google Scholar]
  35. Santos, C.M.d.C.; Pimenta, C.A.d.M.; Nobre, M.R.C. The PICO strategy for the research question construction and evidence search. Rev. Lat.-Am. Enferm. 2007, 15, 508–511. [Google Scholar] [CrossRef] [Green Version]
  36. Eriksen, M.B.; Frandsen, T.F. The impact of patient, intervention, comparison, outcome (PICO) as a search strategy tool on literature search quality: A systematic review. J. Med. Libr. Assoc. JMLA 2018, 106, 420. [Google Scholar] [CrossRef] [PubMed]
  37. Moher, D.; Liberati, A.; Tetzlaff, J.; Altman, D.G.; PRISMA Group. Preferred reporting items for systematic reviews and meta-analyses: The PRISMA statement. Ann. Intern. Med. 2009, 151, 264–269. [Google Scholar] [CrossRef] [PubMed] [Green Version]
  38. Sidhu, M.K.; Ravindra, K.; Mor, S.; John, S. Household air pollution from various types of rural kitchens and its exposure assessment. Sci. Total Environ. 2017, 586, 419–429. [Google Scholar] [CrossRef] [PubMed]
  39. Johnston, J.D.; Hawks, M.E.; Johnston, H.B.; Johnson, L.A.; Beard, J.D. Comparison of Liquefied Petroleum Gas Cookstoves and Wood Cooking Fires on PM2. 5 Trends in Brick Workers’ Homes in Nepal. Int. J. Environ. Res. Public Health 2020, 17, 5681. [Google Scholar] [CrossRef]
  40. Brandelet, B.; Rose, C.; Rogaume, C.; Rogaume, Y. Impact of ignition technique on total emissions of a firewood stove. Biomass Bioenergy 2018, 108, 15–24. [Google Scholar] [CrossRef]
  41. Deepthi, Y.; Nagendra, S.S.; Gummadi, S.N. Characteristics of indoor air pollution and estimation of respiratory dosage under varied fuel-type and kitchen-type in the rural areas of Telangana state in India. Sci. Total Environ. 2019, 650, 616–625. [Google Scholar] [CrossRef]
  42. Yamamoto, S.; Louis, V.; Sié, A.; Sauerborn, R. Biomass smoke in Burkina Faso: What is the relationship between particulate matter, carbon monoxide, and kitchen characteristics? Environ. Sci. Pollut. Res. 2014, 21, 2581–2591. [Google Scholar] [CrossRef]
  43. Shen, G.; Gaddam, C.K.; Ebersviller, S.M.; Vander Wal, R.L.; Williams, C.; Faircloth, J.W.; Jetter, J.J.; Hays, M.D. A laboratory comparison of emission factors, number size distributions, and morphology of ultrafine particles from 11 different household cookstove-fuel systems. Environ. Sci. Technol. 2017, 51, 6522–6532. [Google Scholar] [CrossRef]
  44. Fatmi, Z.; Ntani, G.; Coggon, D. Levels and determinants of fine particulate matter and carbon monoxide in kitchens using biomass and non-biomass fuel for cooking. Int. J. Environ. Res. Public Health 2020, 17, 1287. [Google Scholar] [CrossRef] [Green Version]
  45. Abdullahi, K.L.; Delgado-Saborit, J.M.; Harrison, R.M. Emissions and indoor concentrations of particulate matter and its specific chemical components from cooking: A review. Atmos. Environ. 2013, 71, 260–294. [Google Scholar] [CrossRef]
  46. Wang, G.; Cheng, S.; Wei, W.; Wen, W.; Wang, X.; Yao, S. Chemical characteristics of fine particles emitted from different Chinese cooking styles. Aerosol Air Qual. Res. 2015, 15, 2357–2366. [Google Scholar] [CrossRef] [Green Version]
  47. Zhai, S.R.; Albritton, D. Airborne particles from cooking oils: Emission test and analysis on chemical and health implications. Sustain. Cities Soc. 2020, 52, 101845. [Google Scholar] [CrossRef]
  48. Kong, H.K.; Yoon, D.K.; Lee, H.W.; Lee, C.M. Evaluation of particulate matter concentrations according to cooking activity in a residential environment. Environ. Sci. Pollut. Res. 2021, 28, 2443–2456. [Google Scholar] [CrossRef] [PubMed]
  49. Li, S.; Gao, J.; He, Y.; Cao, L.; Li, A.; Mo, S.; Chen, Y.; Cao, Y. Determination of time-and size-dependent fine particle emission with varied oil heating in an experimental kitchen. J. Environ. Sci. 2017, 51, 157–164. [Google Scholar] [CrossRef] [PubMed]
  50. Torkmahalleh, M.A.; Goldasteh, I.; Zhao, Y.; Udochu, N.M.; Rossner, A.; Hopke, P.; Ferro, A. PM2.5 and ultrafine particles emitted during heating of commercial cooking oils. Indoor Air 2012, 22, 483–491. [Google Scholar] [CrossRef]
  51. He, C.; Morawska, L.; Hitchins, J.; Gilbert, D. Contribution from indoor sources to particle number and mass concentrations in residential houses. Atmos. Environ. 2004, 38, 3405–3415. [Google Scholar] [CrossRef]
  52. Jørgensen, R.B.; Strandberg, B.; Sjaastad, A.K.; Johansen, A.; Svendsen, K. Simulated restaurant cook exposure to emissions of PAHs, mutagenic aldehydes, and particles from frying bacon. J. Occup. Environ. Hyg. 2013, 10, 122–131. [Google Scholar] [CrossRef]
  53. Sofuoglu, S.C.; Toprak, M.; Inal, F.; Cimrin, A.H. Indoor air quality in a restaurant kitchen using margarine for deep-frying. Environ. Sci. Pollut. Res. 2015, 22, 15703–15711. [Google Scholar] [CrossRef] [Green Version]
  54. Karjalainen, A.; Leppänen, M.; Leskinen, J.; Torvela, T.; Pasanen, P.; Tissari, J.; Miettinen, M. Concentrations and number size distribution of fine and nanoparticles in a traditional Finnish bakery. J. Occup. Environ. Hyg. 2018, 15, 194–203. [Google Scholar] [CrossRef]
  55. Wallace, L.A.; Ott, W.R.; Weschler, C.J.; Lai, A.C. Desorption of SVOCs from heated surfaces in the form of ultrafine particles. Environ. Sci. Technol. 2017, 51, 1140–1146. [Google Scholar] [CrossRef] [Green Version]
  56. L’Orange, C.; Volckens, J.; DeFoort, M. Influence of stove type and cooking pot temperature on particulate matter emissions from biomass cook stoves. Energy Sustain. Dev. 2012, 16, 448–455. [Google Scholar] [CrossRef]
  57. Wangchuk, T.; He, C.; Knibbs, L.D.; Mazaheri, M.; Morawska, L. A pilot study of traditional indoor biomass cooking and heating in rural Bhutan: Gas and particle concentrations and emission rates. Indoor Air 2017, 27, 160–168. [Google Scholar] [CrossRef] [PubMed] [Green Version]
  58. Tryner, J.; Volckens, J.; Marchese, A.J. Effects of operational mode on particle size and number emissions from a biomass gasifier cookstove. Aerosol Sci. Technol. 2018, 52, 87–97. [Google Scholar] [CrossRef]
  59. Zhao, Y.; Liu, L.; Tao, P.; Zhang, B.; Huan, C.; Zhang, X.; Wang, M. Review of effluents and health effects of cooking and the performance of kitchen ventilation. Aerosol Air Qual. Res. 2019, 19, 1937–1959. [Google Scholar] [CrossRef]
  60. Zhao, Y.; Chen, C.; Zhao, B. Emission characteristics of PM2. 5-bound chemicals from residential Chinese cooking. Build. Environ. 2019, 149, 623–629. [Google Scholar] [CrossRef]
  61. Li, T.; Cao, S.; Fan, D.; Zhang, Y.; Wang, B.; Zhao, X.; Leaderer, B.P.; Shen, G.; Zhang, Y.; Duan, X. Household concentrations and personal exposure of PM2. 5 among urban residents using different cooking fuels. Sci. Total Environ. 2016, 548, 6–12. [Google Scholar] [CrossRef] [PubMed] [Green Version]
  62. Yu, K.; Yang, K.; Chen, Y.; Gong, J.; Chen, Y.; Shih, H.; Candice Lung, S.C. Indoor air pollution from gas cooking in five Taiwanese families. Build Environ. 2015, 93, 258–266. [Google Scholar] [CrossRef]
  63. Benka-Coker, M.L.; Peel, J.L.; Volckens, J.; Good, N.; Bilsback, K.R.; L’Orange, C.; Quinn, C.; Young, B.N.; Rajkumar, S.; Wilson, A. Kitchen concentrations of fine particulate matter and particle number concentration in households using biomass cookstoves in rural Honduras. Environ. Pollut. 2020, 258, 113697. [Google Scholar] [CrossRef]
  64. Singer, B.C.; Pass, R.Z.; Delp, W.W.; Lorenzetti, D.M.; Maddalena, R.L. Pollutant concentrations and emission rates from natural gas cooking burners without and with range hood exhaust in nine California homes. Build. Environ. 2017, 122, 215–229. [Google Scholar] [CrossRef] [Green Version]
  65. Sun, L.; Wallace, L.A. Residential cooking and use of kitchen ventilation: The impact on exposure. J. Air Waste Manag. Assoc. 2021, 71, 830–843. [Google Scholar] [CrossRef]
  66. Alves, C.; Vicente, A.; Oliveira, A.R.; Candeias, C.; Vicente, E.; Nunes, T.; Cerqueira, M.; Evtyugina, M.; Rocha, F.; Almeida, S.M. Fine particulate matter and gaseous compounds in kitchens and outdoor air of different dwellings. Int. J. Environ. Res. Public Health 2020, 17, 5256. [Google Scholar] [CrossRef] [PubMed]
  67. Xu, H.; Ta, W.; Yang, L.; Feng, R.; He, K.; Shen, Z.; Meng, Z.; Zhang, N.; Li, Y.; Zhang, Y. Characterizations of PM2. 5-bound organic compounds and associated potential cancer risks on cooking emissions from dominated types of commercial restaurants in northwestern China. Chemosphere 2020, 261, 127758. [Google Scholar] [CrossRef]
  68. Pei, B.; Cui, H.; Liu, H.; Yan, N. Chemical characteristics of fine particulate matter emitted from commercial cooking. Front. Environ. Sci. Eng. 2016, 10, 559–568. [Google Scholar] [CrossRef]
  69. Ott, W.; Wallace, L.; McAteer, J.; Hildemann, L. Fine and ultrafine particle exposures on 73 trips by car to 65 non-smoking restaurants in the San Francisco Bay Area. Indoor Air 2017, 27, 205–217. [Google Scholar] [CrossRef] [PubMed]
  70. Vicente, A.M.; Rocha, S.; Duarte, M.; Moreira, R.; Nunes, T.; Alves, C.A. Fingerprinting and emission rates of particulate organic compounds from typical restaurants in Portugal. Sci. Total Environ. 2021, 778, 146090. [Google Scholar] [CrossRef]
  71. Bandowe, B.A.M.; Lui, K.; Jones, T.; BeruBe, K.; Adams, R.; Niu, X.; Wei, C.; Cao, J.-J.; Lee, S.; Chuang, H.-C. The chemical composition and toxicological effects of fine particulate matter (PM2. 5) emitted from different cooking styles. Environ. Pollut. 2021, 288, 117754. [Google Scholar] [CrossRef]
  72. Baumgartner, J.; Schauer, J.; Ezzati, M.; Lu, L.; Cheng, C.; Patz, J.; Bautista, L. Patterns and predictors of personal exposure to indoor air pollution from biomass combustion among women and children in rural China. Indoor Air 2011, 21, 479–488. [Google Scholar] [CrossRef]
  73. Bilsback, K.R.; Dahlke, J.; Fedak, K.M.; Good, N.; Hecobian, A.; Herckes, P.; L’Orange, C.; Mehaffy, J.; Sullivan, A.; Tryner, J. A laboratory assessment of 120 air pollutant emissions from biomass and fossil fuel cookstoves. Environ. Sci. Technol. 2019, 53, 7114–7125. [Google Scholar] [CrossRef]
  74. Huang, Y.; Ho, S.S.H.; Ho, K.F.; Lee, S.C.; Yu, J.Z.; Louie, P.K. Characteristics and health impacts of VOCs and carbonyls associated with residential cooking activities in Hong Kong. J. Hazard. Mater. 2011, 186, 344–351. [Google Scholar] [CrossRef]
  75. Dai, W.; Zhong, H.; Li, L.; Cao, J.; Huang, Y.; Shen, M.; Wang, L.; Dong, J.; Tie, X.; Ho, S.S.H. Characterization and health risk assessment of airborne pollutants in commercial restaurants in northwestern China: Under a low ventilation condition in wintertime. Sci. Total Environ. 2018, 633, 308–316. [Google Scholar] [CrossRef]
  76. Chen, J.; Li, C.; Ristovski, Z.; Milic, A.; Gu, Y.; Islam, M.S.; Wang, S.; Hao, J.; Zhang, H.; He, C. A review of biomass burning: Emissions and impacts on air quality, health and climate in China. Sci. Total Environ. 2017, 579, 1000–1034. [Google Scholar] [CrossRef] [PubMed] [Green Version]
  77. Adhikari, S.; Mahapatra, P.S.; Pokheral, C.P.; Puppala, S.P. Cookstove smoke impact on ambient air quality and probable consequences for human health in rural locations of southern Nepal. Int. J. Environ. Res. Public Health 2020, 17, 550. [Google Scholar] [CrossRef] [PubMed] [Green Version]
  78. Liu, X.; Xing, W.; Xu, Z.; Zhang, X.; Zhou, H.; Cai, K.; Xu, B.; Chen, C. Assessing Impacts of Additives on Particulate Matter and Volatile Organic Compounds Produced from the Grilling of Meat. Foods 2022, 11, 833. [Google Scholar] [CrossRef]
  79. Naseri, M.; Jouzizadeh, M.; Tabesh, M.; Malekipirbazari, M.; Gabdrashova, R.; Nurzhan, S.; Farrokhi, H.; Khanbabaie, R.; Mehri-Dehnavi, H.; Bekezhankyzy, Z. The impact of frying aerosol on human brain activity. Neurotoxicology 2019, 74, 149–161. [Google Scholar] [CrossRef] [PubMed]
  80. Torkmahalleh, M.A.; Zhao, Y.; Hopke, P.; Rossner, A.; Ferro, A. Additive impacts on particle emissions from heating low emitting cooking oils. Atmos. Environ. 2013, 74, 194–198. [Google Scholar] [CrossRef]
  81. Takhar, M.; Li, Y.; Ditto, J.C.; Chan, A.W. Formation pathways of aldehydes from heated cooking oils. Environ. Sci. Process. Impacts 2022. [Google Scholar] [CrossRef] [PubMed]
  82. Katragadda, H.R.; Fullana, A.; Sidhu, S.; Carbonell-Barrachina, Á.A. Emissions of volatile aldehydes from heated cooking oils. Food Chem. 2010, 120, 59–65. [Google Scholar] [CrossRef]
  83. Al-Hadi, A.M.; Periasamy, V.S.; Athinarayanan, J.; Alshatwi, A.A. The presence of carbon nanostructures in bakery products induces metabolic stress in human mesenchymal stem cells through CYP1A and p53 gene expression. Environ. Toxicol. Pharmacol. 2016, 41, 103–112. [Google Scholar] [CrossRef]
  84. Zhang, J.; Pan, D.; Zhou, G.; Wang, Y.; Dang, Y.; He, J.; Li, G.; Cao, J. The changes of the volatile compounds derived from lipid oxidation of boneless dry-cured hams during processing. Eur. J. Lipid Sci. Technol. 2019, 121, 1900135. [Google Scholar] [CrossRef]
  85. Torkmahalleh, M.A.; Gorjinezhad, S.; Keles, M.; Unluevcek, H.S.; Azgin, C.; Cihan, E.; Tanis, B.; Soy, N.; Ozaslan, N.; Ozturk, F. A controlled study for the characterization of PM2. 5 emitted during grilling ground beef meat. J. Aerosol Sci. 2017, 103, 132–140. [Google Scholar] [CrossRef]
  86. Fadel, M.; Ledoux, F.; Seigneur, M.; Oikonomou, K.; Sciare, J.; Courcot, D.; Afif, C. Chemical profiles of PM2. 5 emitted from various anthropogenic sources of the Eastern Mediterranean: Cooking, wood burning, and diesel generators. Environ. Res. 2022, 211, 113032. [Google Scholar] [CrossRef] [PubMed]
  87. Zhang, N.; Han, B.; He, F.; Xu, J.; Zhao, R.; Zhang, Y.; Bai, Z. Chemical characteristic of PM2. 5 emission and inhalational carcinogenic risk of domestic Chinese cooking. Environ. Pollut. 2017, 227, 24–30. [Google Scholar] [CrossRef] [PubMed]
  88. Zhou, L.; Liu, G.; Shen, M.; Hu, R.; Liu, Y. Source identification of heavy metals and stable carbon isotope in indoor dust from different functional areas in Hefei, China. Sci. Total Environ. 2020, 710, 135599. [Google Scholar] [CrossRef]
  89. Xu, H.; Cao, J.; Ho, K.; Ding, H.; Han, Y.; Wang, G.; Chow, J.; Watson, J.; Khol, S.; Qiang, J. Lead concentrations in fine particulate matter after the phasing out of leaded gasoline in Xi’an, China. Atmos. Environ. 2012, 46, 217–224. [Google Scholar] [CrossRef]
  90. Taner, S.; Pekey, B.; Pekey, H. Fine particulate matter in the indoor air of barbeque restaurants: Elemental compositions, sources and health risks. Sci. Total Environ. 2013, 454, 79–87. [Google Scholar] [CrossRef]
  91. Nakora, N.; Byamugisha, D.; Birungi, G. Indoor air quality in rural Southwestern Uganda: Particulate matter, heavy metals and carbon monoxide in kitchens using charcoal fuel in Mbarara Municipality. SN Appl. Sci. 2020, 2, 1–16. [Google Scholar] [CrossRef]
  92. Lee, Y.-Y.; Park, H.; Seo, Y.; Yun, J.; Kwon, J.; Park, K.-W.; Han, S.-B.; Oh, K.C.; Jeon, J.-M.; Cho, K.-S. Emission characteristics of particulate matter, odors, and volatile organic compounds from the grilling of pork. Environ. Res. 2020, 183, 109162. [Google Scholar] [CrossRef]
  93. Herrington, J.S.; Hays, M.D.; George, B.J.; Baldauf, R.W. The effects of operating conditions on semivolatile organic compounds emitted from light-duty, gasoline-powered motor vehicles. Atmos. Environ. 2012, 54, 53–59. [Google Scholar] [CrossRef]
  94. Jetter, J.; Zhao, Y.; Smith, K.R.; Khan, B.; Yelverton, T.; DeCarlo, P.; Hays, M.D. Pollutant emissions and energy efficiency under controlled conditions for household biomass cookstoves and implications for metrics useful in setting international test standards. Environ. Sci. Technol. 2012, 46, 10827–10834. [Google Scholar] [CrossRef]
  95. Water Boiling Test (WBT 4.2.3). Global Alliance for Clean Cookstoves. Testing protocols. Available online: http://cleancookstoves.org/technology-and-fuels/testing/protocols.html (accessed on 15 December 2015).
  96. Zoroddu, M.A.; Medici, S.; Ledda, A.; Nurchi, V.M.; Lachowicz, J.I.; Peana, M. Toxicity of nanoparticles. Curr. Med. Chem. 2014, 21, 3837–3853. [Google Scholar] [CrossRef]
  97. Crisponi, G.; Nurchi, V.M.; Lachowicz, J.I.; Peana, M.; Medici, S.; Zoroddu, M.A. Toxicity of nanoparticles: Etiology and mechanisms. In Antimicrobial Nanoarchitectonics; Elsevier: Amsterdam, The Netherlands, 2017; pp. 511–546. [Google Scholar]
Figure 1. The main sources of indoor particulate matter (PM) generated during cooking, and factors influencing PM physico-chemical properties.
Atmosphere 14 00012 g001
Figure 2. Flow of information through the different phases of this systematic review on occupational exposure to fine and ultrafine particulate matter during indoor cooking activities.
Atmosphere 14 00012 g002
Figure 3. Flow diagram of sampling and qualitative and quantitative analysis of respirable suspended particulate matter (RSPM).
Atmosphere 14 00012 g003
Disclaimer/Publisher’s Note: The statements, opinions and data contained in all publications are solely those of the individual author(s) and contributor(s) and not of MDPI and/or the editor(s). MDPI and/or the editor(s) disclaim responsibility for any injury to people or property resulting from any ideas, methods, instructions or products referred to in the content.

