Article

Effects of Chemical Reactions on the Oxidative Potential of Humic Acid, a Model Compound of Atmospheric Humic-like Substances

Graduate School of Energy Science, Kyoto University, Yoshida-honmachi, Sakyo-ku, Kyoto 606-8501, Japan
*
Author to whom correspondence should be addressed.
Atmosphere 2022, 13(6), 976; https://doi.org/10.3390/atmos13060976
Submission received: 1 May 2022 / Revised: 7 June 2022 / Accepted: 15 June 2022 / Published: 16 June 2022
(This article belongs to the Special Issue Student-Led Research in Atmospheric Science)

Abstract

:
Atmospheric particulate matter (PM) contains various chemicals, some of which generate in vivo reactive oxygen species (ROS). Owing to their high reactivity and oxidation ability, ROS can cause various diseases. To understand how atmospheric PM affects human health, we must clarify the PM components having oxidative potential (OP) leading to ROS production. According to previous studies, OP is exhibited by humic-like substances (HULIS) in atmospheric PM. However, the OP-dependence of the chemical structures of HULIS has not been clarified. Therefore, in this study, humic acid (HA, a model HULIS material) was exposed to ozone and ultraviolet (UV) irradiation, and its OP and structures were evaluated before and after the reactions using dithiothreitol (DTT) assay and Fourier transform infrared (FT-IR), respectively. The OP of HA was more significantly increased by UV irradiation than by ozone exposure. FT-IR analysis showed an increased intensity of the C=O peak in the HA structure after UV irradiation, suggesting that the OP of HA was increased by a chemical change to a more quinone-like structure after irradiation.

1. Introduction

Atmospheric particulate matter (PM) contains a wide variety of chemicals. Although a strong link has been identified between the hazard level and composition of PM [1,2], the chemicals that significantly affect human health are unclear [1]. To improve the atmospheric environment and maintain human health, the harmful substances in PM must be identified and their toxicity intensities must be clarified. Several studies have shown that PM exposure can induce oxidative stress in human bodies, which is a hypothesized mechanism of PM toxicity, i.e., inhaled PM may contribute to adverse health effects by producing excess reactive oxygen species (ROS) [1,2,3].
ROS are oxygen-contained molecules with high reactivity and oxidation ability in a living body. They include (but are not limited to) hydroxyl radicals, organic radicals, nitroxyl radicals, singlet oxygen, and hydrogen peroxide [3]. ROS are produced during processes such as energy production and attacks on xenobiotics. Although they play a functional role in these processes, they also oxidize fats, proteins, enzymes, and DNA. Such molecules are damaged by the production of excess ROS in vivo and the uptake of excess ROS from outside. Consequently, ROS are responsible for various diseases such as inflammation, carcinogenesis, cardiovascular diseases, and neurodegenerative diseases [4].
Oxidative potential (OP) is a critical indicator of PM toxicity [3]. We can estimate the ability of PM to generate in vivo ROS by measuring the OP of PM components with dithiothreitol (DTT) assay. The DTT assay is particularly popular [5] because it provides quantitative OP measures of PM in the absence of cells, is low-cost, fast, and easy to manipulate [3,6]. Based on current literature, the DTT assay seems to be among the most relevant OP assays for epidemiology analyses because it has been more associated with acute and chronic health endpoints and adverse cardiorespiratory outcomes than the PM concentration [7].
Transition metals, such as copper and manganese, and polycyclic aromatic hydrocarbon quinones (PAHQ), are known to be DTT-active species [6,7,8,9]. Polycyclic aromatic hydrocarbons (PAH), the parent compounds of PAHQ, are oxidized by ozone exposure or irradiation to form PAHQ, exhibiting high OP [7,9,10,11]. Moreover, some metals, such as manganese, are reported to show synergistic effects with PAHQ on OP [7,12,13,14,15]. Humic-like substances (HULIS) in atmospheric PM are also DTT-active species [16,17,18,19]. HULIS are polymeric compounds with no specific chemical structure. Their actual chemical structures are estimated to be similar to those of humic substances in soils and natural waters [18]. HULIS account for approximately 30% of the organic constituents in atmospheric particles [20]. Their main sources are secondary production from low-molecular-weight organic compounds in the atmosphere and biomass burning [18,21,22,23,24]. According to previous studies, OP by HULIS [25,26,27] can be activated via the synergy caused by the complexation with metallic elements that are similar to PAHQ [7,15,16,21,28]. However, the OP response to a chemical change in the HULIS structure has not been clarified. Previous studies have shown that under ultraviolet (UV) irradiation or ozone exposure, the OP of organic aerosols increases and their harmfulness is enhanced [29]. HULIS in the atmosphere may also be oxidized by ozone exposure or UV irradiation, which contributes to the increase in the OP of organic aerosols; however, this is not yet confirmed. Understanding how chemical changes in HULIS influence their OP is important for properly evaluating the hazard of PM in the atmosphere. Therefore, in this study, humic acid (HA) as model HULIS material was exposed to ozone and UV irradiation. Its OPs and structures were compared before and after the reactions using DTT assay and Fourier transform infrared (FT-IR) analysis, respectively.

2. Materials and Methods

2.1. Chemical Reagents

HA, DTT, and hydrochloric acid (HCl) were obtained from Wako Pure Chemical Industries. 5,5′-Dithiobis(2-nitrobenzonic acid) (DTNB) was purchased from Dojindo Laboratories (Kumamoto, Japan). Sodium hydroxide (NaOH), potassium dihydrogen phosphate (KH2PO4), and dipotassium hydrogen phosphate (K2HPO4) were obtained from Nacalai Tesque (Kyoto, Japan). The DTT and DTNB were dissolved in potassium phosphate buffer (0.05 M, pH 7.2, prepared in the laboratory) at concentrations of 79 μM and 3 mM, respectively. The HA used in this study was presumably prepared by the chemical treatment of coal or peat rather than the extraction or purification from soil or other natural sources. However, the elemental contents of the commercial HA were reported to be similar to those of the Leonardite standard HA provided by the International Humic Substances Society, and the organic matter in them is quite uniform in nature [30].

2.2. Sample Preparation

HA is insoluble in acids and soluble in alkalis [31,32]. Therefore, after the reaction, HA was first dissolved in 0.1 M NaOH solution, and the pH was adjusted to 7.2–7.4 with the addition of HCl (Figure S1). The HA concentration in the sample solution was 0.018 mg/mL. As the blank solution, a 0.1 M NaOH solution without HA was adjusted to pH 7.3 with HCl addition.

2.3. DTT Assay

The DTT assay was performed as previously described [33]. Briefly, 1425 μL of 79 μM DTT solution and 75 μL of each test sample were placed in a polypropylene conical tube immersed in a water bath kept at 37 °C, mixed, and reacted for 60 min. After the reaction, 100 μL of the solution was collected and mixed with 20 μL of 3 mM DTNB solution in a disposable cell for spectrophotometry. The 5-Mercapto-2-nitrobenzonic acid (TNB) produced by this reaction was quantified in a UV–Vis spectrophotometer (UVmini-1240; Shimadzu Corporation, Kyoto, Japan) at a measuring wavelength of 412 nm. In addition, 95, 5, and 20 μL of DTT solution, buffer solution, and DTNB solution, respectively, were mixed in advance in another cell. The generated TNB was then quantified in the spectrophotometer. From these two results, the amount of TNB reduction was determined and calculated as the amount of DTT consumed by each test sample. Furthermore, we performed blank experiments with samples that did not contain the test substance. The calculated results were corrected by subtracting the blank DTT consumption from the DTT consumption of each sample. A quality assurance test was performed on our DTT assay by measuring the DTT consumption rate with 9,10-phenanthrenequinone (PQN), which is a representative DTT-active PAHQ. The results were then compared to a previous report [33].

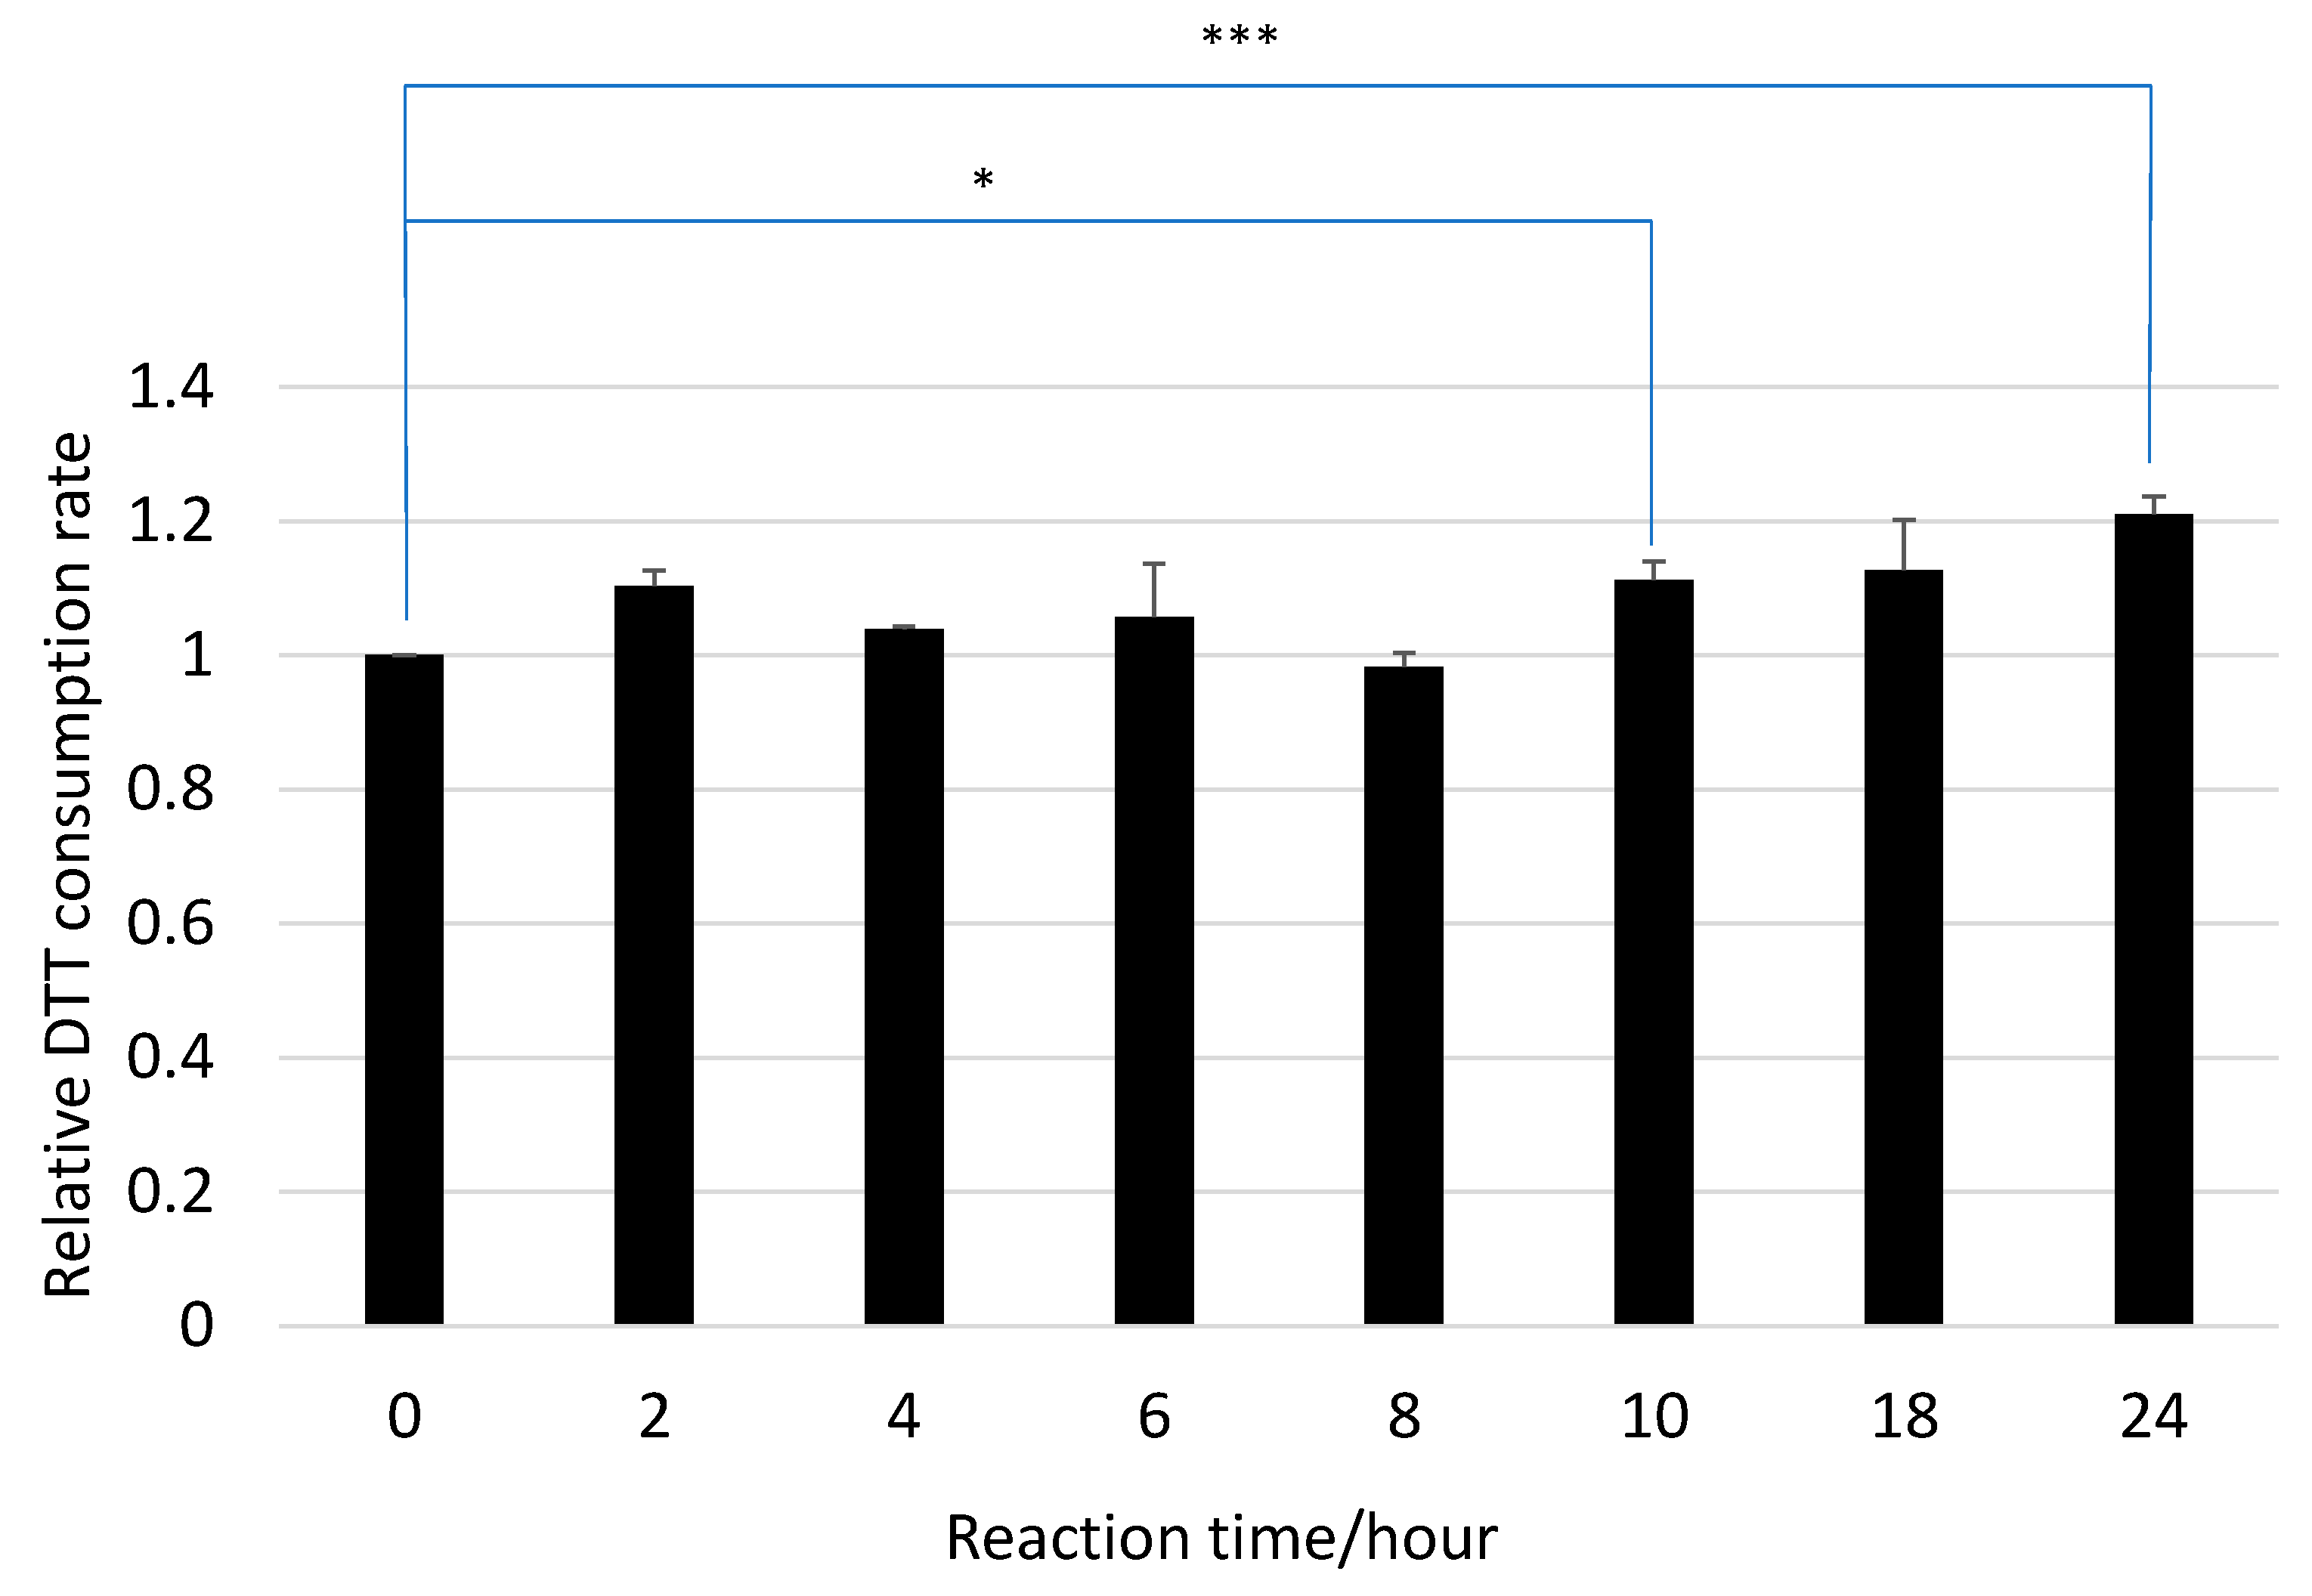
2.4. Exposure of HA to Ozone

The air from an air compressor was passed through an air-drying unit and sent to an ozone generator (ED-OG-L7; Eco Design Inc., Saitama, Japan). The ozone concentration was adjusted to 1 ppm, which is more than ten times that of the typical ambient concentrations in major cities in the world [34], by monitoring using an ozone monitor (MODEL1200; Dylec Inc., Ibaraki, Japan). The ozone-containing air was transferred to the reaction vessel (6 cm ID × 18 cm height, ~500 mL) at 1 L/min (Figure S2). HA was divided into 5 mg portions in a Petri dish (1.9 cm ID × 1.0 cm depth). Each portion was placed in a Pyrex reaction vessel protected from light and exposed to ozone for a certain period of time at 17 °C and a relative humidity of 13%. The exposure times were 0, 2, 4, 6, 8, 10, 18, and 24 h. Exposures were performed twice for each reaction time. The HA after exposure was applied to the sample preparation at each reaction time according to Section 2.2. Each prepared sample solution was divided into three portions, and then they were subjected to the DTT assay; the average of the six assay results at the same reaction time was calculated and displayed in Figure 1.

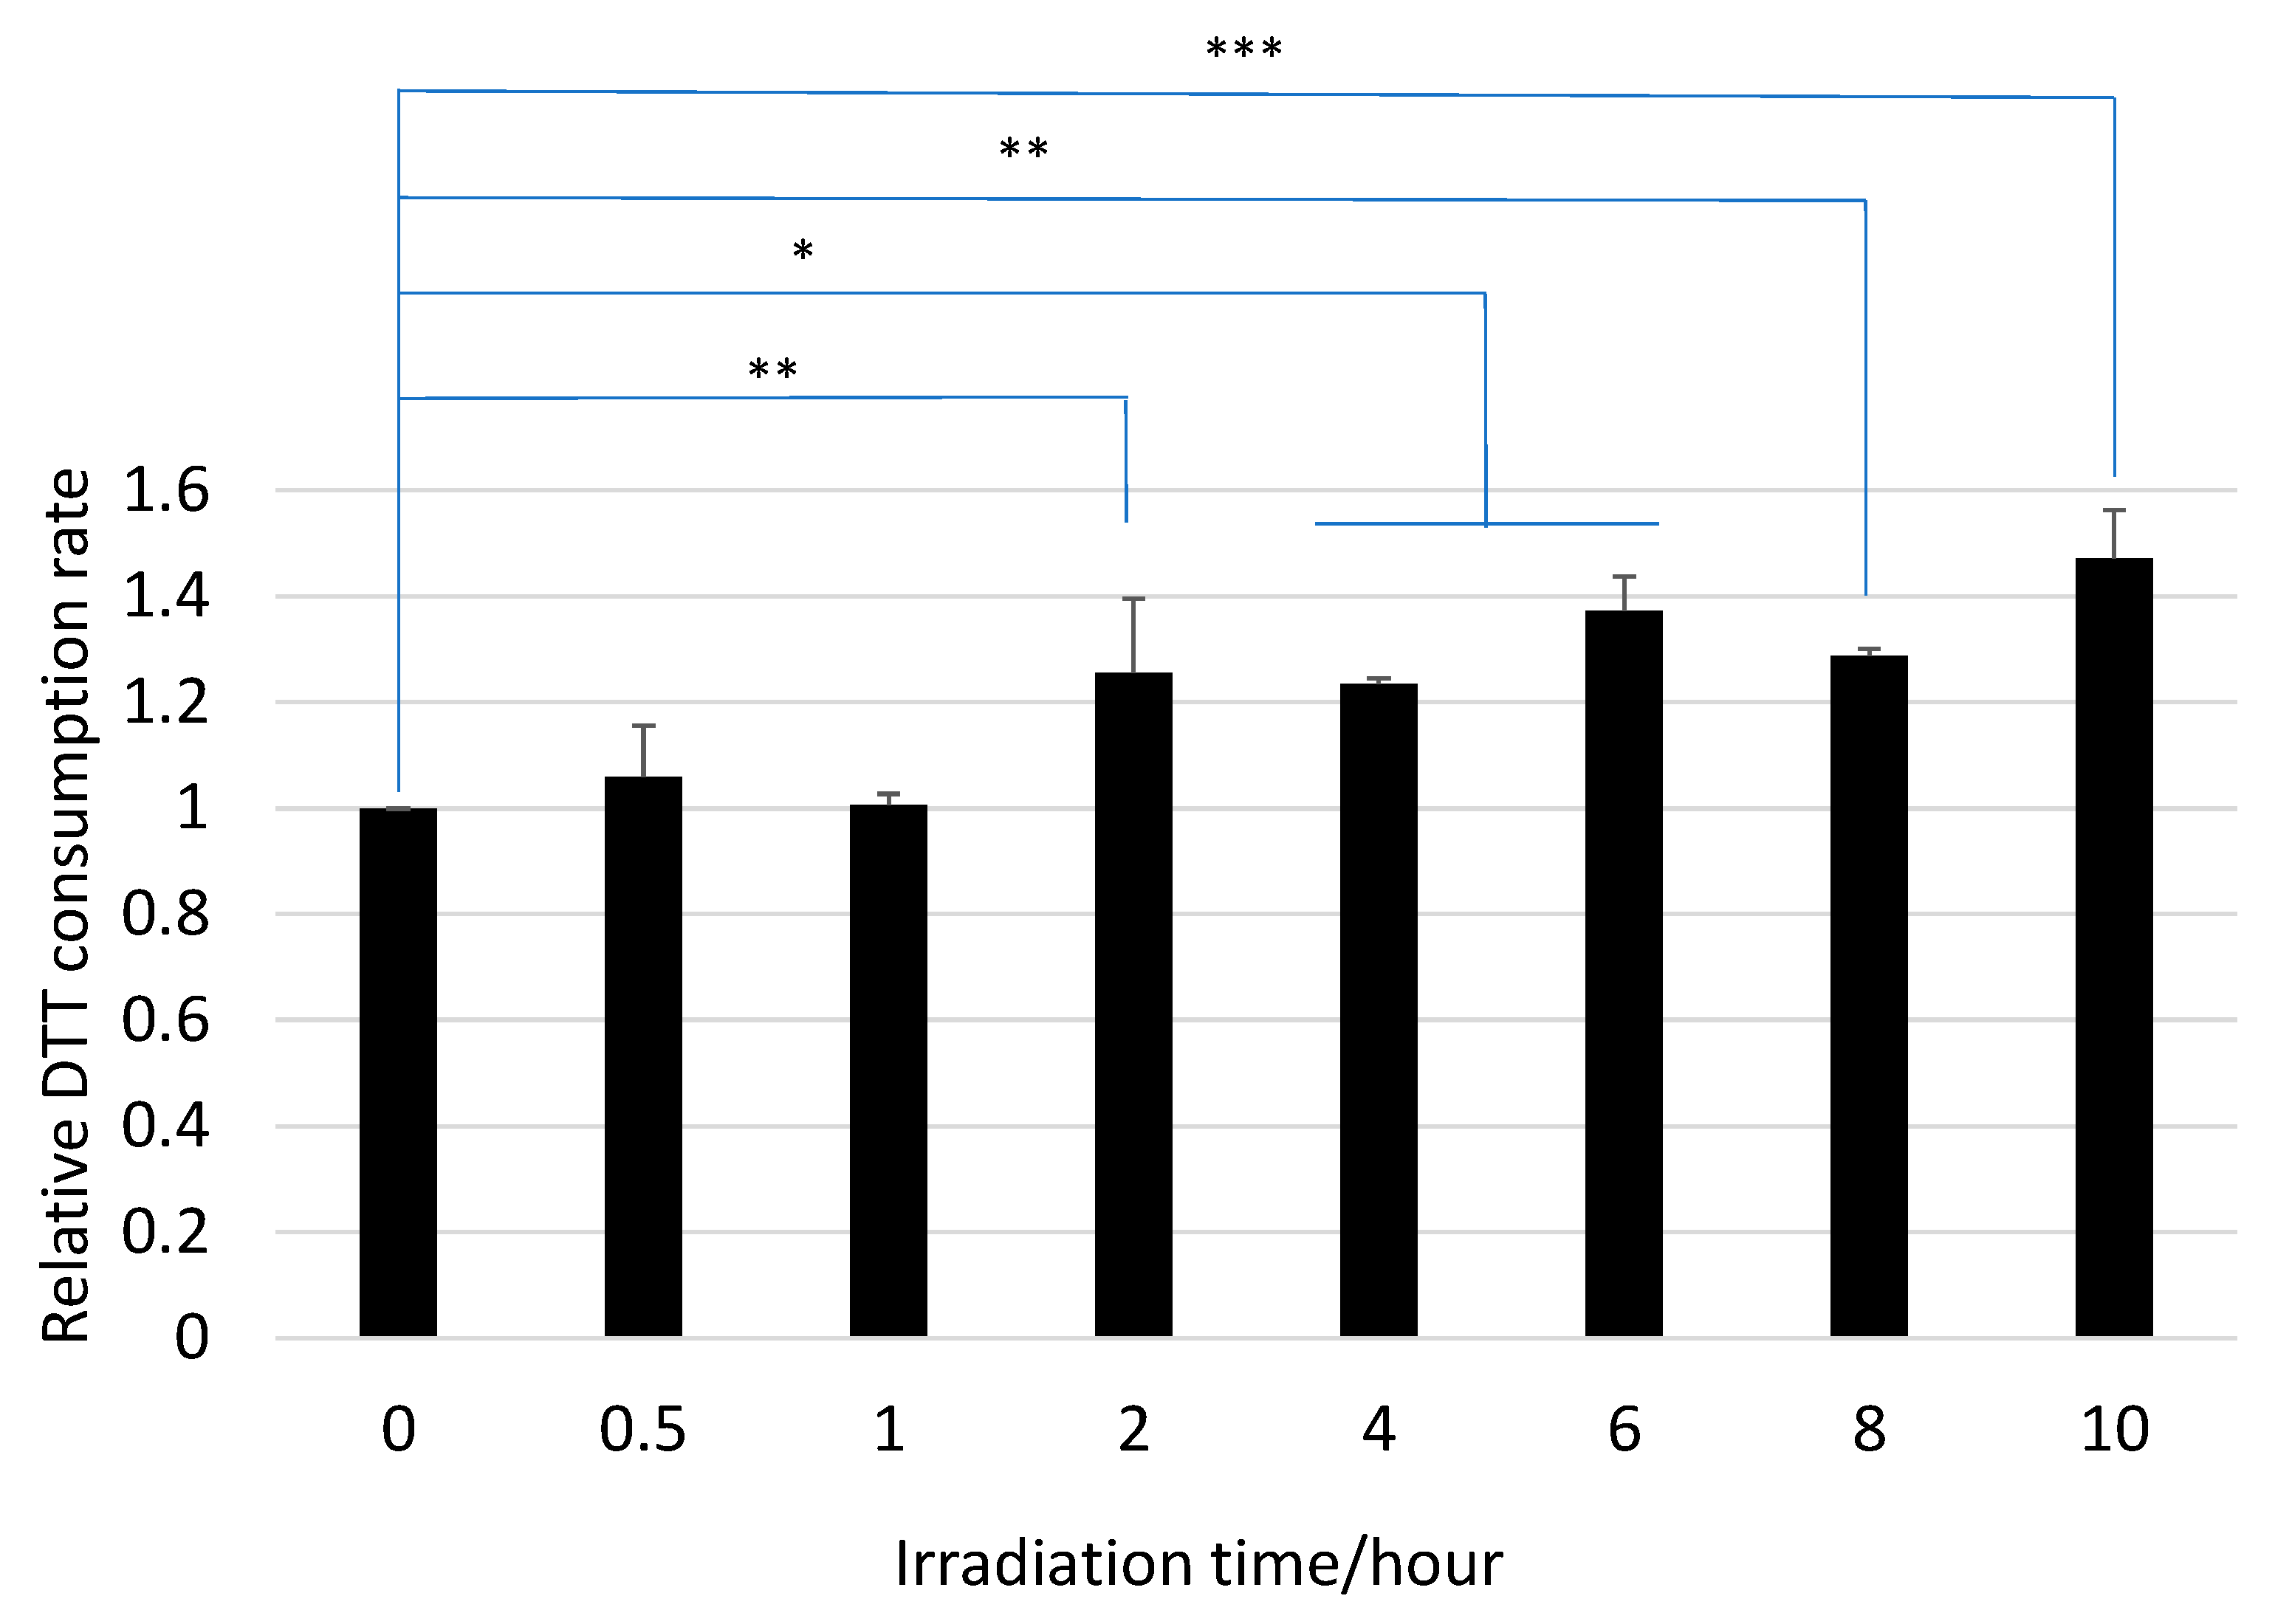
2.5. UV Irradiation of HA
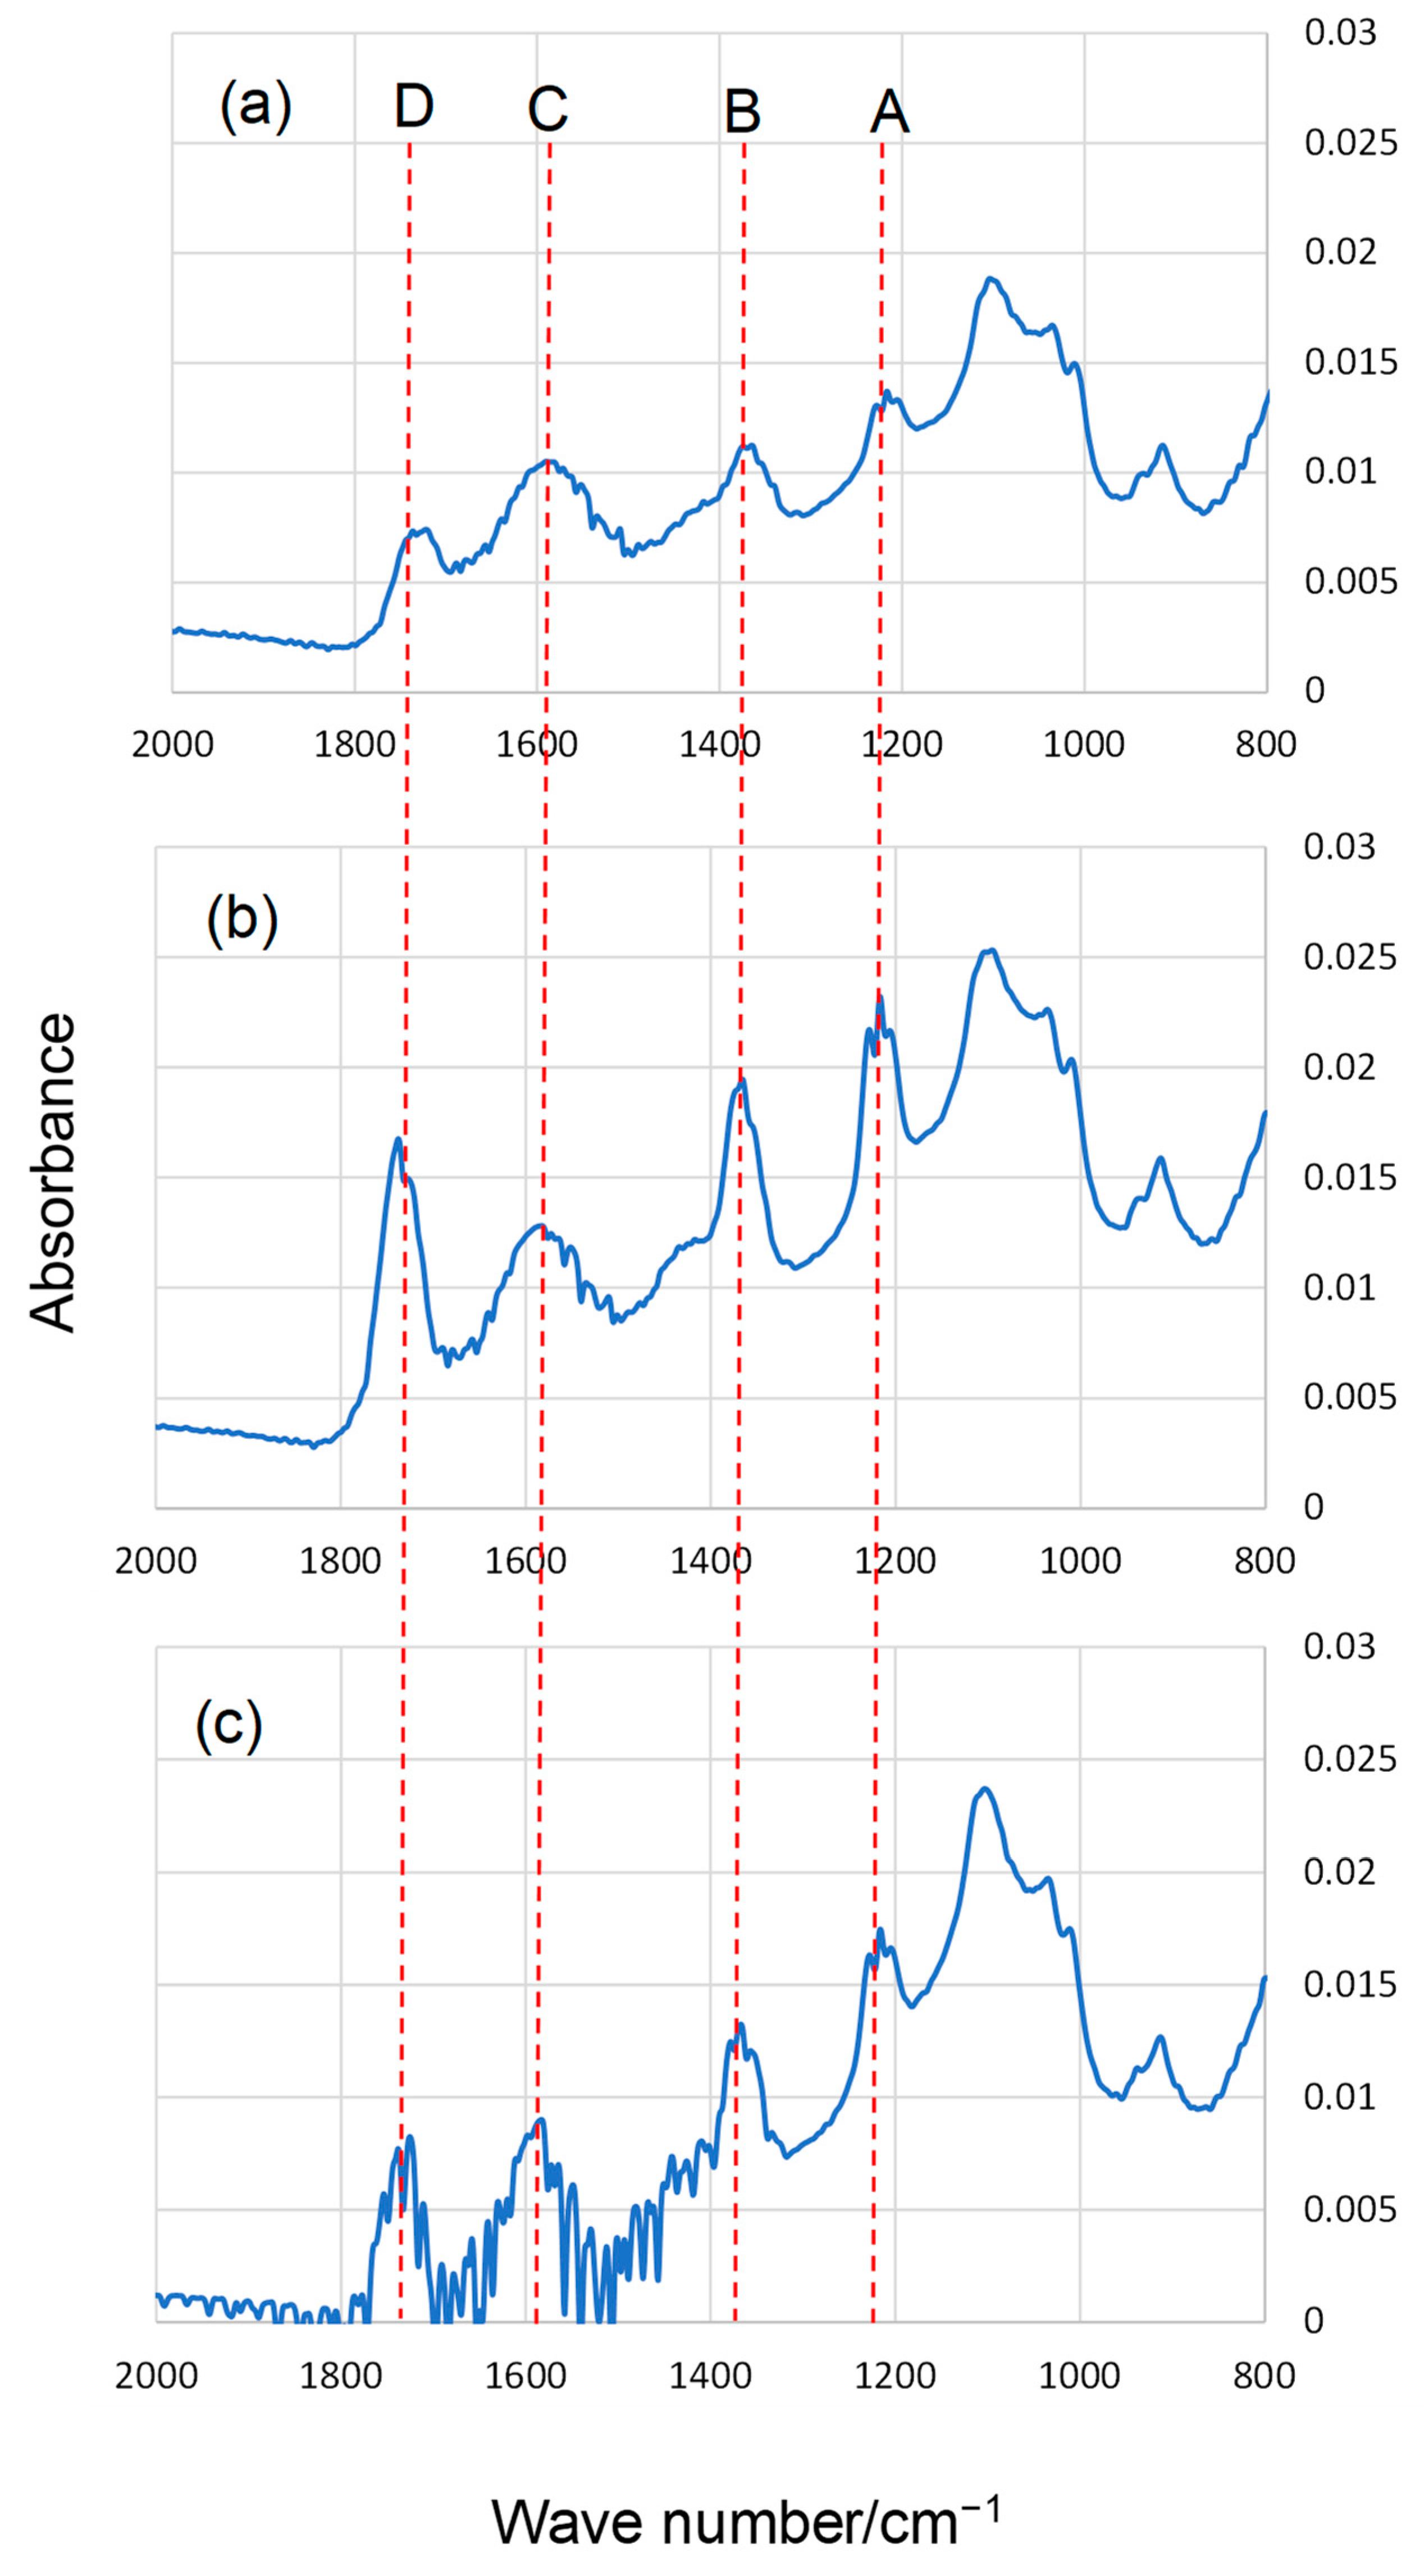
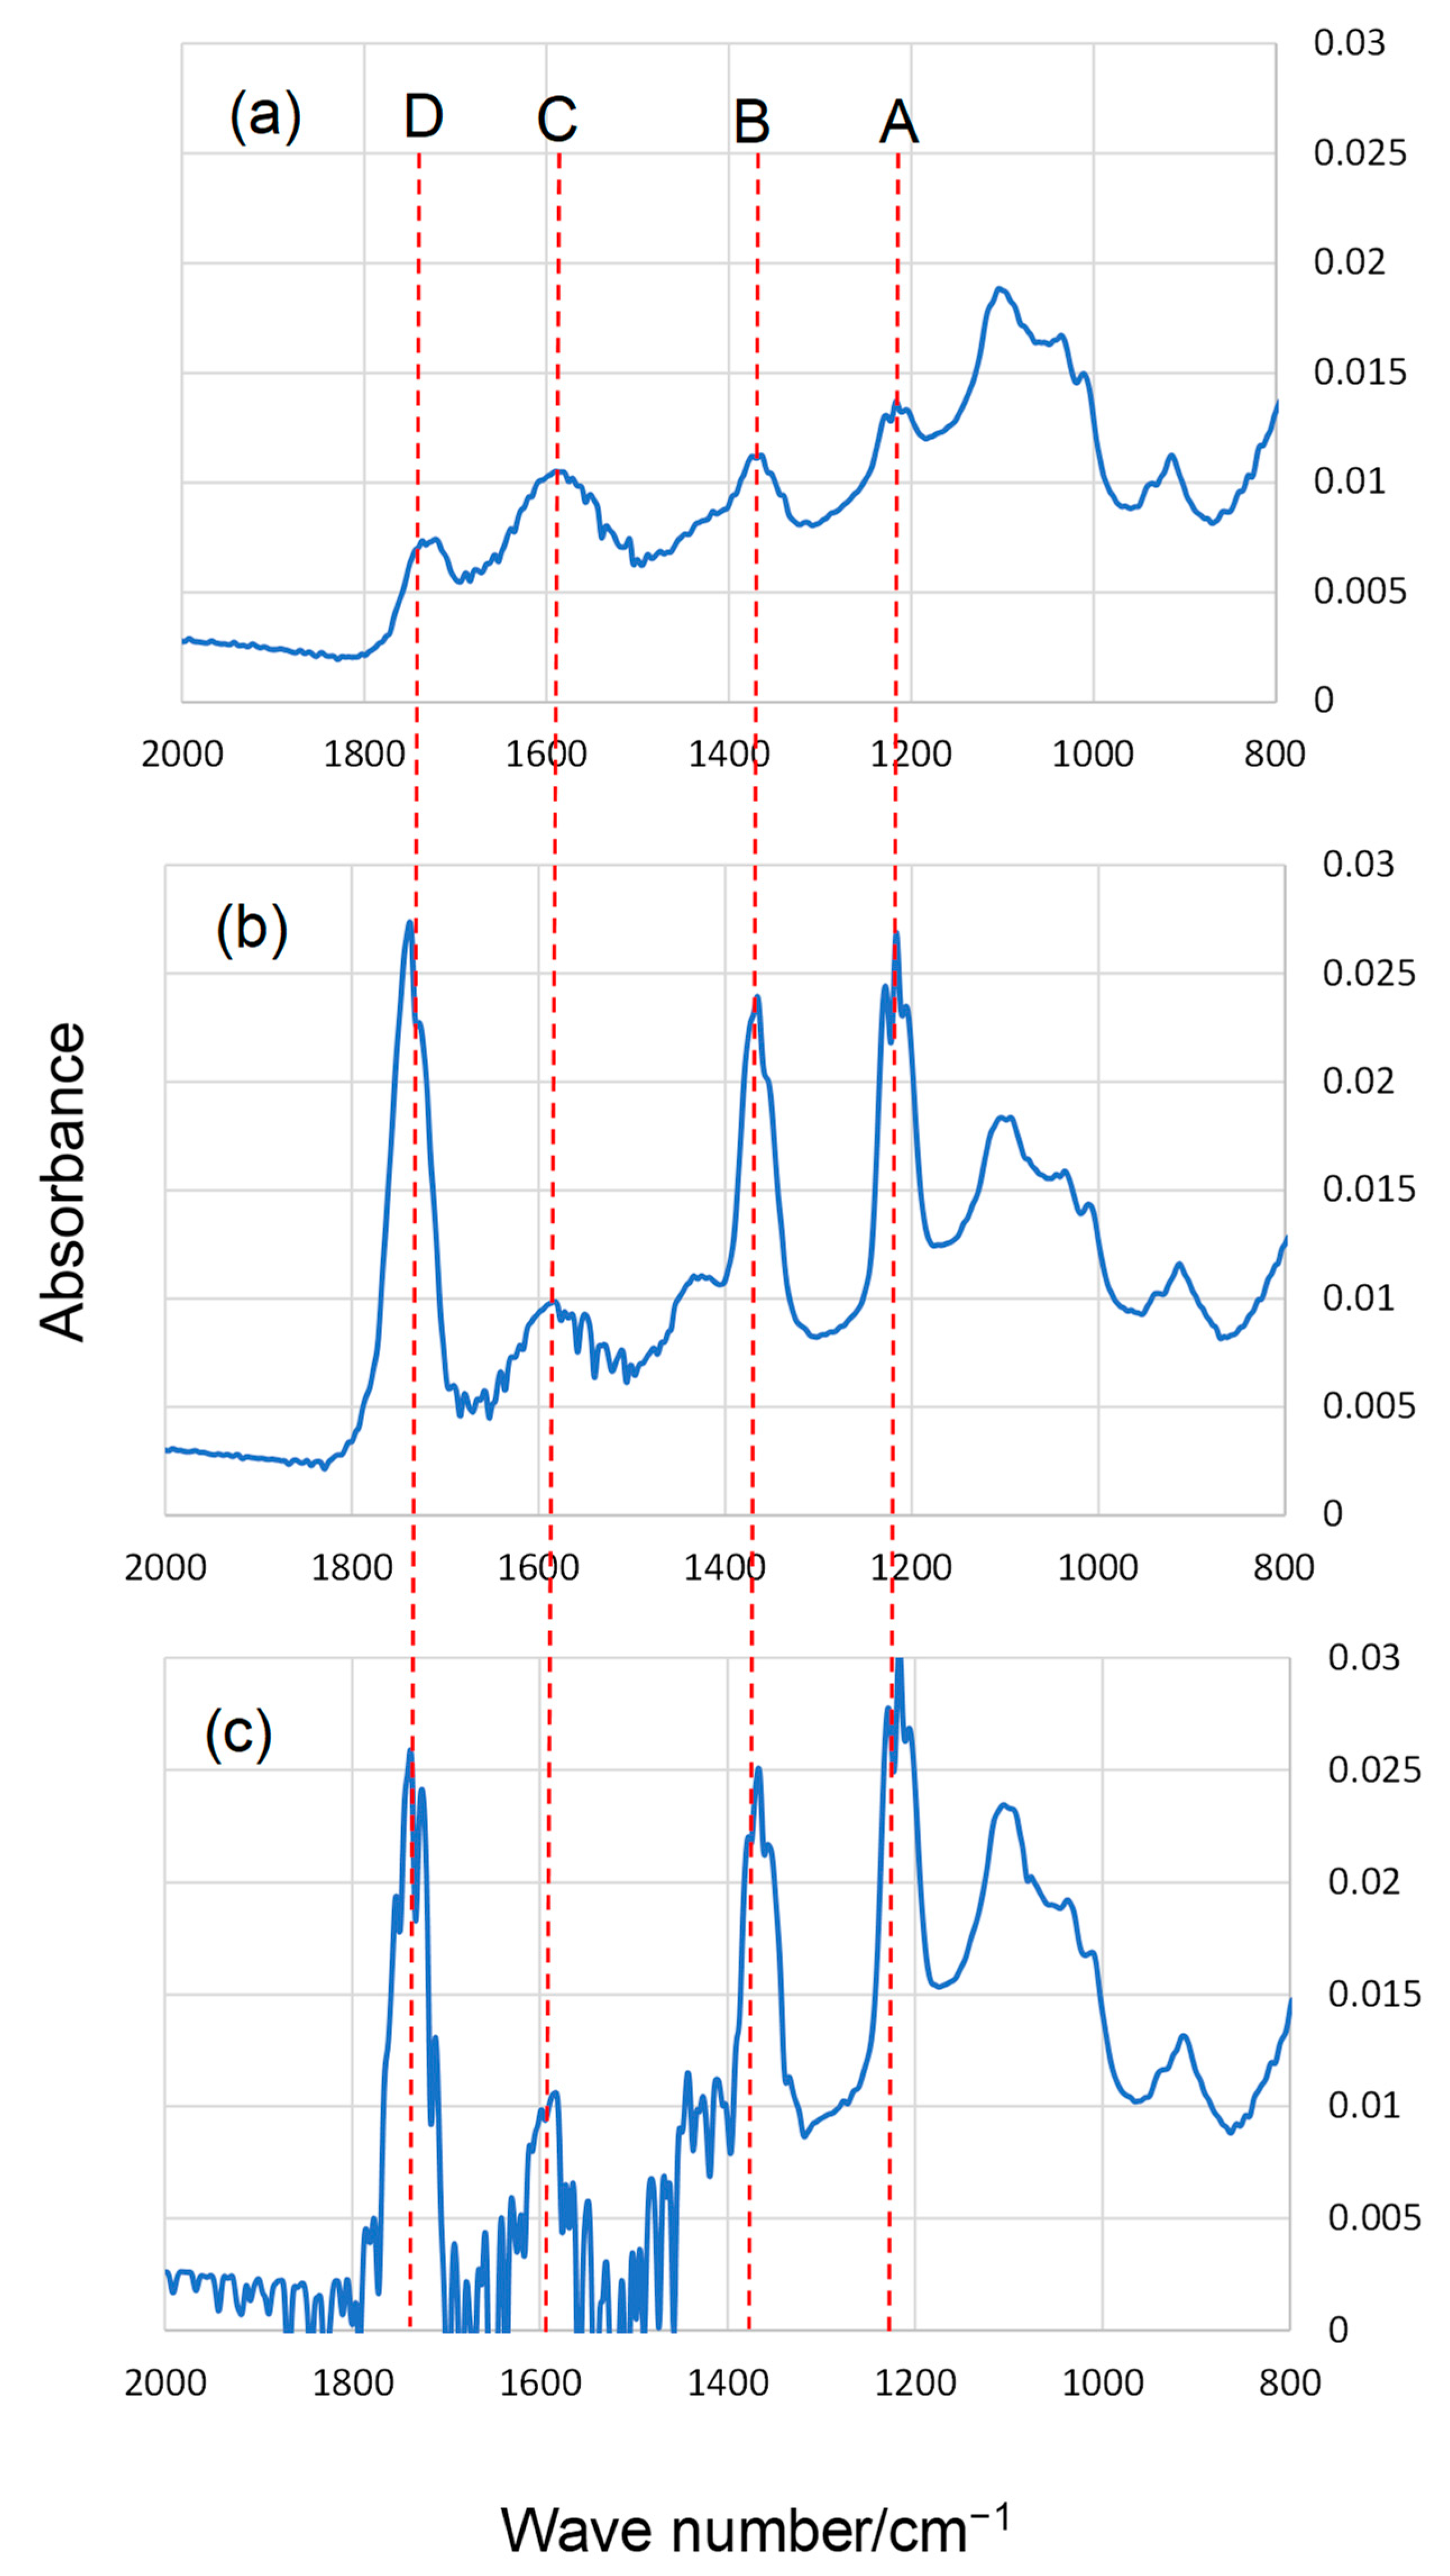
A 5-mg sample of HA in a Petri dish (1.9 cm ID × 1.0 cm depth) was irradiated with UV light that was generated from six black-light fluorescent lamps (FL20S.BLB 20W from Toshiba Corporation, Tokyo, Japan) for a specified period of time in an indoor air environment (20°C and 30% relative humidity) (Figure S3). The maximum emission wavelength of the black-light lamps was 360 nm. The intensity of the UV radiation at the sample installation position, measured using an UV intensity meter (UV-340c; CUSTOM Corporation, Tokyo, Japan), was 205 μW/cm2. The irradiation time was varied at 0, 0.5, 1, 2, 4, 6, 8, and 10 h. Irradiations were performed twice for each reaction time. The HA after the irradiation was applied to the sample preparation at each reaction time according to Section 2.2. Each prepared sample solution was divided into three portions, which were then subjected to the DTT assay. The average value of the six assay results at the same reaction time was calculated and displayed in Figure 2.

2.6. FT-IR Analysis

The FT-IR spectra of HA samples were obtained by an infrared spectrophotometer (FT/IR-6100 from Jasco Corporation, Tokyo, Japan) before and after ozone exposure or UV irradiation. The spectra were acquired using an attenuated total reflection method with an integration frequency and measurement range of 500 times and 500–4000 cm−1, respectively. No special sample preparation was required in the FT-IR analysis.

3. Results and Discussion

The DTT consumption rates of HA before and after ozone exposure are compared in Figure 1. The results of two-sided tests with their significance levels are marked by asterisks (* p < 0.05, *** p < 0.001). The ozone exposure increased the DTT consumption rate of HA; however, the differences compared to pre-exposure rates were significant only after 10 and 24 h of exposure.
The DTT consumption rates of HA before and after UV irradiation are compared in Figure 2. The results of two-sided tests with their significance levels are marked by asterisks (* p < 0.05, ** p < 0.01, *** p < 0.001). The DTT consumption rates increased gradually with the UV irradiation time, indicating that the OP of HA increased due to UV irradiation. This clearly suggests that the chemical reaction in the UV irradiation of HA affected the OP.
In the reaction with ozone, the relative DTT consumption rates were 1.11 ± 0.03 and 1.21 ± 0.03 after 10 and 24 h, respectively (Figure 1). On the other hand, the rate after 10 h of UV irradiation was 1.47 ± 0.09 (Figure 2), indicating that UV irradiation showed a stronger effect on OP than the ozone reaction.
Typical FT-IR spectra in the range of 800–2000 cm−1 of HA before and after ozone exposure and UV irradiation are shown in Figure 3 and Figure 4, respectively. The peaks were assigned as follows [35]: peak A (around 1220 cm−1) was from C–O–H phenolic, C–O stretching of phenol, C–O stretching of alcohols, and bending of phenol OH and alcohol OH; peak B (1350–1400 cm−1) was from the symmetric ring breathing of aromatics, C–H and O–H bending modes, and C–H deformations of CH3 and CH2; peak C (around 1600 cm−1) was from the asymmetric COO– stretching of carboxylate with partial protonation from neighboring carboxyl groups, C=O stretching of quinones, aromatic C=C, and symmetric stretching of COO–; and peak D (around 1720 cm−1) was from the C=O stretching of carboxylic acid, aldehydes, esters, ketones, and saturated ethers. Similar IR spectra were obtained from the analysis of authentic fulvic acid from the Suwanee River [36]. The heights of peaks A, B, and D increased after both ozone exposure and UV irradiation. The increases were more notable in the UV irradiation. For example, after UV irradiation (Figure 4), the heights of peaks A, B, and D were approximately 2× higher than after the reaction with ozone for the same time (Figure 3). This trend is consistent with the DTT assay results. Peaks A, B, and D were attributed to the C=O bonds, phenol OH, and carboxyl groups of HA. Oxidation, which changed the structure of HA, proceeded under both ozone exposure and UV irradiation. It has been reported that similar results were partially obtained by ozone exposure or UV irradiation of aqueous HA [37,38,39]. There was no substantial difference between panels b and c in Figure 4. Moreover, the difference in the peak heights between panels b and c in Figure 3 was unclear. This is consistent with the finding that there was no significant difference in the DTT activity after the reactions conducted for 6 and 10 h (Figure 1 and Figure 2).
A typical structure of HULIS and the structural formula of PQN, which is a representative PAHQ, are shown in Figure 5. PAHQ includes ketone groups in its structure. For example, PQN with two ketone groups at the ortho position produces more ROS than stoichiometrically expected through catalytic redox reactions [8]. The generation of PAHQ is known to be via the photo-oxidation of PAH and oxidation of PAH with ozone. Molecules of the parent PAH of PQN (i.e., phenanthrene) easily absorb sunlight because of their wide electron delocalization, which induces electron transitions from a ground state to an excited state with a higher energy. The reaction between light-excited phenanthrene and O2 finally leads to oxidation products (e.g., PQN) [40,41]. Oxidized PAH molecules have also been identified in products from heterogeneous reactions of PAH with ozone. Two mechanisms have been proposed for the reaction, including the one-step electrophilic-nucleophilic attack of ozone on the olefin bonds of PAH and the atom-attack of ozone on the most electrophilic position. The former reaction mechanism tends to yield ring-opened products such as aldehydes and carboxylic acids [42]. The latter reaction mechanism leads ultimately to the formation of quinones. HA possesses no specific chemical structures; however, it contains benzene rings in its structure [43]. In addition, some hydrogens in its benzene rings are substituted by hydroxyl or ketone groups [44]. The hydroxyl groups of aromatics are transformed easily by further oxidation to ketone groups [45]. Therefore, under ozone exposure or UV irradiation, HA is potentially partially oxidized to PAHQ-like structures [7], which likely contributed to the increased OP of HA. To verify this, a detailed structural analysis by nuclear magnetic resonance (NMR) spectroscopy, fluorescence spectroscopy, and high-resolution mass spectrometry is required in future studies [46,47,48]. In this study, the exposed ozone concentration was >10 × the ambient concentration [34]. A typical UV intensity during daytime on the earth surface is fairly higher (>5000 μW/cm2) [49,50] than that of the experimental condition (205 μW/cm2). Therefore, UV-induced oxidation is an important factor that increases the OP of atmospheric HULIS.

4. Conclusions

The OP changes in HA (a model HULIS material) caused by ozone exposure and UV irradiation were determined by the DTT assay. After UV irradiation, the OP of HA was significantly increased from its pre-irradiated level. FT-IR analysis showed an increased intensity in the C=O peak in the irradiated HA structure. It was suggested that the PAHQ-like structure formed by the oxidation increased the OP of HA. To the best of our knowledge, this is the first study that showed that the changes in the chemical structure of HA due to oxidation led to an increase in OP. We also suggest that atmospheric oxidation, especially photo-oxidation by UV irradiation, increases the hazard of HULIS in the environment.

Supplementary Materials

The following are available online at https://www.mdpi.com/article/10.3390/atmos13060976/s1, Figure S1: Flow chart of the experimental procedure; Figure S2: Schematic diagram of the equipment for the ozone reaction; Figure S3: Photos of the apparatus for the UV-irradiation experiments.

Author Contributions

Conceptualization, T.K.; validation, Y.K. and T.K.; investigation, Y.K.; writing—original draft preparation, Y.K.; writing—review and editing, T.K. and Y.K.; supervision, T.K. All authors have read and agreed to the published version of the manuscript.

Funding

This research received no external funding.

Institutional Review Board Statement

Not applicable.

Informed Consent Statement

Not applicable.

Data Availability Statement

Not applicable.

Conflicts of Interest

The authors declare no conflict of interest.

References

  1. Pinkerton, K.E.; Zhou, Y.; Zhong, C.; Smith, K.R.; Teague, S.V.; Kennedy, I.M.; Men-ache, M.G. Mechanisms of Particulate Matter Toxicity in Neonatal and Young Adult Rat Lungs. Res. Rep. Health Eff. Inst. 2008, 135, 3–41. Available online: https://www.healtheffects.org/system/files/Pinkerton135.pdf (accessed on 19 January 2022).
  2. Araujo, J.A.; Nel, A.E. Particulate matter and atherosclerosis: Role of particle size, composition and oxidative stress. Part. Fibre Toxicol. 2009, 6, 24. [Google Scholar] [CrossRef] [PubMed] [Green Version]
  3. Jiang, H.; Ahmed, C.M.S.; Canchola, A.; Chen, J.Y.; Lin, Y.H. Use of Dithiothreitol Assay to Evaluate the Oxidative Potential of Atmospheric Aerosols. Atmosphere 2019, 10, 571. [Google Scholar] [CrossRef] [Green Version]
  4. Konemura, A.; Akutsu, Y.; Sakai, H.; Ito, T. Method for Analyzing the Contribution of Components of Diesel Exhaust Particles to Oxidative potential. JARI Res. J. 2013, JRJ20130104. Available online: https://jari.g.kuroco-img.app/v=1641539267/files/user/pdf/JRJ20130104_q.pdf (accessed on 19 January 2022). (In Japanese).
  5. Fang, T.; Verma, V.; Bates, J.T.; Abrams, J.; Klein, M.; Strickland, M.J.; Sarnat, S.E.; Chang, H.H.; Mulholland, J.A.; Tolbert, P.E.; et al. Oxidative potential of ambient water-soluble PM2.5 in the southeastern United States: Contrasts in sources and health associations between ascorbic acid (AA) and dithiothreitol (DTT) assays. Atmos. Chem. Phys. 2016, 16, 3865–3879. [Google Scholar] [CrossRef] [Green Version]
  6. Charrier, J.G.; Anastasio, C. On dithiothreitol (DTT) as a measure of oxidative potential for ambient particles: Evidence for the importance of soluble transition metals. Atmos. Chem. Phys. 2012, 12, 9321–9333. [Google Scholar] [CrossRef] [Green Version]
  7. Bates, J.T.; Fang, T.; Verma, V.; Zeng, L.; Weber, R.J.; Tolbert, P.E.; Abrams, J.Y.; Sarnat, S.E.; Klein, M.; Mulholland, J.A.; et al. Review of Acellular Assays of Ambient Particulate Matter Oxidative Potential: Methods and Relationships with Composition, Sources, and Health Effects. Environ. Sci. Technol. 2019, 53, 4003–4019. [Google Scholar] [CrossRef]
  8. Motoyama, Y.; Bekki, K.; Chung, S.W.; Tang, N.; Kameda, T.; Toriba, A.; Taguchi, K.; Hayakawa, K. Oxidative Stress More Strongly Induced by ortho- Than para-quinoid Polycyclic Aromatic Hydrocarbons in A549 Cells. J. Health Sci. 2009, 55, 845–850. [Google Scholar] [CrossRef] [Green Version]
  9. McWhinney, R.D.; Badali, K.; Liggio, J.; Li, S.M.; Abbatt, J.P.D. Filterable Redox Cycling Activity: A Comparison between Diesel Exhaust Particles and Secondary Organic Aerosol Constituents. Environ. Sci. Technol. 2013, 47, 3362–3369. [Google Scholar] [CrossRef]
  10. Pant, P.; Baker, S.J.; Shukla, A.; Maikawa, C.; Pollitt, K.J.G.; Harrison, R.M. The PM10 fraction of road dust in the UK and India: Characterization, source profiles and oxidative potential. Sci. Total Environ. 2015, 530, 445–452. [Google Scholar] [CrossRef]
  11. Antinolo, M.; Willis, M.D.; Zhou, S.M.; Abbatt, J.P.D. Connecting the oxidation of soot to its redox cycling abilities. Nat. Commun. 2015, 6, 7. [Google Scholar] [CrossRef] [Green Version]
  12. Xiong, Q.S.; Yu, H.R.; Wang, R.R.; Wei, J.L.; Verma, V. Rethinking Dithiothreitol-Based Particulate Matter Oxidative Potential: Measuring Dithiothreitol Consumption versus Reactive Oxygen Species Generation. Environ. Sci. Technol. 2017, 51, 6507–6514. [Google Scholar] [CrossRef] [PubMed]
  13. Li, Y.; Zhu, T.; Zhao, J.C.; Xu, B.Y. Interactive Enhancements of Ascorbic Acid and Iron in Hydroxyl Radical Generation in Quinone Redox Cycling. Environ. Sci. Technol. 2012, 46, 10302–10309. [Google Scholar] [CrossRef] [PubMed]
  14. Charrier, J.G.; Anastasio, C. Rates of Hydroxyl Radical Production from Transition Metals and Quinones in a Surrogate Lung Fluid. Environ. Sci. Technol. 2015, 49, 9317–9325. [Google Scholar] [CrossRef] [Green Version]
  15. Yu, H.; Wei, J.; Cheng, Y.; Subedi, K.; Verma, V. Synergistic and Antagonistic Interactions among the Particulate Matter Components in Generating Reactive Oxygen Species Based on the Dithiothreitol Assay. Environ. Sci. Technol. 2018, 52, 2261–2270. [Google Scholar] [CrossRef] [PubMed]
  16. Gonzalez, D.H.; Cala, C.K.; Peng, Q.; Paulson, S.E. HULIS Enhancement of Hydroxyl Radical Formation from Fe(II): Kinetics of Fulvic Acid–Fe(II) Complexes in the Presence of Lung Antioxidants. Environ. Sci. Technol. 2017, 51, 7676–7685. [Google Scholar] [CrossRef]
  17. Dou, J.; Lin, P.; Kuang, B.-Y.; Yu, J.Z. Reactive Oxygen Species production mediated by Humic-like substances in Atmospheric Aerosols: Enhancement effects by pyridine, imidazole and their derivatives. Environ. Sci. Technol. 2015, 49, 6457–6465. [Google Scholar] [CrossRef] [PubMed] [Green Version]
  18. Verma, V.; Martinez, R.R.; Kotra, N.; King, L.; Liu, J.; Snell, T.W.; Weber, R.J. Contribution of Water-Soluble and Insoluble Components and Their Hydrophobic/Hydrophilic Subfractions to the Reactive Oxygen Species-Generating Potential of Fine Ambient Aerosols. Environ. Sci. Technol. 2012, 46, 11384–11392. [Google Scholar] [CrossRef]
  19. Lin, P.; Yu, J.Z. Generation of Reactive Oxygen Species Mediated by Humic-like Substances in Atmospheric Aerosols. Environ. Sci. Technol. 2011, 45, 10362–10368. [Google Scholar] [CrossRef]
  20. Grader, E.R.; Rudich, Y. Atmospheric HULIS: How humic-like are they? A comprehensive and critical review. Atmos. Chem. Phys. 2006, 6, 729–753. [Google Scholar] [CrossRef] [Green Version]
  21. Win, M.S.; Tian, Z.; Zhao, H.; Xiao, K.; Peng, J.; Shang, Y.; Wu, M.; Xiu, G.; Lu, S.; Yonemochi, S.; et al. Atmospheric HULIS and its ability to mediate the reactive oxygen species (ROS): A review. J. Environ. Sci. 2017, 71, 13–31. [Google Scholar] [CrossRef]
  22. Mayol-Bracero, O.L.; Guyon, P.; Graham, B.; Roberts, G.; Andreae, M.O.; Decesari, S.; Facchini, M.C.; Fuzzi, S.; Artaxo, P. Water-soluble organic compounds in biomass burning aerosols over Amazonia—2. Apportionment of the chemical composition and importance of the polyacidic fraction. J. Geophys. Res. Atmos. 2002, 107, LBA 59-1–LBA 59-15. [Google Scholar] [CrossRef]
  23. Gelencser, A.; Sallai, M.; Krivacsy, Z.; Kiss, G.; Meszaros, E. Voltammetric evidence for the presence of humic-like substances in fog water. Atmos. Res. 2000, 54, 157–165. [Google Scholar] [CrossRef]
  24. Laskin, A.; Laskin, J.; Nizkorodov, S.A. Chemistry of Atmospheric Brown Carbon. Chem. Rev. 2015, 115, 4335–4382. [Google Scholar] [CrossRef] [PubMed] [Green Version]
  25. Tuet, W.Y.; Chen, Y.; Fok, S.; Gao, D.; Weber, R.J.; Champion, J.A.; Ng, N.L. Chemical and cellular oxidant production induced by naphthalene secondary organic aerosols (SOA): Effect of redox-active metals and photochemical aging. Sci. Rep. 2017, 7, 15157. Available online: https://www.nature.com/articles/s41598-017-15071-8 (accessed on 14 April 2022). [CrossRef]
  26. Jiang, H.; Jang, M. Dynamic Oxidative Potential of Atmospheric Organic Aerosol under Ambient Sun-light. Environ. Sci. Technol. 2018, 52, 7496–7504. [Google Scholar] [CrossRef]
  27. Ma, Y.; Cheng, Y.; Qiu, X.; Cao, G.; Fang, Y.; Wang, J.; Zhu, T.; Yu, J.; Hu, D. Sources and oxidative potential of water-soluble humic-like substances (HULISWS) in fine particulate matter (PM2.5) in Beijing. Atmos. Chem. Phys. 2018, 18, 5607–5617. [Google Scholar] [CrossRef] [Green Version]
  28. Ye, C.; Chen, H.; Hoffmann, E.H.; Mettke, P.; Tilgner, A.; He, L.; Mutzel, A.; Brüggemann, M.; Poulain, L.; Schaefer, T.; et al. Particle-Phase Photoreactions of HULIS and TMIs Establish a Strong Source of H2O2 and Particulate Sulfate in the Winter North China Plain. Environ. Sci. Technol. 2021, 55, 7818–7830. [Google Scholar] [CrossRef]
  29. Wong, J.P.S.; Tsagkaraki, M.; Tsiodra, I.; Mihalopoulos, N.; Violaki, K.; Kanakidou, M.; Sciare, J.; Nenes, A.; Weber, R.J. Effects of Atmospheric Processing on the Oxidative Potential of Biomass Burning Organic Aerosols. Environ. Sci. Technol. 2019, 53, 6747–6756. [Google Scholar] [CrossRef]
  30. Malcolm, R.L.; MacCarthy, P. Limitations in the use of commercial humic acids in water and soil research. Environ. Sci. Technol. 1986, 20, 904–911. [Google Scholar] [CrossRef]
  31. Kipton, H.; Powell, J.; Town, R.M. Solubility and fractionation of humic acid; effect of pH and ionic medium. Anal. Chim. Acta. 1992, 267, 47–54. [Google Scholar] [CrossRef]
  32. Shirshovaa, L.T.; Ghabbourb, E.A.; Daviesb, G. Spectroscopic characterization of humic acid fractions isolated from soil using different extraction procedures. Geoderma. 2006, 133, 204–216. [Google Scholar] [CrossRef]
  33. Okubo, R.; Kameda, T.; Tohno, S. Evaluation of oxidative potential of pyrenequinone isomers by the dithiothreitol (DTT) assay. Polycycl. Aromat. Compd. 2021, 1–8. [Google Scholar] [CrossRef]
  34. Fleming, Z.L.; Doherty, R.M.; Schneidemesser, E.v.; Malley, C.S.; Cooper, O.W.; Pinto, J.P.; Colette, A.; Xu, X.; Simpson, D.; Schultz, M.G.; et al. Tropospheric Ozone Assessment Report: Present-day ozone distribution and trends relevant to human health. Elem. Sci. Anth. 2018, 6, 12. [Google Scholar] [CrossRef] [Green Version]
  35. Kim, D.; Grassian, V.H. Attenuated Total Reflection-Fourier Transform Infrared and Atomic Force Microscopy-Infrared Spectroscopic Investigation of Suwannee River Fulvic Acid and Its Interactions with α-FeOOH. ACS Earth Space Chem. 2022, 6, 81–89. [Google Scholar] [CrossRef]
  36. Ghio, A.J.; Gonzalez, D.H.; Paulson, S.E.; Soukup, J.M.; Dailey, L.A.; Madden, M.C.; Mahler, B.; Elmore, S.A.; Schladweiler, M.C.; Kodavanti, U.P. Ozone Reacts With Carbon Black to Produce a Fulvic Acid-Like Substance and Increase an Inflammatory Effect. Toxicol. Pathol. 2020, 48, 887–898. [Google Scholar] [CrossRef]
  37. Rodríguez, F.J.; Schlenger, P.; García-Valverde, M. Monitoring changes in the structure and properties of humic substances following ozonation using UV–Vis, FTIR and H NMR techniques. Sci. Total Environ. 2016, 541, 623–637. [Google Scholar] [CrossRef]
  38. Ma, Y.S. Reaction Mechanisms for DBPS Reduction in Humic Acid Ozonation. Ozone Sci. Eng. 2004, 6, 153–164. [Google Scholar] [CrossRef]
  39. Wang, H.; Zhu, Y.; Hu, C.; Hu, X. Treatment of NOM fractions of reservoir sediments: Effect of UV and chlorination on formation of DBPs. Sep. Purif. Technol. 2015, 154, 228–235. [Google Scholar] [CrossRef]
  40. Vione, D.; Maurino, V.; Minero, C.; Pelizzetti, E.; Harrison, M.A.; Olariu, R.I.; Arsene, C. Photochemical reactions in the tropospheric aqueous phase and on particulate matter. Chem. Soc. Rev. 2006, 35, 441–453. [Google Scholar] [CrossRef]
  41. Haynes, J.P.; Miller, K.E.; Majestic, B.J. Investigation into Photoinduced Auto-Oxidation of Polycyclic Aromatic Hydrocarbons Resulting in Brown Carbon Production. Environ. Sci. Technol. 2019, 53, 682–691. [Google Scholar] [CrossRef]
  42. Keyte, I.J.; Harrisonz, R.M.; Lammel, G. Chemical reactivity and long-range transport potential of polycyclic aromatic hydrocarbons—A review. Chem. Soc. Rev. 2013, 42, 9333–9391. [Google Scholar] [CrossRef] [PubMed]
  43. Vecchio, R.D.; Schendorf, T.M.; Blough, N.V. Contribution of Quinones and Ketones/Aldehydes to the Optical Properties of Humic Substances (HS) and Chromophoric Dissolved Organic Matter (CDOM). Environ. Sci. Technol. 2017, 51, 13624–13632. [Google Scholar] [CrossRef] [PubMed]
  44. Hays, M.; Holder, A.; Gullett, B.; Geron, C.; Hemming, B. The Chemical Composition of Aerosols from Wildland Fire: Current State of the Science and Possible New Directions. In Proceedings of the International Smoke Symposium, Hyattsville, MD, USA, 21—24 October 2013; Available online: https://cfpub.epa.gov/si/si_public_file_download.cfm?p_download_id=522075&Lab=NRMRL (accessed on 3 January 2022).
  45. Sánchez, N.M.; Klerk, A.D. Autoxidation of aromatics. Appl. Petrochem. Res. 2018, 8, 55–78. [Google Scholar] [CrossRef] [Green Version]
  46. Chen, Q.; Ikemori, F.; Higo, H.; Asakawa, D.; Mochida, M. Chemical Structural Characteristics of HULIS and Other Fractionated Organic Matter in Urban Aerosols: Results from Mass Spectral and FT-IR Analysis. Environ. Sci. Technol. 2016, 50, 1721–1730. [Google Scholar] [CrossRef]
  47. Fan, X.; Wei, S.; Zhu, M.; Song, J.; Peng, P. Comprehensive characterization of humic-like substances in smoke PM2.5 emitted from the combustion of biomass materials and fossil fuels. Atmos. Chem. Phys. 2016, 16, 13321–13340. [Google Scholar] [CrossRef] [Green Version]
  48. Phillips, S.M.; Smith, G.D. Further Evidence for Charge Transfer Complexes in Brown Carbon Aerosols from Excitation–Emission Matrix Fluorescence Spectroscopy. J. Phys. Chem. A 2015, 119, 4545–4551. [Google Scholar] [CrossRef]
  49. Xu, J.; Gao, K. Photosynthetic contribution of UV-A to carbon fixation by macroalgae. Phycologia 2016, 55, 318–322. [Google Scholar] [CrossRef]
  50. Safety of Ultraviolet Radiation. Available online: https://www.marktec.co.jp/en/lecture/tabid/482/Default.aspx (accessed on 14 April 2022).
Figure 1. Dithiothreitol (DTT)-consumption rates of HA before and after ozone exposure (mean ± SD; N = 6; * p < 0.05, *** p < 0.001).
Atmosphere 13 00976 g001
Figure 2. DTT consumption rates of HA before and after UV irradiation (mean ± SD, N = 6; * p < 0.05, ** p < 0.01, *** p < 0.001).
Atmosphere 13 00976 g002
Figure 3. Typical FT-IR spectra of HA (a) before ozone exposure, (b) after 6 h ozone exposure, and (c) after 10 h ozone exposure (see text for detailed assignments of peaks A–D).
Atmosphere 13 00976 g003
Figure 4. Typical FT-IR spectra of HA (a) before UV irradiation, (b) after 6 h of UV irradiation, and (c) after 10 h of UV irradiation (see text for detailed assignments of peaks A–D).
Atmosphere 13 00976 g004
Figure 5. Typical structures of (a) HULIS [44] and (b) 9,10-phenanthrenequinone (PQN).
Atmosphere 13 00976 g005
Publisher’s Note: MDPI stays neutral with regard to jurisdictional claims in published maps and institutional affiliations.

