Article

Transmission Risk Prediction and Evaluation of Mountain-Type Zoonotic Visceral Leishmaniasis in China Based on Climatic and Environmental Variables

1
National Institute of Parasitic Diseases, Chinese Center for Disease Control and Prevention (Chinese Center for Tropical Diseases Research), WHO Collaborating Centre for Tropical Diseases; National Center for International Research on Tropical Diseases, NHC Key Laboratory of Parasite and Vector Biology, Shanghai 200025, China
2
College of Geography and Remote sensing Sciences, Xinjiang University, Urumqi 830046, China
3
Chinese Center for Tropical Diseases Research, School of Global Health, Shanghai Jiao Tong University School of Medicine, Shanghai 200025, China
4
State Key Laboratory of Desert and Oasis Ecology, Xinjiang Institute of Ecology and Geography, Chinese Academy of Sciences, Urumqi 830011, China
*
Authors to whom correspondence should be addressed.
These authors contributed equally to this work.
Atmosphere 2022, 13(6), 964; https://doi.org/10.3390/atmos13060964
Submission received: 27 May 2022 / Revised: 5 June 2022 / Accepted: 13 June 2022 / Published: 14 June 2022
(This article belongs to the Special Issue Advanced Climate Simulation and Observation)

Abstract

:
With global warming and socioeconomic developments, there is a tendency toward the emergence and spread of mountain-type zoonotic visceral leishmaniasis (MT-ZVL) in China. Timely identification of the transmission risk and spread of MT-ZVL is, therefore, of great significance for effectively interrupting the spread of MT-ZVL and eliminating the disease. In this study, 26 environmental variables—namely, climatic, geographical, and 2 socioeconomic indicators were collected from regions where MT-ZVL patients were detected during the period from 2019 to 2021, to create 10 ecological niche models. The performance of these ecological niche models was evaluated using the area under the receiver-operating characteristic curve (AUC) and true skill statistic (TSS), and ensemble models were created to predict the transmission risk of MT-ZVL in China. All ten ecological niche models were effective at predicting the transmission risk of MT-ZVL in China, and there were significant differences in the mean AUC (H = 33.311, p < 0.05) and TSS values among these ten models (H = 26.344, p < 0.05). The random forest, maximum entropy, generalized boosted, and multivariate adaptive regression splines showed high performance at predicting the transmission risk of MT-ZVL (AUC > 0.95, TSS > 0.85). Ensemble models predicted a transmission risk of MT-ZVL in the provinces of Shanxi, Shaanxi, Henan, Gansu, Sichuan, and Hebei, which was centered in Shanxi Province and presented high spatial clustering characteristics. Multiple ensemble ecological niche models created based on climatic and environmental variables are effective at predicting the transmission risk of MT-ZVL in China. This risk is centered in Shanxi Province and tends towards gradual radiation dispersion to surrounding regions. Our results provide insights into MT-ZVL surveillance in regions at high risk of MT-ZVL.

1. Introduction

Visceral leishmaniasis (VL), also known as kala-azar, is a zoonotic infectious disease caused by protozoan parasites of the genus Leishmania spp. and transmitted by the bite of infected Phlebotomus [1]. Currently, this zoonosis is mainly prevalent in 88 countries across East Africa, South Asia, South America, and the Mediterranean, and it is estimated that 200,000 to 400,000 new cases are diagnosed with VL across the world each year, including approximately 60,000 deaths due to a failure of timely treatment [2]. Globally, VL ranks second only to malaria among all parasitic diseases in terms of mortality [3,4]. VL was once prevalent in 650 counties across 16 provinces north of the Yangtze River in China, and approximately 530,000 cases were diagnosed with VL in China in 1951, with the majority reported in young and middle-aged individuals [5,6,7]. In China, VL is classified into three types—anthroponotic VL (AVL), mountain-type zoonotic VL (MT-ZVL), and desert-type zoonotic VL (DT-ZVL)—according to geographical landscapes, epidemiological characteristics, and the species of sand fly vectors [8].
Following concerted efforts for decades, VL was almost eradicated in the eastern and central plain regions of China in the early 1960s [9]. However, VL cases continue to be detected in western China, including Kashgar in Xinjiang Uygur Autonomous Region, southern Gansu Province, and northern Sichuan Province, and local clusters of VL have been reported occasionally [10,11,12]. Since 2000, the exacerbation of global warming, the implementation of the Conversion of Cropland to Forest and Grassland Program, and the afforestation of hillsides in central and western China have resulted in gradual improvements in natural ecological environments and rapid increases in the population density of wild species of Phlebotomus sinensis [13,14]. This has resulted in the re-emergence and spread of VL in hilly regions. In particular, clusters of MT-ZVL have reemerged in the provinces of Shanxi, Shaanxi, Henan, and Hebei [15,16]. Timely identification of the transmission risk and spread of MT-ZVL is, therefore, of great significance to effectively interrupt the reemergence and spread of VL and ultimately eliminate the disease.
Ecological niche models combine species occurrence data with environmental variables to estimate the ecological conditions of species distribution, thereby predicting the true or potential distribution [17]. Recently, ecological niche models have widely been employed to predict the transmission risk and trends of the spread of infectious diseases by unraveling the interplay between environmental factors and disease transmission [18,19]. Vector-borne tropical diseases, such as schistosomiasis [20], malaria [21], and VL [22,23], are more likely to be affected by climatic and eco-environmental variables, so ecological niche models are particularly suited to predicting their spread. Based on the data of Oncomelania hupensis distributions, ecological niche models were used to investigate the trends for O. hupensis spread and predict the potential transmission risk of schistosomiasis in China [24]. Based on the data indicating pathogen distributions, three ecological niche models were created to predict the transmission risk of schistosomiasis in Yunnan Province [25]. In addition, three ecological niche models were generated to predict the trends for MT-ZVL spread in the provinces of Shanxi and Henan [26]. To our knowledge, however, no previous study has predicted the potential transmission risk of MT-ZVL nationwide in China. In this study, multiple ecological niche models were created by using environmental variables based on updated national epidemiological data of MT-ZVL in China. The models were used to predict the transmission risk of MT-ZVL in China and to provide insights into VL surveillance and control in the country.

2. Materials and Methods
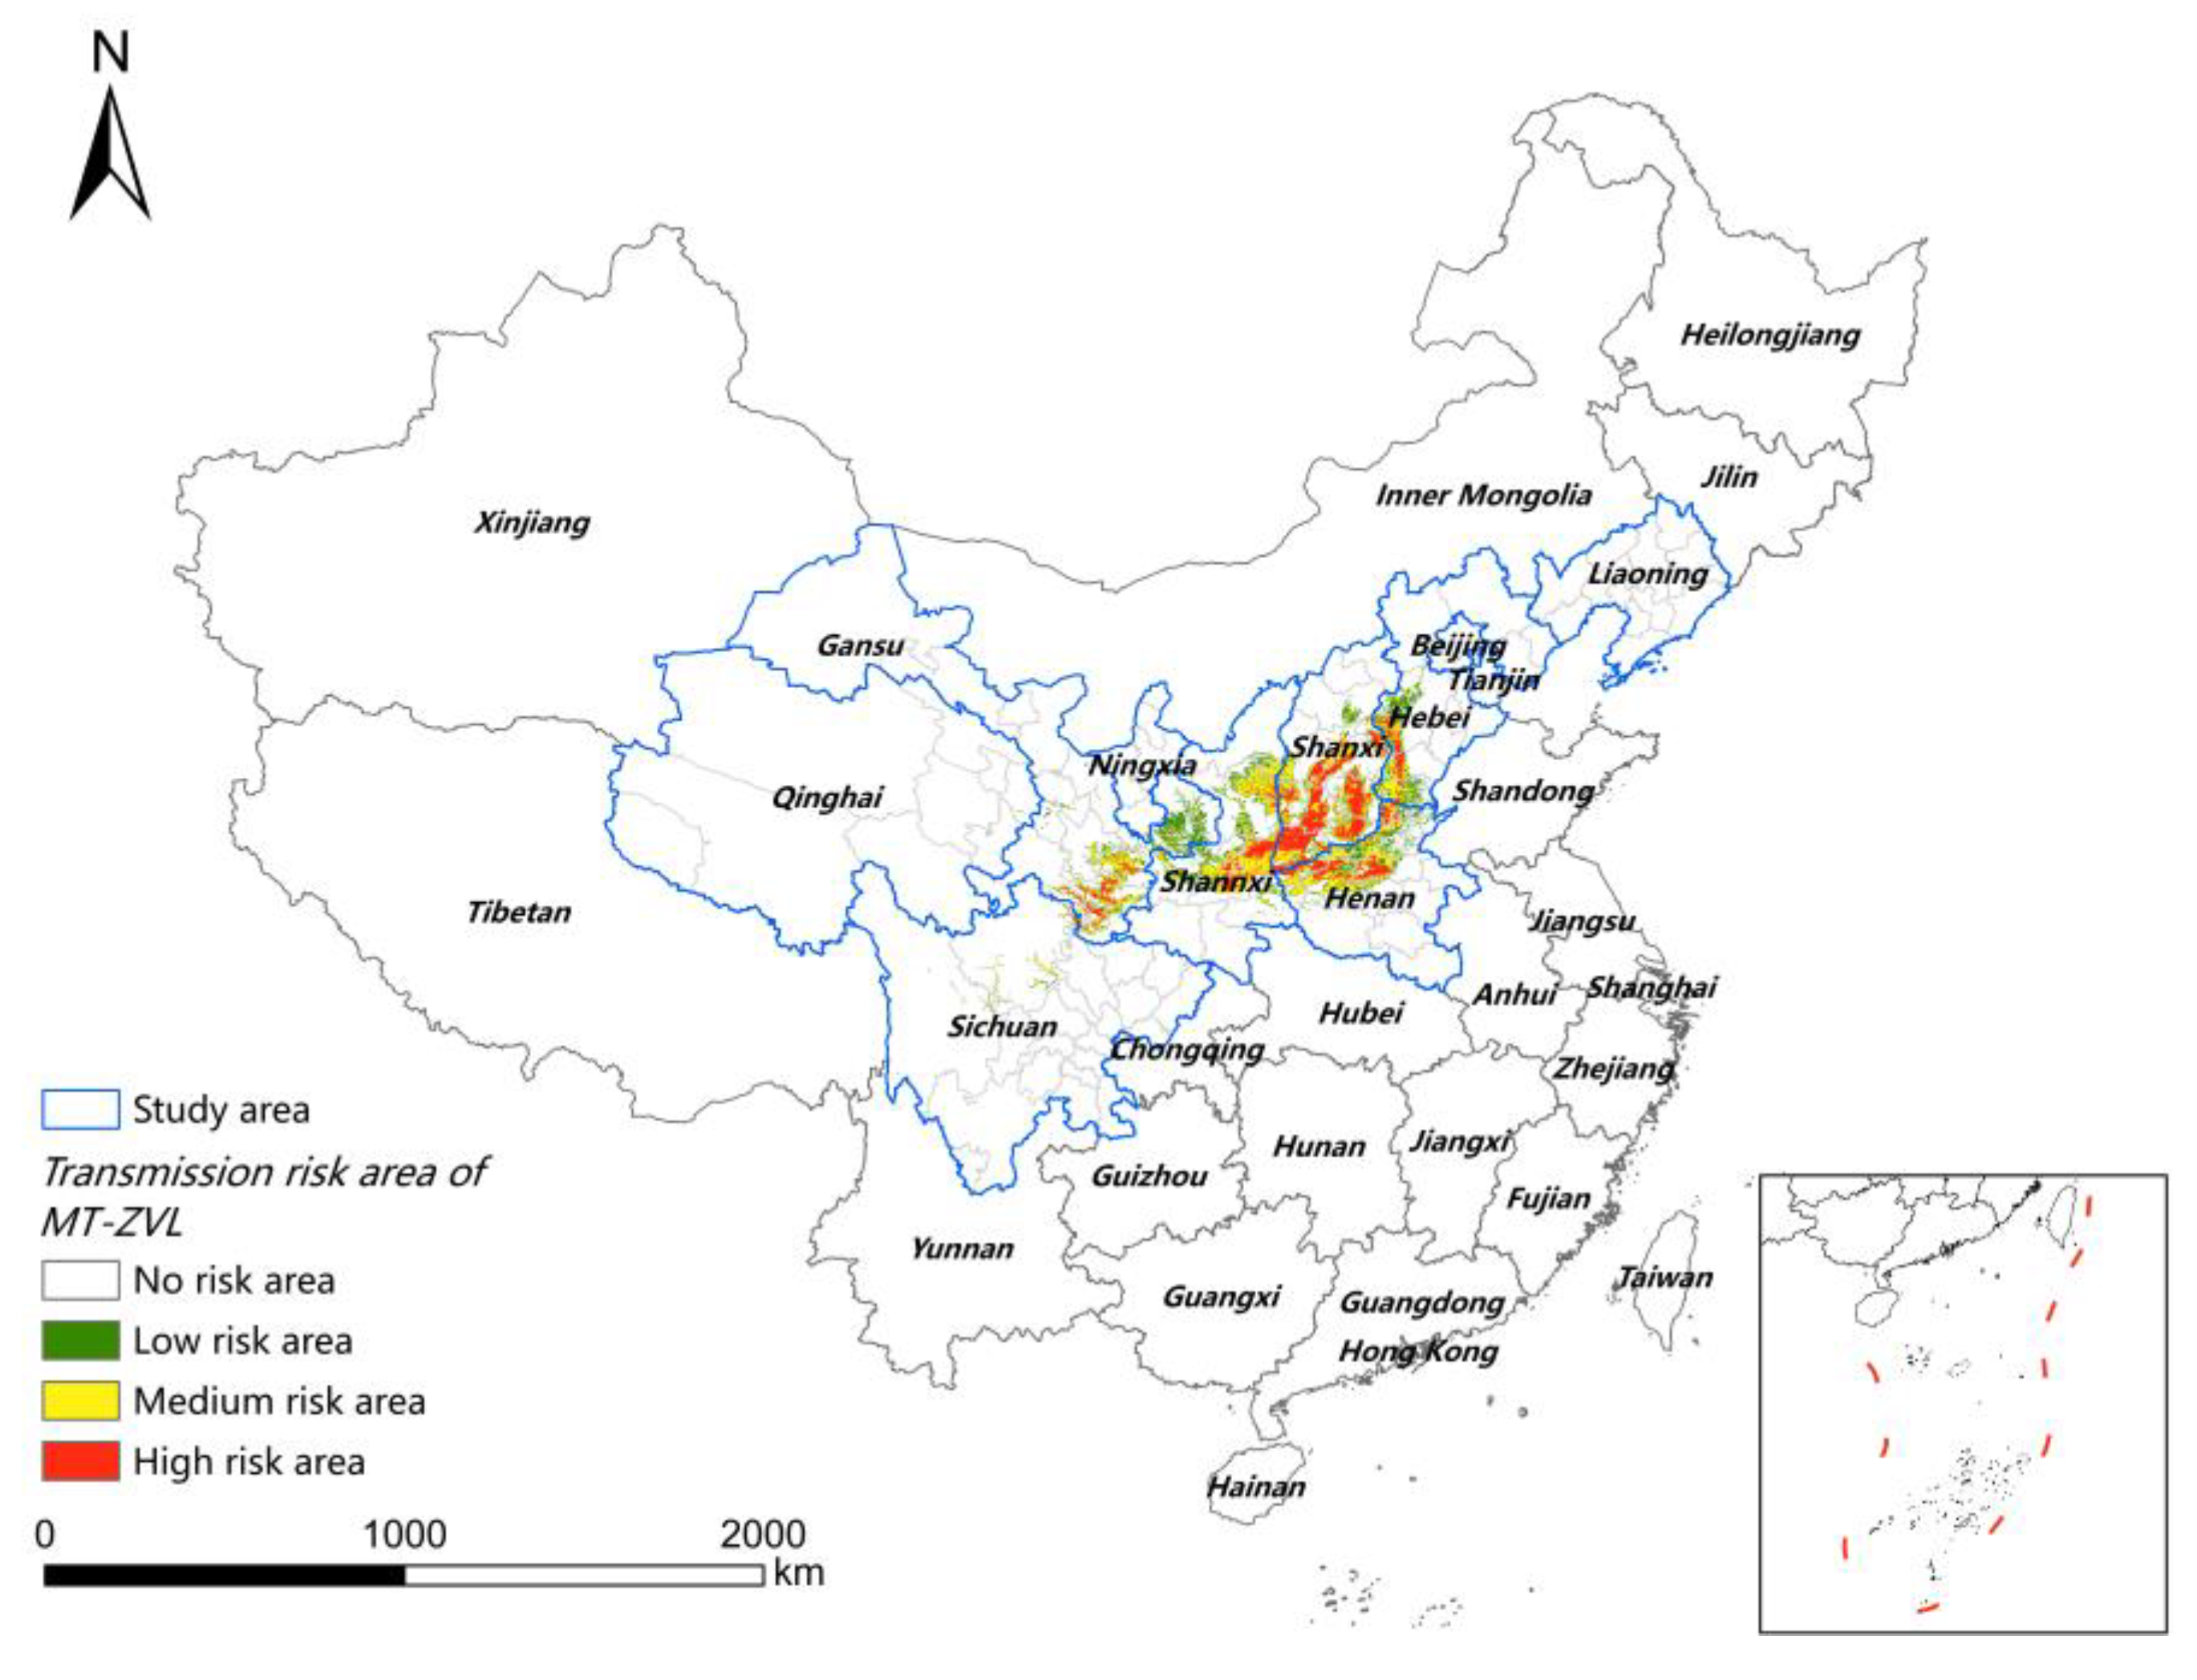
2.1. Study Area

Based on previous distributions of sand flies and recently reported VL cases, Gansu, Sichuan, Shanxi, Shaanxi, Henan, Hebei, Qinghai, Ningxia, Liaoning, and Beijing were selected as potential transmission foci of MT-ZVL [27,28]. This study area covers 113 cities and 1002 counties in central China, approximately one-third of the total land area of China. The area is delimited by Jiuquan City in Gansu Province to the north (43°43′ N, 96°38′ E), Liangshan Yi Autonomous Prefecture in Sichuan Province to the south (26°24′ N, 102°8′ E), Yushu Tibetan Autonomous Prefecture in Qinghai Province to the west (35°16′ N, 89°29′ E), and Fushun City in Liaoning Province to the east (40°53′ N, 125°36′ E). The study area has diverse ecological and climatic conditions divided by the Qin Mountains and has both temperate monsoon climates and continental climates. The precipitation and relative humidity gradually increase from the north to the south of the study area, and the temperature gradually increases. The sand fly Ph. chinensis, a primary vector for transmission of MT-ZVL in China, is predominantly identified in plains, hilly, and loess plateau regions at 30° N to 43° N and 102° E to 121° E, with elevations of 10 to 2750 m [29]. Local cases of MT-ZVL reported during the past five years were all concentrated in this region. Therefore, it is possible to examine the correlation between the distribution of MT-ZVL patients and potential P. sinensis distribution in this study area.

2.2. Collection of Case Data

All epidemiological data pertaining to MT-ZVL cases were collected from the National Notifiable Diseases Reporting System of the Chinese Center for Disease Control and Prevention. The townships or streets where local MT-ZVL cases were reported during the 2019–2021 period were defined as sampling sites, and the longitude and latitude coordinates were measured for each site. Then, each sampling site was checked to ensure the accuracy of the geographical coordinates. A total of 187 valid sampling sites were finally selected. In addition, the databases of reported cases from 2015 to 2018 were collected and combined to describe the trends of the disease.

2.3. Collection of Climatic and Environmental Variables

The environmental variable data pertaining to the distributions of VL and its vector sand flies were collected and finalized based on a literature review [30,31]. Ultimately, we included 19 climatic variables, 7 geographical variables, and 2 socioeconomic variables (Table 1). The climatic variables were extracted from the WorldClim website. Available online: https://www.worldclim.org/data/worldclim21.html (accessed on 25 April 2022). Geographical variables included elevation, type of landform, type of land use, annual normalized difference vegetation index, and type of vegetation coverage. The socioeconomic variables included gross domestic product and population density, provided by the Resource and Environment Data Center, Chinese Academy of Sciences (Beijing, China). Available online: https://www.resdc.cn (accessed on 25 April 2022). All environmental variable data were clipped to the study area using ArcGIS 10.2 (ESRI, Redlands, CA, USA) and a bilinear resampling algorithm with 1 × 1 km spatial resolution.

2.4. Ecological Niche Modeling

Multiple algorithms are available to create ecological niche models, and modeling with the same data may generate different results and predictive maps [32,33]. There is no consensus on an optimal single algorithm for ecological niche models [34,35]. Therefore, scientists are encouraged to overcome the uncertainty using different approaches. In our study, ten ecological niche models were generated based on four machine learning algorithms: the surface range envelope (SRE) model, based on an environmental envelope (threshold-based) algorithm; the generalized linear model (GLM), generalized additive model (GAM), and multivariate adaptive regression splines (MARS), based on statistical regression algorithms; the generalized boosted model (GBM), classification tree analysis (CTA), and flexible discriminant analysis (FDA), based on classification algorithms; and the maximum entropy (MaxEnt) model, artificial neural network (ANN), and random forest (RF) model, based on machine learning algorithms. All models were created using the BIOMOD2 package in R. As presence–absence data are required to create models, 500 absence points were randomly sampled at a ratio of 1:2 based on 186 presence points to create two sets of presence–absence data. Each set of data was classified into 75% training datasets and 25% validation datasets, which were input into the ten ecological niche models. Each run was repeated ten times for a single model with the same variables.

2.5. Assessment of the Performance of Ecological Niche Models

Currently, there are threshold-free and -associated measures to assess the performance of ecological niche models [19]. In this study, the area under the receiver-operating characteristic curve (AUC), a threshold-free index, and the true skill statistic (TSS), a threshold-related index, were employed to assess the performance of the ecological niche models. The AUC value, ranging from 0 to 1, indicates the predictive accuracy of the ecological niche models, and an AUC value approaching 1 indicates higher accuracy. The TSS value is not affected by the occurrence of the distribution, but it can accurately identify the accuracy of a model. TSS values range between −1 and 1, and a TSS value close to 1 indicates high accuracy. A TSS value of >0.7 is generally accepted as a satisfactory prediction. Both indices can be used to evaluate the predictive accuracy of ecological niche models. The AUC value can be used to assess the predictive accuracy of a model regardless of the data distribution [36], whereas the TSS measures the consistency between the prediction results by models and sample data [37]. Therefore, the combination of these two indices more comprehensively assesses the performance of ecological niche models.

2.6. Prediction of MT-ZVL Transmission Risk in China

Due to the uncertainty of predictions using a single ecological niche model, ensemble models were created based on a single model to improve the accuracy and reliability of predicting the transmission risk of MT-ZVL. Briefly, a single ecological niche model with a poor training efficiency was removed based on an AUC value of >0.90 and a TSS value of >0.85 to screen for ensemble models. Then, the prediction accuracy of a single ecological niche model was normalized such that the raster data ranged from 0 to 1. Following the definition of the weight according to TSS values, the predictive accuracy of ensemble models was estimated using a weighted mean of probabilities (WM). Four grades were classified based on the WM values: no-risk areas (WM, 0.5 and lower), low-risk areas (WM, 0.51 to 0.7), medium-risk areas (0.71 to 0.9), and high-risk areas (0.91 to 1). Finally, the model prediction results were loaded into ArcGIS software to map the transmission risk of MT-ZVL in China.

2.7. Statistical Analysis

In what follows, the AUC and TSS values are described as the mean ± standard deviation (SD). Comparisons of the AUC and TSS values were carried out using the Kruskal–Wallis H-test. A p-value of <0.05 was considered statistically significant.

3. Results

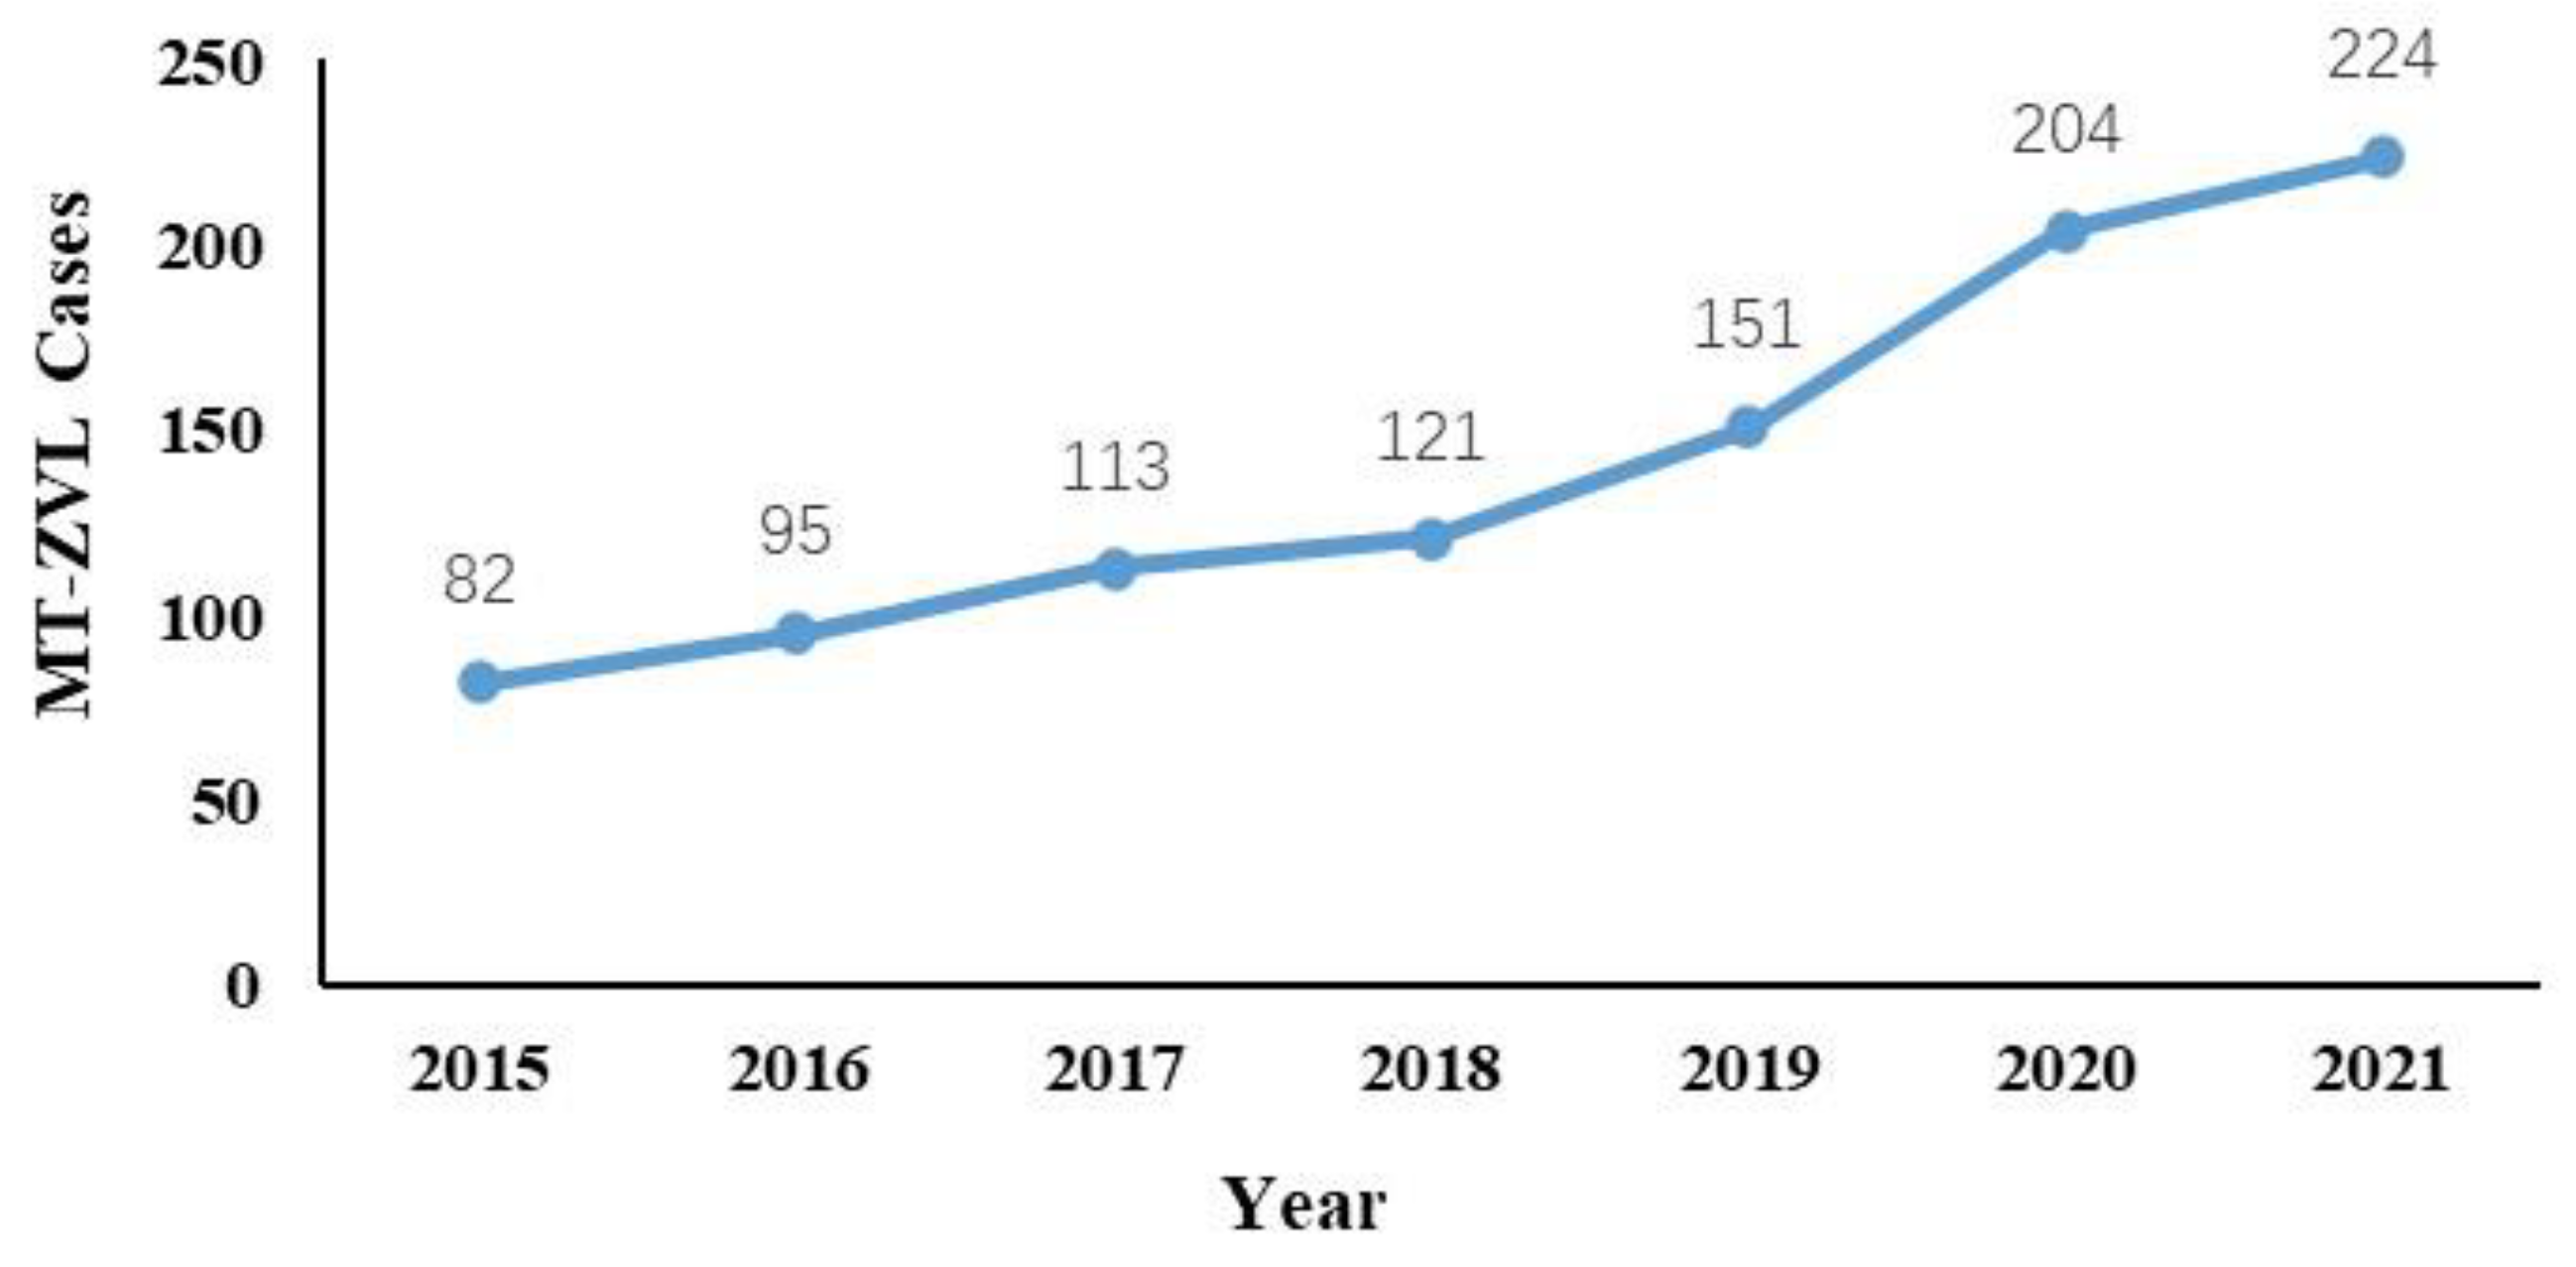
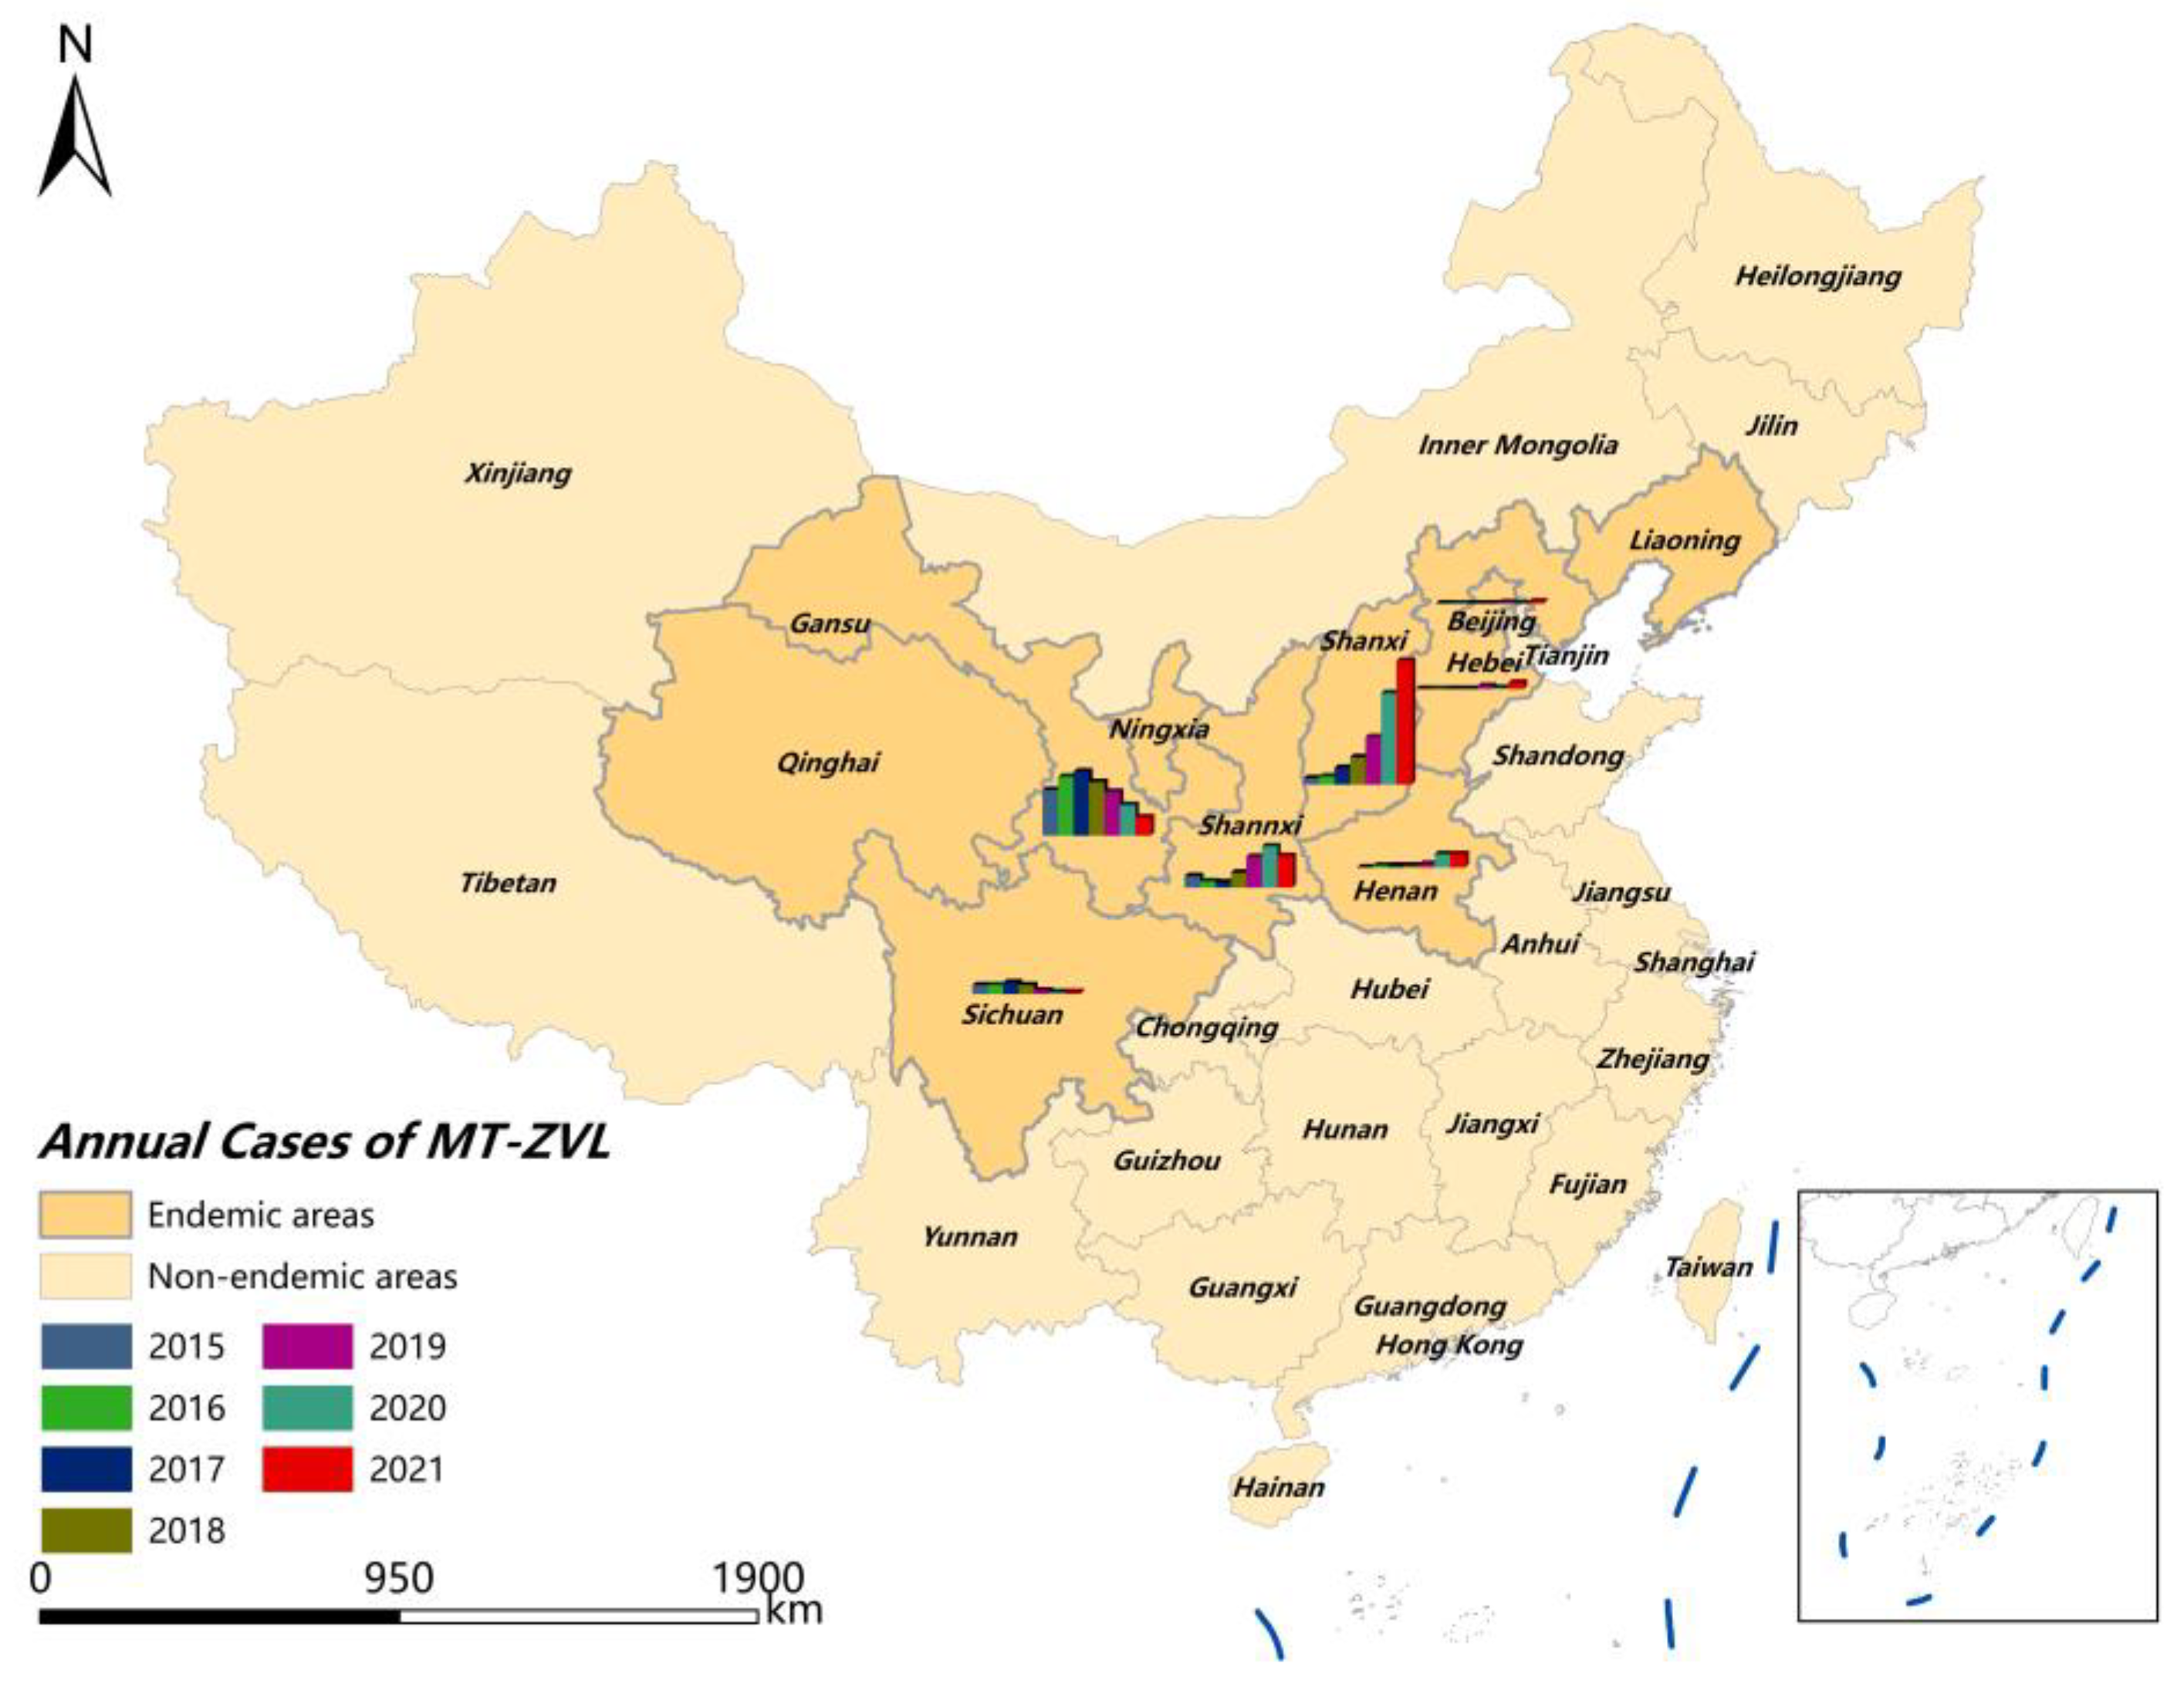
3.1. Epidemiological Characteristics of MT-ZVL in China from 2015 to 2021

A total of 990 MT-ZVL cases were reported in China during the period from 2015 to 2021: specifically, 82 in 2015, 95 in 2016, 113 in 2017, 121 in 2018, 151 in 2019, 204 in 2020, and 224 in 2021 [38,39,40] (Figure 1). The MT-ZVL cases were predominantly detected in four provinces—Gansu, Sichuan, Shaanxi, and Shanxi—and the geographical distribution of MT-ZVL cases gradually expanded over time. In 2015, MT-ZVL cases were predominantly detected in four provinces (Gansu, Sichuan, Shaanxi, and Shanxi), whereas MT-ZVL cases were reported in seven provinces by the end of 2021, with local cases identified in Henan Province in 2016 and Hebei Province and Beijing Municipality in 2019.
Since 2019, the highest number of MT-ZVL cases was reported in Shanxi Province. A total of 299 MT-ZVL cases were detected in Shanxi Province from 2019 to 2021, consisting of 51.64% of all cases reported in China. The number of MT-ZVL cases increased from 54 in 2019 to 141 in 2021 in Shanxi Province. The second-largest number of MT-ZVL cases was reported in Shaanxi Province. There, 118 cases were detected from 2019 to 2021, consisting of 20.38% of all cases reported in China. The third-largest number of MT-ZVL cases was reported in Gansu Province, where the number of cases gradually declined from 2019 to 2021. The number of MT-ZVL cases reported in the three provinces of Shanxi, Shaanxi, and Gansu consisted of 90.33% of all cases in China during the period from 2019 to 2021, whereas 5.83%, 1.89%, 1.38%, and 0.52% of cases were detected in Henan, Hebei, Sichuan, and Beijing, respectively (Figure 2).

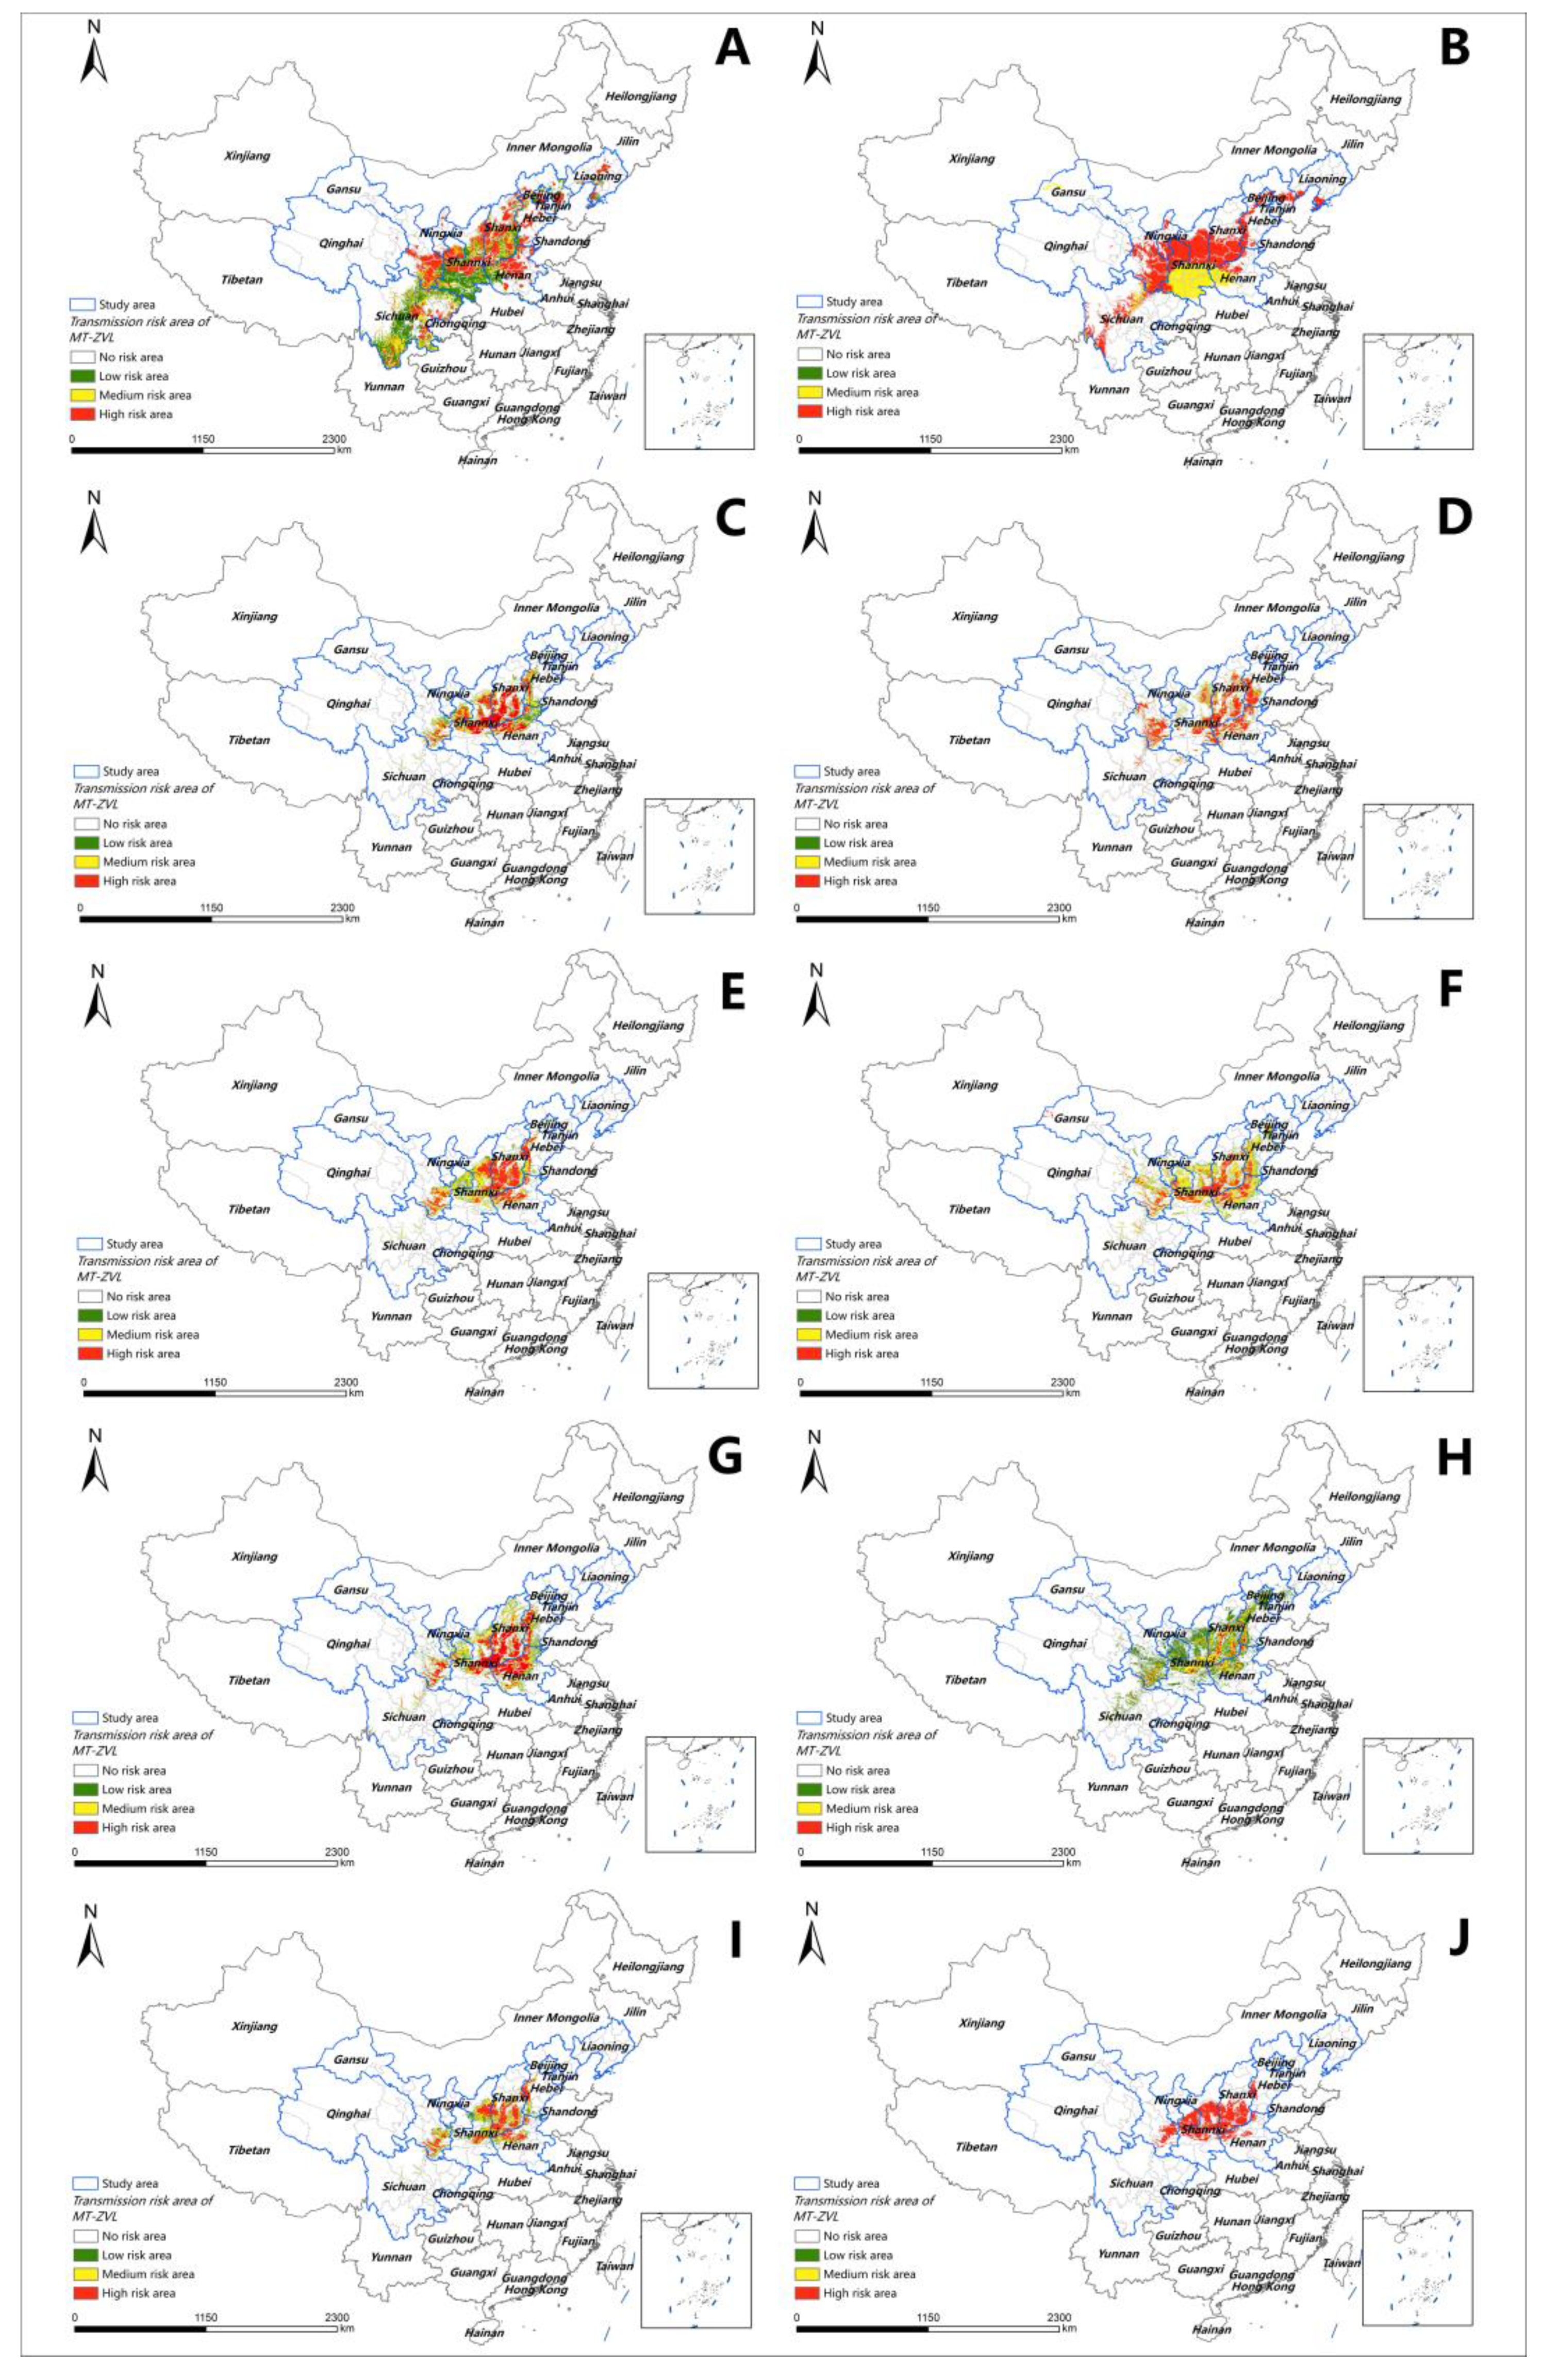
3.2. Comparison of the MT-ZVL Transmission Risk Predicted by Using Ecological Niche Models

Based on the distributions of MT-ZVL cases and Ph. chinensis vectors, ten ecological niche models were created to predict the transmission risk of MT-ZVL. Our data showed that all ten ecological niche models were effective at predicting areas at risk of MT-ZVL transmission; however, the coverage of the predicted areas varied among the models. The ANN and MARS predicted the largest but most dispersed areas at risk of MT-ZVL transmission, and CTA predicted the second-largest areas. The other seven models predicted relatively concentrated areas at risk of MT-ZVL transmission, and the GAM and MaxEnt models predicted the smallest areas. The CTA and SRE models predicted large areas at risk of MT-ZVL transmission, and most areas were predicted to be at high or medium risk. The high-, medium-, and low-risk areas predicted by the other seven models were centered in Shanxi Province and showed a tendency to disperse to the surrounding regions, with southern Liaoning Province to the north and the southern edge of the hilly regions in northern Sichuan Province to the south (Figure 3).

3.3. Performance of Ecological Niche Models

Ten ecological niche models were employed to predict the transmission risk areas of MT-ZVL in China, and the performance of the ecological niche models was evaluated. The RF model showed the highest mean AUC and TSS, and the SRE model exhibited the lowest mean AUC and TSS (Table 2). There were significant differences in the mean AUC (H = 33.311, p < 0.05) and TSS values among the ten ecological niche models (H = 26.344, p < 0.05). The results show that the RF, MaxEnt, GBM, and MARS models had the highest relative performance at predicting the risk of MT-ZVL transmission (mean AUC > 0.95, mean TSS > 0.85). The SRE model had the lowest performance (mean AUC < 0.8, mean TSS < 0.8).

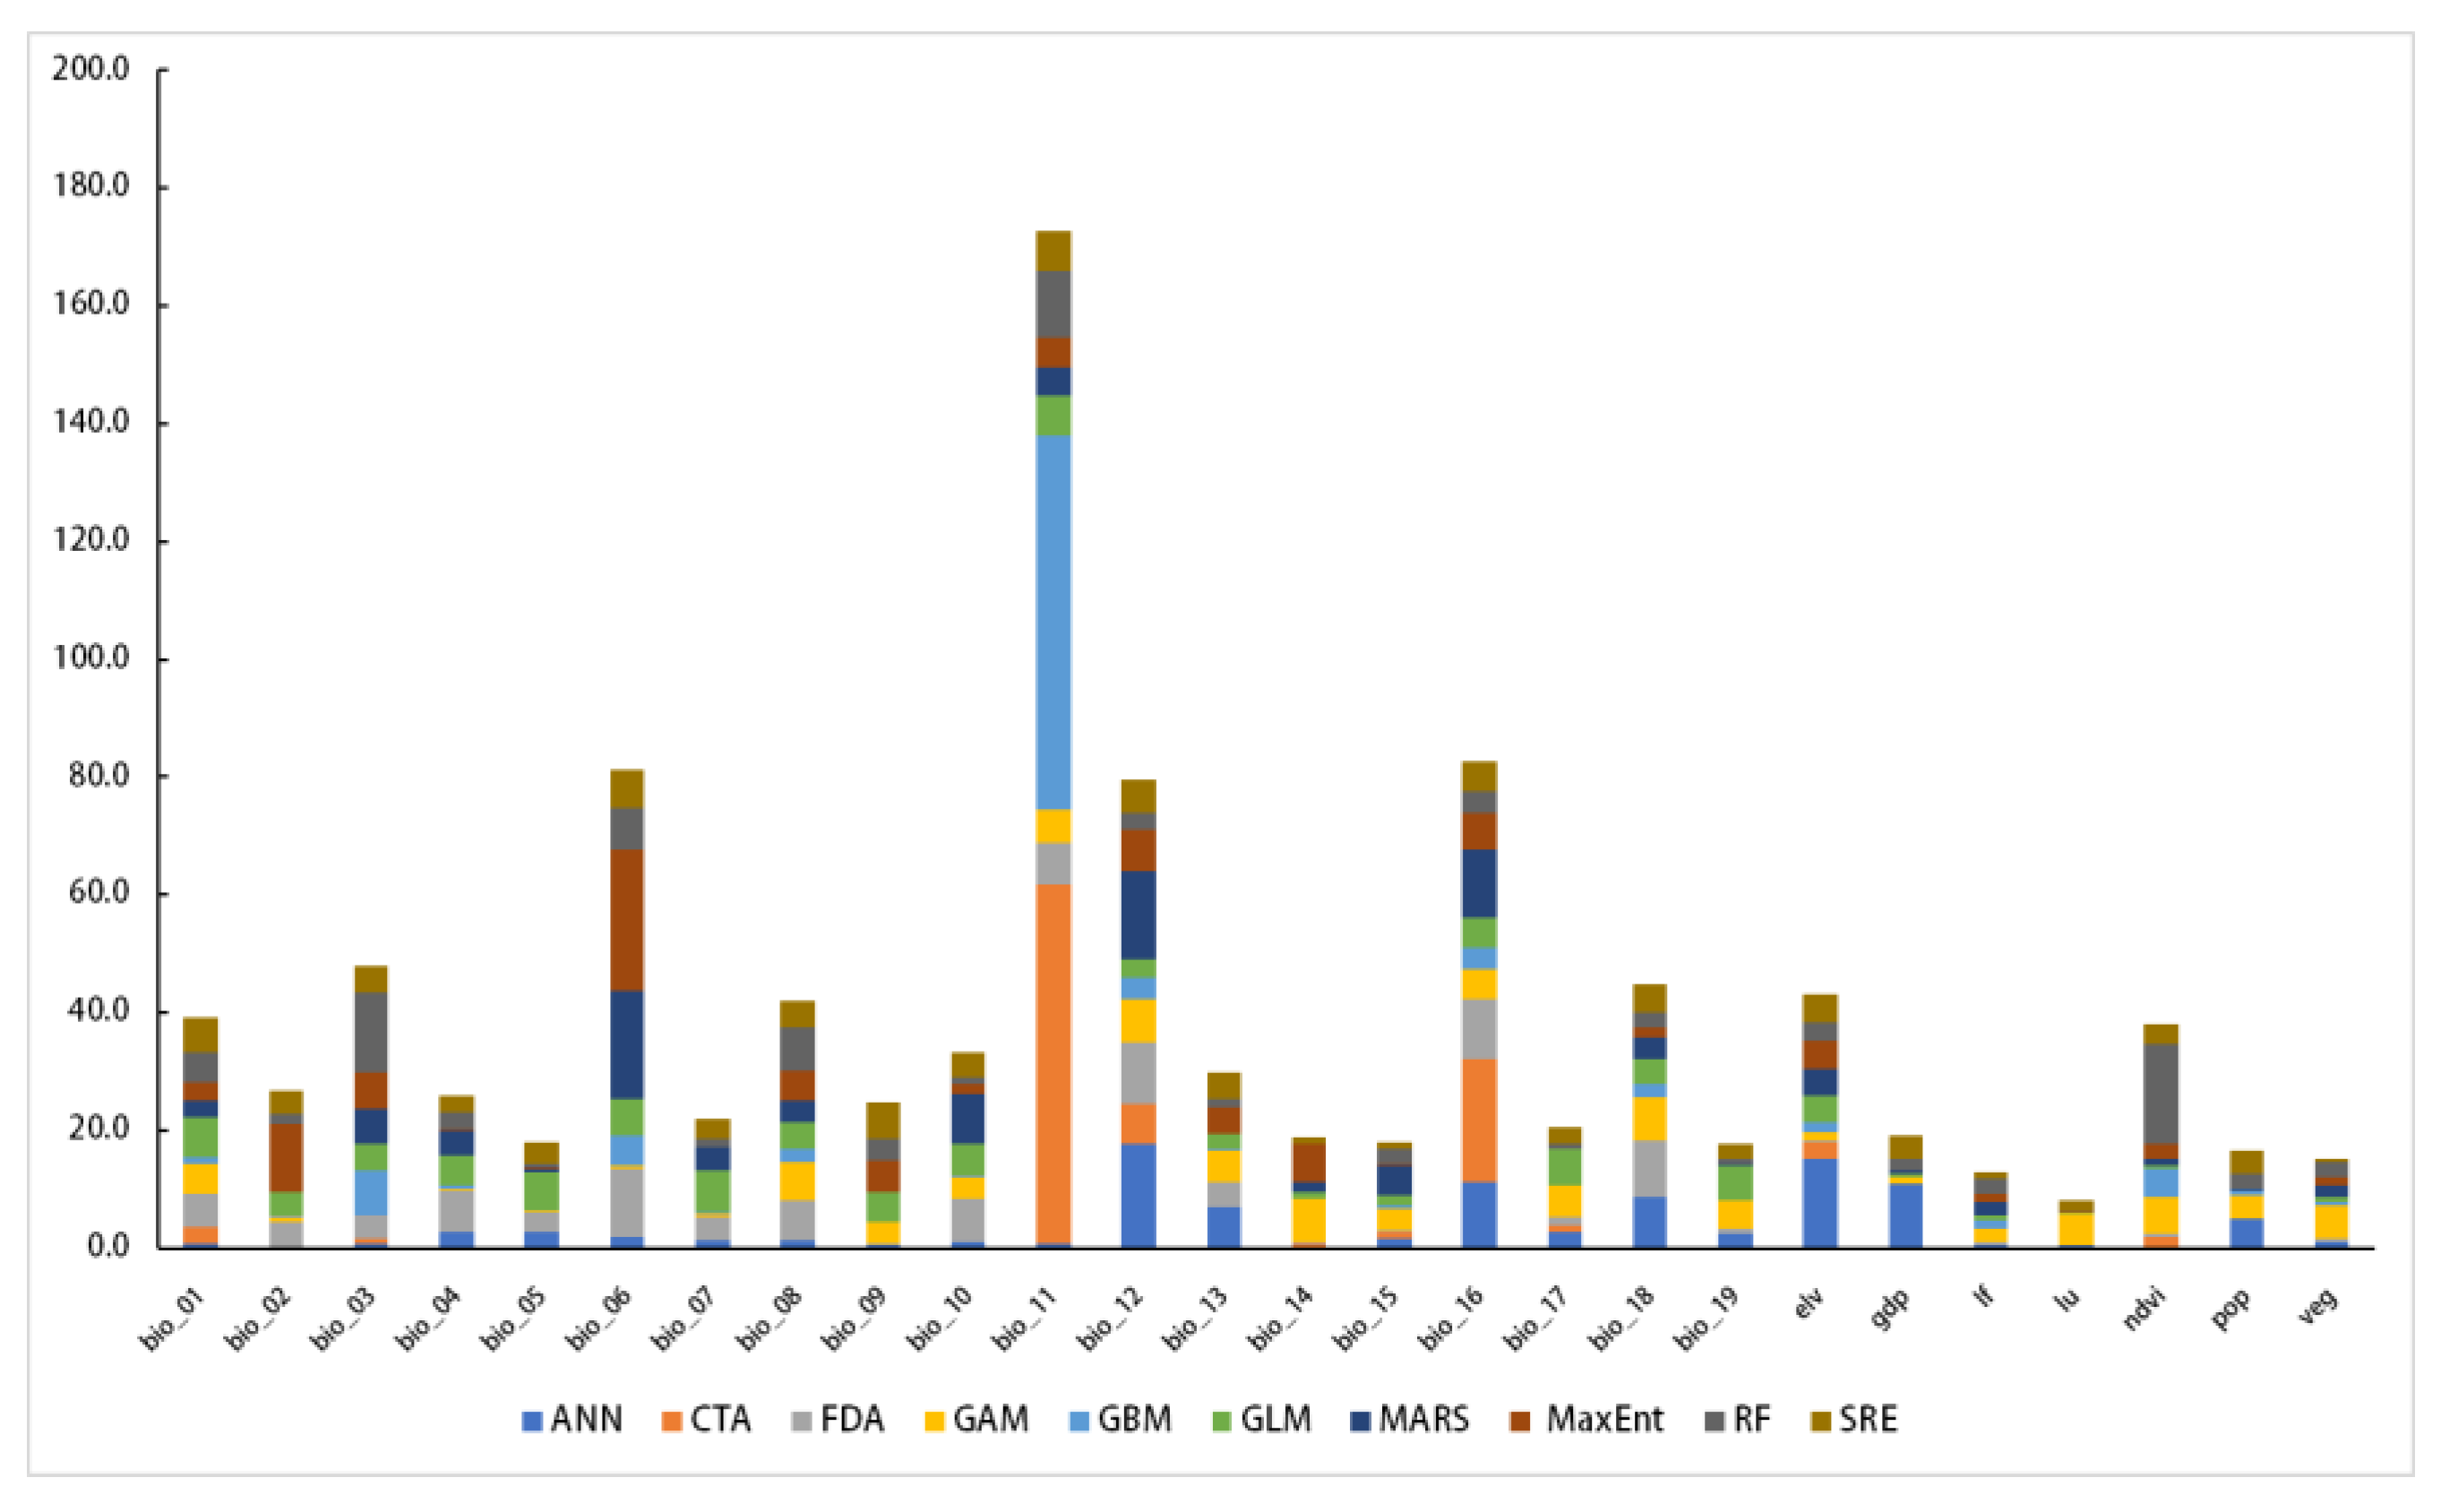
3.4. Contributions of Environmental Variables to Ecological Niche Models

The contributions of the environmental variables to the ten ecological niche models were normalized (Table 3). The climatic variables that contributed most to the ecological niche models included the mean temperature of the coldest quarter, precipitation during the wettest quarter, the minimum temperature of the coldest month, and annual precipitation. The highest contributing geographical variables were elevation and normalized difference vegetation index, and the socioeconomic variables that contributed most were gross domestic product and population density.
In addition, the importance of each environmental variable varied in ecological niche models that performed best at predicting the transmission risk of MT-ZVL. The five most important contributing variables in the RF model were normalized difference vegetation index (17%), isothermality (13.5%), mean temperature of the coldest quarter (11.3%), mean temperature of the wettest quarter (7.4%), and the minimum temperature of the coldest month (6.8%), with cumulative contributions of 56%. The five most important contributing variables in the MaxEnt model were the minimum temperature of the coldest month (24.1%), mean diurnal range (11.6%), annual precipitation (7.2%), precipitation during the driest month (6.5%), and precipitation during the wettest quarter (6.3%), with cumulative contributions of 55.7%. The five most important contributing variables in the GBM model were the mean temperature of the coldest quarter (63.6%), isothermality (7.7%), the minimum temperature of the coldest month (4.9%), the normalized difference vegetation index (4.7%), and precipitation during the wettest quarter (3.6%), with cumulative contributions of 84.5% (Figure 4).

3.5. Prediction of MT-ZVL Transmission Risk in China

Ensemble models predicted the risk of MT-ZVL transmission in a majority of the provinces of Shanxi and Shaanxi, southern Henan Province, the junction of Ningxia, southern Gansu, and northern Sichuan, the border areas of Hebei and Shanxi, and the hilly regions in northwestern Beijing. The areas at high risk of MT-ZVL transmission were concentrated in central and southern Shanxi, eastern Shaanxi, and northern Henan. Medium-risk areas surrounded the high-risk areas and were predominantly detected in Shanxi, Shaanxi, and Henan. Low-risk areas were mainly found on the border between southern Gansu and Sichuan, northeastern Henan, southern Hebei, and the hilly regions in northwestern Beijing. Overall, the areas at risk of MT-ZVL transmission were centered in Shanxi Province and distributed to the surrounding areas, which presented a high cluster (Figure 5).

4. Discussion

Historically, MT-ZVL was mainly prevalent in the hilly regions of Gansu, Qinghai, Ningxia, northern Sichuan, northern Shaanxi, Henan, Hebei, Beijing, and Liaoning—north of the Yangtze River in China [41]. The predominant source of infection is canines. Humans acquire infections from infected dogs, and vectors transmitting MT-ZVL are wild species of sand flies. During the early stage of the founding of the People’s Republic of China, there were a large number of MT-ZVL cases, and most were detected in children and young individuals from 5 to 30 years old (74.4%), as well as in men (63%) [42]. The disease severely damaged socioeconomic development in China. In the 1950s and 1960s, a package of VL control measures was implemented including Ph. chinensis control, canine control, and case management, and VL was almost eradicated in eastern, central, and northern China [43,44]. Therefore, MT-ZVL was controlled effectively, but only sporadic cases were found in Gansu and Sichuan, in southern China [45,46]. With recent socioeconomic developments, the living conditions and the environment have greatly improved, and the number of dogs has increased rapidly. Due to suitable climatic conditions caused by global warming, there is a rapid expansion in the distribution and density of P. chinensis populations, resulting in reemerging VL or emerging natural foci of VL in Shaanxi, Shanxi, Henan, and Hebei [28]. Notably, the number of reported MT-ZVL cases has increased rapidly in Shanxi Province during the past five years [47]. In 2016, local cases were identified in Henan Province, which had not reported any cases since 1983 [48]. Since then, local cases of VL have been detected in Hebei and Beijing, posing an imminent threat to local human health [40]. Therefore, it is urgent to identify the areas at risk of MT-ZVL transmission to interrupt its transmission.
Since vectors and pathogens are greatly affected by climatic, ecological, and environmental factors [49] and show temporal and spatial clustering accordingly [50], ecological niche models show great promise at predicting the transmission risk of vector-borne diseases [51]. Ecological niche models have widely been employed to predict the transmission risk of schistosomiasis and malaria; however, there have been few reports pertaining to the application of ecological niche models to studies of VL. In this study, we collected the distributions of MT-ZVL cases in China and climatic, geographical, and socioeconomic variables that may affect VL transmission risk to create ten ecological niche models. Ensemble models were then screened to predict the areas at risk of MT-ZVL transmission in China.
All ten ecological niche models were found to be effective at predicting the areas at risk of MT-ZVL transmission, but with varying results among the models. The GAM, MaxEnt, and GBM models predicted relatively concentrated areas at risk of MT-ZVL transmission, while the ANN, MARS, and CTA models predicted widespread areas. The CTA and SRE models predicted large areas at risk of MT-ZVL transmission, and most areas were predicted to be at high or medium risk. The high-, medium-, and low-risk areas predicted by the ecological niche models were centered in Shanxi Province and tended toward dispersion to the surrounding regions, with southern Liaoning Province to the north and the southern edge of the hilly regions in northern Sichuan Province to the south. We also evaluated the performance of the ten ecological niche models: The RF, MaxEnt, GBM, and MARS models performed best (mean AUC > 0.95 and mean TSS > 0.85). As a single ecological niche model suffers from problems of spatial uncertainty, such as low accuracy and poor predictive value [35], ensemble models were screened and showed higher performance and predictive accuracy than any single ecological niche model, reducing the spatial uncertainty of predicting MT-ZVL transmission risk [52]. To investigate the model’s performance, the AUC and TSS values were employed. However, AUC and TSS provide the accuracy of different aspects of models. A new system named CCHZ (C: Chen, C: Chen, H: Hu, and Z: Zhou)-DISO (distance between indices of simulation and observation) has the advantage of measuring the overall and comprehensive performance of different models [53,54,55]. It will be used to quantify the overall performance among different models in our future study.
Our findings showed that the areas at risk of MT-ZVL transmission predicted by our ensemble models covered the current actual distribution of MT-ZVL and extended to the surrounding regions. High- and medium-risk areas were predicted to be concentrated in central and southern Shanxi, eastern Shaanxi, southern Gansu, and northern Henan. Low-risk areas were mainly predicted in northern Sichuan, southern Hebei, and the hilly regions in northwestern Beijing. Overall, the primary high-risk areas for MT-ZVL transmission were centered in Shanxi Province and distributed to the surrounding regions, appearing as a high spatial cluster. The secondary high-risk areas were mainly distributed in southern Gansu and concentrated in several counties of Longnan City and the Gannan Tibetan Autonomous Region. The results mostly agreed with the current distribution of MT-ZVL. We predicted larger areas at risk of MT-ZVL transmission and larger high-risk areas in Shanxi and Henan provinces than the previous predictions of the nine ecological niche models. This was consistent with the current trends for MT-ZVL incidence in these two provinces [56]. In addition, our ensemble models predicted medium- and low-risk areas for MT-ZVL transmission in Ningxia, Henan, Hebei, and Beijing. To date, few cases of MT-ZVL have been reported in Henan and Hebei, and no local cases have been detected in Ningxia. Notably, local cases of MT-ZVL were identified in the suburbs of Beijing Municipality, where VL had been almost eradicated for decades. These reports demonstrate the likelihood of VL rebounding and reemerging in these provinces, implying the urgent need for the surveillance of Ph. chinensis vectors.
Next, we investigated the potential causes responsible for MT-ZVL rebounding and spreading. We identified climatic variables as the most important contributors to the ecological niche models, and four climatic variables (the mean temperature of the coldest quarter, precipitation during the wettest quarter, the minimum temperature of the coldest month, and annual precipitation) and two geographical variables (elevation and the normalized difference vegetation index) contributed the most to the models, emphasizing the rise of the minimum temperature and increased precipitation caused by global warming. In addition, we predicted the high-risk areas for MT-ZVL transmission to be in the Yanshan-Taihangshan mountain deciduous broad-leaved forest ecological zone and the Fenwei Basin Agro-ecological zone. With a temperate continental monsoon climate, these two ecological zones are hot and rainy in summer, with a hilly and frondent environment and a large number of wild animals. These are favorable climatic conditions for the breeding, reproduction, and habitation of wild sand flies. Furthermore, our findings showed the contribution of socioeconomic variables to ecological niche models. These variables are associated with the living environment of local residents. Local loess cave dwellings and architectural works made of cement, brick, and tile provide suitable habitats for Ph. chinensis breeding [57]. More importantly, the diagnosis, screening, and management of VL were neglected following the effective control of this disease in China, and this is partly responsible for the rebound of local VL epidemics [58]. In the context of a gradually increasing population density of wild species of P. chinensis, the introduction of animal sources of infections is very likely to cause VL transmission and reemergence. This may result in the spread of local VL to surrounding regions. With global warming, the duration and area of Ph. chinensis activities may further expand, which will further increase the VL transmission risk in these regions [59].

5. Conclusions

In summary, we generated ensemble ecological niche models based on environmental variables, and these ensemble models were shown to be effective at predicting the transmission risk of MT-ZVL in China. The findings by the ecological niche models agreed with the trends for MT-ZVL incidence in China and may provide technical support for MT-ZVL control and surveillance. Nevertheless, there are some limitations, such as the MT-ZVL case data were collected from the National Notifiable Diseases Reporting System, missing diagnoses or reports cannot be completely excluded, and the variable of the distribution of Ph. chinensis was not included, which may lead to risk underestimated. Further studies to acquire accurate distributions of MT-ZVL cases and vector species through field surveys are needed, and more quantitative variables should be included in the training datasets to increase the accuracy and effectiveness of ecological niche models for predicting the transmission risk of MT-ZVL.

Author Contributions

Conceptualization, Y.H., Z.L., Z.H., and S.L.; data curation, Y.H. and Z.L.; formal analysis, Y.H., Z.L., Y.G., Y.L., J.Z., and Z.Z. (Zhengbin Zhou); funding acquisition, Z.H. and S.L.; methodology, Y.H., Z.L., Y.G., and J.Z.; software, Z.L., Y.G., and J.Z.; writing—original draft preparation, Y.H., Z.L., and S.L.; writing—review and editing, Z.Z. (Zhengbin Zhou), Z.Z. (Zelin Zhu), T.T., Q.W., Y.Z., Z.H., and S.L. All authors have read and agreed to the published version of the manuscript.

Funding

This research was funded by the National Key Research and Development Program of China (Grant No. 2021YFC2300800, 2021YFC2300804), the National Natural Science Foundation of China (Grant No.32161143036), the National Youth Talent Program (Grant No. E1190301), the Alliance of International Science Organizations (Grant No. ANSO-CR-KP-2021-02), and the National Tutor System (Grant No. Qngg2021031).

Institutional Review Board Statement

Not applicable.

Informed Consent Statement

Not applicable.

Data Availability Statement

The data used and/or analyzed in the current study are publicly available in (the Information Center of National Institute of Parasitic Diseases, China CDC (Chinese Center for Tropical Diseases Research) at https://www.ipd.org.cn/ accessed on 8 May 2022; The China Meteorological Data Sharing Center at http://data.cma.cn accessed on 21 November 2021; The WorldClim website at https://www.worldclim.org/data/worldclim21.html/ accessed on 16 November 2021; and the Resource and Environment Data Center, Chinese Academy of Sciences at https://www.resdc.cn/ accessed on 12 November 2021.

Conflicts of Interest

The authors declare no conflict of interest.

References

  1. Abdoli, A. Leishmaniasis. Lancet 2019, 393, 872. [Google Scholar] [CrossRef] [Green Version]
  2. Alvar, J.; Yactayo, S.; Bern, C. Leishmaniasis and poverty. Trends Parasitol. 2006, 22, 552–557. [Google Scholar] [CrossRef] [PubMed]
  3. Desjeux, P. Leishmaniasis: Current situation and new perspectives. Comp. Immunol. Microbiol. Infect. Dis. 2004, 27, 305–318. [Google Scholar] [CrossRef] [PubMed]
  4. Al-Salem, W.; Herricks, J.R.; Hotez, P.J. A review of visceral leishmaniasis during the conflict in South Sudan and the consequences for East African countries. Parasites Vectors 2016, 9, 460. [Google Scholar] [CrossRef] [Green Version]
  5. Lun, Z.-R.; Wu, M.-S.; Chen, Y.-F.; Wang, J.-Y.; Zhou, X.-N.; Liao, L.-F.; Chen, J.-P.; Chow, L.M.C.; Chang, K.P. Visceral Leishmaniasis in China: An endemic disease under control. Clin. Microbiol. Rev. 2015, 28, 987–1004. [Google Scholar] [CrossRef] [Green Version]
  6. Guan, L.; Wu, Z. Historical experience in the elimination of visceral leishmaniasis in the plain region of Eastern and Central China. Infect. Dis. Poverty 2014, 3, 10. [Google Scholar] [CrossRef] [Green Version]
  7. Qian, M.B.; Chen, J.; Bergquist, R.; Li, Z.J.; Li, S.Z.; Xiao, N.; Utzinger, J.; Zhou, X.N. Neglected tropical diseases in the People’s Republic of China: Progress towards elimination. Infect. Dis. Poverty 2019, 8, 6–21. [Google Scholar] [CrossRef]
  8. Guan, L.R.; Wang, J.; Hu, Y.D.; Xiong, G.H.; Zheng, S.C. Epidemiology of kala-azar in China and its significance in the prevention and treatment. J. Control Res. Epidem. Dis. 1976, 3, 225–231. (In Chinese) [Google Scholar]
  9. Guan, L.R. Current status of kala-azar and vector control in China. Bull. World Health Organ. 1991, 69, 595–601. [Google Scholar]
  10. Li, Y.F.; Zhong, W.X.; Zhao, G.H.; Wang, H.F. Prevalence and control status of kala-azar in China. J. Pathog. Biol. 2011, 6, 629–631. (In Chinese) [Google Scholar]
  11. Jiang, D.; Ma, T.; Hao, M.; Qian, Y.; Chen, S.; Meng, Z.; Wang, L.; Zheng, C.; Qi, X.; Wang, Q.; et al. Spatiotemporal patterns and spatial risk factors for visceral leishmaniasis from 2007 to 2017 in Western and Central China: A modelling analysis. Sci. Total Environ. 2021, 764, 144275. [Google Scholar] [CrossRef] [PubMed]
  12. Zhao, S.; Li, Z.; Zhou, S.; Zheng, C.; Ma, H. Epidemiological Feature of Visceral Leishmaniasis in China, 2004–2012. Iran J. Public Health 2015, 44, 51–59. [Google Scholar] [PubMed]
  13. Han, S.; Wu, W.; Xue, C.; Ding, W.; Hao, Y.; Hou, Y.; Feng, Y.; Zhong, B.; Cao, L.; Zhang, Y.; et al. Endemic status of visceral leishmaniasis in China from 2004 to 2016. Chin. J. Parasitol. Parasit. Dis. 2019, 37, 189–195. (In Chinese) [Google Scholar]
  14. Zhao, Y.; Jiang, D.; Ding, F.; Hao, M.; Wang, Q.; Chen, S.; Xie, X.; Zheng, C.; Ma, T. Recurrence and Driving Factors of Visceral Leishmaniasis in Central China. Int. J. Environ. Res. Public Health 2021, 18, 9535. [Google Scholar] [CrossRef] [PubMed]
  15. Zhou, Z.; Lyu, S.; Zhang, Y.; Li, Y.; Li, S.; Zhou, X.N. Visceral Leishmaniasis-China, 2015–2019. China CDC Wkly. 2020, 2, 625–628. [Google Scholar] [CrossRef] [PubMed]
  16. Wang, X.; Xia, S.; Xue, J.; Zhou, Z.; Li, Y.; Zhu, Z.; Zhang, Y.; Wang, Q.; Li, S. Transmission risks of mountain-type zoonotic visceral leishmaniasis-six endemic provincial-level administrative divisions, China, 2015–2020. China CDC Wkly. 2022, 4, 148–152. [Google Scholar] [CrossRef]
  17. Chavy, A.; Nava, A.F.D.; Luz, S.L.B.; Ramírez, J.D.; Herrera, G.; dos Santos, T.V.; Ginouves, M.; Demar, M.; Prévot, G.; Guégan, J.-F.; et al. Ecological niche modelling for predicting the risk of cutaneous leishmaniasis in the Neotropical moist forest biome. PLOS Negl. Trop. Dis. 2019, 13, e0007629. [Google Scholar] [CrossRef] [Green Version]
  18. Acharya, B.K.; Cao, C.; Xu, M.; Khanal, L.; Naeem, S.; Pandit, S. Present and Future of Dengue Fever in Nepal: Mapping Climatic Suitability by Ecological Niche Model. Int. J. Environ. Res. Public Health 2018, 15, 187. [Google Scholar] [CrossRef] [Green Version]
  19. Leta, S.; Fetene, E.; Mulatu, T.; Amenu, K.; Jaleta, M.B.; Beyene, T.J.; Negussie, H.; Revie, C.W. Modeling the global distribution of Culicoides imicola: An ensemble approach. Sci. Rep. 2019, 9, 14187. [Google Scholar] [CrossRef]
  20. Zhu, G.; Fan, J.; Peterson, A.T. Schistosoma japonicum transmission risk maps at present and under climate change in mainland China. PLoS Negl. Trop. Dis. 2017, 11, e0006021. [Google Scholar] [CrossRef] [Green Version]
  21. Marques, R.; Krüger, R.F.; Cunha, S.K.; Silveira, A.S.; Alves, D.M.; Rodrigues, G.D.; Peterson, A.T.; Jiménez-García, D. Climate change impacts on Anopheles (K.) cruzii in urban areas of Atlantic Forest of Brazil: Challenges for malaria diseases. Acta Trop. 2021, 224, 106123. [Google Scholar] [CrossRef]
  22. Abdullah, A.Y.M.; Dewan, A.; Shogib, M.R.I.; Rahman, M.M.; Hossain, M.F. Environmental factors associated with the distribution of visceral leishmaniasis in endemic areas of Bangladesh: Modeling the ecological niche. Trop. Med. Health 2017, 45, 13. [Google Scholar] [CrossRef] [PubMed]
  23. Chalghaf, B.; Chemkhi, J.; Mayala, B.; Harrabi, M.; Benie, G.B.; Michael, E.; Ben Salah, A. Ecological niche modeling predicting the potential distribution of Leishmania vectors in the Mediterranean basin: Impact of climate change. Parasit Vectors 2018, 11, 461. [Google Scholar] [CrossRef] [PubMed]
  24. Gong, Y.-F.; Zhu, L.-Q.; Li, Y.-L.; Zhang, L.-J.; Xue, J.-B.; Xia, S.; Lv, S.; Xu, J.; Li, S.-Z. Identification of the high-risk area for schistosomiasis transmission in China based on information value and machine learning: A newly data-driven modeling attempt. Infect. Dis. Poverty 2021, 10, 88. [Google Scholar] [CrossRef] [PubMed]
  25. Hu, X.; Hao, Y.; Xia, S.; Guo, Y.; Xue, J.; Zhang, Y.; Wang, L.; Dong, Y.; Xu, J.; Li, S. Detection of schistosomiasis transmission risks in Yunnan Province based on ecological niche modeling. Chin. J. Parasitol. Parasit. Dis. 2020, 38, 80–87. (In Chinese) [Google Scholar]
  26. Gong, Y.; Hu, X.; Zhou, Z.; Zhu, H.; Hao, Y.; Wang, Q.; Zhang, Y.; Li, S. Ecological niche modeling-based prediction on transmission risk of visceral leishmaniasis in the extension region of Loess Plateau, China. Chin. J. Parasitol. Parasit. Dis. 2021, 39, 218–225. (In Chinese) [Google Scholar]
  27. Guan, L.; Zhou, Z.; Jin, C.; Fu, Q.; Chai, J. Phlebotomine sand flies (Diptera: Psychodidae) transmitting visceral leishmaniasis and their geographical distribution in China: A review. Infect. Dis. Poverty 2016, 5, 15. [Google Scholar] [CrossRef] [Green Version]
  28. Wang, X.; Xue, J.; Xia, S.; Han, S.; Hu, X.; Zhou, Z.; Zhang, Y.; Li, S. Distribution of Suitable Environments for Phlebotomus chinensis as the Vector for Mountain-Type Zoonotic Visceral Leishmaniasis-Six Provinces, China. China CDC Wkly. 2020, 2, 815–819. [Google Scholar] [CrossRef]
  29. Wu, Y.; Li, G.; Liao, Q.; Chen, Y.; Gao, B. Epidemiology and control of kala-azar in Sichuan Province. End Dis. Bull 1995, 10, 25–29. (In Chinese) [Google Scholar]
  30. Sofizadeh, A.; Rassi, Y.; Vatandoost, H.; Hanafi-Bojd, A.A.; Mollalo, A.; Rafizadeh, S.; Akhavan, A.A. Predicting the Distribution of Phlebotomus papatasi (Diptera: Psychodidae), the Primary Vector of Zoonotic Cutaneous Leishmaniasis, in Golestan Province of Iran Using Ecological Niche Modeling: Comparison of MaxEnt and GARP Models. J. Med. Entomol. 2017, 54, 312–320. [Google Scholar] [CrossRef]
  31. Andrade-Filho, J.D.; Scholte, R.G.C.; Amaral, A.L.G.; Shimabukuro, P.H.F.; Carvalho, O.S.; Caldeira, R.L. Occurrence and Probability Maps of Lutzomyia longipalpis and Lutzomyia cruzi (Diptera: Psychodidae: Phlebotominae) in Brazil. J. Med. Entomol. 2017, 54, 1430–1434. [Google Scholar] [CrossRef] [PubMed]
  32. Diniz-Filho, J.A.F.; Bini, L.M.; Rangel, T.F.; Loyola, R.D.; Hof, C.; Nogue´s-Bravo, D.; Araújo, M.B. Partitioning and mapping uncertainties in ensembles of forecasts of species under climate change. Ecography 2009, 32, 897–906. [Google Scholar] [CrossRef]
  33. Buisson, L.; Thuiller, W.; Casajus, N.; Lek, S.; Grenouillette, G. Uncertainty in ensemble forecasting of species distribution. Glob. Chang. Biol. 2009, 16, 1145–1157. [Google Scholar] [CrossRef]
  34. Carvalho, B.M.; Rangel, E.F.; Vale, M.M. Evaluation of the impacts of climate change on disease vectors through ecological niche modelling. Bull Entomol. Res. 2017, 107, 419–430. [Google Scholar] [CrossRef] [PubMed] [Green Version]
  35. Qiao, H.; Sobero´n, J.; Peterson, A.T. No silver bullets in correlative ecological niche modelling: Insights from testing among many potential algorithms for niche estimation. Methods Ecol. Evol. 2015, 6, 1126–1136. [Google Scholar] [CrossRef]
  36. Heikkinen, R.K.; Marmion, M.; Luoto, M. Does the interpolation accuracy of species distribution models come at the expense of transferability? Ecography 2012, 35, 276–288. [Google Scholar] [CrossRef]
  37. Allouche, O.; Tsoar, A.; Kadmon, R. Assessing the accuracy of species distribution models: Prevalence, kappa and the true skill statistic (TSS). J. Appl. Ecol. 2006, 43, 1223–1232. [Google Scholar] [CrossRef]
  38. Zhou, Z.; Li, Y.; Zhang, Y.; Li, S. Prevalence of visceral leishmaniasis in China during 2015–2018. Chin. J. Parasitol. Parasit. Dis. 2020, 38, 339–345. (In Chinese) [Google Scholar]
  39. Zhou, Z.; Li, Y.; Zhang, Y.; Li, S. Prevalence of visceral leishmaniasis in China in 2019. Chin. J. Parasitol. Parasit. Dis. 2020, 38, 602–607. (In Chinese) [Google Scholar]
  40. Luo, Z.; Zhou, Z.; Gong, Y.; Feng, J.; Li, Y.; Zhang, Y.; Li, S. Current status and challenges of visceral leishmaniasis in China. Chin. J. Parasitol. Parasit. Dis. 2022, 40, 146–152. (In Chinese) [Google Scholar]
  41. Zhou, Z.-B.; Wang, J.-Y.; Gao, C.-H.; Han, S.; Li, Y.-Y.; Zhang, Y.; Zhou, X.-N. Contributions of the National Institute of Parasitic Diseases to the control of visceral leishmaniasis in China. Adv. Parasitol. 2020, 110, 185–216. [Google Scholar] [CrossRef] [PubMed]
  42. Xiong, G. Current situation of kala-azar epidemic in China. End Dis. Bull. 1972, 7, 113–125. (In Chinese) [Google Scholar]
  43. Wang, Z.; Xiong, G.H.; Guan, L. Achievement on the epidemiology and control of kala-azar in China. Chin. J. Epidemiol. 2000, 21, 51–54. (In Chinese) [Google Scholar]
  44. Guan, L. Present situation of visceral leishmaniasis and prospect for its control in China. Chin. J Parasitol. Parasit. Dis. 2009, 27, 394–397. (In Chinese) [Google Scholar]
  45. Guan, L.; Shen, W. Recent advances in visceral leishmaniasis in China. Southeast Asian J. Trop. Med. Public Health 1991, 22, 291–298. [Google Scholar] [PubMed]
  46. Guan, Z.; Chen, C.; Huang, C.; Zhang, H.; Zhou, Y.; Zhou, Y.; Wu, J.; Zhou, Z.; Yang, S.; Li, L. Epidemiological features and spatial-temporal distribution of visceral leishmaniasis in mainland China: A population-based surveillance study from 2004 to 2019. Parasit Vectors 2021, 14, 517. [Google Scholar] [CrossRef]
  47. Zheng, Y.; Bai, Y.; Tie, P.; Yan, C.; Wang, T.; Wang, J.; Wang, S.; Cai, J. Epidemiological characteristics of visceral leishmaniasis in Shanxi province, 2010—2019. Chin. J. Parasitol. Parasit Dis. 2021, 39, 352–358. (In Chinese) [Google Scholar]
  48. Tang, Z.; Gao, P.; Zhou, K.; Liu, J.; Guo, X. A survey on sandfly in Linzhou city of Henan province. Chin. J. Hyg Insect. Equip. 2017, 23, 397–398. (In Chinese) [Google Scholar]
  49. Hong, A.; Zampieri, R.A.; Shaw, J.J.; Floeter-Winter, L.M.; Laranjeira-Silva, M.F. One Health Approach to Leishmaniases: Understanding the Disease Dynamics through Diagnostic Tools. Pathogens 2020, 9, 809. [Google Scholar] [CrossRef]
  50. Firouraghi, N.; Mohammadi, A.; Hamer, D.H.; Bergquist, R.; Mostafavi, S.M.; Shamsoddini, A.; Raouf-Rahmati, A.; Fakhar, M.; Moghaddas, E.; Kiani, B. Spatio-temporal visualisation of cutaneous leishmaniasis in an endemic, urban area in Iran. Acta Trop. 2022, 225, 106181. [Google Scholar] [CrossRef] [PubMed]
  51. Ocampo, C.B.; Guzmán-Rodríguez, L.; Moreno, M.; Castro, M.D.M.; Valderrama-Ardila, C.; Alexander, N. Integration of phlebotomine ecological niche modelling, and mapping of cutaneous leishmaniasis surveillance data, to identify areas at risk of under-estimation. Acta Trop. 2021, 224, 106122. [Google Scholar] [CrossRef] [PubMed]
  52. Townsend, J. Mapping disease transmission risk: Enriching models using biogeography and ecology. Emerg. Infect. Dis. 2015, 21, 1489. [Google Scholar] [CrossRef]
  53. Hu, Z.; Chen, D.; Chen, X.; Zhou, Q.; Peng, Y.; Li, J. CCHZ-DISO: A Timely New Assessment System for data quality or model performance from Da Dao Zhi Jian. Nature 2022. [Google Scholar]
  54. Zhou, Q.; Chen, D.; Hu, Z.; Chen, X. Decompositions of Taylor diagram and DISO performance criteria. Int. J. Climatol. 2021, 41, 5726–5732. [Google Scholar] [CrossRef]
  55. Hu, Z.; Chen, X.; Zhou, Q.; Chen, D.; Li, J. DISO: A rethink of Taylor diagram. Int. J. Climatol. 2019, 39, 2825–2832. [Google Scholar] [CrossRef]
  56. Hao, Y.; Hu, X.; Gong, Y.; Xue, J.; Zhou, Z.; Li, Y.; Wang, Q.; Zhang, Y.; Li, S. Spatio-temporal clustering of Mountain-type Zoonotic Visceral Leishmaniasis in China between 2015 and 2019. PLoS Negl. Trop. Dis. 2021, 15, e0009152. [Google Scholar] [CrossRef]
  57. Chen, H.; Gao, J.; Li, K.; Yang, Z.; Peng, H.; Ma, Y. Ecological niches of sandfly (Diptera: Psychodidae) in the extension region of Loess Plateau, China: An endemic focus of visceral leishmaniasis. Chin. J. Vector Biol. Control 2019, 30, 597–602. (In Chinese) [Google Scholar]
  58. Zheng, C.; Xue, C.; Wu, W.; Zhou, X. Epidemiological characteristics of Kala-azar disease in China, during 2005–2015. Chin. J. Epidemiol. 2017, 38, 431–434. (In Chinese) [Google Scholar]
  59. Cross, E.R.; Hyams, K.C. The potential effect of global warming on the geographic and seasonal distribution of Phlebotomus papatasi in southwest Asia. Environ. Health Perspect. 1996, 104, 724–727. [Google Scholar] [CrossRef]
Figure 1. Changes in number of patients with mountain-type zoonotic visceral leishmaniasis in China from 2015 to 2021.
Atmosphere 13 00964 g001
Figure 2. Geographical distribution of patients with mountain-type zoonotic visceral leishmaniasis in China from 2015 to 2021.
Atmosphere 13 00964 g002
Figure 3. Prediction of areas at risk of mountain-type zoonotic visceral leishmaniasis transmission in China using ecological niche models based on climatic and environmental variables: (A) artificial neural network (ANN); (B) classification tree analysis (CTA); (C) flexible discriminant analysis (FDA); (D) generalized additive model (GAM); (E) generalized boosted model (GBM); (F) generalized linear model (GLM); (G) multivariate adaptive regression spline (MARS); (H) maximum entropy (MaxEnt) model; (I) random forest (RF); (J) surface range envelope (SRE) model.
Atmosphere 13 00964 g003
Figure 4. Contributions of environmental variables to ten ecological niche models.
Atmosphere 13 00964 g004
Figure 5. Areas at risk of mountain-type zoonotic visceral leishmaniasis transmission in China predicted with ensemble ecological niche models based on climatic and environmental variables.
Atmosphere 13 00964 g005
Table 1. Environmental variables affecting the distribution of mountain-type zoonotic visceral leishmaniasis and Ph. chinensis vectors.
Variable
Classification
Variable Name
(Units)
DefinitionYear
Bioclimatic DataBIO1 (℃)Annual mean temperature1955–2000
BIO2 (℃)Mean diurnal range
BIO3 (%)Isothermality
BIO4 (%)Standard deviation of temperature seasonality
BIO5 (℃)Max temperature of warmest month
BIO6 (℃)Min temperature of coldest month
BIO7 (℃)Temperature annual range
BIO8 (℃)Mean temperature of wettest quarter
BIO9 (℃)Mean temperature of driest quarter
BIO10 (℃)Mean temperature of warmest quarter
BIO11 (mm)Mean temperature of coldest quarter
BIO12 (mm)Annual precipitation
BIO13 (mm)Precipitation of wettest month
BIO14 (mm)Precipitation of driest month
BIO15Coefficient of variation for precipitation seasonality
BIO16 (mm)Precipitation of wettest quarter
BIO17 (mm)Precipitation of driest quarter
BIO18 (mm)Precipitation of warmest quarter
BIO19 (mm)Precipitation of coldest quarter
Geographical DataElVElevation2000
LFLandform2010
LULand use2015
NDVINormalized difference vegetation index2019
VEGVegetation2015
Socioeconomic DataGDPGross domestic product2015
DPDensity of population2015
Table 2. Performance of ten ecological niche models.
ModelAUC ValueTSS Value
ANN0.912 ± 0.0330.777 ± 0.074
CTA0.902 ± 0.0290.775 ± 0.054
FDA0.963 ± 0.0140.829 ± 0.044
GAM0.940 ± 0.0190.826 ± 0.065
GBM0.965 ± 0.0160.854 ± 0.045
GLM0.943 ± 0.0390.828 ± 0.068
MARS0.961 ± 0.0180.854 ± 0.073
MaxEnt0.968 ± 0.0190.856 ± 0.046
RF0.971 ± 0.0110.857 ± 0.043
SRE0.790 ± 0.0220.581 ± 0.044
ANN, artificial neural network; CTA, classification tree analysis; FDA, flexible discriminant analysis; GAM, generalized additive model; GBM, generalized boosted model; GLM, generalized linear model; MARS, multivariate adaptive regression spline; MaxEnt, maximum entropy model; RF, random forest; SRE, surface range envelope model.
Table 3. Contributions of environmental variables to ten ecological niche models (%).
Variable NameANNCTAFDAGAMGBMGLMMARSMaxEntRFSRE
bio_010.92.75.74.91.46.62.83.35.15.8
bio_020.20.04.40.80.14.10.011.61.64.2
bio_030.80.84.00.07.74.66.06.113.54.6
bio_042.80.07.00.30.65.14.30.22.72.8
bio_052.80.03.30.30.16.60.40.50.43.7
bio_062.00.011.50.74.96.318.324.16.86.7
bio_071.40.03.90.60.27.33.80.01.43.4
bio_081.50.06.56.82.04.63.75.17.44.4
bio_090.60.00.33.60.04.90.05.43.76.3
bio_101.20.07.23.70.35.58.61.51.24.4
bio_110.960.87.25.563.66.94.75.111.36.9
bio_1217.86.710.57.53.53.114.97.22.95.6
bio_137.00.04.45.30.32.40.04.51.64.6
bio_140.20.70.27.40.01.01.86.50.01.2
bio_151.61.30.33.60.41.85.00.32.71.2
bio_1611.120.910.35.13.65.011.56.33.75.1
bio_172.71.41.35.50.06.20.00.00.82.7
bio_188.70.09.57.52.14.53.71.62.54.8
bio_192.40.01.04.80.05.90.20.10.82.5
elv15.12.90.41.41.54.64.54.83.14.7
gdp11.00.00.00.90.20.50.50.11.94.0
lf0.60.00.42.31.51.02.11.62.51.1
lu0.50.00.05.30.00.20.00.30.21.6
ndvi0.01.90.66.24.70.51.22.617.03.3
pop5.00.00.04.10.60.20.10.02.54.0
veg1.20.00.35.70.60.72.11.22.70.4
The full names of variable abbreviations are provided in Table 1.
Publisher’s Note: MDPI stays neutral with regard to jurisdictional claims in published maps and institutional affiliations.

