Article

Restricted Anthropogenic Activities and Improved Urban Air Quality in China: Evidence from Real-Time and Remotely Sensed Datasets Using Air Quality Zonal Modeling

1
Key Laboratory of Geographic Information Science, School of Geographic Sciences, Ministry of Education, East China Normal University, Shanghai 200241, China
2
Transdisciplinary Centre for Qualitative Methods, Prasanna School of Public Health, Manipal Academy of Higher Education, Udupi 576104, India
3
Department of Geography, Delhi School of Economics, University of Delhi, New Delhi 110007, India
*
Author to whom correspondence should be addressed.
Atmosphere 2022, 13(6), 961; https://doi.org/10.3390/atmos13060961
Submission received: 7 May 2022 / Revised: 28 May 2022 / Accepted: 30 May 2022 / Published: 14 June 2022
(This article belongs to the Special Issue Air Pollution in China)

Abstract

:
The study aims to examine the major atmospheric air pollutants such as NO2, CO, O3, PM2.5, PM10, and SO2 to assess the overall air quality using air quality zonal modeling of 15 major cities of China before and after the COVID-19 pandemic period. The spatio-temporal changes in NO2 and other atmospheric pollutants exhibited enormous reduction due to the imposition of a nationwide lockdown. The present study used a 10-day as well as 60-day tropospheric column time-average map of NO2 with spatial resolution 0.25 × 0.25° obtained from the Global Modeling and Assimilation Office, NASA. The air quality zonal model was employed to assess the total NO2 load and its change during the pandemic period for each specific region. Ground surface monitoring data for CO, NO2, O3, PM10, PM2.5, and SO2 including Air Quality Index (AQI) were collected from the Ministry of Environmental Protection of China (MEPC). The results from both datasets demonstrated that NO2 has drastically dropped in all the major cities across China. The concentration of CO, PM10, PM2.5, and SO2 demonstrated a decreasing trend whereas the concentration of O3 increased substantially in all cities after the lockdown effect as observed from real-time monitoring data. Because of the complete shutdown of all industrial activities and vehicular movements, the atmosphere experienced a lower concentration of major pollutants that improves the overall air quality. The regulation of anthropogenic activities due to the COVID-19 pandemic has not only contained the spread of the virus but also facilitated the improvement of the overall air quality. Guangzhou (43%), Harbin (42%), Jinan (33%), and Chengdu (32%) have experienced maximum air quality improving rates, whereas Anshan (7%), Lanzhou (17%), and Xian (25%) exhibited less improved AQI among 15 cities of China during the study period. The government needs to establish an environmental policy framework involving central, provincial, and local governments with stringent laws for environmental protection.

1. Introduction

Air pollution and its quality in cities are the major concerns worldwide and China is no exception. Air pollution has been a serious environmental issue in China since extensive industrial production and other anthropogenic activities exponentially increased the concentration of major atmospheric pollutants that damaged the environmental quality and harmfully impacted human health [1,2,3,4,5]. The World Health Organization (WHO) reiterates that environmental and health risk factors from outdoor air pollution are substantial. In 2016, 91% of the world population was living in places where the WHO air quality guidelines levels were not met [6]. New estimates in 2018 revealed that 9 out of 10 people breathe air containing high levels of pollutants [7]. Over the last four decades, rapid economic development, industrialization, and urbanization across China has caused serious air pollution problems [8,9,10]. China’s National Western Development Strategies (the ‘Go West’ movement) by the Chinese government in 1999 also contributed to the spatial expansion of industrialization and urbanization [11]. This has resulted in the GDP reaching around RMB 8270 billion, to which industrial production contributes 34% as the most significant contributing factor (http://www.stats.gov.cn/tjsj/ndsj/, accessed on 18 April 2020). Furthermore, due to rapid industrialization and urbanization air pollution has become the fourth primary health risk factor for all deaths in China after heart attack, dietary risk, and smoking [12]. The recent COVID-19 pandemic at the global and regional level has substantially affected the spatial and temporal characteristics of significant air pollutants, such as NO2, CO, O3, PM10, PM2.5, and SO2 across China [13,14,15]. In this context, the present study aims to assess the overall air quality from ground-based monitoring and remotely sensed datasets using air quality zonal modeling in 15 major cities of China before and after pandemic lockdown periods. Here, we estimated the changes in pollutant concentration and the spatio-temporal variation characteristics for 60 days before and after the shutting down of the nation. Section 2 discusses data and methods where we mentioned data sources, how we analyzed the data, and what techniques we used. Next are the results in Section 3 where we analyzed the spatio-temporal distribution of NO2 before and after the pandemic; total NO2 load over the area using air quality zonal modeling, and trends of air pollutants in China before and after the pandemic. Section 4 presents the discussion where we critically evaluate the results and link our study with other relevant studies with reasons and evidence.
NO2 is primarily released by anthropogenic emissions, which contain the industrial burning of fossil fuels such as coal, oil, natural gas, vehicle exhaust, biomass burning, and electricity generation [16,17,18]. Pollutants such as carbon monoxide (CO) and sulphur dioxide (SO2) are mainly released from industrial plants and heating processes due to anthropogenic activities [19]. SO2 is regarded as one of the major air pollutants in cities because of its negative effects on human health and the ecosystem [20]. Particulate Matter (PM10, PM2.5) is a common proxy indicator for air pollution and it affects more people than any other pollutant. The major components of PM are sulfate, nitrates, ammonia, sodium chloride, black carbon, mineral dust, and water [6]. Tropospheric O3 is produced by emissions of nitrogen oxides (NOx = NO + NO2) and volatile organic compounds (VOCs) in the presence of sunlight [21]. The distribution of O3 varies with space and time and is lower in urban polluted areas than elsewhere because it disappears when it reacts with other pollutants [22,23]. Among NOx elements, NO2 is the most important precursor and quencher of O3 through NOx titration particularly during wintertime [24]. The daytime relationship between NO2 and O3 concentration in Northern China demonstrates significant ozone titration. However, this titration effect has been considerably attenuated with increasing PM2.5, which further reduces the incoming solar radiation, during the lockdown period [25]. It is not only harmful to human health but also poses adverse impacts on plants and ecosystems [1,3,26,27].
Various studies have been carried out to investigate the spatial and temporal distribution patterns of NO2, CO, O3. PM10, PM2.5, and SO2 at national, regional, and local levels [2,28,29,30,31,32,33,34,35,36,37,38,39,40,41,42] along with their driving forces in the recent past [27,43,44,45,46]. Numerous studies have shown a strong correlation between level of exposure to atmospheric pollutants and human health [2,4,5]; increased mortality [47,48,49]; sleeping disorders among elderly [50]; body weight and obesity [51]. To mitigate air pollution, the Chinese government has imposed stringent air quality standards [52] and strengthened emission controls of major atmospheric pollutants [53,54,55,56,57].
The understanding of the spatial distribution of air pollution in China has been recently improved by the application of advanced assessment tools, such as satellite remote sensing. The satellite-retrieved products have many advantages, including global coverage, high spatial-temporal resolution, and historical datasets [41,42,47]. Amid the coronavirus pandemic in China, NASA and European Space Agency (ESA) pollution monitoring satellites have detected significant decreases in nitrogen dioxide (NO2) over mainland China [13,14,15]. There is evidence that the change is at least partly related to the economic slowdown following the outbreak of the COVID-19 virus. According to NASA scientists, the reduction in NO2 pollution was first apparent near Wuhan, but eventually broke out across the country [58]. In line with the previous studies of holiday effects on pollution [59,60,61,62], the main purpose of this work is to quantify spatial and temporal changes in primary pollutants such as NO2, CO, O3, PM10, PM2.5, and SO2 over China’s mainland due to shutdown of anthropogenic activities.

2. Data and Methods

2.1. Study Region

This study focuses on COVID-19′s footprint on air quality in 15 cities of China’s mainland namely Guangzhou, Xiamen, Xian, Wuhan, Beijing, Nanjing, Xinjiang, Lanzhou, Anshan, Shanghai, Jinan, Harbin, Chongqing, Zhengzhou, and Chengdu from where 145 random grid samples were taken for micro-level assessment with the help of air quality zonal modeling (Figures 3 and 6).

2.2. Data Source

The time-average map of NO2 for consecutive 10- and 60-day average tropospheric columns (molecules/cm2) and time series daily area-average of NO2 tropospheric columns (30% cloud screened) with spatial resolution 0.25 × 0.25° from 24 November 2019 to 22 March 2020 were collected from Giovanni interface [63,64,65], Global Modeling and Assimilation Office, NASA. The hourly and daily average concentrations of CO, O3, NO2, PM10, PM2.5, SO2, and AQI data for 50 consecutive days before and 50 days after lockdown were collected from ground monitoring stations provided by the Ministry of Environmental Protection of China (MEPC), China Ministry of Ecology and Environment (https://aqicn.org/map/china/cn/, accessed on 20 March 2020) for the same study period.

2.3. OMI Data Retrieval

Nitrogen dioxide (NO2) is a very important atmospheric gas in both the troposphere where it is a precursor to ozone production and in the stratosphere where it plays the main role in ozone chemistry (https://disc.gsfc.nasa.gov/datasets/OMNO2d_003/summary, accessed on 25 March 2020). NO2 in the troposphere is produced in various combustion processes and lightning, which is an indicator of poor air quality [66]. NO2 product (OMNO2d) is a daily global Level-3 gridded data with a spatial resolution of 0.25 × 0.25° [67,68] which contains time-average tropospheric column (30% cloud screened) and area-average total column [31]. We further retrieved the dataset from optional tools (use smoothing, equidistant cylindrical projection system) with linear scaling and a maximum of 65 palettes were used for this study. In this process, we ignored negative values especially for the 10-day average of the NO2 total column map [31,69].

2.4. Data Analysis Method

As mentioned before, OMI data have been used for detecting the total column of NO2 levels in the atmosphere [31,70]. Previous studies [31,70,71,72] have also used time-average OMI tropospheric total column maps and area-average OMI tropospheric total column datasets for assessing the air quality, especially for macro scale. We selected China’s mainland for this study and assessed the total column of NO2 before and after the outbreak of COVID-19. This study divided China’s mainland into 145 grids (dimension 255 × 255 km2) for the micro-level study. While in the process, the work extracted the exact value of NO2 tropospheric total column of each grid for 15 cities using spatial attribute tools in ArcMap and then we divided 145 grids into 5 equal categories based on the maximum and minimum range. In the last stage, we calculated the total area of each category and compared the extracted datasets with before and after 60- and 10-day area-average columns of NO2 in total and in percentage.
We calculated the daily mean concentration of CO, O3, NO2, PM10, PM2.5, SO2, and AQI from ground monitoring datasets provided by MEPC. We also calculated the 50 days before and after average concentration of each pollutant in 14 major cities of China obtained from real-time datasets. This study conducted a compound bar graph and trend line analysis for monitoring the change in air quality before and after the lockdown of 14 cities of China, in terms of total and percentage.

Air Quality Zonal Modeling

We conducted air quality zonal modeling for predicting zonal change in air quality. In general, the air quality zonal modeling represents the overall pollution concentration in any specific region based on several pollutant particles obtained from remotely sensed raster datasets [73]. In other words, the air quality zonal model is a compilation of total air pollution load in a particular zone accumulated by various air pollution particles which is represented through individual grids over a specific time period. This spatial and temporal model were created through different phases using various statistical analyses of GES-DISC time-averaged map and area-averaged time-series datasets obtained from MODIS- Terra, MERRA-2, OMI, and AIRS.
For this study, we conducted various sets of statistical analyses for interpreting remotely sensed data. In the first phase, we divided China’s mainland into 145 grids, each grid representing 65,025 km2. After that, we extracted each pollutant’s average concentration from an individual grid using the raster calculator in ArcMap. The Moving Mean (MM) of 10 days total column of NO2 of 15 cities was interpreted using equation 1. A specific grid value was ranked using exploratory analysis of ranking given by Alvo and Philip [74] (Equation (2)). The average concentration of each air pollutant particle of 145 grids was categorized based on the maximum and minimum range of datasets which is computed in the second phase (Equation (3)). After that, we compiled total pollution concentration in a specific grid using composite indexing and principal component analysis (PCA); subsequently, we conducted Spearman’s model for factor analysis for assessing the maximum and minimum reduction [75] in specific air pollutants which is compiled in the third phase (Equations (2) and (3)). The 60-day average total air pollution load was calculated using Equation (4); here, we excluded zero factors of different raster datasets. The sum of the 60-day average concentration of different air pollutants and their percentage change was calculated using Equation (5). Zonal indexing of specific grids was formulated for extracting the exact concentration of air pollution (Equation (6)) and in the last phase, we calculated area/grid-wise total air pollution load (Equations (7) and (8)) through spatial analysis tools in GIS using air quality zonal modeling.
m m = 10 n × 6
where mm = moving mean, 10 = sum of 10 days average, n = number, and 6 = number of raster data.
m = j = 1 dx   n j v j × i n
where m = mean rank, d x = dimension, i = th entry equals, v j ,   j = 1 represents all possible rankings of the d x , n j = frequency of ranking, v j i = rank score, and n = number of raster data sets.
x = n 1   F 1 + n 2   F 2 + + n m m   F m + s m   F m
where x = variation in maximum and minimum range of air pollutants with zero mean, n 1 ,   n 2   = loading factors of specified air pollutants and n m m = moving mean, F 1 , F 2 = common factors and F m = moving mean of the common factor with zero mean, and s m = specific factor of the individual mean.
μ p = x 1 + x 2 + x 3 + x 4 + x 5 + x 6 6   n a
where μ p = 60 days average of pollution load, x = sum of 10 days average of pollution load, 6 = number of datasets, and   n a = excluding factor of zero (data not available).
p = 60 a 60 b 60 b × 100
where p = change in percentage, 60 = sum of 60 days average concentration, a = during lockdown, and b = before.
a = w i x i x 2 w i
where a = area of individual cells, w = weights, i = an index over all the data points being averaged, and xi = individual pollutant variables.
t =   t a o p n a
where t = total pollution counts in individual grids, taop = total air pollution load, n a = excluding ‘data not available’ girds.
a = n × d x
where a = total area of each category, n = number of countable grids, and dx = dimension of different variables/ grids (255 × 255 km2).

3. Results

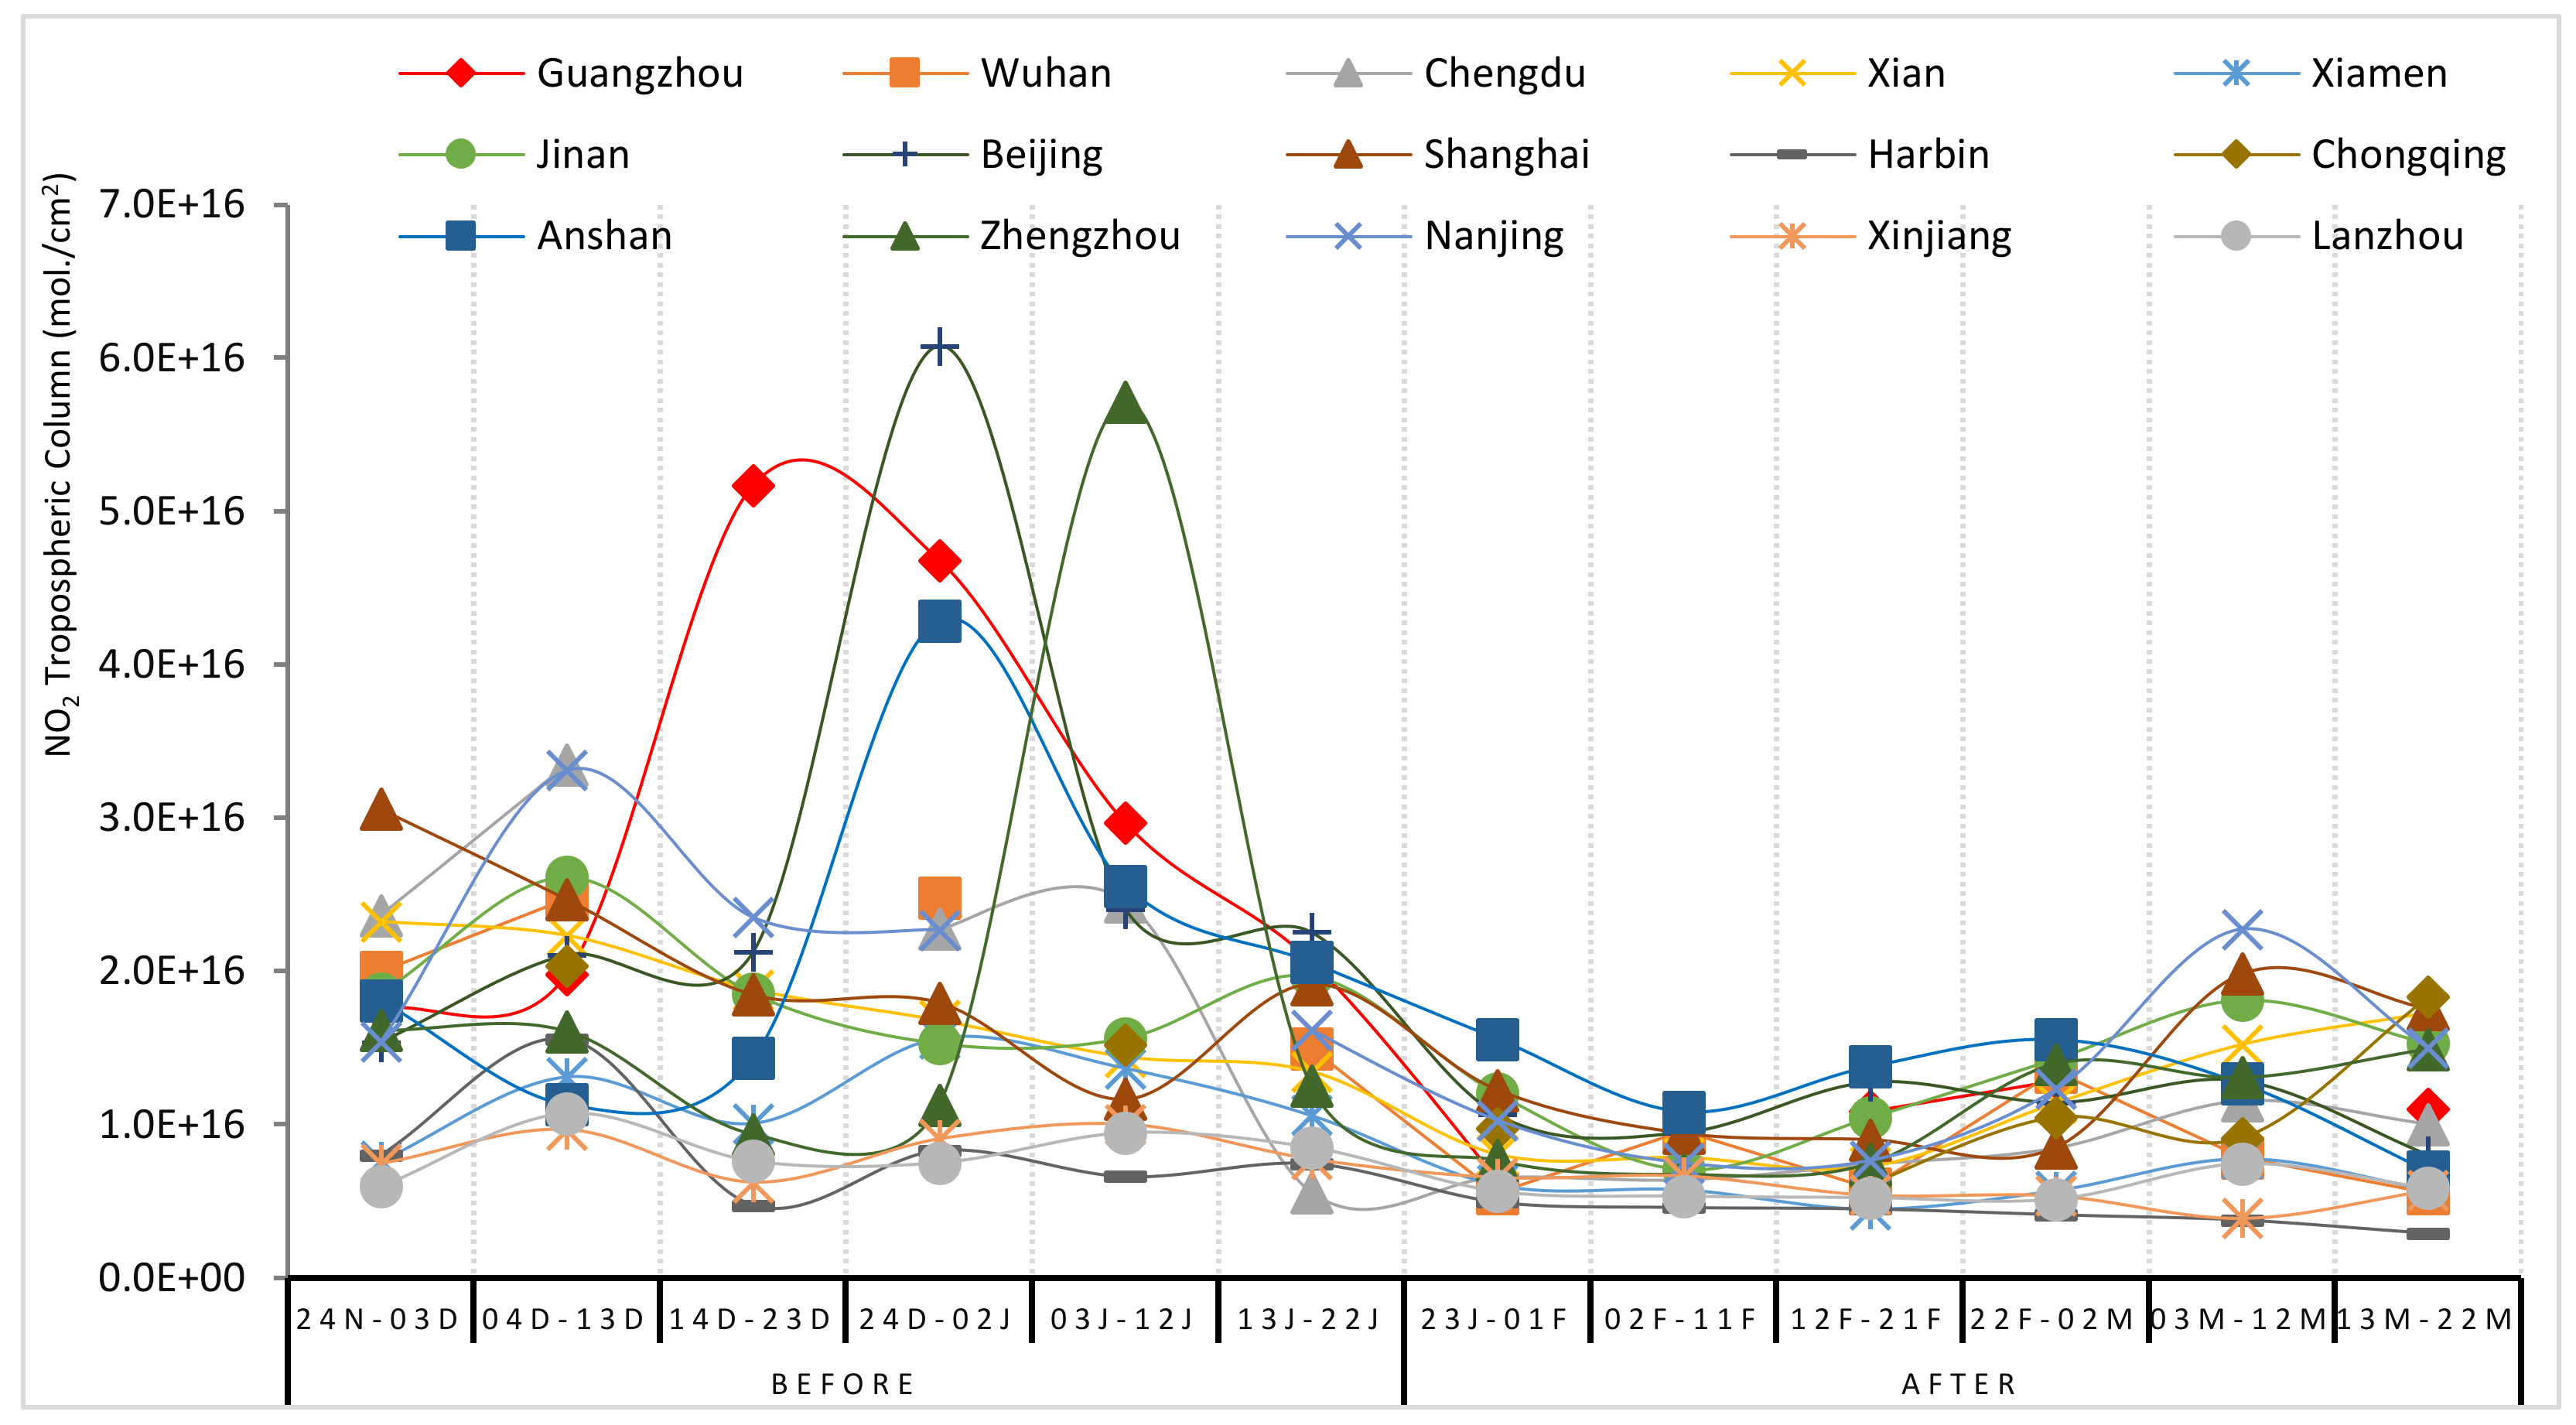
3.1. Spatio-Temporal Distribution of NO2 before and after the Pandemic

The spatial distribution of 10-day time-average maps of NO2 tropospheric columns before and after the COVID-19 pandemic exhibited that the cities experienced a low concentration of NO2 and improved quality of air. Among these, the period 2 February to 11 February observed the lowest level of NO2 in all 15 major cities (Figure 1).
The post-lockdown maps portray that NO2 concentration has increased from 22 February to 12 March and then again started decreasing from 13 March to 22 March. The 10-day average NO2 tropospheric column (Figure 2) reveals that the level of NO2 has tremendously reduced in major cities such as Guangzhou, Beijing, Anshan, Zhengzhou, and Chengdu after the pandemic. The air quality has started improving from the 2nd week of January just after the lockdown throughout the country.
Similarly, the 60-day time-average map (Figure 3) of NO2 tropospheric column also displayed that the lowest range of NO2 concentration was 2e+14 and the maximum concentration was 3.5e+16 before imposition of lockdown whereas the lowest range of NO2 concentration came down to 1.4e+15 and the maximum to 1.8e+16 after the lockdown.
The absolute concentration of NO2 tropospheric column (Figure 4) also revealed that all 15 major cities of China experienced lower emissions of NO2 just after lockdown. The maximum concentration of NO2 tropospheric column was 2.8e+16 before lockdown (24 November–22 January) and the minimum concentration was 1e+16 after lockdown (23 January–22 March) (Figure 4a). While we look at the proportion of NO2 concentration reduction, Guangzhou received only 37% of NO2 in the atmosphere after the pandemic. Similarly, the air quality of other cities also improved because of low emissions of NO2 after lockdown. The graph (Figure 4b) revealed that Wuhan received only 35% of NO2 concentration; whereas, Chengdu received 39%, Beijing 41%, Nanjing 48%, Xiamen 50%, Chongqing 53%, and Harbin 57% after the pandemic outbreak (23 January–22 March). On the other hand, the minimum reduction in NO2 concentration was found in cities of Anshan (67%), Lanzhou (67%), Jinan (66%), Xinjiang (65%) where NO2 concentration was comparatively low even before the pandemic in these same regions (Figure 4b).
The time-series of NO2 tropospheric column graph (30% cloud screened) displays that the total mass column of NO2 in China was highest during the first two weeks of December 2019 and remained as high as 4.3e+15 till the second week of January. After that, the NO2 mass column suddenly dropped till March 22 (Figure 5).

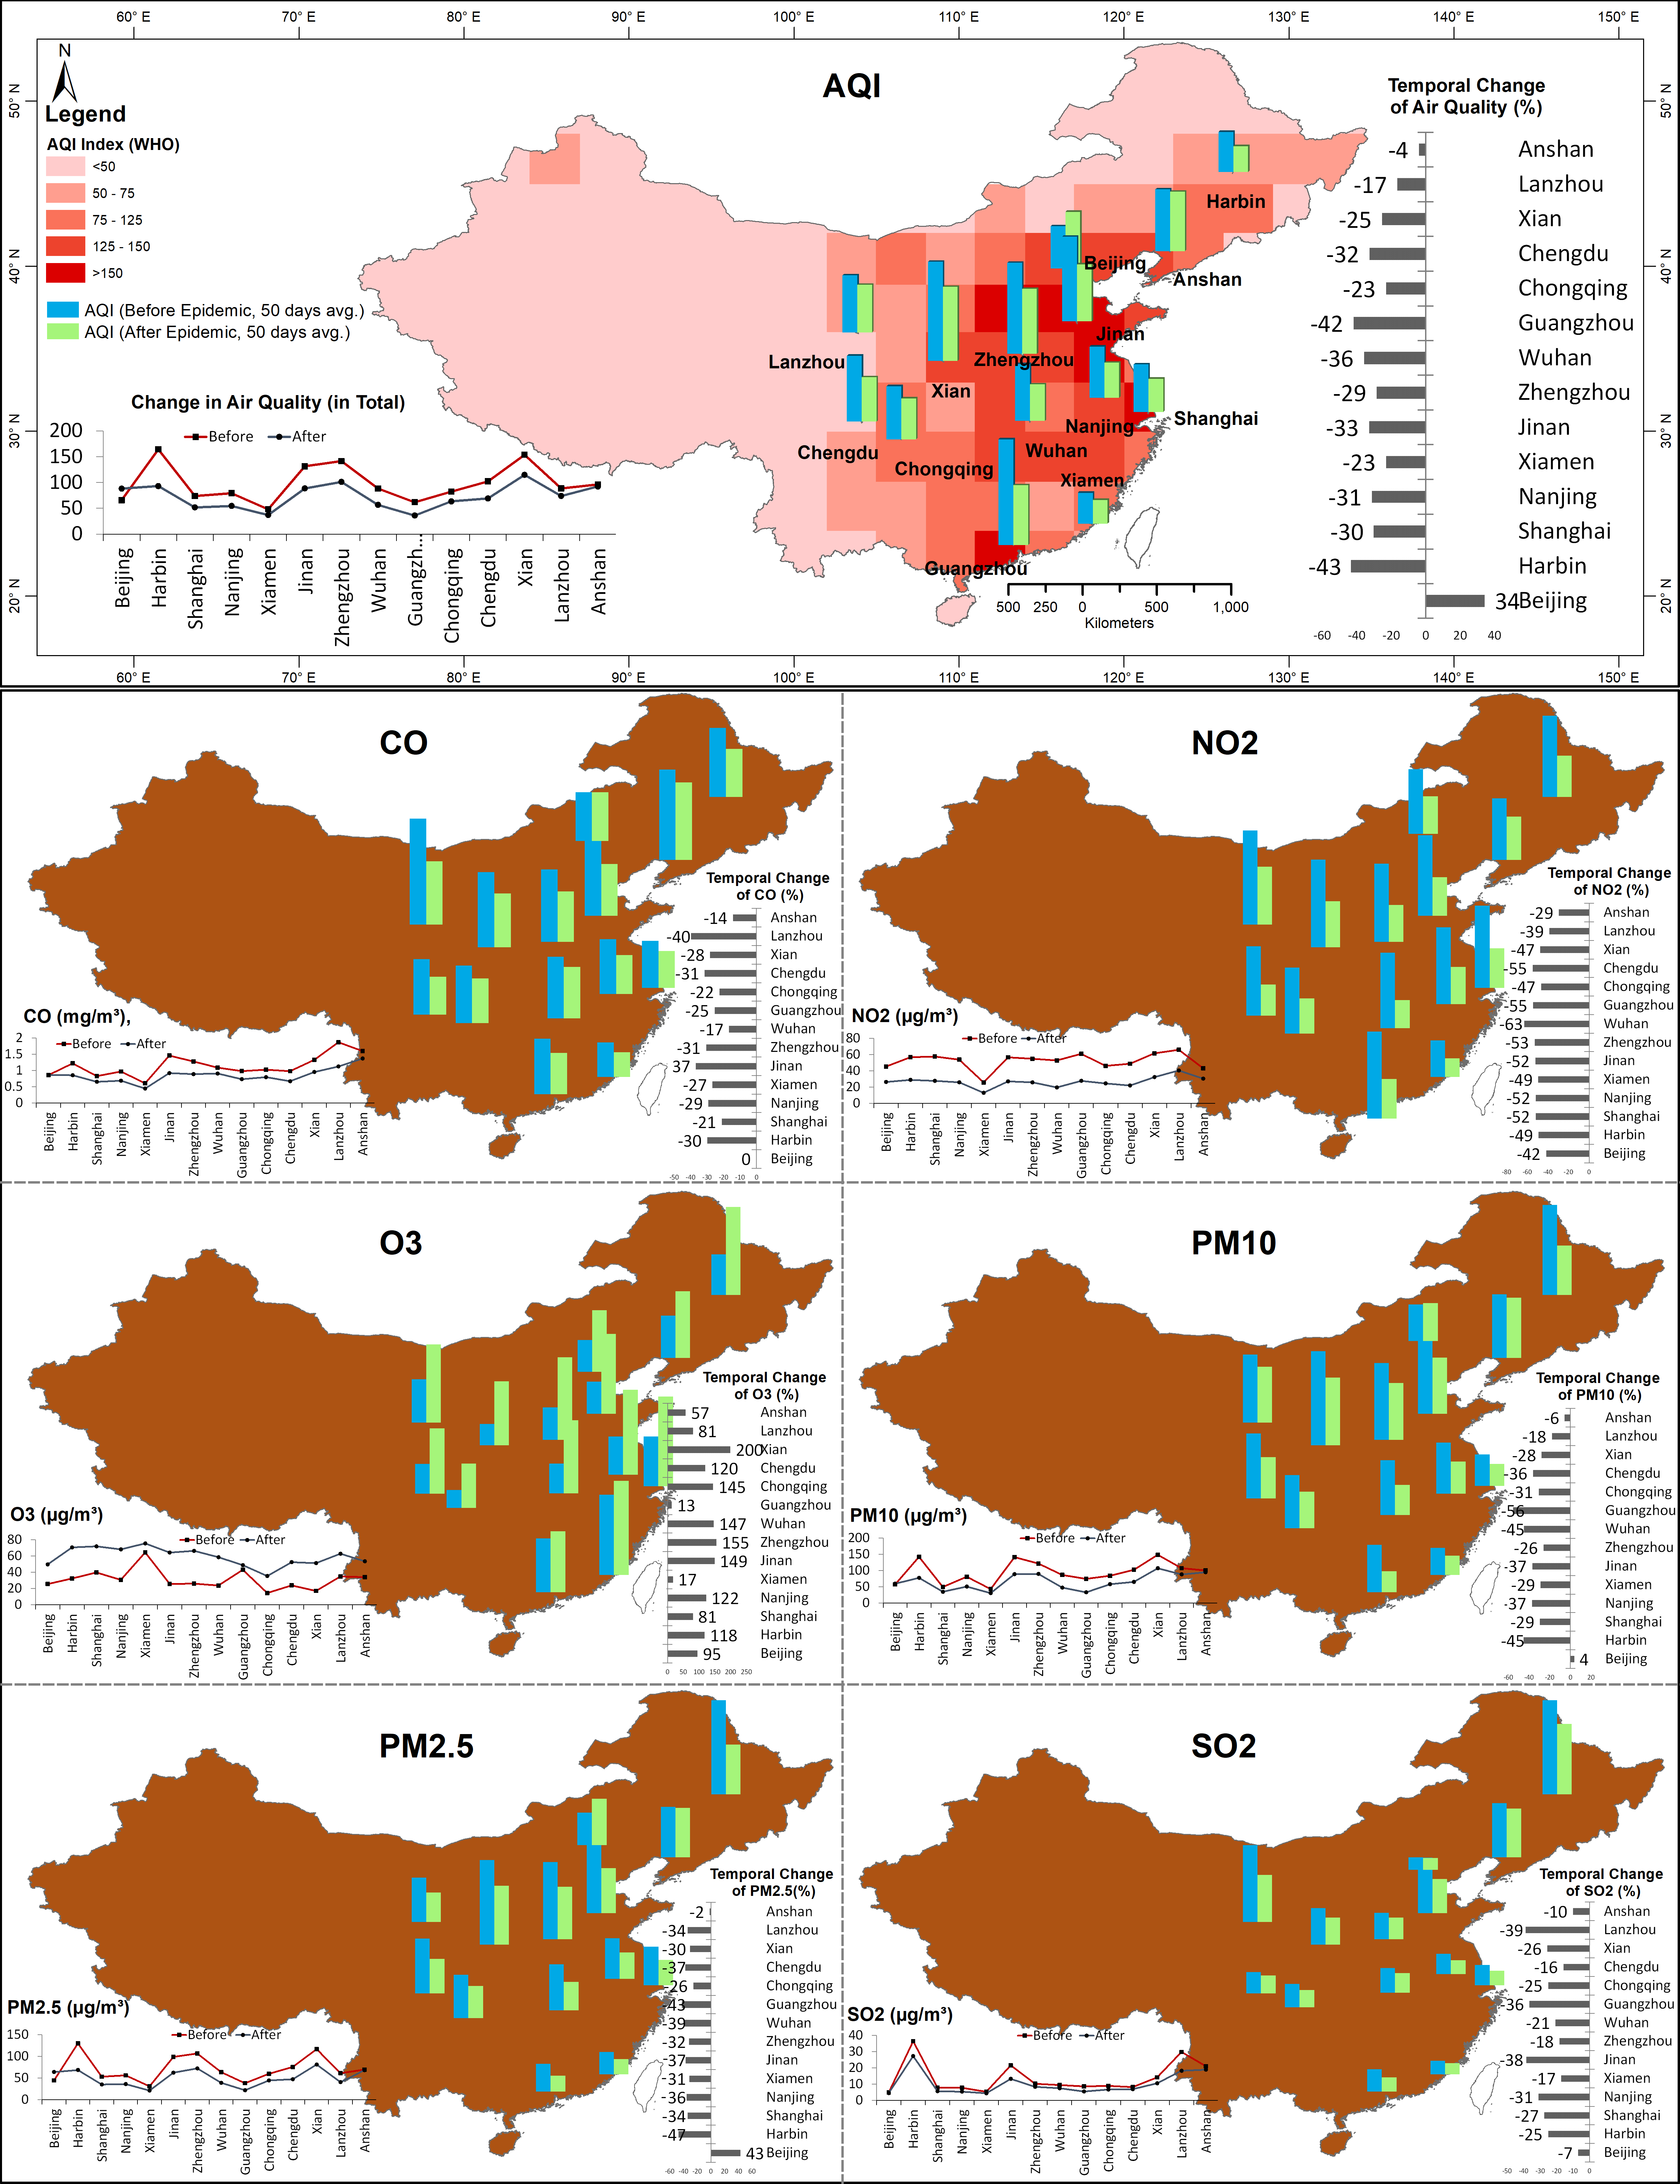
3.2. Total NO2 Load over the Area Using air Quality Zonal Modeling

A total 60-day average NO2 tropospheric column was demonstrated through the air quality zonal modeling (Figure 6). Here, the whole country was divided into 145 grids (255 × 255 km2) where the spatial distribution of NO2 (Figure 6a) was displayed for the micro-level understanding of the air quality changes in different regions of the country. The area was also calculated under each grid category. The NO2 concentration ranges between (1.7e+15–3.2e+15) had 131 grids and the area was 5.5 million sq.km before the lockdown but the grids have increased to 191 and the area has also increased to 80 million sq.km. Conversely, the areas under the high NO2 concentration category (5.5e+15–9.8e+15) have significantly decreased from 1.1 to 0.2 million sq.km. Moreover, there was a significant decrease in NO2 concentration in the areas that come under a very high concentration category where the NO2 tropospheric column ranges between 1.6e+16 and 2.6e+16; 13 grids were accounting for 0.55 million km2 before the lockdown but none of the areas were under this very high category after lockdown (Figure 6a).
The total column of NO2 decline rate in percentage was grouped into three categories, i.e., less than 50%, 51–70%, and more than 70%. The maximum decline rate (more than 70%) of the NO2 total column was measured in Guangzhou, Wuhan, and Chengdu city of China before and after the pandemic COVID-19 event (Figure 6b). Figure 6c reveals the trend of the total NO2 tropospheric column of 145 random sites before and after the pandemic where it is clearly visible that almost all the sample sites have experienced a low concentration of NO2 in the atmosphere.
In the graphs (Figure 7), steepness of the histogram revealed the degree of reduction in the NO2 concentration. Guangzhou city showed high steepness of NO2 reduction after the pandemic. The maximum (almost 60%) declining rate of NO2 was observed in Guangzhou, Wuhan, Chengdu, and Beijing; whereas the minimum (almost 40%) declining rate of NO2 total column in the atmosphere was found in Jinan, Shanghai, Anshan, Zhengzhou, Xinjiang, and Lanzhou.

3.3. Trends of Air Pollutants in China before and after the Pandemic

The overall air quality change in 50 days (Table 1) reveals that Harbin recorded the highest reduction (43%) in air pollutants followed by Guangzhou (42%), Wuhan (36%), Jinan (33%), Chengdu (32%), Nanjing (31%), Shanghai (30%), Zhengzhou (29%), Xian (25%), Xiamen (23%), Chongqing (23%), Lanzhou (17%), and Anshan (4%). The most interesting fact in this analysis is that when all the cities were experiencing improved air quality, Beijing recorded deteriorating air quality; it recorded a 34% increase in air pollutants during the 50-day study period after lockdown. In this context, it is important to look into the individual pollutants in detail for an insight into understanding their roles in determining air quality.
During the 50 days of study after lockdown, the concentration of carbon monoxide (mg/m3) reduced by 40% in Lanzhou, 37% in Jinan, 31% in Zhengzhou and Chengdu, 30% in Harbin, 29% in Nanjing, 28% in Xian, 27% in Xiamen, and 25% in Guangzhou (Figure 8b). The temporal changes in NO2 (Figure 8c) reveal that the more than 50% concentration of NO2 has reduced in Wuhan (63%), Chengdu and Guangzhou (55%), Zhengzhou (53%), Jinan, Nanjing and Shanghai (52%) while, other cities received below 50% NO2 concentration (ranging between 20% and 49%).
On the other hand, the results displayed a drastic rise in ozone in the atmosphere in almost all cities after the lockdown. The detailed analysis of O3 (Figure 8d) explained that Xian experienced a 200% rise in O3. Moreover, most of cities experienced more than 100% escalation of O3, for instance, Zhengzhou (155%), Jinan (149%), Wuhan (147%), Chongqing (145%), Nanjing (122%), Chengdu (120%), and Harbin (118%). Interestingly Beijing, the city where the overall quality of air has declined, also experienced a high rise in O3 (95%). In addition, the concentration of ozone has also increased in Shanghai (81), Lanzhou (81%), and Anshan (57%). Cities such as Xiamen and Guangzhou experienced only 17% and 13% increases in O3, respectively.
The temporal change in PM10 (μg/m3) (Figure 8e) reveals its sudden decrease in all cities except Beijing after the lockdown (Table 1). The maximum decrease in PM10 concentration was observed in Guangzhou (56%) followed by Wuhan and Harbin (45%). The other cities that observed a substantial decrease in PM10 are Nanjing and Jinan (37%), Chengdu (36%), Shanghai and Xiamen (29%), Xian (28%), and Zhengzhou (26%). Conversely, PM10 concentration increased by 4% in Beijing after the lockdown. Like PM10, the concentration of PM2.5 also considerably decreased after the pandemic lockdown (Figure 8f). The cities which observed low concentrations of PM2.5 are Harbin (47%), Guangzhou (43%), Wuhan (39%), Jinan and Chengdu (37%), Nanjing (36%), Shanghai and Lanzhou (34%), Zhengzhou (32%), Xiamen (31%), and Xian (30%). Simultaneously, Beijing experienced a very high concentration of PM2.5 (43%) after the lockdown.
Along with other pollutants, the temporal change in SO2 concentration (Figure 8g) displays a substantial decrease in all cities after the lockdown. The cities that experienced a high proportion decrease in SO2 concentration are Lanzhou (39%), Jinan (38%), Guangzhou (36%), Nanjing (31%), Shanghai (27%), Xian (26%), and Chongqing and Harbin (25%) (Table 1).
The daily average concentration of air pollutants for 100 days (50 days before lockdown and 50 days after lockdown) of 14 cities (Figure 9) reveals that the air quality has remarkably improved in Guangzhou where 43% of pollutants have declined during this study period. The concentration of PM10 and NO2 has reduced by 56% and 55%, respectively. Similarly, in Shanghai, the overall pollutants in the atmosphere have decreased by 30% (Table 1). In Nanjing, the overall air quality (AQI) has improved by 31%. Moreover, the air quality of Xiamen has improved by 23% and the concentration of NO2 and PM2.5 has declined by 49% and 31%, respectively. In Jinan, the overall air quality has improved by 33% and the NO2 concentration has decreased by 52%. However, the concentration of O3 has amplified by 149%. In Zhengzhou, the concentration of NO2 has reduced by 53% and the concentration of O3 has grown by 155%. In Wuhan, the major pandemic affected area, the concentration of NO2 has reduced by 63% and PM10 by 45% whereas the concentration of O3 has increased by 147%. The air quality has also improved in Harbin where the concentration of NO2 has reduced by 49% and the concentration of O3 has increased by 118%. In Chongqing, the concentration of NO2 has reduced by 47% and the concentration of O3 has improved by 145%. Similarly, in Chengdu, there has been a 55% reduction in NO2 concentration and a 120% increase in O3 concentration in the atmosphere. In Xian, there is a 47% change in NO2 and a 200% increase in O3 in the atmosphere. In Anshan, the concentration of NO2 has reduced by 29% whereas the concentration of O3 has increased by 57%.

4. Discussion

The coronavirus first outbreak started in December 2019 and human-to-human transmission was confirmed on 20 January 2020 [14]. Wuhan city was locked from other regions of the country to stop the spread of the SARS-CoV virus since 23 January 2020. After a few days, the administrative authorities of Guangzhou and Beijing declared the lockdown. The highest level of public health emergency was announced within a week in a few administrative units [13,15]. The anthropogenic emissions from industrial and manufacturing units were closed after the spreading of coronavirus which caused improvement in overall air quality in China [14].
The present study found that there was a substantial decrease in NO2 concentration and consequently improvement in air quality. It is noteworthy that NO2 concentration has tremendously decreased in the cities of Guangzhou, Wuhan, and Chengdu. These cities come under the same category, where NO2 tropospheric column (molecules/cm2) ranges between 1.6e+16 and 3e+16 before the pandemic but after the shutdown none of these cities reported high emissions of NO2. NASA and European Space Agency (ESA) pollution monitoring satellites have also detected a substantial decrease in NO2 over China due to a complete shutdown. The concentration of nitrogen dioxide was reduced as the sources of this pollutant such as motor vehicles, power plants, and industrial facilities were closed for two months [58]. In addition, the lockdown has coincided with the Lunar New Year celebration which also facilitated to decrease the concentration of NO2 in all major cities in China’s mainland. Some of the preceding studies have also established that many cities such as Guangzhou, Beijing, Chengdu, Shenzhen, Nanjing, Shanghai, Chongqing, etc., have experienced low concentrations of NO2 and particulate matter in the atmosphere due to regulatory effects in China [76,77,78,79].
The study found a substantial decline in CO in all cities except Beijing where it remained static. The maximum declining rate of CO was observed in Lanzhou (40%), Jinan (37%), and Zhengzhou (31%) whereas the minimum declining rate of CO was measured in Anshan (14%), Wuhan (17%), and Shanghai (21%) because of the complete halt of vehicles, wood-burning, and industry. Similar to this line, several studies established that vehicles, wood-burning, and industry are the main sources of CO [80,81,82,83,84]. The reduction in CO in 60 days is a significant indicator for air quality because of its 1–2-month life span in the atmosphere, thereby improved quality of air [85,86].
The particulate pollutants such as PM2.5 and PM10 have also decreased substantially during the lockdown period as the sources of these pollutants were restricted. Several previous studies have documented that the primary sources of PM2.5 and PM10 are automobile emissions, incomplete combustion, wind-blown soil and dust, construction dust, and biomass burning [82,87,88]. The result displays that the maximum declining rate of PM10 and PM2.5 was measured in Guangzhou (56% and 43%), Wuhan (45% and 39%), Jinan (37% and 38%), and Nanjing (37% and 36%). Similarly, some other studies have also found that Beijing, Lanzhou, Tianjin, Nanning, and Chongqing reported lower concentrations of these particulate matters during the regulation effect on certain occasions [89,90,91]. On the other hand, the concentration of SO2 has also declined in all cities due to strict regulation and the closing of heavy industrial factories such as iron, steel, and cement industries [92,93,94,95]. The major sources of SO2 are coal combustion of biomass in coal-fired power plants and industry sector [9,96,97,98] that were completely locked during the pandemic. Some other studies have exhibited that SO2, combined with volatile organic compounds (VOCs), enhances the formation of new particles, particularly sulphate which is one of the main components of PM2.5 [99,100,101,102].
Consistent with previous studies, this study [103,104,105] also found that due to the decrease in all air pollutants including CO, NO2, PM2.5, PM10, and SO2 the total concentration of O3 has increased in all 15 cities in China during the study period. The maximum increasing rate of O3 was found in Xian (200%), Zhengzhou (155%), Jinan (149%), and Chongqing (145%) whereas the minimum increasing trend was found in Guangzhou (13%), Xiamen (17%), and Anshan (57%). Several reasons have been proposed to explain this complex relation: (a) inverse relation between O3 and its precursors NO2, PM2.5, PM10, and SO2 lower emission of these pollutants results in faster ozone production in nitrogen oxide (NOx) concentrated areas [106,107,108,109]; (b) low concentration of NOx also causes less destruction of ozone [88,110]; (c) decreased level of atmospheric pollutants leads to more clear sunshine that also accentuates more ozone production [108,111]. In addition, a pause of vehicles also resulted in a reduction in CO and NOx including NO and NO2 facilitating an increase in the level of ozone in the atmosphere [81,112,113,114]. The production of ozone under the influence of anthropogenic activities in the troposphere and involving catalysis by NO2 and NO should be significant [22]. Its precursor compounds NOx and VOC have a wide variety of sources and can exhibit a non-linear effect on ozone production, while its accumulation is strongly influenced by meteorological parameters [115]. Although reductions in atmospheric ozone allow more solar radiation to reach ground level, resulting in higher surface temperatures, a decrease in the downward longwave radiation emitted by CO2, O3, and H20 from a cooler lower stratosphere with less ozone would result in a decrease in surface temperatures [22].
One of the major outcomes of reduced atmospheric pollutants is a substantial improvement in overall air quality except for Beijing. Since most of the industrial production, vehicle movements, and other anthropogenic activities in the cities were closed, the reduced level of NO2, CO, PM2.5, PM10, and SO2 improved the air quality in these cities. Similar to this, several previous studies have found that air quality is positively related to the low concentration of atmospheric pollutants [116,117,118]. Conversely, Beijing has reported a decline in the overall air quality during the study period despite the closure of manufacturing units. The reason may be the increasing level of PM2.5 and PM10 during the same period. The concentration of PM2.5 has increased manyfold in Beijing because the city experienced a number of severe haze events during the lockdown period. Some of the previous studies [25,31,79] mentioned that complex relationships among changes in relative humidity, near-surface wind speed and direction, planetary boundary layer height, and precipitation have influenced the increasing concentration of PM2.5 in Beijing. Climatologically, Beijing has dry air during the wintertime, but a larger than normal amount of moisture accumulated near the surface during the lockdown period. This has facilitated multiphase reactions for aerosol formation and growth [25]. Moreover, wind conditions also facilitate to formation of haze in Beijing as the mean wind speed declined. In addition, the wind direction changed to southerly which usually carries polluted air from Hebei Province’s industrial regions. Moreover, the planetary boundary layer height in northern China also declined during the lockdown and this lower height facilitated stagnant air and subsequently resulted in increasing PM2.5 in Beijing. Further, during the lockdown period, precipitation mainly occurred in southern China and the Northern part did not receive enough rain to wash out the haze that formed over the region [40].

5. Conclusions

The assessment of major atmospheric pollutants during lockdown due to the COVID-19 pandemic has markedly influenced the air quality in China. The cities such as Guangzhou, Wuhan, and Chengdu that have shown a very high concentration of NO2 tropospheric column (molecules/cm2) before the pandemic and have experienced a sudden decline after the lockdown. The air quality zonal model has also displayed about 390,150 km2 areas that were under the high level of air pollutants have come under low concentration areas. In addition, the spatio-temporal evaluation of the NO2 and other main pollutants in the major 15 cities of China exhibited a remarkable reduction which in turn, facilitated to improve the overall air quality except in Beijing where the air quality has been degraded due to the overwhelming concentration of PM2.5 and PM10.
The overall air quality of eastern coastal and industrial cities such as Jinan, Zhengzhou, Wuhan, Guangzhou, Chengdu, and Xian have recorded low concentrations of air pollutants and such reduction in atmospheric pollutants has improved the air quality. The overall air quality change in 50 days reveals that Harbin has recorded the highest reduction (43%) in air pollutants followed by Guangzhou (42%), Wuhan (36%), Jinan (33%), Chengdu (32%), Nanjing (31%), Shanghai (30%), Zhengzhou (29%), Xian (25%), Xiamen (23%), Chongqing (23%), Lanzhou (17%), and Anshan (4%). Since most of the industrial productions, vehicle movements, and other anthropogenic activities in the cities were restricted, the study revealed that the levels of NO2, CO, PM2.5, PM10, and SO2 have remarkably reduced. It is noteworthy that the reduction in atmospheric pollutants and consequently improved air quality would have a positive impact on the environment and human health. To address the emission of atmospheric pollutants, particularly NO2, CO, PM2.5, PM10, and SO2, the government needs to establish an environmental policy framework involving central, provincial, and local governments with stringent laws for environmental protection. The restriction and regulation of all anthropogenic sources of pollutants due to the COVID-19 outbreak was an example of such stringent enforcement of the law to protect human health. Similarly, to protect the environment from atmospheric pollutants strong political commitment, technological development, and policy enforcement are essential to make policies, such as 11th and 12th five-year plans of China, successful towards improving and protecting the environment and human health.

Author Contributions

Data collection, S.R. and R.C.; conceptualization, S.R., S.J., P.K. and R.C.; methodology, S.R.; software, S.R.; validation, S.R. and R.C.; formal analysis, S.J.; investigation, P.K. and R.C.; resources, S.R., S.J., P.K. and R.C.; data curation, S.R.; writing introduction, P.K. and S.J.; writing data source and methodology, S.R.; writing results discussion and conclusion, S.J.; referencing, S.R. and S.J.; review and editing, S.R.; supervision, P.K. and R.C. All authors have read and agreed to the published version of the manuscript.

Funding

This research received no external funding.

Informed Consent Statement

Not applicable.

Data Availability Statement

Data are openly available at Global Modeling and Assimilation Office, NASA. The hourly and daily average concentrations of CO, O3, NO2, PM10, PM2.5, SO2, and AQI data on China Ministry of Ecology and Environment (https://aqicn.org/map/china/cn/, accessed on 20 March 2020).

Acknowledgments

We would like to thank the Ministry of Environmental Protection of China (MEPC), Chinese Ministry of Ecology and Environment, 2020 and OMI datasets, Global Modeling and Assimilation Office, NASA for providing data.

Conflicts of Interest

The authors declare no conflict of interest.

Abbreviations

AIRSAtmospheric Infrared Sounder
AQIAir Quality Index
COCarbon Monoxide
COVIDCoronavirus Disease
ESAEuropean Space Agency
GES-DISCGoddard Earth Sciences Data and Information Services Center
GSFCGoddard Space Flight Center
MEPCEnvironmental Protection of China
MERRA-2Modern Era Retrospective Research and Application
MODIS-terraModerate Resolution Imaging Spectroradiometer
NASANational Aeronautics and Space Administration
NH3Ammonia
NO2Nitrogen Dioxide
NOxNitrogen Oxide
O3Ozone
OMIOzone Monitoring Instrument
PCAPrincipal Component Analysis
PM10Particulate Matter ≤10 μm
PM2.5Particulate Matter ≤2.5 μm
SO2Sulphur Dioxide
VOCsVolatile Organic Compounds
WHOWorld Health Organization

References

  1. Brauer, M.; Freedman, G.; Frostad, J.; Van Donkelaar, A.; Martin, R.V.; Dentener, F.; Dingenen, R.V.; Estep, K.; Amini, H.; Apte, J.S.; et al. Ambient air pollution exposure estimation for the global burden of disease 2013. Environ. Sci. Technol. 2016, 50, 79–88. [Google Scholar] [CrossRef]
  2. Kuerban, M.; Waili, Y.; Fan, F.; Liu, Y.; Qin, W.; Dore, A.J.; Peng, J.; Xu, W.; Zhang, F. Spatio-temporal patterns of air pollution in China from 2015 to 2018 and implications for health risks. Environ. Pollut. 2020, 258, 113659. [Google Scholar] [CrossRef]
  3. Lin, Y.; Jiang, F.; Zhao, J.; Zhu, G.; He, X.; Ma, X.; Li, S.; Sabel, C.E.; Wang, H. Impacts of O3 on premature mortality and crop yield loss across China. Atmos. Environ. 2018, 194, 41–47. [Google Scholar] [CrossRef]
  4. Liu, W.; Xu, Z.; Yang, T. Health effects of air pollution in China. Int. J. Environ. Res. Public Health 2018, 15, 1471. [Google Scholar] [CrossRef] [PubMed] [Green Version]
  5. Zou, B.; Li, S.; Lin, Y.; Wang, B.; Cao, S.; Zhao, X.; Peng, F.; Qin, N.; Guo, Q.; Feng, H.; et al. Efforts in reducing air pollution exposure risk in China: State versus individuals. Environ. Int. 2020, 137, 105504. [Google Scholar] [CrossRef]
  6. WHO. Air Pollution in the Western Pacific. 2016. Available online: https://www.who.int/data/gho/data/themes/air-pollution/who-air-quality-database#cms (accessed on 15 April 2020).
  7. WHO. Air Pollution in the Western Pacific. 2019. Available online: https://www.who.int/westernpacific/health-topics/air-pollution (accessed on 15 April 2020).
  8. Richter, A.; Burrows, J.P.; Nüß, H.; Granier, C.; Niemeier, U. Increase in tropospheric nitrogen dioxide over China observed from space. Nature 2005, 437, 129–132. [Google Scholar] [CrossRef]
  9. Zhang, H.; Li, J.; Ying, Q.; Yu, J.Z.; Wu, D.; Cheng, Y.; He, K.; Jiang, J. Source apportionment of PM2.5 nitrate and sulfate in China using a source-oriented chemical transport model. Atmos. Environ. 2012, 62, 228–242. [Google Scholar] [CrossRef]
  10. Zhao, B.; Wang, S.X.; Liu, H.; Xu, J.Y.; Fu, K.; Klimont, Z.; Hao, J.M.; He, K.B.; Cofala, J.; Amann, M. NOx emissions in China: Historical trends and future perspectives. Atmos. Chem. Phys. 2013, 13, 9869–9897. [Google Scholar] [CrossRef] [Green Version]
  11. Deng, X.; Bai, X. Sustainable urbanization in western China. Environ. Sci. Pol. Sustain. Dev. 2014, 56, 12–24. [Google Scholar] [CrossRef]
  12. Jiang, L.; Bai, L. Spatio-temporal characteristics of urban air pollutions and their causal relationships: Evidence from Beijing and its neighboring cities. Sci. Rep. 2018, 8, 1279. [Google Scholar] [CrossRef] [Green Version]
  13. Lau, H.; Khosrawipour, V.; Kocbach, P.; Mikolajczyk, A.; Schubert, J.; Bania, J.; Khosrawipour, T. The positive impact of lockdown in Wuhan on containing the COVID-19 outbreak in China. J. Travel Med. 2020, 1–7. [Google Scholar] [CrossRef] [Green Version]
  14. Pei, Z.; Han, G.; Ma, X.; Su, H.; Gong, W. Response of major air pollutants to COVID-19 lockdowns in China. Sci. Total Environ. 2020, 743, 140879. [Google Scholar] [CrossRef]
  15. He, G.; Pan, Y.; Tanaka, T. The short-term impacts of COVID-19 lockdown on urban air pollution in China. Nat. Sustain. 2020, 3, 1005–1011. [Google Scholar] [CrossRef]
  16. International Energy Agency (IEA). Weo-2016 Special Report Energy and Air Pollution; International Energy Agency: Paris, France, 2016; pp. 1–266. Available online: https://webstore.iea.org/weo-2016-special-report-energy-and-air-pollution (accessed on 12 April 2020).
  17. World Energy Council. World Energy Resources 2013 Survey: Summary; World Energy Council: London, UK, 2013; pp. 1–29. Available online: https://www.worldenergy.org/assets/images/imported/2013/10/WEC_Resources_summary-final_180314_TT.pdf (accessed on 27 April 2020).
  18. WHO. Ambient Air Pollution: A Global Assessment of Exposure and Burden of Disease. 2016. Available online: http://who.int/phe/publications/air-pollution-global-assessment/en/ (accessed on 7 April 2020).
  19. Ashraf, A.; Butt, A.; Khalid, I.; Alam, R.U.; Ahmad, S.R. Smog analysis and its effect on reported ocular surface diseases: A case study of 2016 smog event of Lahore. Atmos. Environ. 2019, 198, 257–264. [Google Scholar] [CrossRef]
  20. Zhu, L.; Gan, Q.; Liu, Y.; Yan, Z. The impact of foreign direct investment on SO2 emissions in the Beijing-Tianjin-Hebei region: A spatial econometric analysis. J. Clean. Prod. 2017, 166, 189–196. [Google Scholar] [CrossRef]
  21. Atkinson, R. Atmospheric chemistry of VOCs and NOx. Atmos. Environ. 2000, 34, 2063–2101. [Google Scholar] [CrossRef]
  22. Crutzen, P.J. The role of NO and NO2 in the chemistry of the troposphere and stratosphere. Annu. Rev. Earth Planet. Sci. 1979, 7, 443–472. [Google Scholar] [CrossRef]
  23. Parra, M.A.; González, L.; Elustondo, D.; Garrigó, J.; Bermejo, R.; Santamaría, J.M. Spatial and temporal trends of volatile organic compounds (VOC) in a rural area of northern Spain. Sci. Total Environ. 2006, 370, 157–167. [Google Scholar] [CrossRef] [PubMed]
  24. Jhun, I.; Coull, B.A.; Zanobetti, A.; Koutrakis, P. The impact of nitrogen oxides concentration decreases on ozone trends in the USA. Air Qual. Atmos. Health 2015, 8, 283–293. [Google Scholar] [CrossRef] [PubMed] [Green Version]
  25. Le, T.; Wang, Y.; Liu, L.; Yang, J.; Yung, Y.L.; Li, G.; Seinfeld, J.H. Unexpected air pollution with marked emission reductions during the COVID-19 outbreak in China. Science 2020, 369, 702–706. [Google Scholar] [CrossRef] [PubMed]
  26. Booker, F.; Muntifering, R.; McGrath, M.; Burkey, K.; Decoteau, D.; Fiscus, E.; Manning, W.; Krupa, S.; Chappelka, A.; Grantz, D. The ozone component of global change: Potential effects on agricultural and horticultural plant yield, product quality and interactions with invasive species. J. Integr. Plant Biol. 2009, 51, 337–351. [Google Scholar] [CrossRef] [PubMed]
  27. Fann, N.; Lamson, A.D.; Anenberg, S.C.; Wesson, K.; Risley, D.; Hubbell, B.J. Estimating the national public health burden associated with exposure to ambient PM2.5 and ozone. Risk Anal. 2012, 32, 81–95. [Google Scholar] [CrossRef]
  28. Lu, C.; Tian, H. Spatial and temporal patterns of nitrogen deposition in China: Synthesis of observational data. J. Geophys. Res. Atmos. 2007, 112, D22S05. [Google Scholar] [CrossRef]
  29. Qi, Y. Spatio-temporal distributions of tropospheric NO2 over oases in Taklimakan Desert, China. Chin. Geogr. Sci. 2015, 25, 561–568. [Google Scholar] [CrossRef] [Green Version]
  30. Bao, J.; Yang, X.; Zhao, Z.; Wang, Z.; Yu, C.; Li, X. The spatial-temporal characteristics of air pollution in China from 2001–2014. Int. J. Environ. Res. Public Health 2015, 12, 15875–15887. [Google Scholar] [CrossRef] [PubMed] [Green Version]
  31. Zhang, L.; Lee, C.S.; Zhang, R.; Chen, L. Spatial and temporal evaluation of long-term trend (2005–2014) of OMI retrieved NO2 and SO2 concentrations in Henan Province, China. Atmos. Environ. 2017, 154, 151–166. [Google Scholar] [CrossRef]
  32. Xu, W.; Wu, Q.; Liu, X.; Tang, A.; Dore, A.J.; Heal, M.R. Characteristics of ammonia, acid gases, and PM2.5 for three typical land-use types in the NCP. Environ. Sci. Pollut. R. 2016, 23, 1158–1172. [Google Scholar] [CrossRef] [Green Version]
  33. Cui, Y.; Lin, J.; Song, C.; Liu, M.; Yan, Y.; Xu, Y.; Huang, B. Rapid growth in nitrogen dioxide pollution over Western China, 2005–2013. Atmos. Chem. Phys. 2016, 16, 6207. [Google Scholar] [CrossRef] [Green Version]
  34. Song, C.; Wu, L.; Xie, Y.; He, J.; Chen, X.; Wang, T.; Lin, Y.; Jin, T.; Wang, A.; Liu, Y.; et al. Air pollution in China: Status and spatiotemporal variations. Environ. Pollut. 2017, 227, 334–347. [Google Scholar] [CrossRef]
  35. Li, R.; Cui, L.; Li, J.; Zhao, A.; Fu, H.; Wu, Y.; Zhang, L.; Kong, L.; Chen, J. Spatial and temporal variation of particulate matter and gaseous pollutants in China during 2014–2016. Atmos. Environ. 2017, 161, 235–246. [Google Scholar] [CrossRef]
  36. Chen, G.; Wang, Y.; Li, S.; Cao, W.; Ren, H.; Knibbs, L.D.; Abramson, M.J.; Guo, Y. Spatiotemporal patterns of PM10 concentrations over China during 2005–2016: A satellite-based estimation using the random forests approach. Environ. Pollut. 2018, 242, 605–613. [Google Scholar] [CrossRef]
  37. Cai, K.; Li, S.; Zheng, F.; Yu, C.; Zhang, X.; Liu, Y.; Li, Y. Spatio-temporal variations in NO2 and PM2.5 over the central plains economic region of China during 2005-2015 based on satellite observations. Aerosol Air Qual. Res. 2018, 18, 1221–1235. [Google Scholar] [CrossRef]
  38. Fan, H.; Zhao, C.; Yang, Y. A comprehensive analysis of the spatio-temporal variation of urban air pollution in China during 2014–2018. Atmos. Environ. 2020, 220, 117066. [Google Scholar] [CrossRef]
  39. Xu, W.; Sun, J.; Liu, Y.; Xiao, Y.; Tian, Y.; Zhao, B.; Zhang, X. Spatiotemporal variation and socioeconomic drivers of air pollution in China during 2005–2016. J. Environ. Manag. 2019, 245, 66–75. [Google Scholar] [CrossRef] [PubMed]
  40. Guo, H.; Gu, X.; Ma, G.; Shi, S.; Wang, W.; Zuo, X.; Zhang, X. Spatial and temporal variations of air quality and six air pollutants in China during 2015–2017. Sci. Rep. 2019, 9, 15201. [Google Scholar] [CrossRef] [PubMed] [Green Version]
  41. Wang, W.; Samat, A.; Abuduwaili, J.; Ge, Y. Spatio-Temporal Variations of Satellite-Based PM2.5 Concentrations and Its Determinants in Xinjiang, Northwest of China. Int. J. Environ. Res. Pub. Health 2020, 17, 2157. [Google Scholar] [CrossRef] [Green Version]
  42. Li, R.; Mei, X.; Chen, L.; Wang, L.; Wang, Z.; Jing, Y. Long-Term (2005–2017) View of Atmospheric Pollutants in Central China Using Multiple Satellite Observations. Remote Sens. 2020, 12, 1041. [Google Scholar] [CrossRef] [Green Version]
  43. Rohde, R.A.; Muller, R.A. Air pollution in China: Mapping of concentrations and sources. PLoS ONE 2015, 10, e0135749. [Google Scholar] [CrossRef] [PubMed]
  44. Karagulian, F.; Belis, C.A.; Dora, C.F.C.; Prüss-Ustün, A.M.; Bonjour, S.; Adair-Rohani, H.; Amann, M. Contributions to cities’ ambient particulate matter (PM): A systematic review of local source contributions at global level. Atmos. Environ. 2015, 120, 475–483. [Google Scholar] [CrossRef]
  45. Lyu, W.; Li, Y.; Guan, D.; Zhao, H.; Zhang, Q.; Liu, Z. Driving forces of Chinese primary air pollution emissions: An index decomposition analysis. J. Clean. Prod. 2016, 133, 136–144. [Google Scholar] [CrossRef] [Green Version]
  46. Xu, S.; Miao, Y.; Li, Y.; Zhou, Y.; Ma, X.; He, Z.; Zhao, B.; Wang, S. What Factors Drive Air Pollutants in China? An Analysis from the Perspective of Regional Difference Using a Combined Method of Production Decomposition Analysis and Logarithmic Mean Divisia Index. Sustainability 2019, 11, 4650. [Google Scholar] [CrossRef] [Green Version]
  47. Peng, J.; Chen, S.; Lü, H.; Liu, Y.; Wu, J. Spatiotemporal patterns of remotely sensed PM2.5 concentration in China from 1999 to 2011. Remote Sens. Environ. 2016, 174, 109–121. [Google Scholar] [CrossRef]
  48. Lin, H.; Wang, X.; Liu, T.; Li, X.; Xiao, J.; Zeng, W.; Ma, W. Air pollution and mortality in China. In Ambient Air Pollution and Health Impact in China; Dong, G.H., Ed.; Springer: Singapore, 2017; pp. 103–121. [Google Scholar]
  49. Mokoena, K.K.; Ethan, C.J.; Yu, Y.; Shale, K.; Liu, F. Ambient air pollution and respiratory mortality in Xi’an, China: A time-series analysis. Respir. Res. 2019, 20, 139. [Google Scholar] [CrossRef] [PubMed]
  50. Tang, M.; Li, D.; Liew, Z.; Wei, F.; Wang, J.; Jin, M.; Chen, K.; Ritz, B. The association of short-term effects of air pollution and sleep disorders among elderly residents in China. Sci. Total Environ. 2020, 708, 134846. [Google Scholar] [CrossRef] [PubMed]
  51. Deschenes, O.; Wang, H.; Wang, S.; Zhang, P. The effect of air pollution on body weight and obesity: Evidence from China. J. Dev. Econ. 2020, 145, 102461. [Google Scholar] [CrossRef] [Green Version]
  52. Siddiqi, T.A.; Chong-Xian, Z. Ambient air quality standards in China. Environ. Manag. 1984, 8, 473–479. [Google Scholar] [CrossRef]
  53. Wang, S.; Hao, J. Air quality management in China: Issues, challenges, and options. J. Environ. Sci. 2012, 24, 2–13. [Google Scholar] [CrossRef]
  54. Jin, Y.; Andersson, H.; Zhang, S. Air pollution control policies in China: A retrospective and prospects. Int. J. Environ. Res. Public Health 2016, 13, 1219. [Google Scholar] [CrossRef] [Green Version]
  55. Feng, L.; Liao, W. Legislation, plans, and policies for prevention and control of air pollution in China: Achievements, challenges, and improvements. J. Clean. Prod. 2016, 112, 1549–1558. [Google Scholar] [CrossRef]
  56. Huang, C.; Wang, Q.; Wang, S.; Ren, M.; Ma, R.; He, Y. Air Pollution Prevention and Control Policy in China. In Ambient Air Pollution and Health Impact in China; Dong, G.H., Ed.; Springer: Singapore, 2017; pp. 243–261. [Google Scholar]
  57. Zhang, J.; Jiang, H.; Zhang, W.; Ma, G.; Wang, Y.; Lu, Y.; Hu, X.; Zhou, J.; Peng, F.; Bi, J.; et al. Cost-benefit analysis of China’s Action Plan for Air Pollution Prevention and Control. Front. Eng. Manag. 2019, 6, 524–537. [Google Scholar] [CrossRef]
  58. NASA Earth Observatory. Airborne Nitrogen Dioxide Plummets over China. 2020. Available online: https://earthobservatory.nasa.gov/images/146362/airborne-nitrogen-dioxide-plummets-overchina (accessed on 17 April 2020).
  59. Lin, C.; Huang, R.; Xu, W.; Duan, J.; Zheng, Y.; Chen, Q.; Hu, W.; Li, Y.; Ni, H.; Wu, Y.; et al. Comprehensive Source Apportionment of Submicron Aerosol in Shijiazhuang, China: Secondary Aerosol Formation and Holiday Effects. ACS Earth Space Chem. 2020, 4, 947–957. [Google Scholar] [CrossRef]
  60. Tan, P.H.; Chou, C.; Liang, J.Y.; Chou, C.C.K.; Shiu, C.J. Air pollution “holiday effect” resulting from the Chinese New Year. Atmos. Environ. 2009, 43, 2114–2124. [Google Scholar] [CrossRef]
  61. Yang, Y.; Wang, Y.; Yao, D.; Zhao, S.; Yang, S.; Ji, D.; Sun, J.; Wang, Y.; Liu, Z.; Hu, B.; et al. Significant decreases in the volatile organic compound concentration, atmospheric oxidation capacity and photochemical reactivity during the National Day holiday over a suburban site in the North China Plain. Environ. Pollut. 2020, 263, 114657. [Google Scholar] [CrossRef]
  62. Zhao, X.; Zhou, W.; Han, L. Human activities and urban air pollution in Chinese mega city: An insight of ozone weekend effect in Beijing. Phys. Chem. Earth 2019, 110, 109–116. [Google Scholar] [CrossRef]
  63. Weblink 1.a. Available online: https://giovanni.gsfc.nasa.gov/giovanni/#service=TmAvMp&starttime=2019-11-24T00:00:00Z&endtime=2020-0122T23:59:59Z&shape=state_dept_countries/shp_43&&data=OMNO2d_003_ColumnAmoutNO2TropCloudScreened&variableFacets=dataFieldMeasurement%3ANO2%3B (accessed on 25 March 2020).
  64. Weblink 1.b. Available online: https://giovanni.gsfc.nasa.gov/giovanni/#service=TmAvMp&starttime=2020-01-23T00:00:00Z&endtime=2020-03-22T23:59:59Z&shape=state_dept_countries/shp_43&&data=OMNO2d_003_ColumnAmountNO2TropCloudScreened (accessed on 25 March 2020).
  65. Weblink 2. Available online: https://giovanni.gsfc.nasa.gov/giovanni/#service=ArAvTs&starttime=2019-11-24T00:00:00Z&endtime=2020-03-22T23:59:59Z&shape=state_dept_countries/shp_43&&data=OMNO2d_003_ColumnAmountNO2TropCloudScreened (accessed on 25 March 2020).
  66. Duncan, B.N.; Prados, A.I.; Lamsal, L.N.; Liu, Y.; Streets, D.G.; Gupta, P.; Hilsenrath, E.; Kahn, R.A.; Nielsen, J.E.; Beyersdorf, A.J.; et al. Satellite data of atmospheric pollution for US air quality applications: Examples of applications, summary of data end-user resources, answers to FAQs, and common mistakes to avoid. Atmos. Environ. 2014, 94, 647–662. [Google Scholar] [CrossRef] [Green Version]
  67. Lin, J.; Nielsen, C.P.; Zhao, Y.; Lei, Y.; Mcelroy, M.B. Recent changes in particulate air pollution over China observed from space and the ground: Effectiveness of emission control. Environ. Sci. Technol. 2010, 44, 7771–7776. [Google Scholar] [CrossRef] [PubMed]
  68. Streets, D.G.; Canty, T.; Carmichael, G.R.; de Foy, B.; Dickerson, R.R.; Duncan, B.N.; Edwards, D.P.; Haynes, J.A.; Henze, D.K.; Houyoux, M.R.; et al. Emissions estimation from satellite retrievals: A review of current capability. Atmos. Environ. 2013, 77, 1011–1042. [Google Scholar] [CrossRef] [Green Version]
  69. Yan, H.H.; Li, X.J.; Zhang, X.Y.; Wang, W.H.; Cheng, L.F.; Zhang, M.G.; Xv, J. Comparison and validation of band residual difference algorithm and principal component analysis algorithm for retrievals of atmospheric SO2 columns from satellite observations. Acta Phys. Sin. 2016, 65, 084204. [Google Scholar] [CrossRef]
  70. Krotkov, N.A.; McLinden, C.A.; Li, C.; Lamsal, L.N.; Celarier, E.A.; Marchenko, S.V.; Swartz, W.H.; Bucsela, E.J.; Joiner, J.; Duncan, B.N.; et al. Aura OMI observations of regional SO2 and NO2 pollution changes from 2005 to 2015. Atmos. Chem. Phys. 2016, 16, 4605–4629. [Google Scholar] [CrossRef] [Green Version]
  71. Mallik, C.; Lal, S. Seasonal characteristics of SO2, NO2, and CO emissions in and around the Indo-Gangetic Plain. Environ. Monit. Assess. 2014, 186, 1295–1310. [Google Scholar] [CrossRef] [PubMed]
  72. Duncan, B.N.; Yoshida, Y.; de Foy, B.; Lamsal, L.N.; Streets, D.; Lu, Z.; Pickering, K.E.; Krotkov, N.A. The observed response of the Ozone Monitoring Instrument (OMI) NO2 column to NOx emission controls on power plants in the United States: 2005-2011. Atmos. Environ. 2013, 81, 102–111. [Google Scholar] [CrossRef] [Green Version]
  73. Rahaman, S.; Jahangir, S.; Chen, R.; Kumar, P.; Thakur, S. COVID-19’s lockdown effect on air quality in Indian cities using air quality zonal modeling. Urban Clim. 2021, 36, 100802. [Google Scholar] [CrossRef]
  74. Alvo, M.; Philip, L.H. Statistical Methods for Ranking Data; Springer: New York, NY, USA, 2014; ISBN 978-1-4939-1471-5. [Google Scholar] [CrossRef]
  75. Nardo, M.; Saisana, M.; Saltelli, A.; Tarantola, S. Tools for composite indicators building. Eur. Com. Ispra 2005, 15, 19–20. [Google Scholar]
  76. Lai, Y.; Brimblecombe, P. Regulatory effects on particulate pollution in the early hours of Chinese New Year, 2015. Environ. Monit. Assess. 2017, 189, 467. [Google Scholar] [CrossRef] [Green Version]
  77. Mao, X.; Zhou, J.; Corsetti, G. How well have China’s recent Five-Year Plans been implemented for energy conservation and air pollution control? Environ. Sci. Technol. 2014, 48, 10036–10044. [Google Scholar] [CrossRef] [PubMed]
  78. Cao, J.; Garbaccio, R.; Ho, M.S. China’s 11th Five-Year Plan and the environment: Reducing SO2 emissions. Rev. Environ. Econ. Policy 2009, 3, 231–250. [Google Scholar] [CrossRef] [Green Version]
  79. Zhang, S.Q.; Huang, D. Controlling fine particulate pollution and mitigating environmental health damage. Environ. Prot. 2011, 16, 25–26. [Google Scholar]
  80. Seinfeld, J.H.; Pandis, S.N. Atmospheric Chemistry and Physics: From Air Pollution to Climate Change; Wiley: New York, NY, USA, 1998. [Google Scholar]
  81. Morawska, L.; Jayaratne, E.R.; Mengersen, K.; Jamriska, M.; Thomas, S. Difference in airborne particle and gaseous concentrations in urban air between weekdays and weekends. Atmos. Environ. 2002, 36, 4375–4383. [Google Scholar] [CrossRef] [Green Version]
  82. Streets, D.G.; Bond, T.C.; Carmichael, G.R.; Fernandes, S.D.; Fu, Q.; He, D.; Klimont, Z.; Nelson, S.M.; Tsai, N.Y.; Wang, M.Q.; et al. An inventory of gaseous and primary aerosol emissions in Asia in the year 2000. J. Geophys. Res. 2003, 108, 8809. [Google Scholar] [CrossRef]
  83. Yang, K.L.; Ting, C.C.; Wang, K.L.; Wingenter, O.W.; Chan, C.C. Diurnal and seasonal cycles of ozone precursors observed from continuous measurement at an urban site in Taiwan. Atmos. Environ. 2005, 39, 3221–3230. [Google Scholar] [CrossRef]
  84. Kato, N.; Akimoto, H. Anthropogenic emissions of SO2, and NOx in Asia: Emission inventories. Atmos. Environ. 2007, 41, 171–191. [Google Scholar] [CrossRef]
  85. Kato, S.; Kajii, Y.; Itokazu, R.; Hirokawa, J.; Koda, S.; Kinjo, Y. Transport of atmospheric carbon monoxide, ozone, and hydrocarbons from Chinese coast to Okinawa island in the Western Pacific during winter. Atmos. Environ. 2004, 38, 2975–2981. [Google Scholar] [CrossRef]
  86. Lin, C.Y.; Liu, S.C.; Chou, C.C.K.; Huang, S.J.; Liu, C.M.; Kuo, C.H.; Young, C.Y. Long-range transport of aerosols and the impact on the air quality of Taiwan. Atmos. Environ. 2005, 39, 6066–6067. [Google Scholar] [CrossRef]
  87. Latha, K.M.; Highwood, E.J. Studies on particulate matter (PM10) and its precursors over urban environment of Reading, UK. J. Quant. Spectrosc. Radiat. Transfer. 2006, 101, 367–379. [Google Scholar] [CrossRef]
  88. Moreno, T.; Querol, X.; Alastuey, A.; Santos, S.G.; Gibbons, W. Controlling of influences on daily fluctuations of inhalable particles and gas concentrations: Local versus regional and exotic atmospheric pollutants at Puertollano, Spain. Atmos. Environ. 2006, 40, 3207–3218. [Google Scholar] [CrossRef]
  89. Wang, Y.; Zhuang, G.; Xu, C.; An, Z. The air pollution caused by the burning of fireworks during the lantern festival in Beijing. Atmos. Environ. 2007, 41, 417–431. [Google Scholar] [CrossRef]
  90. Yang, L.; Gao, X.; Wang, X.; Nie, W.; Wang, J.; Gao, R.; Xu, P.; Shou, Y.; Zhang, Q.; Wang, W. Impacts of firecracker burning on aerosol chemical characteristics and human health risk levels during the Chinese New Year celebration in Jinan, China. Sci. Total Environ. 2014, 476, 57–64. [Google Scholar] [CrossRef]
  91. Zhao, S.; Yu, Y.; Yin, D.; Liu, N.; He, J. Ambient particulate pollution during Chinese Spring Festival in urban Lanzhou, Northwestern China. Atmos. Pollut. Res. 2014, 5, 335–343. [Google Scholar] [CrossRef] [Green Version]
  92. Zheng, C.-X.; Liu, B. Speciation analysis of Cd in PM10 and PM2.5 during heating period in Urumqi. Spectrosc. Spect. Anal. 2012, 32, 235–238. [Google Scholar]
  93. Wang, K.; Tian, H.Z.; Hua, S.B.; Zhu, C.Y.; Gao, J.J.; Xue, Y.F.; Hao, J.M. A comprehensive emission inventory of multiple air pollutants from iron and steel industry in China: Temporal trends and spatial variation characteristics. Sci. Total Environ. 2016, 559, 7–14. [Google Scholar] [CrossRef]
  94. Wang, Q.; Zhuang, G.; Huang, K.; Liu, T.; Lin, Y.; Deng, C.; Fu, Q.; Fu, J.S.; Chen, J.; Zhang, W. Evolution of particulate sulfate and nitrate along the Asian dust pathway: Secondary transformation and primary pollutants via long-range transport. Atmos. Res. 2016, 169, 86–95. [Google Scholar] [CrossRef]
  95. Hua, S.B.; Tian, H.Z.; Wang, K.; Zhu, C.Y.; Gao, J.J.; Ma, Y.L.; Xue, Y.F.; Wang, Y.; Duan, S.H.; Zhou, J.R. Atmospheric emission inventory of hazardous air pollutants from China’s cement plants: Temporal trends, spatial variation characteristics and scenario projections. Atmos. Environ. 2016, 128, 1–9. [Google Scholar] [CrossRef]
  96. Chai, F.; Gao, J.; Chen, Z.; Wang, S.; Zhang, Y.; Zhang, J.; Zhang, H.; Yun, Y.; Ren, C. Spatial and temporal variation of particulate matter and gaseous pollutants in 26 cities in China. J. Environ. Sci. 2014, 26, 75–82. [Google Scholar] [CrossRef]
  97. Lu, Z.; Streets, D.G.; Zhang, Q.; Wang, S.; Carmichael, G.R.; Cheng, Y.F.; Wei, C.; Chin, M.; Diehl, T.; Tan, Q. Sulfur dioxide emissions in China and sulphur trends in East Asia since 2000. Atmos. Chem. Phys. 2010, 10, 6311–6331. [Google Scholar] [CrossRef] [Green Version]
  98. Pui, D.Y.; Chen, S.C.; Zuo, Z. PM2.5 in China: Measurements, sources, visibility and health effects, and mitigation. Particuology 2014, 13, 1–26. [Google Scholar] [CrossRef]
  99. Liu, L.; Yang, X.; Liu, H.; Wang, M.; Welles, S.; Marquez, S.; Frank, A.; Haas, C.N. Spatial-Temporal analysis of air Pollution, climate change, and Total Mortality in 120 cities of China. Front. Public Health 2016, 4, 2012–2013. [Google Scholar] [CrossRef] [Green Version]
  100. Liu, P.F.; Zhang, C.L.; Mu, Y.J.; Liu, C.T.; Xue, C.Y.; Ye, C. The possible contribution of the periodic emissions from farmers’ activities in the NCP to atmospheric water-soluble ions in Beijing. Atmos. Chem. Phys. 2016, 16, 10097–10109. [Google Scholar] [CrossRef] [Green Version]
  101. Liu, T.; Wang, X.; Hu, Q.; Deng, W.; Zhang, Y.; Ding, X. Formation of secondary aerosols from gasoline vehicle exhaust when mixing with SO2. Atmos. Chem. Phys. 2016, 16, 675–689. [Google Scholar] [CrossRef] [Green Version]
  102. Zhao, Y.; Wang, S.; Duan, L.; Lei, Y.; Cao, P.; Hao, J. Primary air pollutant emissions of coal-fired power plants in China: Current status and future prediction. Atmos. Environ. 2008, 42, 8442–8452. [Google Scholar] [CrossRef]
  103. Rahman, A.; Luo, C.; Khan, M.H.R.; Ke, J.; Thilakanayaka, V.; Kumar, S. Influence of atmospheric PM2.5, PM10, O3, CO, NO2, SO2, and meteorological factors on the concentration of airborne pollen in Guangzhou, China. Atmos. Environ. 2019, 212, 290–304. [Google Scholar] [CrossRef]
  104. Tian, D.; Fan, J.; Jin, H.; Mao, H.; Geng, D.; Hou, S.; Zhang, P.; Zhang, Y. Characteristic and spatiotemporal variation of air pollution in Northern China based on correlation analysis and clustering analysis of five air pollutants. J. Geophys. Res. Atmos. 2020, 125, e2019JD031931. [Google Scholar] [CrossRef]
  105. Xiao, K.; Wang, Y.; Wu, G.; Fu, B.; Zhu, Y. Spatiotemporal characteristics of air pollutants (PM10, PM2.5, SO2, NO2, O3, and CO) in the inland basin city of Chengdu, southwest China. Atmosphere 2018, 9, 74. [Google Scholar] [CrossRef] [Green Version]
  106. Ma, J.Z.; Xu, X.B.; Zhao, C.; Yan, P.A. Review of Atmospheric Chemistry Research in China: Photochemical Smog, Haze Pollution, and Gas-Aerosol Interactions. Adv. Atmos. Sci. 2012, 29, 1006–1026. [Google Scholar] [CrossRef]
  107. Meng, Z.; Dabdub, D.; Seinfeld, J.H. Chemical coupling between atmospheric ozone and particulate matter. Science 1997, 277, 116–119. [Google Scholar] [CrossRef] [Green Version]
  108. Murphy, J.G.; Day, D.A.; Cleary, P.A.; Wooldridge, P.J.; Millet, D.B.; Goldstein, A.H.; Cohen, R.C. The weekend effect within and downwind of Sacramento—Part 1: Observations of ozone, nitrogen oxides, and VOC reactivity. Atmos. Chem. Phys. 2007, 7, 5327–5339. [Google Scholar] [CrossRef] [Green Version]
  109. Qin, Y.; Tonnesen, G.S.; Wang, Z. Weekend/weekday differences of ozone, NOx, CO, VOCs, PM10 and the light scatter during ozone season in southern California. Atmos. Environ. 2004, 38, 3069–3087. [Google Scholar] [CrossRef]
  110. Chou, C.C.K.; Liu, S.C.; Lin, C.Y.; Shiu, C.J.; Chang, K.H. The trend of surface ozone in Taipei, Taiwan, and its causes: Implications for ozone control strategies. Atmos. Environ. 2006, 40, 3898–3908. [Google Scholar] [CrossRef]
  111. California Air Resources Board. The Ozone Weekend Effect in California; CARB Planning and Technical Support Division: Sacramento, CA, USA, 2003.
  112. Beaney, G.; Gough, W.A. The influence of tropospheric ozone on the air temperature of the city of Toronto, Ontario, Canada. Atmos. Environ. 2002, 36, 2319–2325. [Google Scholar] [CrossRef]
  113. Beirle, S.; Platt, U.; Wenig, M.; Wagner, T. Weekly cycle of NO2 by GOME measurements: A signature of anthropogenic sources. Atmos. Chem. Phys. 2003, 3, 2225–2232. [Google Scholar] [CrossRef] [Green Version]
  114. Riga-Karandinos, A.-N.; Saitanis, C. Comparative assessment of ambient air quality in two typical Mediterranean coastal cities in Greece. Chemosphere 2005, 59, 1125–1136. [Google Scholar] [CrossRef]
  115. Geddes, J.A.; Murphy, J.G.; Wang, D.K. Long term changes in nitrogen oxides and volatile organic compounds in Toronto and the challenges facing local ozone control. Atmos. Environ. 2009, 43, 3407–3415. [Google Scholar] [CrossRef]
  116. Fu, X.; Wang, X.; Guo, H.; Cheung, K.; Ding, X.; Zhao, X.; He, Q.; Gao, B.; Zhang, Z.; Liu, T. Trends of ambient fine particles and major chemical components in the Pearl River Delta region: Observation at a regional background site in fall and winter. Sci. Total Environ. 2014, 497, 274–281. [Google Scholar] [CrossRef] [PubMed]
  117. Liang, X.; Zou, T.; Guo, B.; Li, S.; Zhang, H.; Zhang, S.; Huang, H.; Chen, S.X. Assessing Beijing’s PM2.5 pollution: Severity, weather impact, APEC and winter heating. Proc. R. Soc. A 2015, 471, 20150257. [Google Scholar] [CrossRef] [Green Version]
  118. Lyu, X.; Chen, N.; Guo, H.; Zeng, L.; Zhang, W.; Shen, F.; Quan, J.; Wang, N. Chemical characteristics and causes of airborne particulate pollution in warm seasons in Wuhan, central China. Atmos. Chem. Phys. 2016, 16, 10671–10687. [Google Scholar] [CrossRef] [Green Version]
Figure 1. Spatial distribution of 10-day time-average map of NO2 tropospheric column of China before (24 November 2019 to 22 January 2020) and after the pandemic (23 January to 22 March 2020). Source: OMI, Global Modeling and Assimilation Office, NASA, 2020.
Atmosphere 13 00961 g001
Figure 2. Temporal variation (10 days average) in NO2 tropospheric column of 15 major cities of China before and after the pandemic. Sources: Calculated by author, 2020.
Atmosphere 13 00961 g002
Figure 3. Time-average map of NO2 tropospheric column (molecules/cm2) of 15 major cities of China before and after the pandemic. Source: OMI, Global Modeling and Assimilation Office, NASA, 2020.
Atmosphere 13 00961 g003
Figure 4. NO2 tropospheric column of 15 major cities of China before and after the pandemic. (a) Absolute concentration and (b) decline in percentage. Source: Calculated by author, 2020.
Atmosphere 13 00961 g004
Figure 5. Time series, area-average of NO2 tropospheric column (30% cloud screened) daily 0.25 deg. [OMI OMNO2d v003] 1/cm2 over 24 November 2019–22 March 2020, shape China. Source: OMI, Global Modeling and Assimilation Office, NASA, 2020.
Atmosphere 13 00961 g005
Figure 6. (a) Time average map and zonal distribution of the NO2 tropospheric column, (b) declining rate (in total and percentage) of NO2, (c) trend analysis of the total NO2 tropospheric column of 145 random sites of China’s mainland before and after pandemic. Source: OMI, Global Modeling and Assimilation Office, NASA.
Atmosphere 13 00961 g006
Figure 7. Absolute trend line indicates 60-day average of NO2 tropospheric column (molecules/cm2), whereas the bar graph represents 10-day average concentration (X-axis) of NO2 in 15 major cities of China before (yellow) and after (purple) the COVID-19 lockdown period. Source: OMI, Global Modeling and Assimilation Office, NASA, 2020.
Atmosphere 13 00961 g007
Figure 8. Temporal change in air quality of China before and after lockdown. Total 100-day daily average data, 4 December 2019 to 22 January 2020 (before lockdown) and 23 January to 12 March 2020 (after lockdown). (a) Air Quality Index; (b) CO; (c) NO2; (d) O3; (e) PM10; (f) PM2.5; (g) SO2. Source: Ministry of Environmental Protection of China (MEPC), China Ministry of Ecology and Environment, 2020 and OMI, Global Modeling and Assimilation Office, NASA.
Atmosphere 13 00961 g008
Figure 9. The daily average concentration of air pollutants in 14 cities of China. The 100 days (50 days before lockdown and 50 days after lockdown. NO2, O3, PM10, PM2.5, SO2 (µg/m3), and CO (mg/m3): primary vertical (left) and AQI shown in secondary vertical (right). Source: Ministry of Environmental Protection of China (MEPC), China Ministry of Ecology and Environment, 2020.
Atmosphere 13 00961 g009aAtmosphere 13 00961 g009b
Table 1. Temporal change in air pollutants of 14 cities of China before (4 December 2019 to 22 January 2020) lockdown and after lockdown (23 January to 12 March 2020). The 100-day daily average concentration in total and change in percentage. Total 6 pollutants NO2, O3, PM10, PM2.5, SO2 (µg/m3), CO (mg/m3) including AQI (change in percentage).
CityJinanGuangzhouShanghaiNanjingXiamenBeijingZhengzhouWuhanHarbinChongqingChengduXianLanzhouAnshan
COBefore1.460.980.830.970.610.861.281.091.221.020.981.331.871.60
After0.920.730.650.690.440.860.890.910.850.790.670.951.121.37
Change−37−25−21−29−270−31−17−30−22−31−28−40−14
NO2Before56.5760.8657.6053.7325.7545.1754.8352.7356.7346.0548.7061.4865.8043.11
After27.0227.6827.6825.9113.0126.3125.8319.5428.8924.5121.9432.2940.4030.42
Change−52−55−52−52−49−42−53−63−49−47−55−47−39−29
O3Before25.7443.0139.7330.6264.3525.4425.9523.6932.3714.4523.8517.0834.7433.95
After64.1848.6971.7768.0775.4049.5966.2458.4770.4835.3652.3551.2062.7453.45
Change149138112217951551471181451202008157
PM10Before141.3174.4849.4080.8643.0757.45121.4386.54141.9883.93102.22148.41107.27100.39
After89.0133.0334.8450.7530.6659.6089.6747.6177.5558.1165.05107.0188.1194.80
Change−37−56−29−37−294−26−45−45−31−36−28−18−6
PM2.5Before98.6638.1853.1556.1730.9544.69106.4863.58129.7459.8675.56116.6061.2769.40
After62.3921.9235.1336.1821.2263.8972.2139.0868.5144.4447.2781.1040.5868.14
Change−37−43−34−36−3143−32−39−47−26−37−30−34−2
SO2Before21.528.647.807.805.314.8710.249.4636.408.968.2214.1629.7721.01
After13.275.495.665.384.404.538.377.5027.256.706.9210.5118.2318.89
Change−38−36−27−31−17−7−18−21−25−25−16−26−39−10
AQIBefore131.38164.2273.8079.1648.0065.71141.3788.1761.7082.16102.16153.6688.4296.03
After88.4492.9851.5954.4236.9588.12101.0656.5835.9163.3768.98114.8273.7992.22
Change−33−43−30−31−2334−29−36−42−23−32−25−17−4
Source: Arranged by author, Ministry of Environmental Protection of China (MEPC), China Ministry of Ecology and Environment, 2020.
Publisher’s Note: MDPI stays neutral with regard to jurisdictional claims in published maps and institutional affiliations.

