Article

Air Quality outside Schools in Newcastle upon Tyne, UK: An Investigation into NO2 and PM Concentrations and PM Respiratory Deposition

1
Medical Sciences Graduate School, Faculty of Medical Sciences, Newcastle University, Newcastle upon Tyne NE1 7RU, UK
2
Faculty of Medical Sciences, Medical Sciences Graduate School, Newcastle University, Newcastle upon Tyne NE1 7RU, UK
3
Department of Geography and Environmental Sciences, Northumbria University, Newcastle upon Tyne NE1 8ST, UK
*
Author to whom correspondence should be addressed.
Atmosphere 2022, 13(2), 172; https://doi.org/10.3390/atmos13020172
Submission received: 23 December 2021 / Revised: 16 January 2022 / Accepted: 18 January 2022 / Published: 21 January 2022
(This article belongs to the Special Issue Feature Papers in Atmosphere Science)

Abstract

:
Air pollution is the principal environmental threat to public health in the UK. Ever-increasing evidence links ambient air pollutants, preventable diseases, and health inequalities. Children are particularly vulnerable to harmful effects due to their short height, developing lungs, and higher rate of respiration. Using data from air quality monitors around schools, we investigated 2018–2019 ambient NO2, PM10, PM2.5, and PM1 concentrations at 12 schools in Newcastle upon Tyne, UK. We compared findings with EU/UK air quality regulations and guidelines, identified patterns, and calculated PM respiratory deposition doses (RDDs). The range of annual average (AA) concentrations across the schools for the two-year period was 23.7–39.2 µg/m3 for NO2, 7.4–22.2 µg/m3 for PM10, 3.5–11.6 µg/m3 for PM2.5, and 1.7–9.0 µg/m3 for PM1. The highest PM RDD children were exposed to at school was 30 µg/h. One school’s AA NO2, two schools’ hourly PM2.5 averages, and one school’s 24-h PM10 averages exceeded EU/UK regulations. All schools exceeded WHO2005 24-h PM10 and PM2.5 guidelines in 2018, less in 2019. All 12 schools would have exceeded WHO2021 NO2 AA guidelines (10 µg/m3), 2 the WHO2021 PM10 AA (15 µg/m3), and 10 the WHO2021 PM2.5 AA (5 µg/m3). Evidence-based policy is required to improve school ambient air quality and reduce children’s exposure.

1. Introduction

Ambient air pollution is a public health issue of global concern and the principal environmental threat to public health in the United Kingdom (UK) [1]. An ever-increasing body of evidence demonstrates both associative and causal relationships between ambient air pollutants, preventable diseases, and health inequalities [2,3]. Air quality is an area of rapidly evolving policy; however, effecting change presents a significant challenge as ambient air pollutants are by-products of processes that are fundamental to how we currently live our lives [1].
Ambient air pollutants adversely affect human health and children are among the most vulnerable to these harmful effects due to their short stature, developing lungs, and higher rate of respiration [1,4,5]. The effects of ambient air pollutants on children’s respiratory systems include suppression of lung growth, an increased risk of new-onset asthma and wheeze, an increased risk of bronchitis, and an increased risk of problematic respiratory symptoms [5,6,7]. Considering the impacts on children’s other systems, exposure to ambient air pollution is associated with decreased concentration and alertness in children and may be associated with insulin resistance, decreased brain development, and an increased risk of attention deficit hyperactivity disorder (ADHD) [5,8,9]. Lastly, ambient air pollution is classified as a group one carcinogen by the World Health Organization (WHO) International Agency for Research on Cancer (IARC), with particulate matter (PM) being a pollutant most strongly associated with increased cancer incidence [10]. The health effects of exposure to PM are dependent on the size of the particles and the duration of exposure [1]. PM10 can enter the body as far as the nose and throat, whereas ultrafine particles <0.1 µm in diameter may be able to enter the bloodstream [1]. The evidence suggests that there is no threshold below which particles <2.5 µm (PM2.5 and smaller) are not harmful to human health. There is consensus among experts that, rather than aiming for a given threshold value of PM2.5, concentrations of PM2.5 should be reduced as low as possible [11,12].
At a national level, European Union (EU) air quality policy is the key driver of UK policy [13]. The 2008 Directive on Ambient Air Quality and Cleaner Air for Europe is a legislative document setting legally binding limit values (regulations) for key pollutants that are transposed into UK law [13,14]. The directive acknowledges that advances in the understanding of the harmful effects of pollutants have increased the urgency and drive to improve air quality and protect health [15]. EU/UK legal limit values and WHO guideline values for ambient air quality can be found in the Supplementary Materials Table S1 [11,12,16].
Several school air quality studies have been conducted in the UK, mostly in London [17]. Concentrations of nitrogen dioxide (NO2), PM10, and PM2.5 have been measured and modelled at high resolution across the capital. The Greater London Authority (GLA) estimated that, in 2013, 24% of London primary schools were in locations with annual mean NO2 concentrations that exceeded 40 μg/m3 [18]. The GLA found that 82% of the schools in high NO2 concentration locations were also in areas of deprivation [18,19]. Updated reports from 2017 estimated that a similar proportion of London schools were in locations that breached the annual mean NO2 national air quality standard [20]. Additional information on UK-based school air quality studies can be found in the Supplementary Materials Table S2.
Lucialli et al. (2020) measured indoor and outdoor concentrations of the polyaromatic hydrocarbon pollutants benzene, toluene, ethylbenzene, and xylene (BTEX) at schools in Italy as these pollutants are associated with vehicle emissions and are harmful to children’s health [21]. They found that mean outdoor concentrations varied from 0.10 to 4.23 μg/m3 (benzene), 0.10 to 28.18 μg/m3 (toulene), 0.10 to 11.1 μg/m3 (ethylbenzene), and 0.10 to 14.45 μg/m3 (xylene) [21]. A similar study found high levels of aromatic pollutants at schools in Portugal and that subsequently, the total cancer risk of 8–10-year-old children exceeded the United States Environmental Protection Agency (USEPA) recommended guideline [22].
This study focuses on four key pollutants known to be harmful to human health: NO2 and inhalable particles sized <10 µm (PM10), <2.5 µm (PM2.5), and <1 µm (PM1) in diameter. The principal anthropogenic source of NO2 in the UK is small vehicle emissions, with non-road transport, domestic heating, power generation, and industry also contributing [1].
The present study took place in Newcastle Upon Tyne (widely known as Newcastle) [23,24,25]. Information on the urban design, meteorology, and wind direction and speed can be found in the Supplementary Materials, including Figures S1 and S2. The city’s council, Newcastle City Council (NCC), has declared two air quality management areas (AQMAs) [26]. AQMAs are locations where a local authority has identified that the UK national air quality objectives are either not likely to be achieved or are not achieved [27]. NCC declared one AQMA in the city centre in 2006 and one in an area of the city called Gosforth in 2008 [26]. Both AQMAs were declared due to annual mean NO2 exceedances [26]. Figure 1 shows the locations of the two AQMAs.
There are 92 government-funded schools and 9 independent schools in Newcastle [28]. In total, 22 schools in Newcastle have static air quality monitors (AQMs): 21 government-funded schools and 1 independent nursery. These AQMs have been provided to the schools through a partnership between NCC and the Newcastle Urban Observatory (UO) as part of a project called ‘The Healthy Schools Project’ [29]. The aim of the air quality work within this project is to raise awareness and engage schools, parents, and children in monitoring school ambient air quality [29].
This study aimed to investigate ambient air quality for 12 Newcastle schools. Specific objectives were to: (1) determine concentrations of NO2, PM10, PM2.5, and PM1 outside schools in Newcastle and investigate temporal, geographical, and meteorological patterns; (2) determine whether concentrations of these pollutants regularly exceed the WHO guideline values or EU/UK regulations; and (3) estimate students’ exposure to inhalable particles.

2. Methods

2.1. Data Collection

Our study used Newcastle UO data [29,30], which are publicly available on the UO website. The UO collects ambient air quality data for the city of Newcastle and surrounding areas [31,32]. These data had not yet been formally analysed at the inception of this study, presenting an invaluable opportunity to do so.
Eleven schools in Newcastle had AQMs installed in 2017 or early 2018 after being identified by NCC as being located in potential pollution hotspots, one school already had an AQM in place, and a further 10 schools applied for an AQM as part of NCC’s Healthy Pupil Capital fund and had AQMs installed in 2019. The UO’s Healthy Schools Project uses fixed-location AQMesh pod AQMs to collect ambient air quality data. AQMesh pods are low-cost indicative AQMs manufactured in the UK that provide real-time ambient air quality data [33]. Electrochemical sensors in the monitors measure NO2 and light-scattering optical particle counters measure PM [34]. AQMesh pods are continuous monitors and generate an average reading every 1–15 min [34]. Technical information on AQMesh pod Quality Assurance can be found in the Supplementary Materials. Placement of the monitors outside the schools in the Healthy Schools Project is carefully considered by experts at the UO to ensure optimum data quality and they are commonly attached to lampposts at school entrances (Supplementary Materials Figure S3).
This study used meteorological data collected at the Albemarle Airfield weather station, west of the city. This station collects hourly data on wind speed, wind direction, temperature, atmospheric pressure, and humidity.

2.2. Data Analysis

Due to the varying installation dates of AQMs and start dates of data collection, only schools with sufficient data to provide annual averages were included in each analysis. This study included 12 schools and further information on the schools can be found in the Supplementary Materials Table S3. Figure 1 shows the location of the 12 schools included in this study on a map. The schools are Atkinson Road Primary Academy (AR), Broadway East First School (BE), Chillingham Road Primary School (CR), Cragside Primary School (CP), Knop Law Primary School (KL), Sacred Heart Catholic High School (SH), St Alban’s R C Primary School (SA), St Gabriel’s Children’s Day Nursery (SG), St Mary’s Catholic School (SM), St Teresa’s Primary School (ST), Westerhope Primary School (WP), and West Jesmond Primary School (WJ).
Specialist air quality data analysis was performed using “openair”, an R package for air quality data analysis [35]. Data flagging was conducted to highlight outliers based on the Breathe London study [36]. Breathe London’s NO2 data flags use parts per billion (ppb), but the UO Healthy Schools project collects NO2 data in μg/m3; therefore, the NO2 conversion factor of 1 ppb = 1.1925 μg/m3 was used in this study [37]. Data flagging values can be found in Supplementary Materials Table S4. The EU Air Quality Directive 2008 outlines data quality objectives and states that the minimum data capture from AQMs should be 90% for NO 2, PM 2.5, and PM 10; therefore, this value was adopted as a data quality measure [11].
Fixed monitoring site air quality data at the urban background and roadside locations in Newcastle were obtained from the UK-AIR database to compare school air quality with the air quality of the wider city (Figure 1). At urban background sites, ambient pollutants are not influenced by a single source but instead represent city-wide background concentrations [38]. The Newcastle urban background air quality monitoring site collects NO2, PM10, and PM2.5 data. Roadside air quality monitors are located at sites where concentrations of ambient pollutants are determined by nearby traffic emissions [39]. The Newcastle roadside air quality monitoring site collects NO2 and PM10 data.

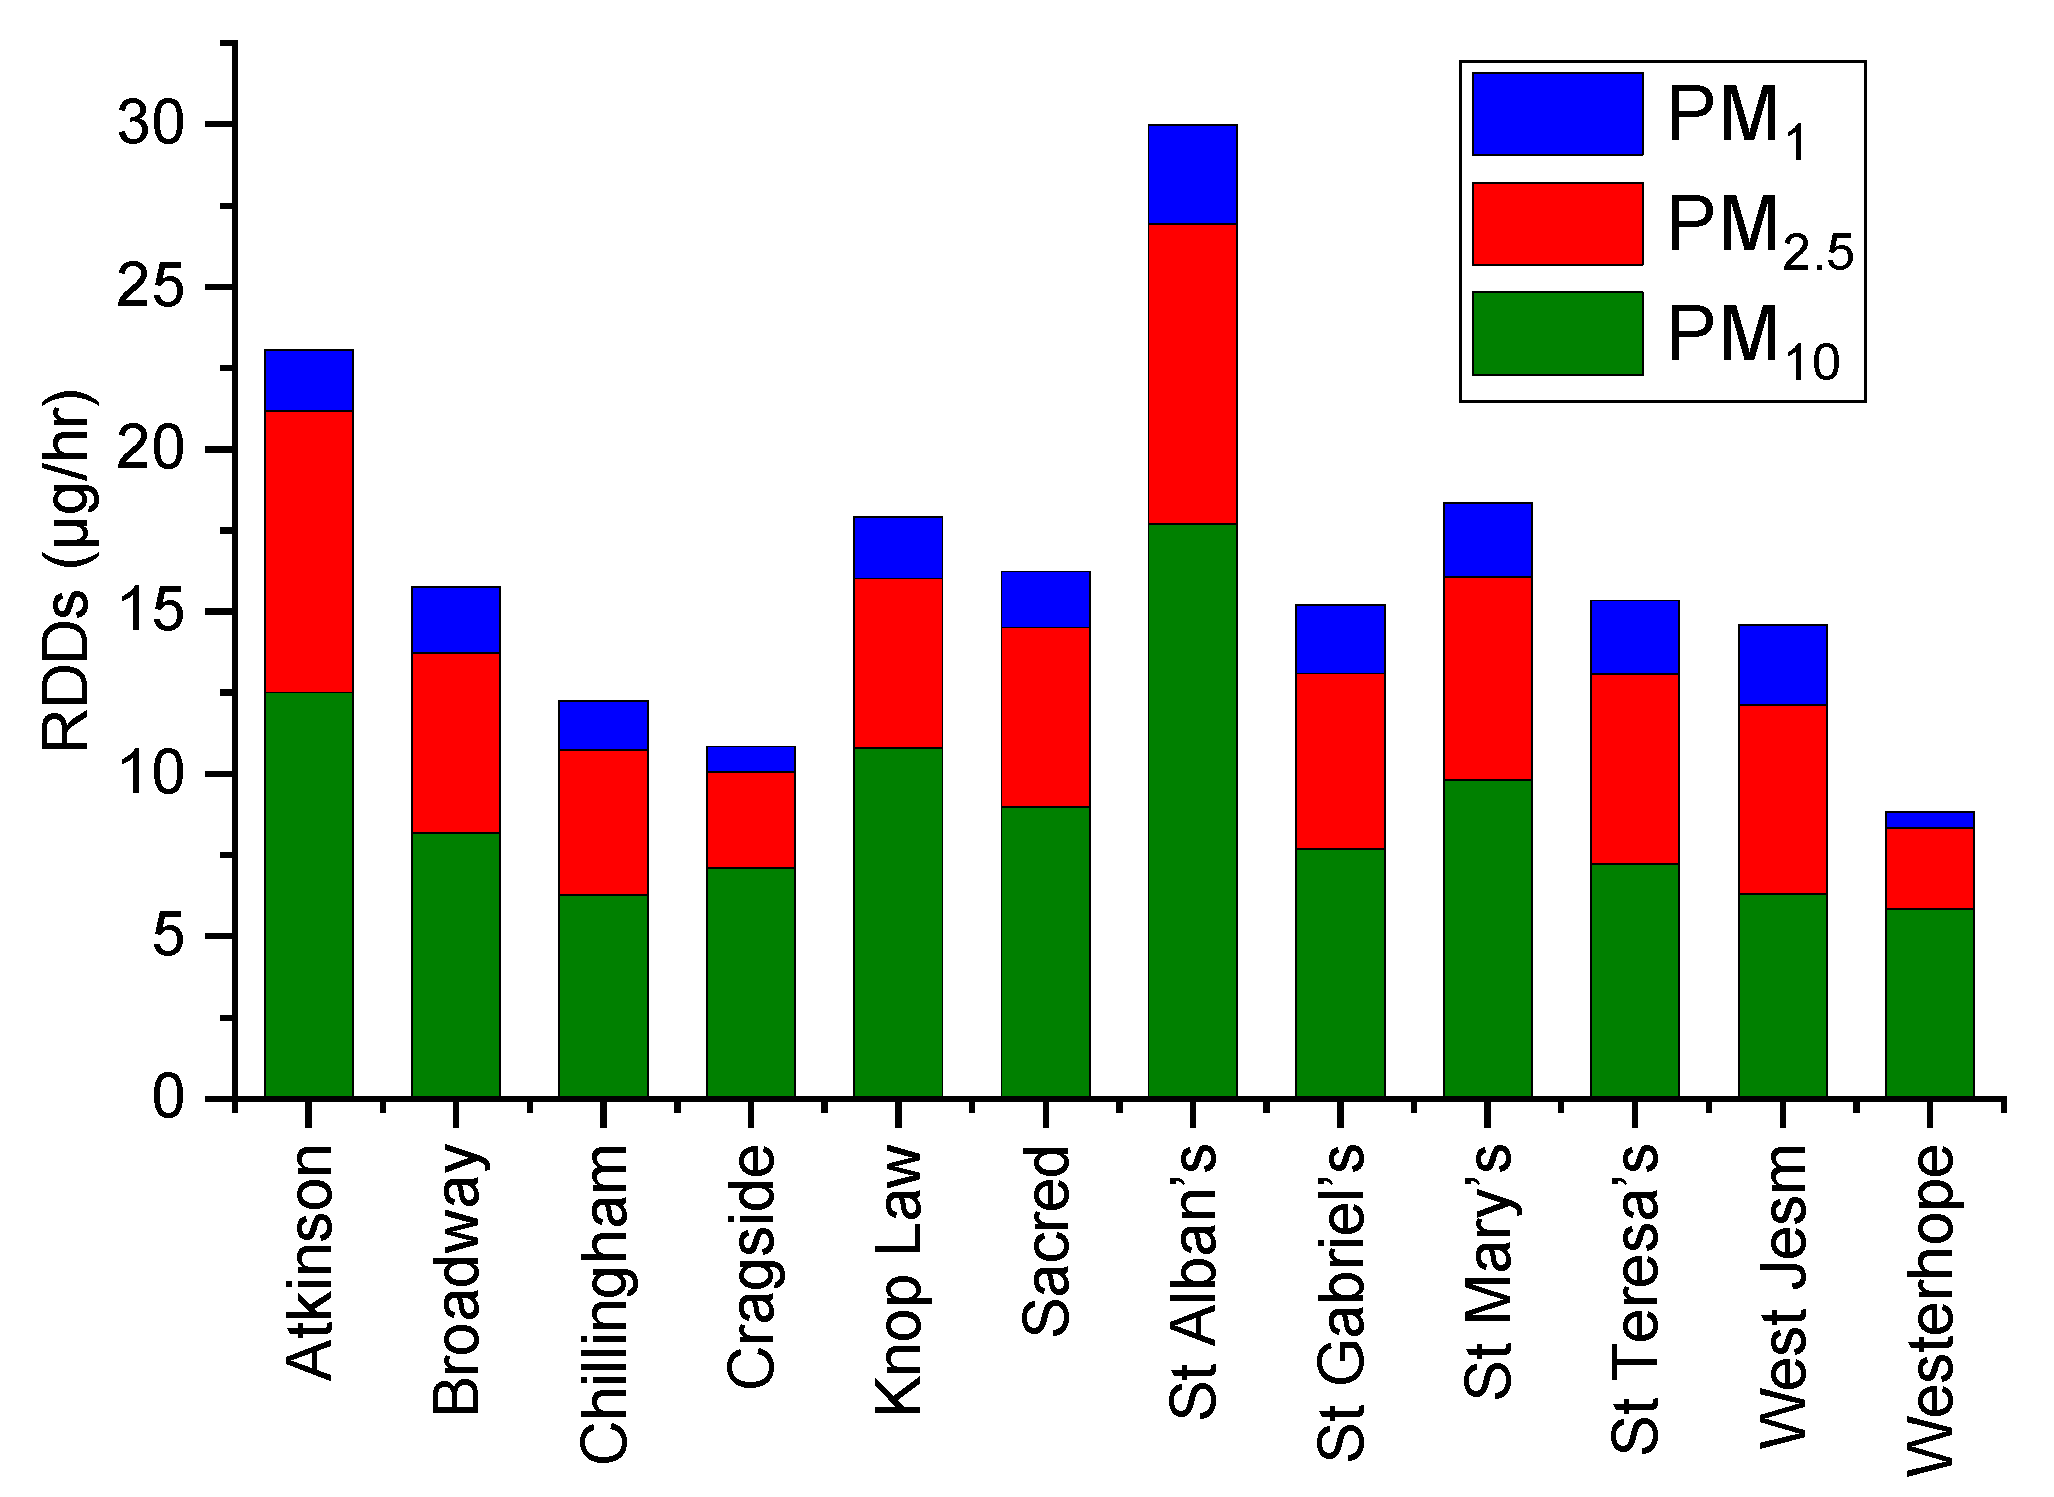
2.3. Respiratory Deposition Dose (RDD)

Aerosolised particles, such as PM, become harmful to health when they are inhaled and deposited (remain after expiration) in the respiratory tract. Understanding the dose of PM deposited in different settings helps us to understand the health risk posed by the PM concentrations in these settings [40]. RDD estimates provide an indication of PM10, PM2.5, and PM1 deposition in the respiratory tract [41]. RDD is calculated using Equation (1) [41,42]:
R D D   ( μ g ) = D F × V T × f × C × T
where DF is the deposition fraction of particles in the respiratory, VT is the volume of air inhaled per breath (m3), f is the respiratory rate (breaths/minute), C is the concentration of particles in the air (µg/m3), and T is the exposure time, the amount of time spent in an activity or setting (minutes) [42,43,44]. DF is the fraction of inhaled particles that deposit in the respiratory tract from the extrathoracic region to deep in the thoracic region [45,46]. RDD regional depositions are calculated (head airways, tracheobronchial region, and alveolar region) and the total deposition in the respiratory tract is the sum of the regional depositions [40].
The deposition of aerosolised particles within the respiratory system is complex and determined by the characteristics of both the exposed individual and the inhaled particle [43,44,45]. Characteristics of the particle that impact on DF include its shape, density, chemical composition, and size [43]. DF is estimated using Equation (2):
D F = I F   ( 0.0587 + 0.911 1 + e x p ( 4.77 + 1.485 ln d p ) + 0.943 1 + e x p ( 0.508 2.59 ln d p ) )
where dp is the particle size (µm) and IF is the inhalable fraction (fraction of ambient particles present in the volume of air before inspiration that enter the nose and mouth) used in the International Commission on Radiological Protection (ICRP) model [47]. IF is estimated using Equation (3):
I F = 1 0.5   ( 1 1 1 + ( 0.00076 d p ) 2.8 )
where ( V T × f × T ) for light activity was calculated as 0.90 m3/h for school students in this study [41,42,48].

3. Results

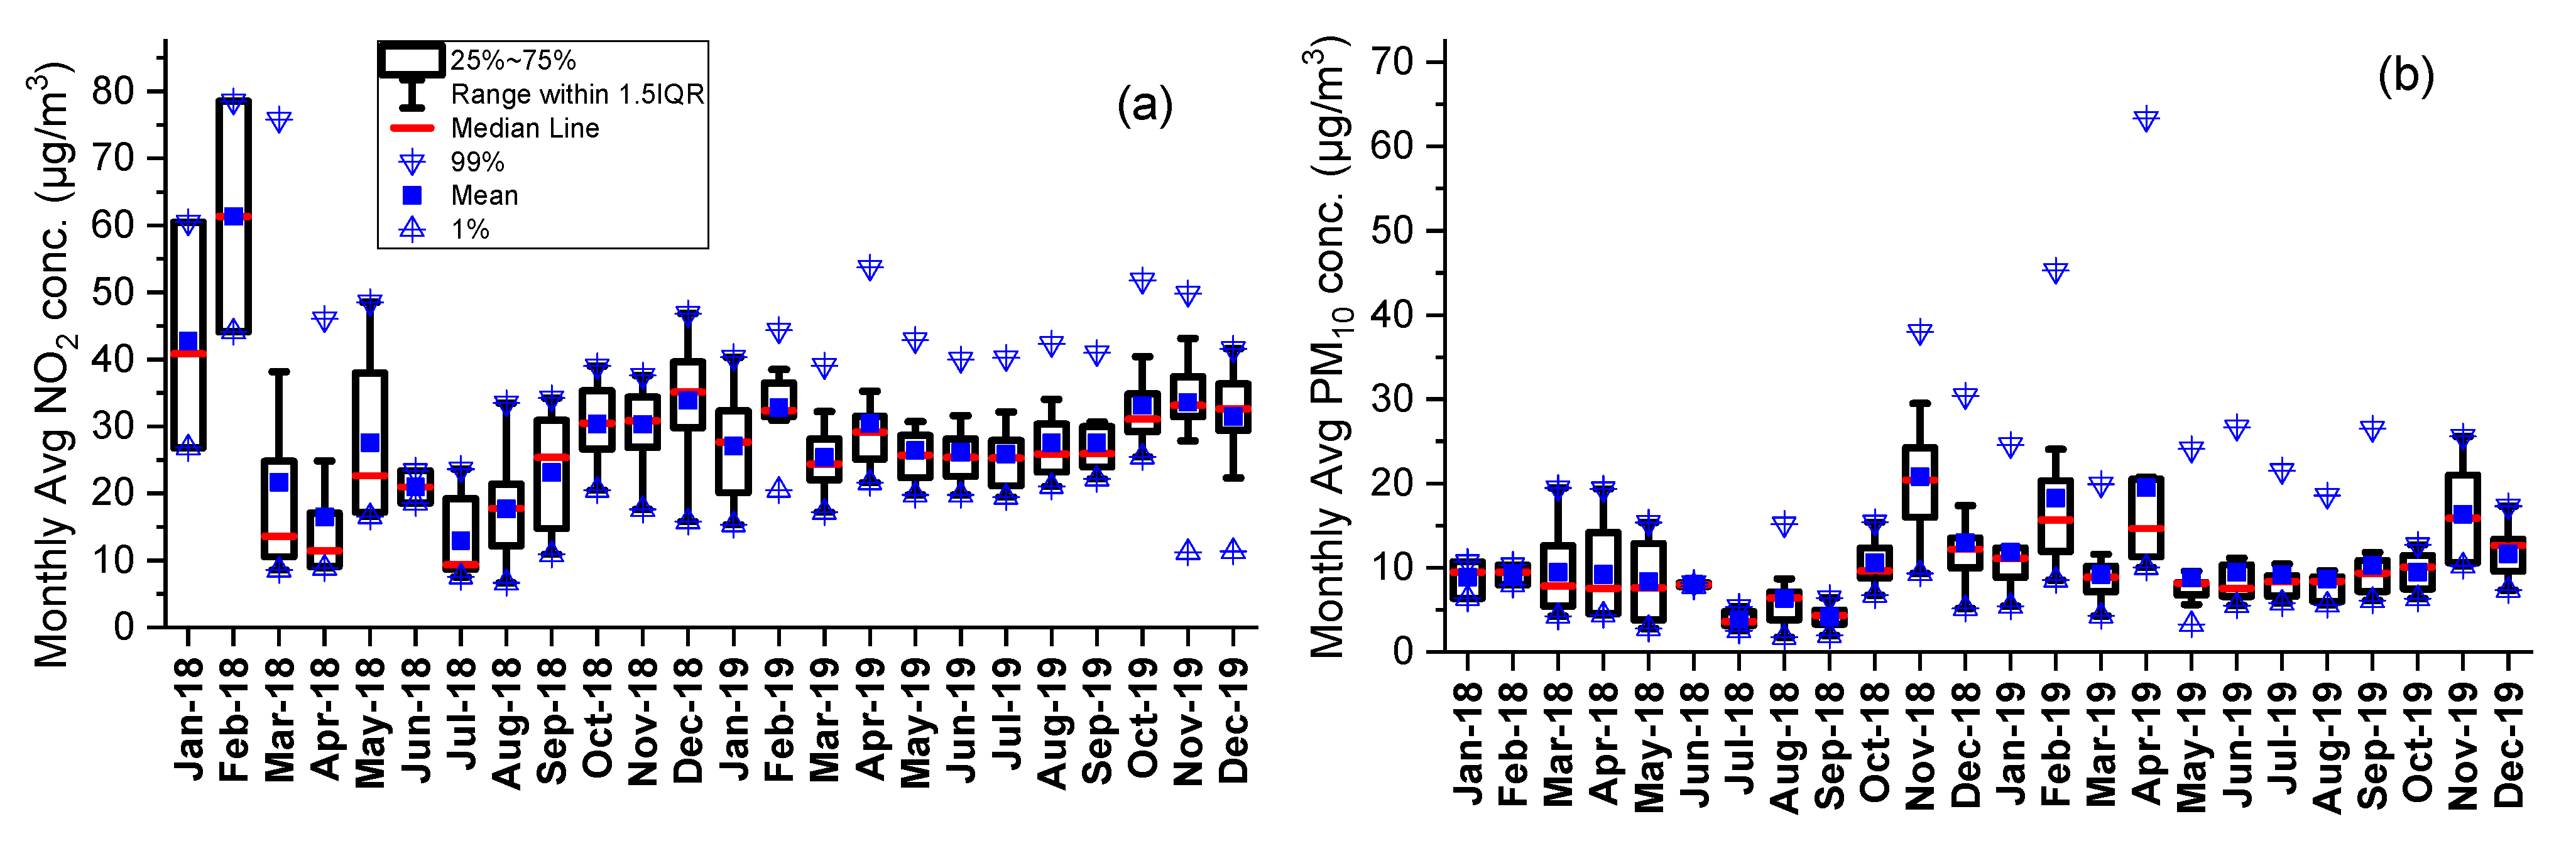
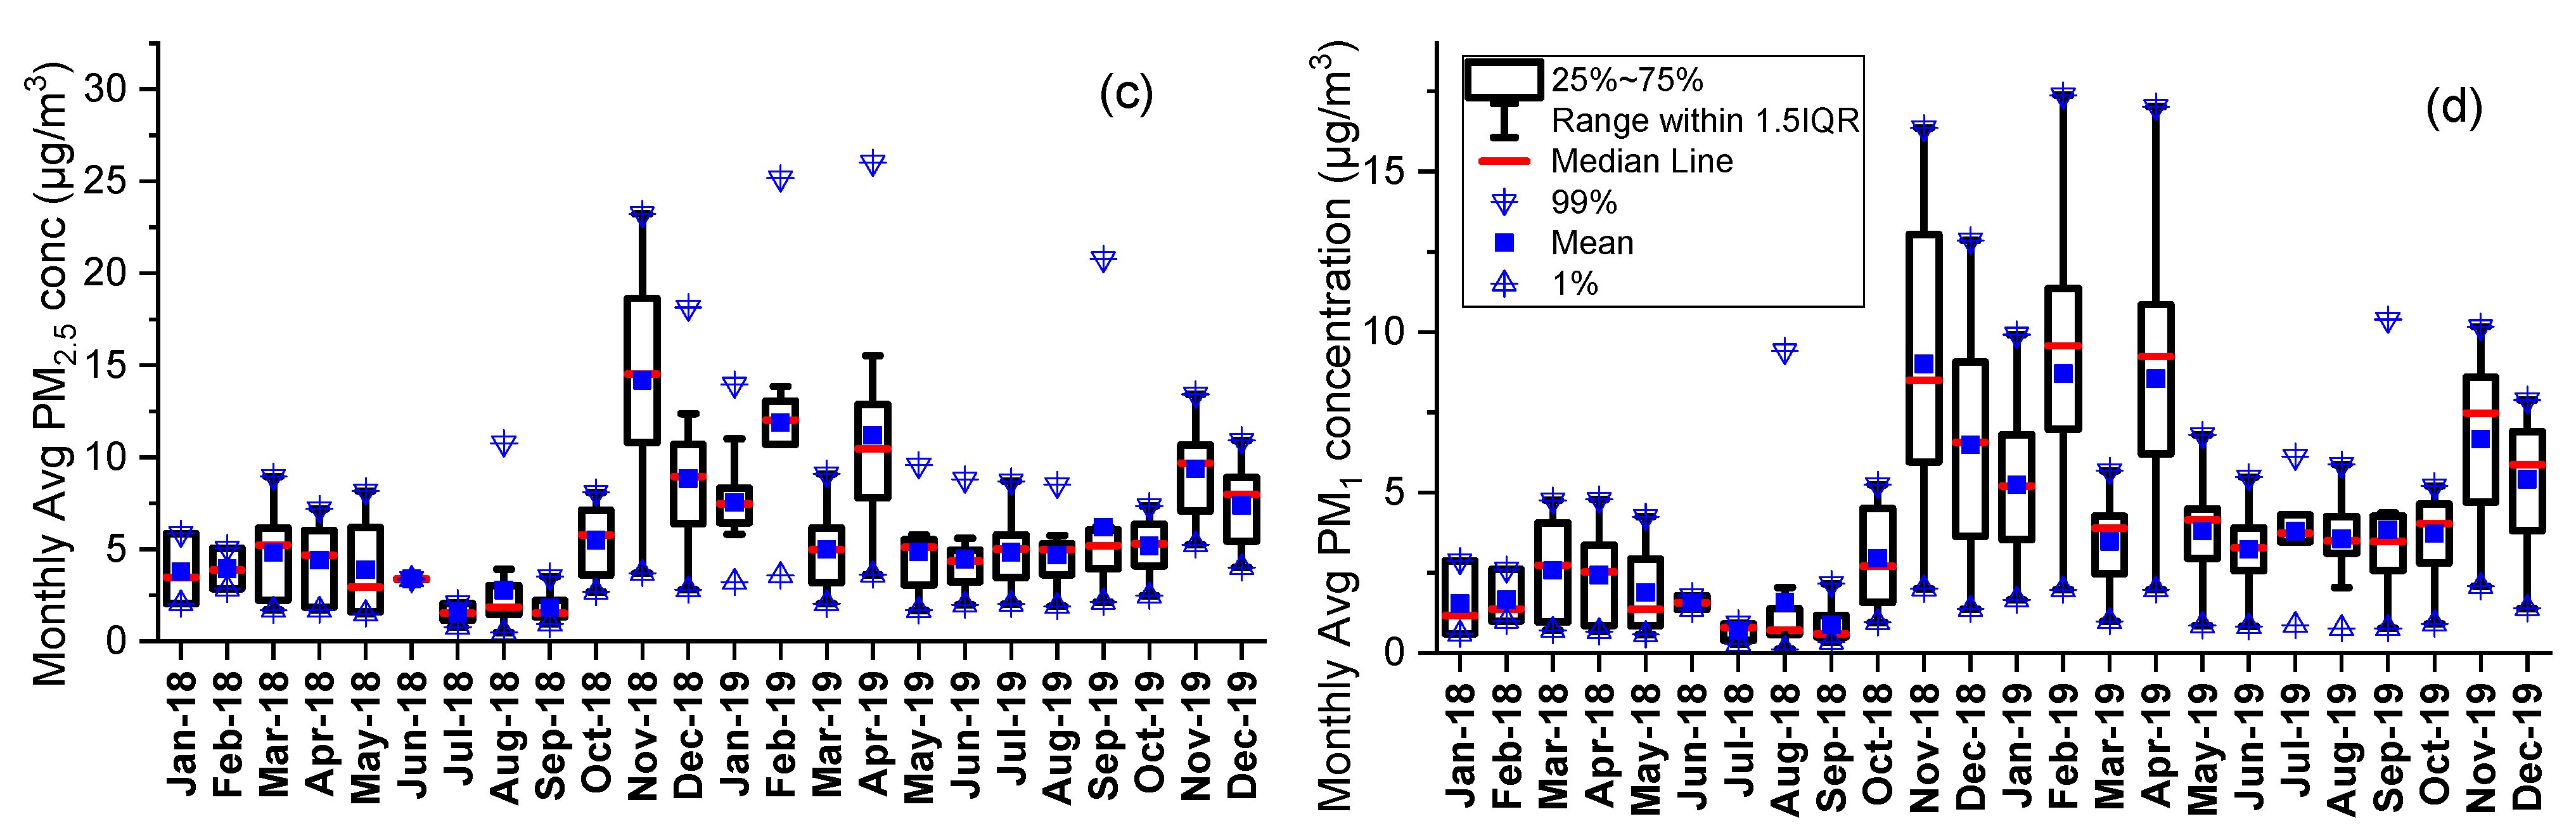
3.1. Ambient Air Quality in Newcastle during the Study Period

Data from the two precision air quality monitoring sites in Newcastle were analysed to understand urban background and roadside air quality in the city (see Supplementary Material Table S5). Data captured at the two precision monitoring sites ranged from 83–99%. In 2018, the annual mean NO2 concentration (±standard deviation) at the urban background site was 28.6 ± 16.4 µg/m3 and at the roadside site, it was 39.0 ± 26.2 µg/m3. In 2019, the annual mean NO2 concentration at the urban background site was 32.1 ± 15.8 µg/m3 and at the roadside site, it was 38.3 ± 27.7 µg/m3. In 2018, the annual mean PM10 concentration at the urban background site was 12.4 ± 12.7 µg/m3 and at the roadside site, it was 15.5 ± 11.8 µg/m3. In 2019, the annual mean PM10 concentration at the urban background site was 15.3 ± 30.1 µg/m3 and at the roadside site, it was 16.4 ± 12.2 µg/m3. In 2018, the annual mean PM2.5 concentration at the urban background site was 9.1 ± 7.8 µg/m3 and in 2019, it was 8.9 ± 7.8 µg/m3.
When comparing pollutant concentrations at the two sites, these data indicate that in both 2018 and 2019, NO2 and PM10 concentrations were higher at the roadside site than at the urban background site. When comparing pollutant concentrations by year, these data suggest that concentrations of PM10 increased between 2018 and 2019 at both the urban background site and the roadside site. Daily average NO2, PM10, and PM2.5 concentrations at the urban background and roadside sites from 1 January 2018–31 December 2019 are shown in Figure 2.
This figure demonstrates that temporal variations exist in the NO2 concentrations at the two precision sites in Newcastle over the course of a year. NO2 concentrations are at their highest at both sites between November and January (late autumn to mid-winter), gradually decline to their lowest in July (mid-summer), and then gradually increase again through autumn and winter months. This apparent decline in the urban background and roadside NO2 concentrations during the spring and summer months in Newcastle could be attributable to the increased temperatures in these months leading to less personal vehicle use, greater use of active travel (such as walking or cycling), and lower heating requirements.
PM concentrations show less noticeable variation over the course of a year; however, they do show occasional spikes in concentration, with the most obvious spike between January and July 2019 at the urban background site. Spikes in PM concentrations could be attributable to specific events, such as occasions when fireworks displays occur or emissions of dust from construction works. Spikes in the winter months could be attributable to increased fuel usage for heating and increased use of personal vehicles.

3.2. Ambient Air Quality Outside the 12 Schools in the Study Period

Data capture and data flagging of school data are reported in the Supplementary Materials (Tables S6–S8).

3.2.1. NO2 Concentrations

In 2018, annual mean NO2 concentrations outside the 12 schools ranged from 23.4 ± 15.9 µg/m3 (Atkinson Road Primary) to 38.3 ± 26.7 µg/m3 (St Gabriel’s Children’s Day Nursery). The combined annual mean NO2 concentration of the 12 schools in 2018 was 31.3 ± 23.8 µg/m3, which is greater than the urban background precision site 2018 annual mean (28.6 ± 16.4 µg/m3) but lower than the roadside precision site 2018 annual mean (39.0 ± 26.2 µg/m3).
In 2019, annual mean NO2 concentrations ranged from 21.7 ± 11.2 µg/m3 (West Jesmond Primary) to 40.0 ± 33.4 µg/m3 (Sacred Heart Catholic High). The combined annual mean NO2 concentration of the 12 schools in 2019 was 29.8 ± 16.4 µg/m3, which is lower than the urban background precision site 2019 annual mean (34.0 ± 13.7 µg/m3) and lower than the roadside precision site 2019 annual mean (38.3 ± 27.7 µg/m3).
No schools exceeded the WHO2005 guideline or EU/UK regulations for the annual mean NO2 concentration in 2018. However, all schools would have exceeded the updated WHO2021 guideline for the annual mean NO2 concentration if it had been in place. In 2019, Sacred Heart Catholic High met the WHO2005 guideline and EU/UK regulations for the annual mean NO2 concentration (40 µg/m3), but no other schools met or exceeded this value in this year. The 2018 and 2019 annual mean NO2 concentrations outside the 12 schools are shown in Table S5 and Figure 3a.
The monthly mean NO2 concentrations for all 12 schools combined can be seen in Figure 4a. The overall mean NO2 concentrations are lowest in the late spring, summer, and early autumn months (May–September) and highest in the winter months (October–February). When considering monthly NO2 concentrations at an individual school level, consistently high monthly mean NO2 concentrations were observed from April to November 2019 (range 40–53.7 µg/m3) at Sacred Heart Catholic High, and NO2 concentrations remained >40 µg/m3 throughout the winter months at St Gabriel’s Children’s Day Nursery. The high monthly average NO2 concentrations in January and February 2018 were due to high NO2 concentrations at St Teresa’s Primary School (60.5 and 78.5 µg/m3 in January and February 2018, respectively). Early morning peaks at this school reached around 100 µg/m3. This school’s AQM is located near a busy road with a large church, a row of shops and cafes, and a traffic light-controlled pedestrian crossing next to the AQM. Overall, the higher NO2 concentrations seen in the winter highlight the impact that the burning of fossil fuels for heating and energy and increased vehicle usage have on ambient NO2 levels in Newcastle in the colder months.

3.2.2. Annual Mean PM Concentrations

In 2018, the annual mean PM10 concentrations at participating schools ranged from 7.0 ± 15.2 µg/m3 (Westerhope Primary) to 19.0 ± 29.5 µg/m3 (St Alban’s RC Primary). In 2019, the annual mean PM10 concentrations ranged from 7.8 ± 18.6 µg/m3 (Westerhope Primary) to 25.4 ± 30.0 µg/m3 (St Alban’s RC Primary). These are the same two schools that had the lowest and highest annual mean PM10 in 2018, indicating a consistent pattern in the concentrations of PM10 at these schools over the time of the study (Table S5 and Figure 3b).
In 2018, no schools exceeded the WHO2005 guideline or EU/UK regulations for the annual mean PM10 concentration. However, two schools (Atkinson Road Primary and St Alban’s RC Primary) would have exceeded the updated WHO2021 guideline. In 2019, St Alban’s RC Primary had an annual mean PM10 concentration of 25.4 ± 30.0 µg/m3, higher than the WHO2005 guideline, but no schools exceeded the EU/UK regulations. In 2019, the same two schools (Atkinson Road Primary and St Alban’s RC Primary) would have also exceeded the updated WHO2021 guideline.
The average monthly PM10 concentrations for all 12 schools combined can be seen in Figure 4b. The monthly mean PM10 values are generally lowest in the late spring, summer, and early autumn months. During the study period, the highest monthly PM10 concentrations were observed in November 2018, February 2019, April 2019, and November 2019. At an individual school level, the highest monthly mean PM10 concentrations over the study period were all observed at St Alban’s RC Primary School. They occurred in the months of November 2018 (38.0 µg/m3), February 2019 (45.3 µg/m3), and April 2019 (63.3 µg/m3). In these same three months, the mean PM10 concentration for all schools combined was relatively high overall at 20.8 ± 7.8 µg/m3 (November 2018), 18.2 ± 10.1 µg/m3 (February 2019), and 19.5 ± 15.1 µg/m3 (April 2019).
In 2018, the annual mean PM2.5 concentrations ranged from 3.8 ± 5.3 µg/m3 (Cragside Primary) to 11.0 ± 10.2 µg/m3 (Atkinson Road Primary Academy) (Table S5 and Figure 3c). In 2019, the annual mean PM2.5 concentrations ranged from 3.1 ± 4.7 µg/m3 (Westerhope Primary) to 12.2 ± 15.8 µg/m3 (St Alban’s RC Primary). These are the same two schools that had the lowest and highest annual mean PM10 concentrations in 2018 and 2019, further demonstrating the strength of the pattern emerging. Atkinson Road Primary and St Alban’s RC Primary exceeded the WHO2005 guideline in 2018 and 2019, but no schools exceeded the EU/UK regulations. In both 2018 and 2019, 10 of the 12 schools would have exceeded the updated WHO2021 guideline and the same two schools would not have exceeded the guidelines in both years (Cragside Primary and Westerhope Primary).
The average monthly PM2.5 concentrations were lowest in the late spring, summer, and early autumn months (May–October) and highest in the late autumn and winter months (November–February) (Figure 4c). Over the two-year study period, no month exceeded the EU/UK annual mean PM2.5 regulations but three months exceeded the WHO2005 annual mean PM2.5 guideline. These three months were November 2018 (14.2 ± 5.6 µg/m3), February 2019 (11.9 ± 5.6 µg/m3), and April 2019 (11.2 ± 5.9 µg/m3). The school with the highest PM2.5 in these months was St Alban’s RC Primary, with a monthly mean of 23.2, 25.2, and 26.0 µg/m3 in November 2018, February 2019, and April 2019, respectively.
In 2018, the annual mean PM1 ranged from 2.1 ± 2.2 µg/m3 (Cragside Primary) to 7.6 ± 8.8 µg/m3 (West Jesmond Primary). The combined annual mean PM1 concentration of all 12 schools in 2018 was 5.6 ± 9.5 µg/m3. In 2019, the annual mean ranged from 1.3 ± 1.8 µg/m3 (Westerhope Primary) to 10.3 ± 18.0 µg/m3 (St Alban’s RC Primary). St Alban’s RC Primary 2018 and 2019 annual mean PM1 concentrations appear noticeably higher than concentrations outside the other 11 schools in both years (Figure 3d). The combined annual mean PM1 of all 12 schools in 2019 was 5.0 ± 6.8 µg/m3.
The monthly mean PM1 concentrations (Figure 4d) show similar patterns to the monthly mean PM10 and PM2.5. Considering the monthly mean PM1 concentrations at an individual school level, St Alban’s RC Primary had the highest concentrations over the two-year study period. These occurred in the months of November 2018 (16.4 µg/m3), February 2019 (17.4 µg/m3), and April 2019 (17.0 µg/m3). St Teresa’s Primary (14.8 µg/m3) and West Jesmond Primary (14.9 µg/m3) also had high monthly mean PM1 concentrations in November 2018.

3.2.3. Short-Term Exceedances

In 2018, Knop Law Primary and St Teresa’s Primary exceeded both the WHO2005 guidelines and the EU/UK regulations for short-term NO2 exceedances. In 2018, Knop Law Primary had 24 occurrences of NO2 level >200 µg/m3 and St Teresa’s Primary had 39 occurrences. In 2018, Atkinson Road Primary, Cragside Primary, Sacred Heart Catholic High, and St Gabriel’s Children’s Day all exceeded the WHO2005 guidelines on one occasion and Westerhope Primary exceeded these guidelines on 10 occasions. The highest NO2 1-h means occurred at Knop Law Primary (range 201.8–521.5 µg/m3) and St Teresa’s Primary (range 201.0–504.8 µg/m3). In 2019, no schools exceeded the WHO2005 guidelines or EU/UK regulations for NO2 short-term exceedances (Figure S4a).
For PM10, in 2018, all 12 schools exceeded the WHO2005 guidelines at least twice. The maximum total number of days exceeding the WHO2005 guideline in 2018 was 13 at St Alban’s Primary. High 24-h mean PM10 concentrations were observed at Cragside Primary (137.5 μg/m3), St Alban’s Primary (137.6 μg/m3), and St Teresa’s Primary (132.7 μg/m3) in 2018. In 2019, 6 of the 12 schools exceeded the WHO2005 guideline at least once and St Alban’s RC Primary exceeded the EU/UK regulations, with 36 days of PM10 >50 μg/m3. In 2019, the highest 24-h mean PM10 concentrations were observed at Knop Law Primary (274.7 μg/m3) and St Alban’s RC Primary (174.1 μg/m3) (Figure S4b).
All schools exceeded the 24-h mean PM2.5 WHO2005 guideline in 2018. The schools with the highest number of exceedances were St Alban’s RC Primary (20 days), St Teresa’s Primary (14 days), and West Jesmond Primary (11 days). The lowest number of exceedances (3 days) was observed at Cragside Primary. When the 24-h means that exceeded the WHO2005 guidelines in 2018 were combined and averaged at an individual school level for the three schools with the greatest number of exceedances, the combined mean daily PM2.5 concentration was 42.4 ± 18.2 µg/m3 at St Alban’s Primary RC, 42.0 ± 17.5 µg/m3 at St Teresa’s Primary, and 42.1 ± 15.4 µg/m3 at West Jesmond Primary. In 2019, 10 of the 12 schools exceeded the WHO2005 guidelines. The highest number of exceedances occurred at Knop Law Primary (12 days), St Alban’s RC Primary (42 days), St Mary’s Catholic (12 days), and St Teresa’s Primary (17 days). When the 24-h means that exceeded the WHO2005 guidelines in 2019 were combined and averaged at an individual school level for these four schools, the mean daily average PM2.5 concentration was 76.8 ± 57.1 µg/m3 at Knop Law Primary, 40.8 ± 15.4 µg/m3 at St Alban’s RC Primary, 34.8 ± 9.6 µg/m3 at St Mary’s Catholic, and 33.1 ± 7.6 µg/m3 at St Teresa’s Primary (Figure S4c).
There are currently no guidelines or regulations for PM1 concentrations. The ratio of PM1:PM2.5 in the 12 school sites (range 0·61 to 0·95) indicates higher PM1 fractions in the PM2.5 concentrations at these sites. Given the lack of current guidelines or regulations on PM1, and its potential for increased health risk, we chose to set our short-term exceedance limit to half that of the WHO2005 guidelines for PM2.5 at 12.5 µg/m3. During the 2-year study period, 5 schools had >50 days where PM1 concentrations exceeded 12.5 µg/m3. Broadway East exceeded this value on 55 days, St Alban’s RC Primary exceeded it on 99 days, St Mary’s Catholic on 55 days, St Teresa’s Primary on 66 days, and West Jesmond Primary on 63 days. Over the 2-year study period, the highest average PM1 concentration was 19.1 ± 6.9 µg/m3 at Broadway East, 23.5 ± 10.9 µg/m3 at St Alban’s RC Primary, 18.2 ± 7.6 µg/m3 at St Mary’s Catholic, 18.8 ± 9.5 µg/m3 at St Teresa’s Primary School, and 19.1 ± 8.8 µg/m3 at West Jesmond Primary (Figure S4d).

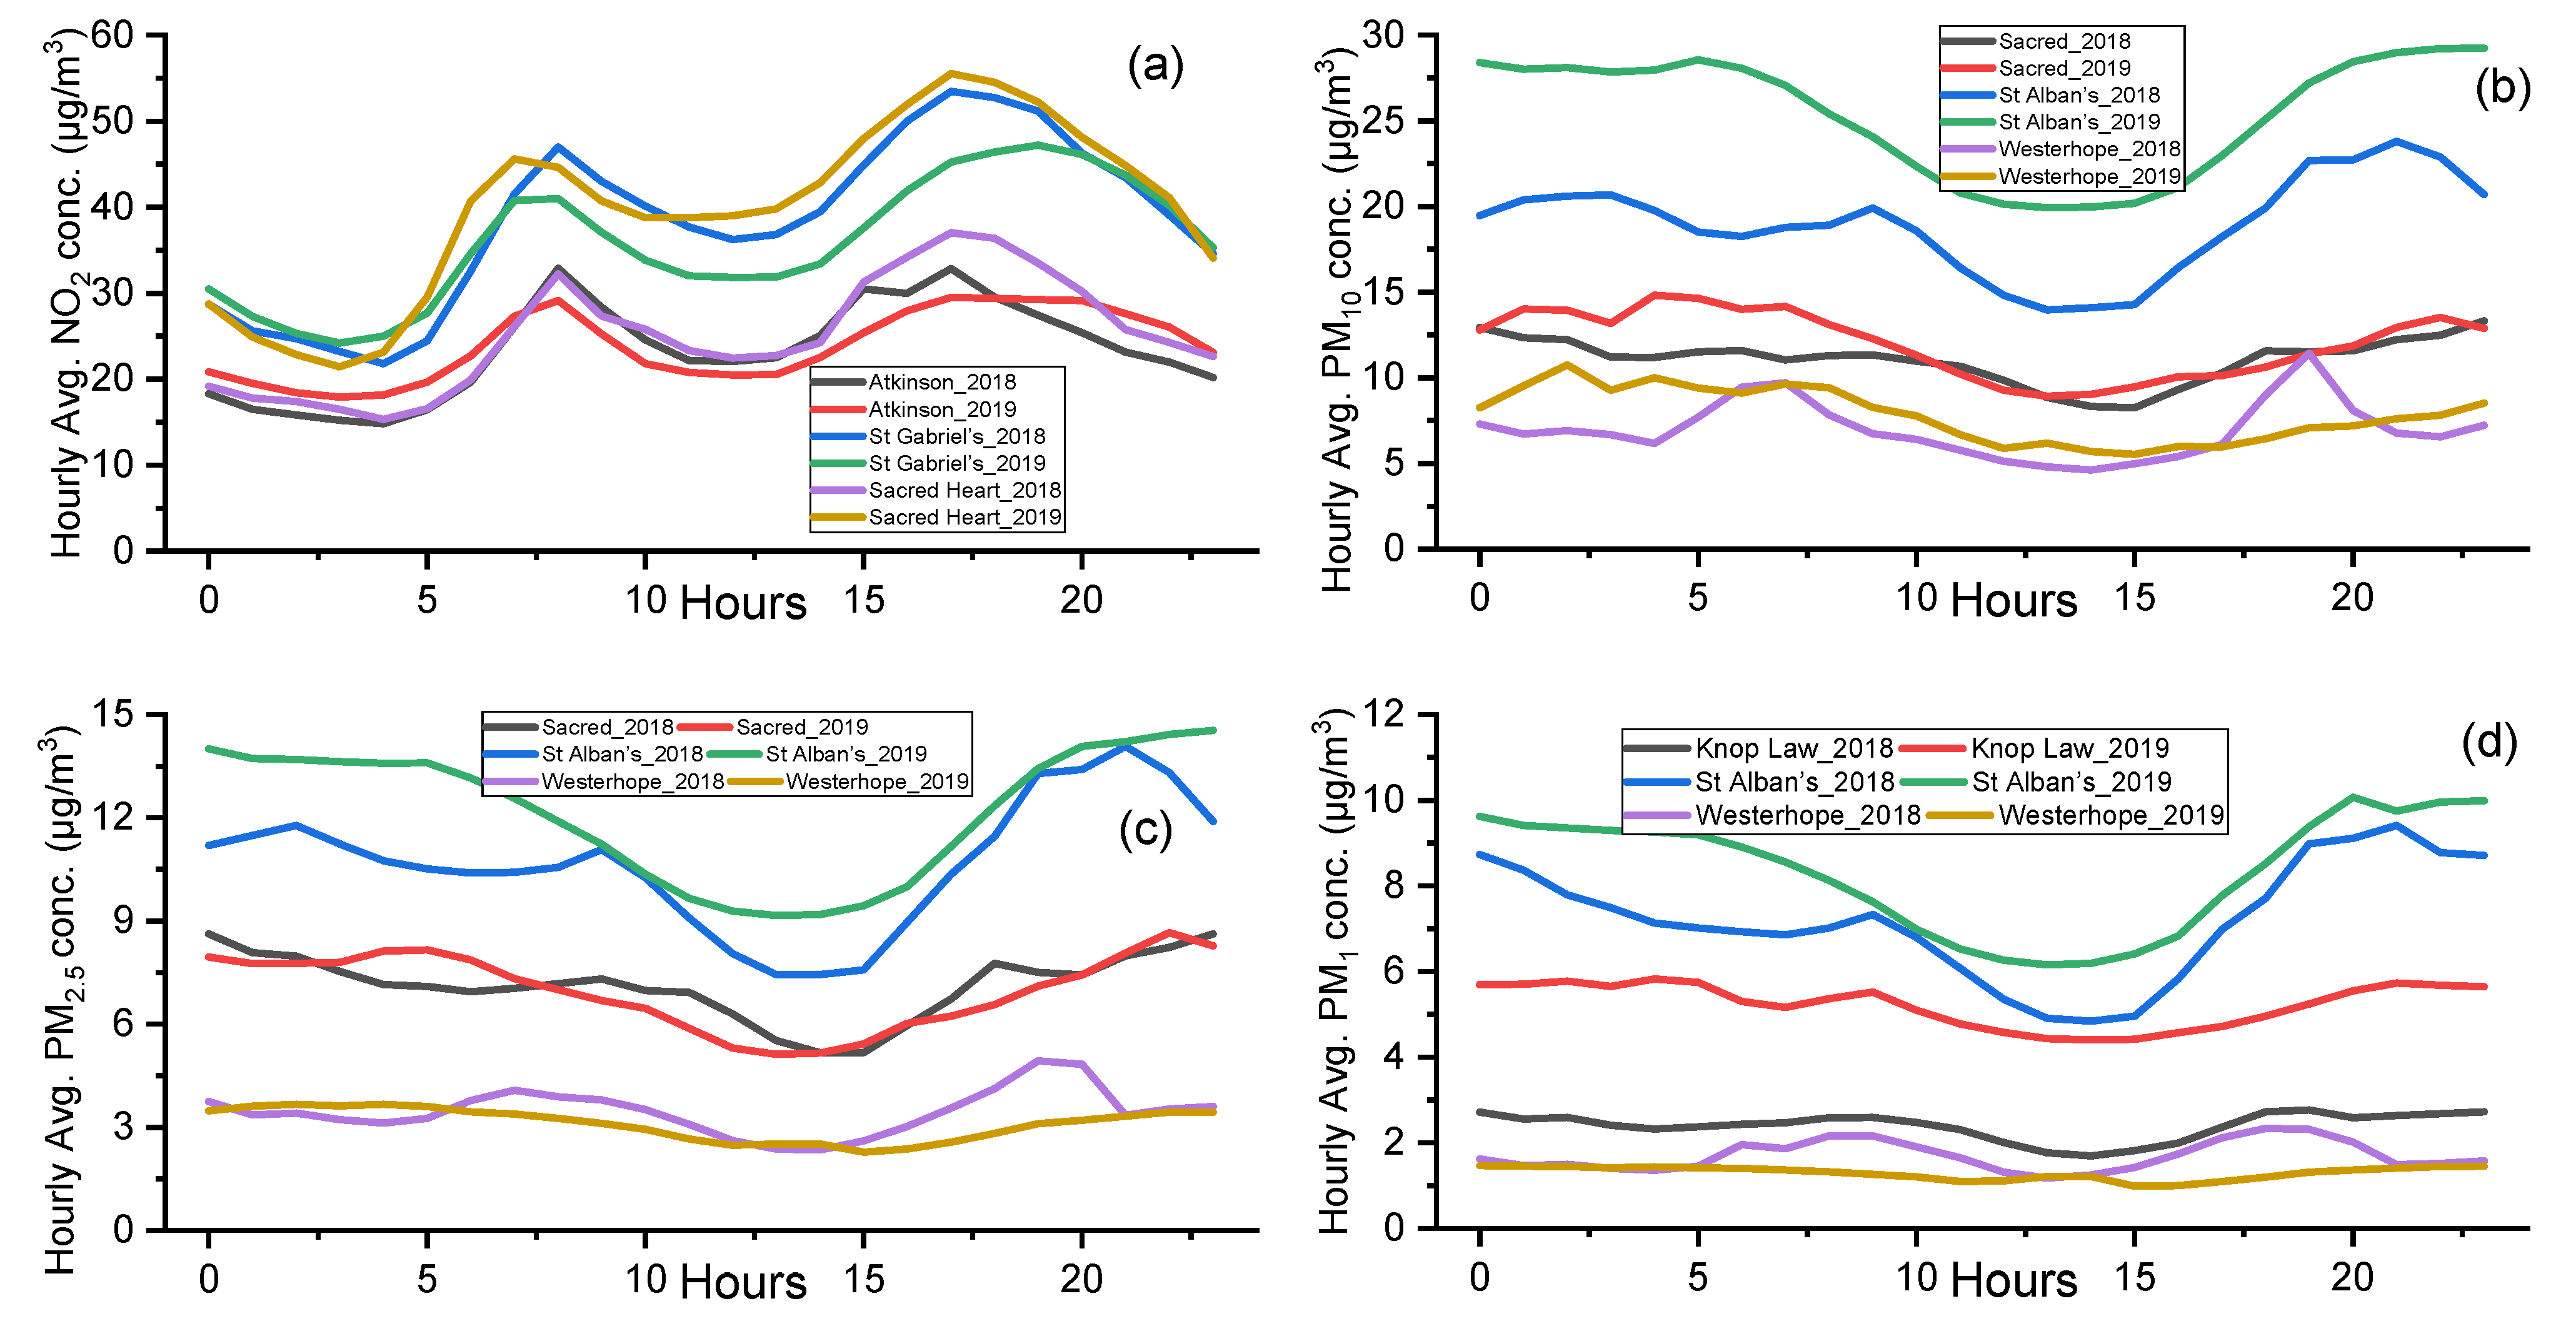
3.2.4. Diurnal Variation

We produced time variation plots to investigate the diurnal variation of NO2, PM10, PM2.5, and PM1 at schools in Newcastle. Only three schools were chosen to produce the time variation plot for each pollutant. These 3 schools were the school with the highest annual mean concentration, the school with the lowest, and the school with the annual mean concentration closest to the mean of all of the 12 schools.
The NO2 levels outside the 3 chosen schools show a distinct pattern over 24 h (Figure 5a). Their distribution is bimodal, with noticeable morning and afternoon/evening peaks. The morning peak occurs at around 07:00–09:00 and the afternoon/evening peak occurs at around 16:00–18:00. The afternoon/evening peak is generally higher and has fewer steep gradients than the morning peak. The morning peak could be attributable to morning rush hour traffic and the afternoon/evening peak could be attributable to evening rush hour traffic. The greater height and less steep gradient of the afternoon/evening peak could be attributable to the fact that baseline NO2 concentrations are higher before the evening rush hour begins than they are before the morning rush hour begins due to the accumulation of NO2 during the day from ongoing traffic emissions.
PM10 levels outside of the 3 chosen schools show an almost opposite shape to NO2 concentrations over 24 h (Figure 5b). Rather than two distinct peaks, PM10 concentrations show a “U-shape” and are at their highest from midnight until early morning and their lowest in the middle of the day. This indicates that, when compared to NO2 concentrations, PM10 concentrations are less associated with traffic volumes. Both the 2018 and 2019 maximum hourly PM10 concentrations occurred at St Alban’s RC Primary and were 23.8 and 29.3 μg/m3, respectively. These peak PM10 concentrations were higher than the peak PM10 concentrations at both the urban background and roadside monitoring sites in 2018 and 2019.
The time variation plots of PM2.5 and PM1 show similar patterns to that of PM10 (Figure 5c,d). Of note, variation in the PM concentrations over 24 h appear more marked outside of schools with the highest overall PM concentrations.

3.3. Exposure Assessment

The AQMesh pod AQMs that collected the data used in this study are commonly attached to lampposts at school entrances. Therefore, when children are outside during the school day (while arriving at and leaving school, while on outdoor breaks, or while undertaking outdoor physical education (PE) lessons), it is likely that they are exposed to PM concentrations that are similar to those of the AQMesh pod microenvironment.
During the study period, the highest total PM10 RDDs (µg/h) occurred outside Atkinson Road Primary (12.5 µg/h), Knop Law Primary (10.8 µg/h), and St Alban’s RC Primary (17.7 µg/h). The lowest total PM10 RDDs occurred outside Chillingham Road Primary (6.3 µg/h), West Jesmond Primary (6.3 µg/h), and Westerhope Primary (5.8 µg/h). The highest total PM2.5 RDDs occurred outside Atkinson Road Primary (8.7 µg/h), St Alban’s RC Primary (9.2 µg/h), and St Mary’s Catholic (6.2 µg/h). The lowest occurred outside Cragside Primary (2.9 µg/h) and Westerhope Primary (2.5 µg/h). The highest total PM1 RDDs occurred at West Jesmond Primary (2.5 µg/h) and St Alban’s RC Primary School (3.0 µg/h). The estimated RDDs of each pollutant at each of the 12 schools can be seen in Figure 6. The estimated RDD is an indicator of the health risk posed by ambient PM concentrations for the children attending those schools [9].

4. Discussion

Overall, the findings of this study indicate that the annual mean ambient NO2 concentrations outside schools in Newcastle do not regularly exceed the WHO2005 guidelines and EU/UK regulations. In contrast, modelling studies conducted in London have consistently found that around 25% of all schools in London are in areas where the WHO2005 guideline and EU/UK regulations for annual mean NO2 are regularly exceeded [20,49,50]. This suggests that the annual mean NO2 levels outside schools in Newcastle may present a lower risk to children’s health when compared to those in the country’s capital city.
Annual mean NO2 concentrations outside schools in this study ranged from 21.7 ± 11.2 µg/m3 to 40.0 ± 33.4 µg/m3 over the 2-year study period. Ambient NO2 levels outside schools were measured over four weeks and ranged from 6–25 µg/m3 in Berlin, 25–41 µg/m3 in London, 20–43 µg/m3 in Madrid, 26–52 µg/m3 in Paris, and 16–32 µg/m3 in Sophia [50]. These findings are not directly comparable given their shorter monitoring period and capital city location but indicate that NO2 levels outside schools in Newcastle are not markedly different from those outside schools in other European cities. Osborne et al. (2021) used automatic urban and rural network (AURN) monitoring stations located in school grounds or within 150 m of a school to capture ambient pollution concentrations outside 30 schools in the UK in 2017 [49]. They found that the annual mean NO2 concentrations outside these 30 schools ranged from 6.2–56.5 µg/m3 and that AURN stations marked as “traffic urban” generally had the highest NO2 concentrations [49].
The patterns of NO2 concentrations outside schools in Newcastle are consistent with those of other studies investigating schools’ ambient air quality. This study found evidence for a relationship between NO2 concentrations outside schools in Newcastle and rush hours (and therefore small vehicle traffic volumes). The Breathe London Wearables study found that children’s exposure to ambient pollutants was high during the morning rush hour and that main roads and busy junctions were associated with higher NO2 concentrations due to traffic density [51]. Studies conducted outside of Europe also demonstrate the relationship between traffic density, particularly small vehicle traffic density in streets surrounding schools, and ambient NO2 concentrations outside schools [52,53].
Overall, PM levels outside schools in Newcastle exceed the WHO2005 guidelines relatively frequently, particularly short-term (24-h) exceedances. This indicates that children at schools in Newcastle may be at greater risk of harm from PM than NO2. Furthermore, the patterns of PM concentrations outside schools are consistent across years and the size of particles. There is evidence that some schools experience noticeably worse ambient PM concentrations than other schools and this would benefit from both further monitoring and action to reduce the risk to children at these schools.
The annual mean PM10 concentrations outside schools in this study ranged from 7.0 ± 15.2 µg/m3 to 25.4 ± 30.0 µg/m3 in the 2 years and annual mean PM2.5 concentrations ranged from 3.1 ± 4.7 µg/m3 to 12.2 ± 15.8 µg/m3. The Health and Environment Alliance (HEAL) Report (2019) estimated that ambient PM2.5 concentrations outside London schools range from 1 μg/m3 to 17 μg/m3 while Osborne et al. (2019) found that annual mean ambient PM2.5 concentrations ranged from 7.3 μg/m3 to 14.1 μg/m3 [49,50]. Osborne et al. (2019) also found that high PM2.5 concentrations existed at both urban traffic and urban background monitoring sites, in keeping with this study’s findings that ambient PM concentrations are less closely associated with small vehicle traffic density than ambient NO2 concentration [49]. Tofful and Perrino (2015) reported that outdoor PM2.5 concentrations in Rome vary from 17 to 56 m3 and some schools’ indoor PM2.5 concentrations are higher than ambient concentrations [54]. A further study reported very high PM10 concentrations outside 39 schools in Barcelona (Spain) of around 50.1 μg/m3 [55]. Janssen et al. (2001) also found that the closer a school is to a motorway, the higher its ambient PM2.5 concentrations [53]. Furthermore, Patel et al. (2009) found that school ambient PM2.5 levels in New York City were 1.8 times higher in dense urban settings than in suburban settings due to increased truck and bus volumes [56]. These findings help to explain the differences in the diurnal variations of PM and NO2 concentrations and may provide a basis upon which to investigate why some schools in Newcastle experience noticeably worse ambient PM concentrations than others.
This study provides evidence upon which policy may be based to improve school ambient air quality. Given the association between NO2 concentrations outside schools, small vehicle traffic density, and rush hours, measures, such as road closures outside schools (school streets initiative), anti-idling campaigns, staggered drop-off and pick-up times, relocating drop-off and pick-up sites away from school entrances and playgrounds, and active travel programmes, should be introduced (or continued). Action taken to reduce NO2 concentrations outside schools will also help to reduce PM concentrations. Specific policy measures to reduce ambient PM concentrations outside schools highlighted by the findings of this study could include mitigation of schools’ proximity to sources of PM, such as motorways or roads with high volumes of large vehicles, and being aware of sporadic weather events or anthropogenic events that may generate PM, putting mitigation measures in place where these are identified. Lastly, education for children, parents, and teachers on the health benefits of clean air and measures they can take to reduce schoolchildren’s exposure to ambient air pollutants, particularly during the winter months, is essential.
Despite having some limitations (reported in the Supplementary Materials), this study addressed a gap in the understanding identified in the literature. In their systematic review, Osborne et al. (2021) highlighted that only 3 of the 14 UK-based studies investigating school air quality in their review used fixed location air quality monitoring; the remaining 11 used modelling to estimate concentrations of pollutants [17]. This study presents air quality data from fixed location continuous AQMs over two years and therefore addresses these identified gaps and adds value to the existing literature.

5. Conclusions

As evidence for the harmful effects of air pollution in children increases and becomes ever more robust, this study provides yet unseen insight into the ambient air quality of 12 schools in Newcastle Upon Tyne, UK, and highlights the need to act urgently to protect children’s health. It provides an understanding of key ambient pollutant concentrations outside schools in urban areas, particularly urban areas that are outside of capital cities in developed countries with temperate climates. The findings in this study agree with other recent similar studies investigating school ambient air quality. This study, therefore, provides evidence upon which organisations can plan and implement policy at both a local and national level to protect children from the harmful effects of ambient air pollution during their day at school.
This study provides opportunities for further research that could both enhance and expand on the current findings. Further research suggestions include, but are not limited to, investigating Newcastle school indoor air quality, expanding this study to include more schools, repeating this study in a different area of the UK, and widening this study to include additional harmful pollutants, such as volatile organic compounds (VOCs), including BTEX.

Supplementary Materials

The following supporting information can be downloaded at: https://www.mdpi.com/article/10.3390/atmos13020172/s1, Study location description, Urban design, Meteorology, Technical information AQMesh pod Quality Assurance, Study limitations. Table S1. Comparison of WHO air quality guideline values (2005 and 2021) and EU/UK pollutant limit values for NO2, PM2.5, and PM10 [11,12,16]. Table S2. Previous school air quality studies conducted in the UK. Please note: Much of this data (study numbers 1–14 in italics) has been taken from a table in Osborne et. al (2021) with kind permission from the authors [17]. Please refer to Osborne et. al for the original table and further detail. Table S3. Participating schools, pupil ages, air quality data collection start date and air quality monitor location information. Table S4. Data flagging values, adapted from the Breathe London project [36]. Table S5. Annual average and standard deviations of PM10, PM2.5, PM1, and NO2 concentrations at each of the participating schools during 2018 and 2019. Table S6. NO2 data capture (%), and data flagging by school in 2018 and 2019. Table S7. PM10 data capture (%), and data flagging by the school in 2018 and 2019. Table S8. PM2.5 data capture (%), and data flagging by school in 2018 and 2019. Figure S1. 2015 Index of Multiple Deprivation by ward in the city of Newcastle Upon Tyne [25]. Figure S2. Monthly wind rose profile for 2018 (bottom) and 2019 (top) in Newcastle Upon Tyne. Figure S3. Examples of Healthy Schools project air quality monitor locations in Newcastle Upon Tyne. Figure S4. Scatterplots of (a) 1-h average NO2 concern, (b) 24-h average PM10, (c) 24-h average PM2.5 and (d) 24-h average PM1 for schools with the highest number of exceedances of short-term WHO guidelines during 2018–2019.

Author Contributions

L.K., Conceptualization; L.K. and K.J.M.; methodology; L.K. and K.J.M., formal analysis; L.B., J.R. and A.N., investigation; L.K., resources; L.K. and K.J.M., writing—original draft preparation; L.B., J.R. and A.N., writing—review and editing; K.J.M., visualization; L.B., J.R. and A.N., supervision. All authors have read and agreed to the published version of the manuscript.

Funding

This research received no external funding.

Institutional Review Board Statement

Not applicable.

Informed Consent Statement

Not applicable.

Data Availability Statement

Data can be made available upon request.

Acknowledgments

Jennine Jonczyk at Newcastle Urban Observatory, Miles Clement at Newcastle Urban Observatory who produced the Openair code for analysis, Judith MacMorran of the Newcastle City Council Healthy Schools Programme, and Duika Burges Watson at Newcastle University for her support at the inception of this study. Judith Rankin is part-funded by the National Institute of Health Research Applied Research Collaboration North East and North Cumbria.

Conflicts of Interest

The authors have declared no conflict of interest.

References

  1. Public Health England. Health Matters: Air Pollution. Available online: https://www.gov.uk/government/publications/health-matters-air-pollution/health-matters-air-pollution (accessed on 9 July 2020).
  2. Department for Environment, Food, and Rural Affairs. Air Quality: A Briefing for Directors of Public Health. Available online: https://laqm.defra.gov.uk/assets/63091defraairqualityguide9web.pdf (accessed on 9 July 2020).
  3. Public Health England. Estimation of Costs to the NHS and Social Care Due to the Health Impacts of Air Pollution: Summary Report. Available online: https://www.gov.uk/government/publications/air-pollution-a-tool-to-estimate-healthcare-costs (accessed on 9 July 2020).
  4. World Health Organization. Health Effects of Particulate Matter: Policy Implications for Countries in Eastern Europe, Caucasus and Central Asia. Available online: https://www.euro.who.int/__data/assets/pdf_file/0006/189051/Health-effects-of-particulate-matter-final-Eng.pdf (accessed on 14 January 2021).
  5. Royal College of Physicians. Every Breath we Take: The Lifelong Impact of Air Pollution. Available online: https://www.rcplondon.ac.uk/projects/outputs/every-breath-we-take-lifelong-impact-air-pollution (accessed on 9 July 2020).
  6. Gauderman, W.J.; Avol, E.; Gilliland, F.; Vora, H.; Thomas, D.; Berhane, K.; McConnell, R.; Kuenzli, N.; Lurmann, F.; Rappaport, E.; et al. The Effect of Air Pollution on Lung Development from 10 to 18 Years of Age. N. Engl. J. Med. 2004, 351, 1057–1067. [Google Scholar] [CrossRef] [PubMed] [Green Version]
  7. Gasana, J.; Dillikar, D.; Mendy, A.; Forno, E.; Ramos Vieira, E. Motor vehicle air pollution and asthma in children: A meta-analysis. Environ. Res. 2012, 117, 36–45. [Google Scholar] [CrossRef] [PubMed]
  8. Thiering, E.; Cyrys, J.; Kratzsch, J.; Meisinger, C.; Hoffmann, B.; Berdel, D.; von Berg, A.; Koletzko, S.; Bauer, C.P.; Heinrich, J. Long-term exposure to traffic-related air pollution and insulin resistance in children: Results from the GINIplus and LISAplus birth cohorts. Diabetologia 2013, 56, 1696–1704. [Google Scholar] [CrossRef] [PubMed] [Green Version]
  9. Kumar, P.; Omidvarborna, H.; Barwise, Y.; Tiwari, A. Mitigating Exposure to Traffic Pollution in and around Schools: Guidance for Children, Schools and Local Communities. Available online: https://www.surrey.ac.uk/sites/default/files/2021-01/mitigating-childrens-exposure-to-traffic-pollution-english-version.pdf (accessed on 19 December 2021).
  10. World Health Organization International Agency for Research on Cancer. Outdoor Air Pollution a Leading Environmental Cause of Cancer Deaths. Available online: https://www.iarc.fr/wp-content/uploads/2018/07/pr221_E.pdf (accessed on 17 September 2020).
  11. European Union. Directive 2008/50/EC of the European Parliament and of the council of 21 May 2008 on ambient air quality and cleaner air for Europe. Off. J. Eur. Union 2008, 51, 1–44. Available online: https://eur-lex.europa.eu/LexUriServ/LexUriServ.do?uri=OJ:L:2008:152:0001:0044:EN:PDF (accessed on 9 July 2020).
  12. World Health Organization. WHO Air Quality Guidelines for Particulate Matter, Ozone, Nitrogen Dioxide and Sulfur Dioxide; Global Update 2005: Summary of Risk Assessment; World Health Organization: Geneva, Switzerland, 2006; pp. 1–20. [Google Scholar]
  13. Department for Environment, Food & Rural Affairs. UK and EU Air Quality Policy Context. Available online: https://uk-air.defra.gov.uk/air-pollution/uk-eu-policy-context (accessed on 6 July 2020).
  14. European Commission. Environment: Commission Takes Action against UK for Persistent Air Pollution Problems. Available online: https://ec.europa.eu/commission/presscorner/detail/en/IP_14_154 (accessed on 9 July 2020).
  15. Department for Environment, Food & Rural Affairs. September 2021: Air Quality Factsheet (Part 4). Available online: https://www.gov.uk/government/publications/environment-bill-2020/10-march-2020-air-quality-factsheet-part-4 (accessed on 19 December 2021).
  16. World Health Organization. WHO Global Air Quality Guidelines: Particulate Matter (PM2.5 and PM10), Ozone, Nitrogen Dioxide, Sulfur Dioxide and Carbon Monoxide; World Health Organization: Geneva, Switzerland, 2021; p. 17. [Google Scholar]
  17. Osborne, S.; Uche, O.; Mitsakou, C.; Exley, K.; Dimitroulopoulou, S. Air quality around schools: Part I—A comprehensive literature review across high-income countries. Environ. Res. 2021, 196, 110817. [Google Scholar] [CrossRef] [PubMed]
  18. GLA London Atmospheric Emissions Inventory (LAEI) 2016. Available online: https://data.london.gov.uk/dataset/london-atmospheric-emissions-inventory--laei--2016 (accessed on 12 January 2022).
  19. King, K.; Healy, S. Analysing Air Pollution Exposure in London; Report to Greater London Authority; Aether Ltd.: Oxford, UK, 2013; pp. 17–20. [Google Scholar]
  20. Brook, R.; King, K. Updated Analysis of Air Pollution Exposure in London; Report to Greater London Authority; Aether Ltd.: Oxford, UK, 2017; pp. 3–32. [Google Scholar]
  21. Lucialli, P.; Marinello, S.; Pollini, E.; Scaringi, M.; Sajani, S.Z.; Marchesi, S.; Cori, L. Indoor and outdoor concentrations of benzene, toluene, ethylbenzene and xylene in some Italian schools evaluation of areas with different air pollution. Atmos. Pollut. Res. 2020, 11, 1998–2010. [Google Scholar] [CrossRef]
  22. Oliveira, M.; Slezakova, K.; Madureira, J.; de Oliveira Fernandes, E.; Delerue-Matos, C.; Morais, S.; do Carmo Pereira, M. Polycyclic aromatic hydrocarbons in primary school environments: Levels and potential risks. Sci. Total Environ. 2017, 575, 1156–1167. [Google Scholar] [CrossRef] [PubMed] [Green Version]
  23. Newcastle City Council. Newcastle Upon Tyne City Profile April 2021. Available online: https://www.newcastle.gov.uk/sites/default/files/your-council-and-democracy/2021%2004%20NFNA%20City%20Profile.pdf (accessed on 19 December 2021).
  24. Marmot, M.; Allen, J.; Boyce, T.; Goldblatt, P.; Morrison, J. Health Equity in England: The Marmot Review Ten Years on; Institute of Health Equity: London, UK, 2020; pp. 1–142. [Google Scholar]
  25. Newcastle City Council. Newcastle Pharmaceutical Needs Assessment 2018–2021. Available online: :https://newcastle.gov.uk/sites/default/files/Public%20Health/PDFs/PNA%202018-21%20FINAL%20-%2019th%20Feb%20(002).pdf (accessed on 4 August 2020).
  26. Newcastle City Council. 2021 Air Quality Annual Status Report (ASR). Available online: https://www.newcastle.gov.uk/sites/default/files/Air%20Quality%20Annual%20Status%20report%202021.pdf (accessed on 19 December 2021).
  27. UK AIR. Air Quality Management Areas (AQMAs). Available online: https://uk-air.defra.gov.uk/aqma/ (accessed on 19 December 2021).
  28. Newcastle City Council. Newcastle Schools. Available online: https://www.newcastle.gov.uk/services/schools-learning-and-childcare/about-our-schools/newcastle-schools (accessed on 1 September 2020).
  29. Urban Observatory Healthy Schools. Available online: https://schools.view.urbanobservatory.ac.uk/wdim/ (accessed on 19 December 2021).
  30. Newcastle University. The Urban Observatory: UKRIC Integrated Urban Infrastructure Labs. Available online: https://urbanobservatory.ac.uk/explore/ukcric (accessed on 14 July 2020).
  31. Newcastle University. Our Urban Observatory. Available online: https://www.ncl.ac.uk/who-we-are/vision/urban-observatory/ (accessed on 14 July 2020).
  32. James, P.; Smith, L.; Jonczyk, J.; Harris, N.; Komar, T.; Puussaar, A.; Clement, M.; Dawson, R.J. Urban Observatory Data Newcastle. Available online: https://doi.org/10.25405/data.ncl.c.5059913.v4 (accessed on 20 January 2022). [CrossRef]
  33. Environmental Instruments Ltd. AQMesh. Available online: https://www.aqmesh.com/product/aqmesh/ (accessed on 20 August 2020).
  34. Breathe London. Breathe London: Methodology. Available online: https://breathelondon.edf.org/methodology.html#:~:text=Operating%20from%20late%202018%20through,to%20visualise%20and%20present%20data (accessed on 20 August 2020).
  35. Carslaw, D.C.; Ropkins, K. Openair—An R package for air quality data analysis. Environ. Model. Softw. 2011, 27–28, 52–61. [Google Scholar] [CrossRef]
  36. Stidworthy, A.; (Cambridge Environmental Research Consultants, Cambridge, UK); Bramwell, L.; (Northumbria University, Newcastle Upon Tyne, UK). Personal Communication on Breathe London Data Flagging Values, 2020.
  37. Ricardo-aea and Department for Environment, Food & Rural Affairs. Conversion Factors Between ppb and µg m−3 and ppm and mgm−3. Available online: https://uk-air.defra.gov.uk/assets/documents/reports/cat06/0502160851_Conversion_Factors_Between_ppb_and.pdf (accessed on 24 August 2020).
  38. London Air. LAQN Monitoring Sites. Available online: https://www.londonair.org.uk/london/asp/classification.asp?region=0&site=KC1&details=general&mapview=all&la_id=&network=All&MapType=Google (accessed on 19 December 2021).
  39. UK AIR. Site Environment Types. Available online: https://uk-air.defra.gov.uk/networks/site-types (accessed on 19 December 2021).
  40. Hinds, W.C. Aerosol Technology: Properties, Behavior; and Measurement of Airborne Particles, 2nd ed.; John Wiley and Sons: New York, NY, USA, 1999. [Google Scholar]
  41. Kumar, P.; Goel, A. Concentration dynamics of coarse and fine particulate matter at and around signalised traffic intersections. Environ. Sci. Processes Impacts 2016, 18, 1220–1235. [Google Scholar] [CrossRef] [PubMed] [Green Version]
  42. Gupta, S.K.; Elumalai, S.P. Exposure to traffic-related particulate matter and deposition dose to auto rickshaw driver in Dhanbad, India. Atmos. Pollut. Res. 2019, 10, 1128–1139. [Google Scholar] [CrossRef]
  43. Martins, V.; Minguillon, M.C.; Moreno, T.; Querol, X.; de Miguel, E.; Capdevila, M.; Centelles, S.; Lazaridis, M. Deposition of aerosol particles from a subway microenvironment in the human respiratory tract. J. Aerosol Sci. 2015, 90, 103–113. [Google Scholar] [CrossRef] [Green Version]
  44. Deepthi, Y.; Shiva Nagendra, S.M.; Gummadi, S.N. Characteristics of indoor air pollution and estimation of respiratory dosage under varied fuel-type and kitchen-type in the rural areas of Telangana state in India. Sci. Total Environ. 2019, 650, 616–625. [Google Scholar] [CrossRef] [PubMed]
  45. Löndahl, J.; Möller, W.; Pagels, J.H.; Kreyling, W.G.; Swietlicki, E.; Schmid, O. Measurement techniques for respiratory tract deposition of airborne nanoparticles: A critical review. J. Aerosol Med. Pulm. Drug Deliv. 2014, 27, 229–254. [Google Scholar] [CrossRef] [PubMed] [Green Version]
  46. ICRP. Human Respiratory Tract Model for Radiological Protection. In Annals of the ICRP; ICRP Publication 66; Pergamon Press: Oxford, UK, 1994; Volume 24, p. 10. [Google Scholar]
  47. Valentin, J. Guide for the Practical Application of the ICRP Human Respiratory Tract Model. In Annals of the ICRP; Pergamon Press: Oxford, UK, 2002; Volume 32, pp. 5–12. [Google Scholar]
  48. Fleming, S.; Thompson, M.; Stevens, R.; Heneghan, C.; Plüddemann, A.; Maconochie, I.; Tarassenko, L.; Mant, D. Normal ranges of heart rate and respiratory rate in children from birth to 18 years of age: A systematic review of observational studies. Lancet 2011, 377, 1011–1018. [Google Scholar] [CrossRef] [Green Version]
  49. Osborne, S.; Uche, O.; Mitsakou, C.; Exley, K.; Dimitroulopoulou, S. Air quality around schools: Part II—Mapping PM2.5 concentrations and inequality analysis. Environ. Res. 2021, 197, 111038. [Google Scholar] [CrossRef] [PubMed]
  50. HEAL; Broekstra, N.; Luck, A.; Gordejevic, V. HEAL Report: Healthy Air, Healthier Children. Available online: https://www.env-health.org/wp-content/uploads/2019/06/HEAL-Healthy-air-children_EU.pdf (accessed on 19 December 2021).
  51. Varaden, D.; Leidland, E.; Barratt, B. The Breathe London Wearables Study: Engaging Primary School Children to Monitor Air Pollution in London. Available online: https://www.london.gov.uk/sites/default/files/the_breathe_london_wearables_study_oct19.pdf (accessed on 19 December 2021).
  52. Raysoni, A.U.; Sarnat, J.A.; Sarnat, S.E.; Garcia, J.H.; Holguin, F.; Luèvano, S.F.; Li, W.-W. Binational school-based monitoring of traffic-related air pollutants in El Paso, Texas (USA) and Ciudad Juárez, Chihuahua (México). Environ. Pollut. 2011, 159, 2476–2486. [Google Scholar] [CrossRef] [PubMed]
  53. Janssen, N.A.H.; van Vliet, P.H.N.; Aarts, F.; Harssema, H.; Brunekreef, B. Assessment of exposure to traffic related air pollution of children attending schools near motorways. Atmos. Environ. 2001, 35, 3875–3884. [Google Scholar] [CrossRef]
  54. Tofful, L.; Perrino, C. Chemical Composition of Indoor and Outdoor PM2.5 in Three Schools in the City of Rome. Atmosphere 2015, 6, 1422–1443. [Google Scholar] [CrossRef] [Green Version]
  55. Pacitto, A.; Stabile, L.; Viana, M.; Scungio, M.; Reche, C.; Querol, X.; Alastuey, A.; Rivas, I.; Álvarez-Pedrerol, M.; Sunyer, J.; et al. Particle-related exposure, dose and lung cancer risk of primary school children in two European countries. Sci. Total Environ. 2018, 616–617, 720–729. [Google Scholar] [CrossRef] [PubMed]
  56. Patel, M.M.; Chillrud, S.N.; Correa, J.C.; Feinberg, M.; Hazi, Y.; Kc, D.; Prakash, S.; Ross, J.M.; Levy, D.; Kinney, P.L. Spatial and Temporal Variations in Traffic-related Particulate Matter at New York City High Schools. Atmos. Environ. 2009, 43, 4975–4981. [Google Scholar] [CrossRef] [Green Version]
Figure 1. The city of Newcastle Upon Tyne with the location of the 2 fixed monitoring stations, the 2 AQMAs, and the 12 schools with air quality monitors mapped.
Atmosphere 13 00172 g001
Figure 2. Daily average pollutant concentrations at the Newcastle urban background site and roadside site from 1 January 2018–31 December 2019.
Atmosphere 13 00172 g002
Figure 3. Boxplot of the annual mean concentrations of (a) NO2, (b) PM10, (c) PM2.5, and (d) PM1 at individual schools based on the available data during 2018–2019.
Atmosphere 13 00172 g003aAtmosphere 13 00172 g003b
Figure 4. Boxplot of the monthly average concentrations of (a) NO2, (b) PM10, (c) PM2.5, and (d) PM1, for all schools combined, from January 2018 to December 2019.
Atmosphere 13 00172 g004aAtmosphere 13 00172 g004b
Figure 5. Diurnal variations of (a) NO2, (b) PM10, (c) PM2.5 and (d) PM1 at those schools in Newcastle that had maximum, mean and minimum annual average pollution concentrations.
Atmosphere 13 00172 g005
Figure 6. Estimated respiratory deposition doses (RDDs) of PM per hour of exposure at school environments in Newcastle.
Atmosphere 13 00172 g006
Publisher’s Note: MDPI stays neutral with regard to jurisdictional claims in published maps and institutional affiliations.

