
How Much Green Is Really “Cool”? Target Setting for Thermal Comfort Enhancement in a Warm, Humid City (Jakarta, Indonesia)


Abstract
:1. Introduction
2. Background
2.1. Urban Warming and Green Infrastructure
2.2. Quantification of GI
- Connection to surrounding soil assigned the highest value without regard to the type of vegetation cover, and the depth of soil structure rather than the vegetation highlighted;
- An inclusive calculation that accounts for both the existence of landscape elements, as well as the soil structure
2.3. Environmental Context of Jakarta, Indonesia
3. Materials and Methods
- Literature based search for green area indices;
- Develop own “New Green Factor” for cooling in Jakarta;
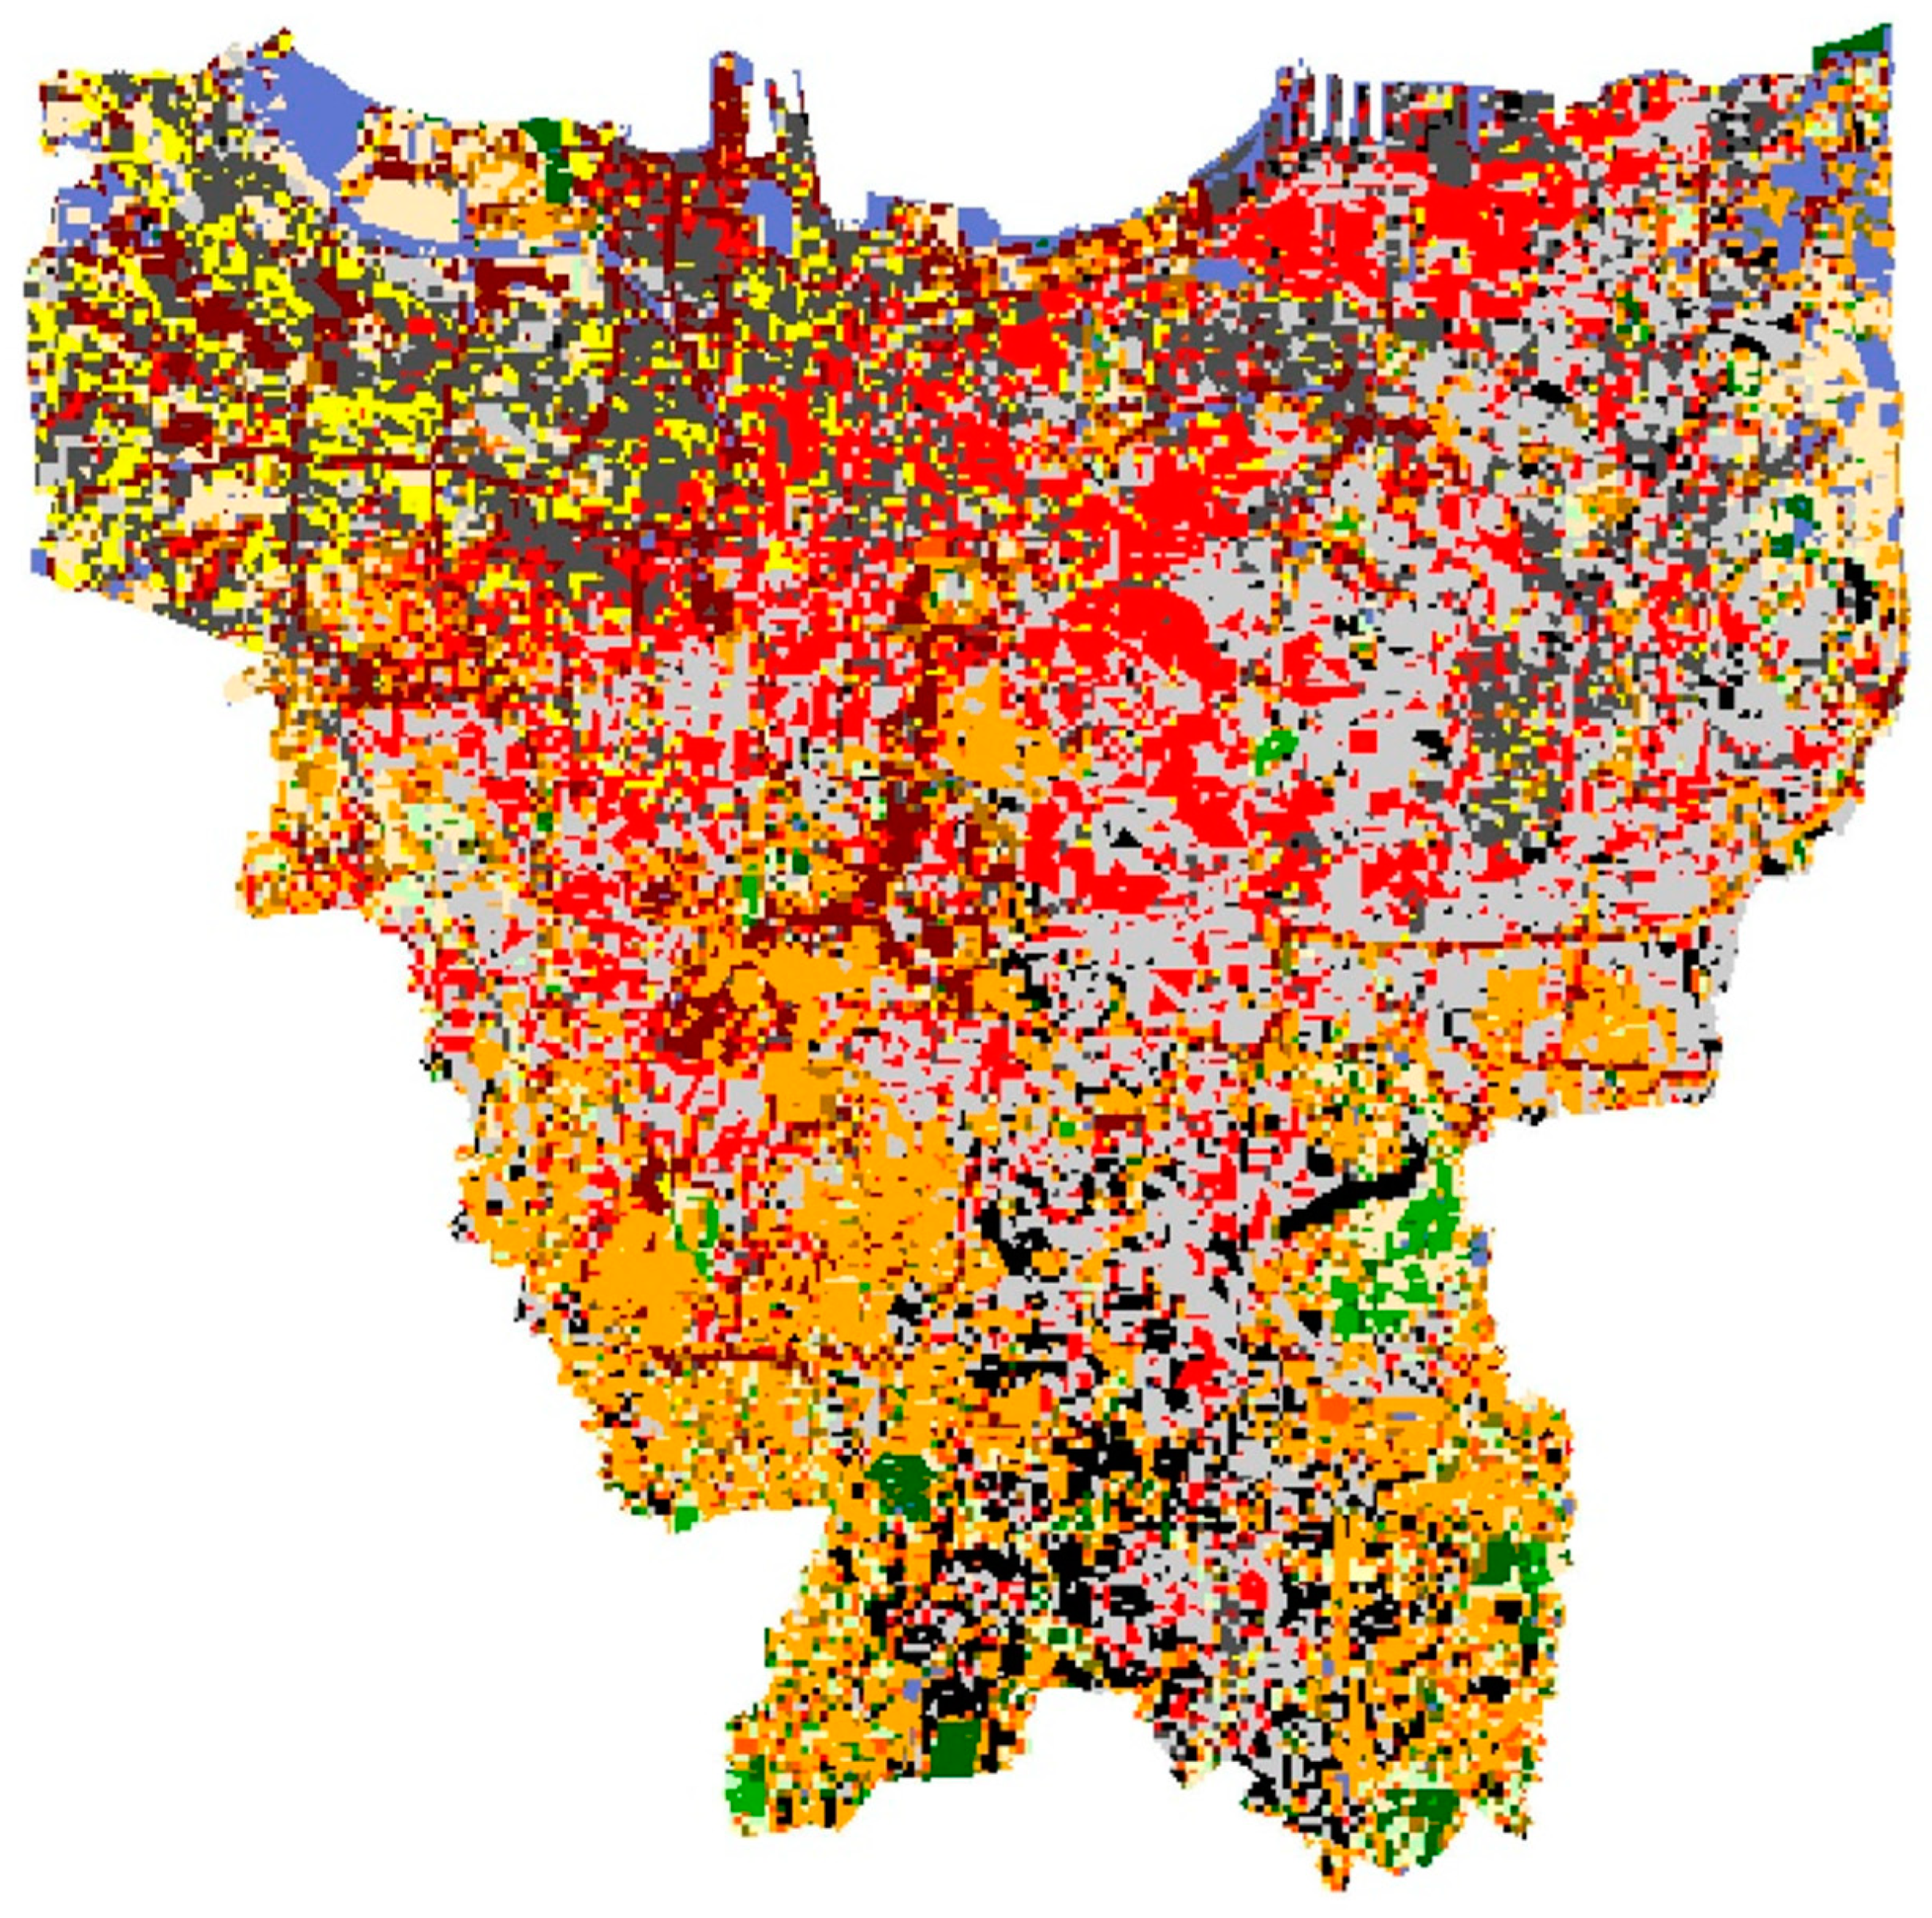
- Classify Jakarta metropolitan area into climatically similar zones (local climate zones—LCZ);
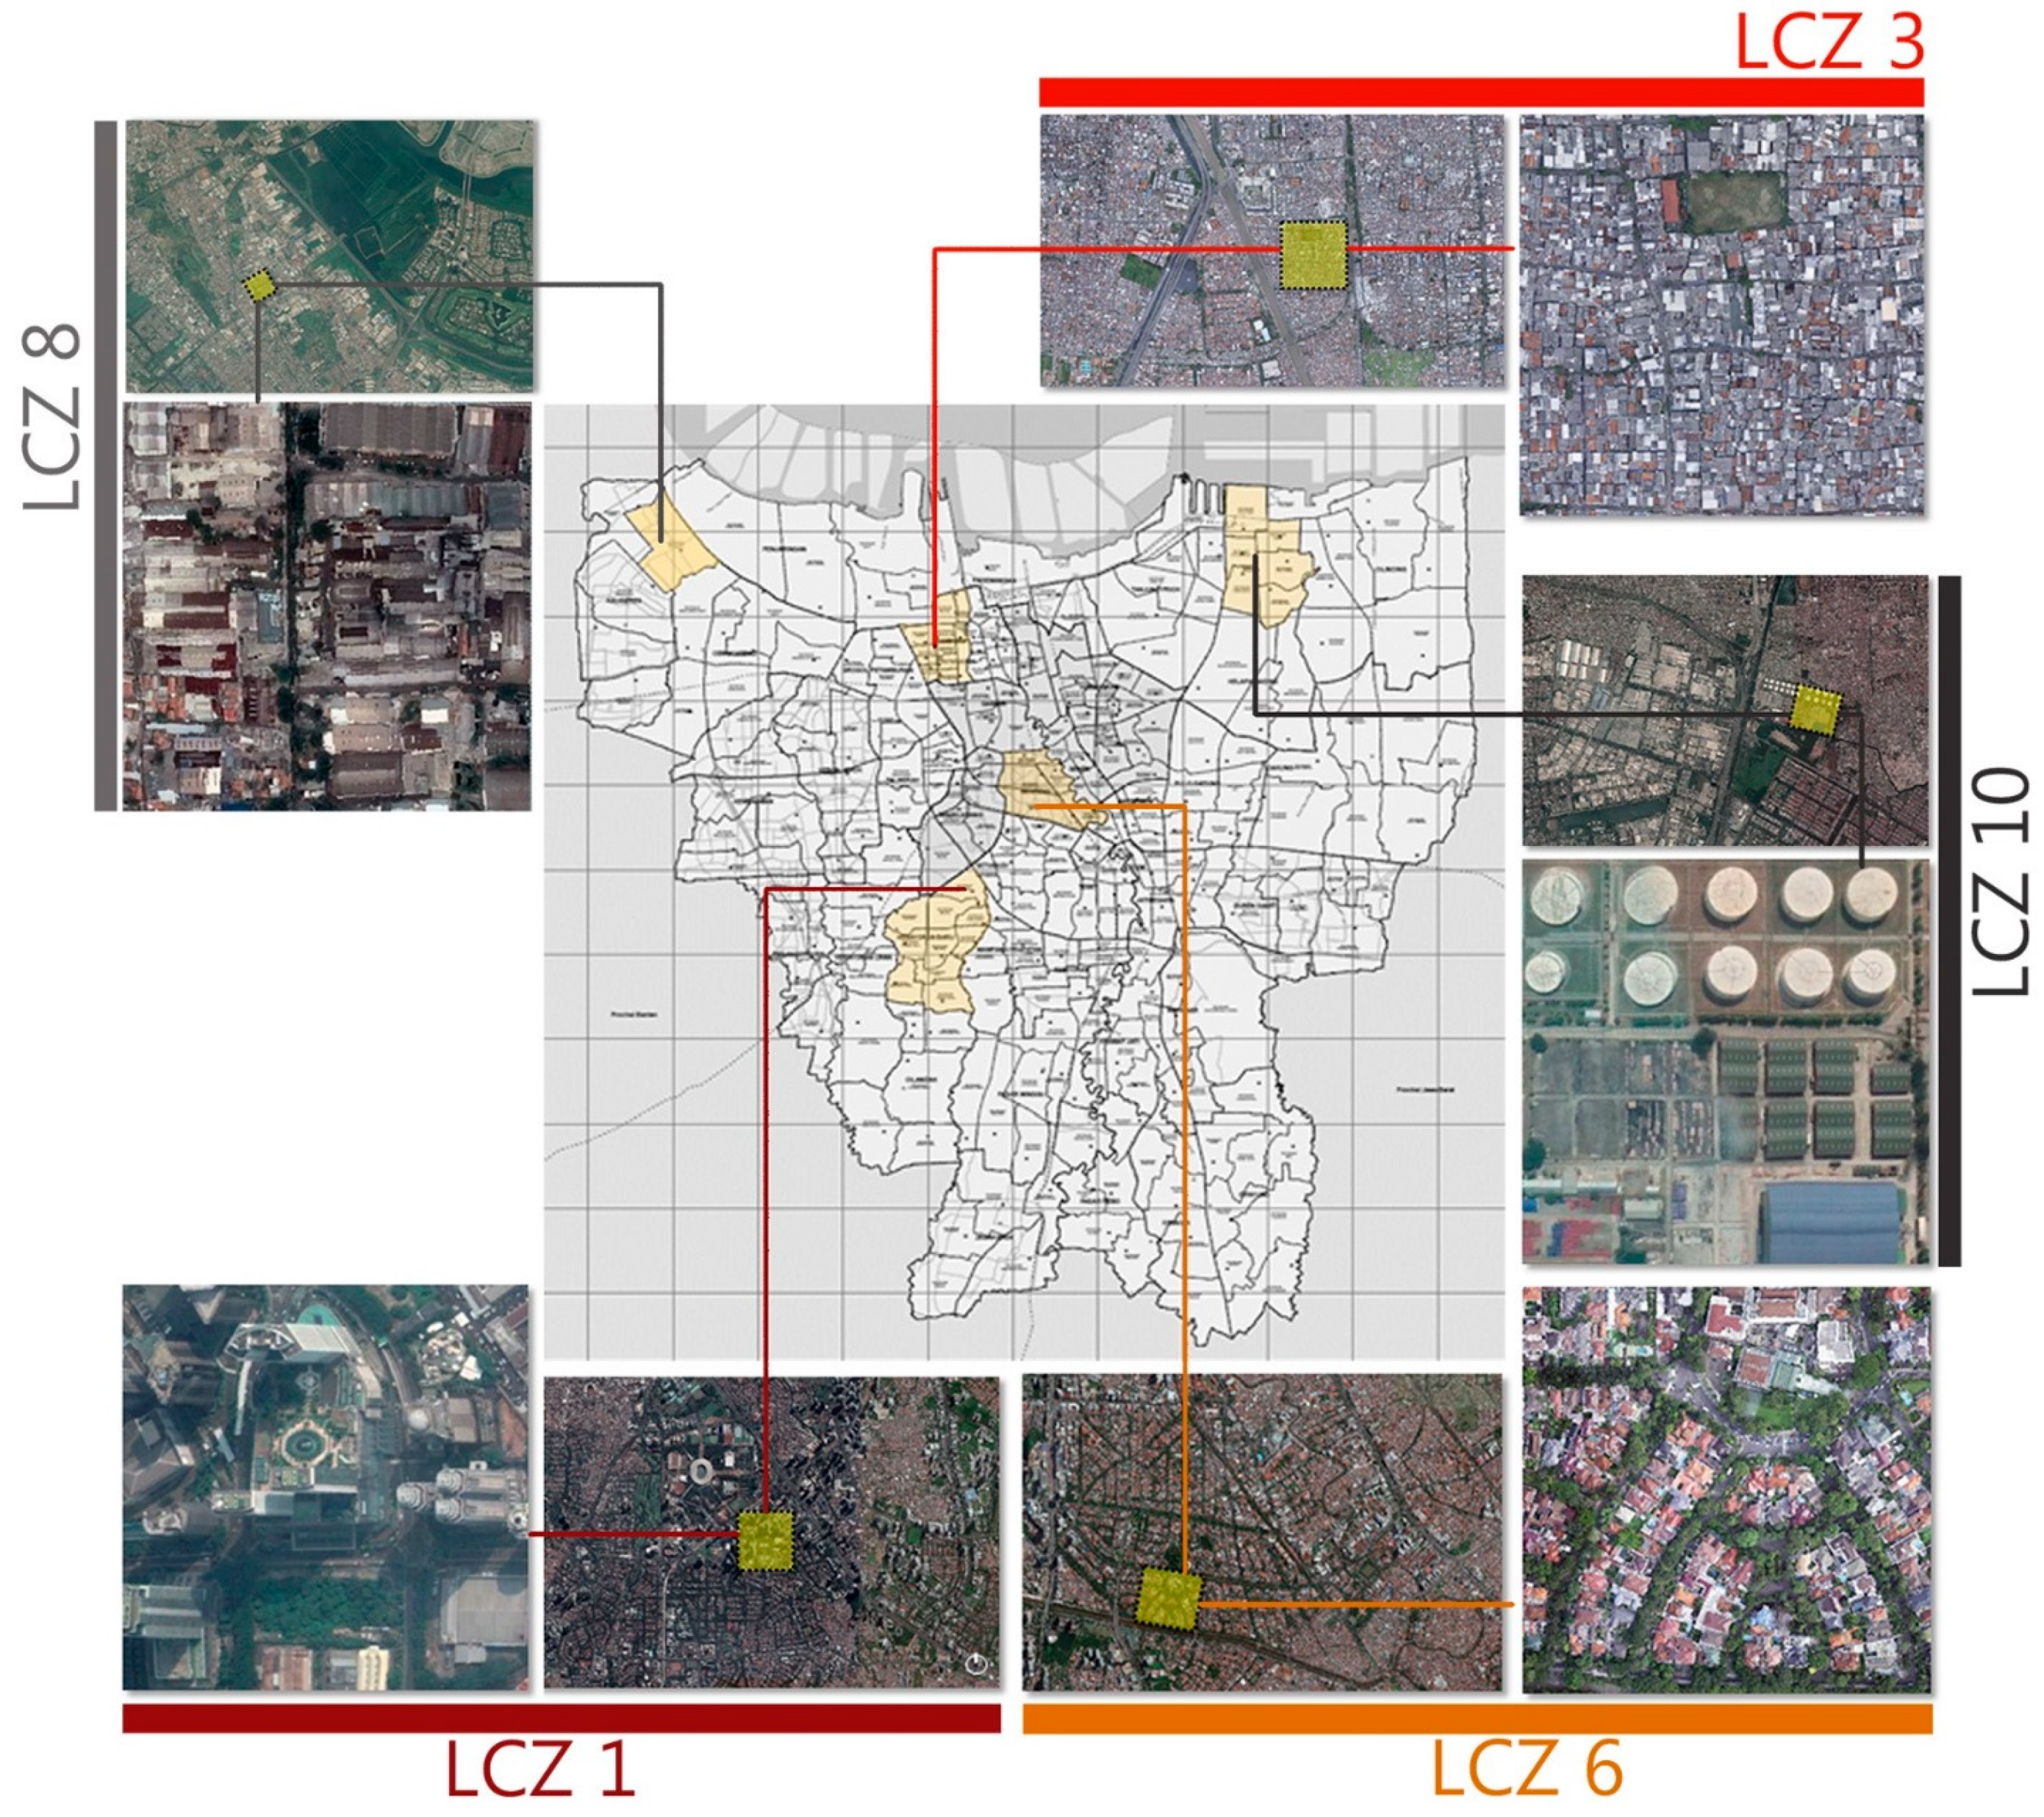
- Select representative examples representing a majority of Jakarta’s land use;
- Explore the cooling effect of GI on the basis of maximum possible green cover in these representative areas;
- Evaluate cooling potential/limitations and propose next steps.
- At least 400 m × 400 m in extent and entirely consist of the same LCZ class (to facilitate the simulations in Step 5);
- Located in the center of an LCZ patch (to minimize the “edge” effect);
- Conform to local development plans, design guidelines, limitations due to conservation area and nature of ownership to increase the possibility of GI implementation.
4. Results
5. Implications
6. Conclusions
- Given the warm, humid climate, diurnal cooling is necessary in Jakarta, but even a maximal greening approach is insufficient by itself to substantially increase outdoor comfort across the day
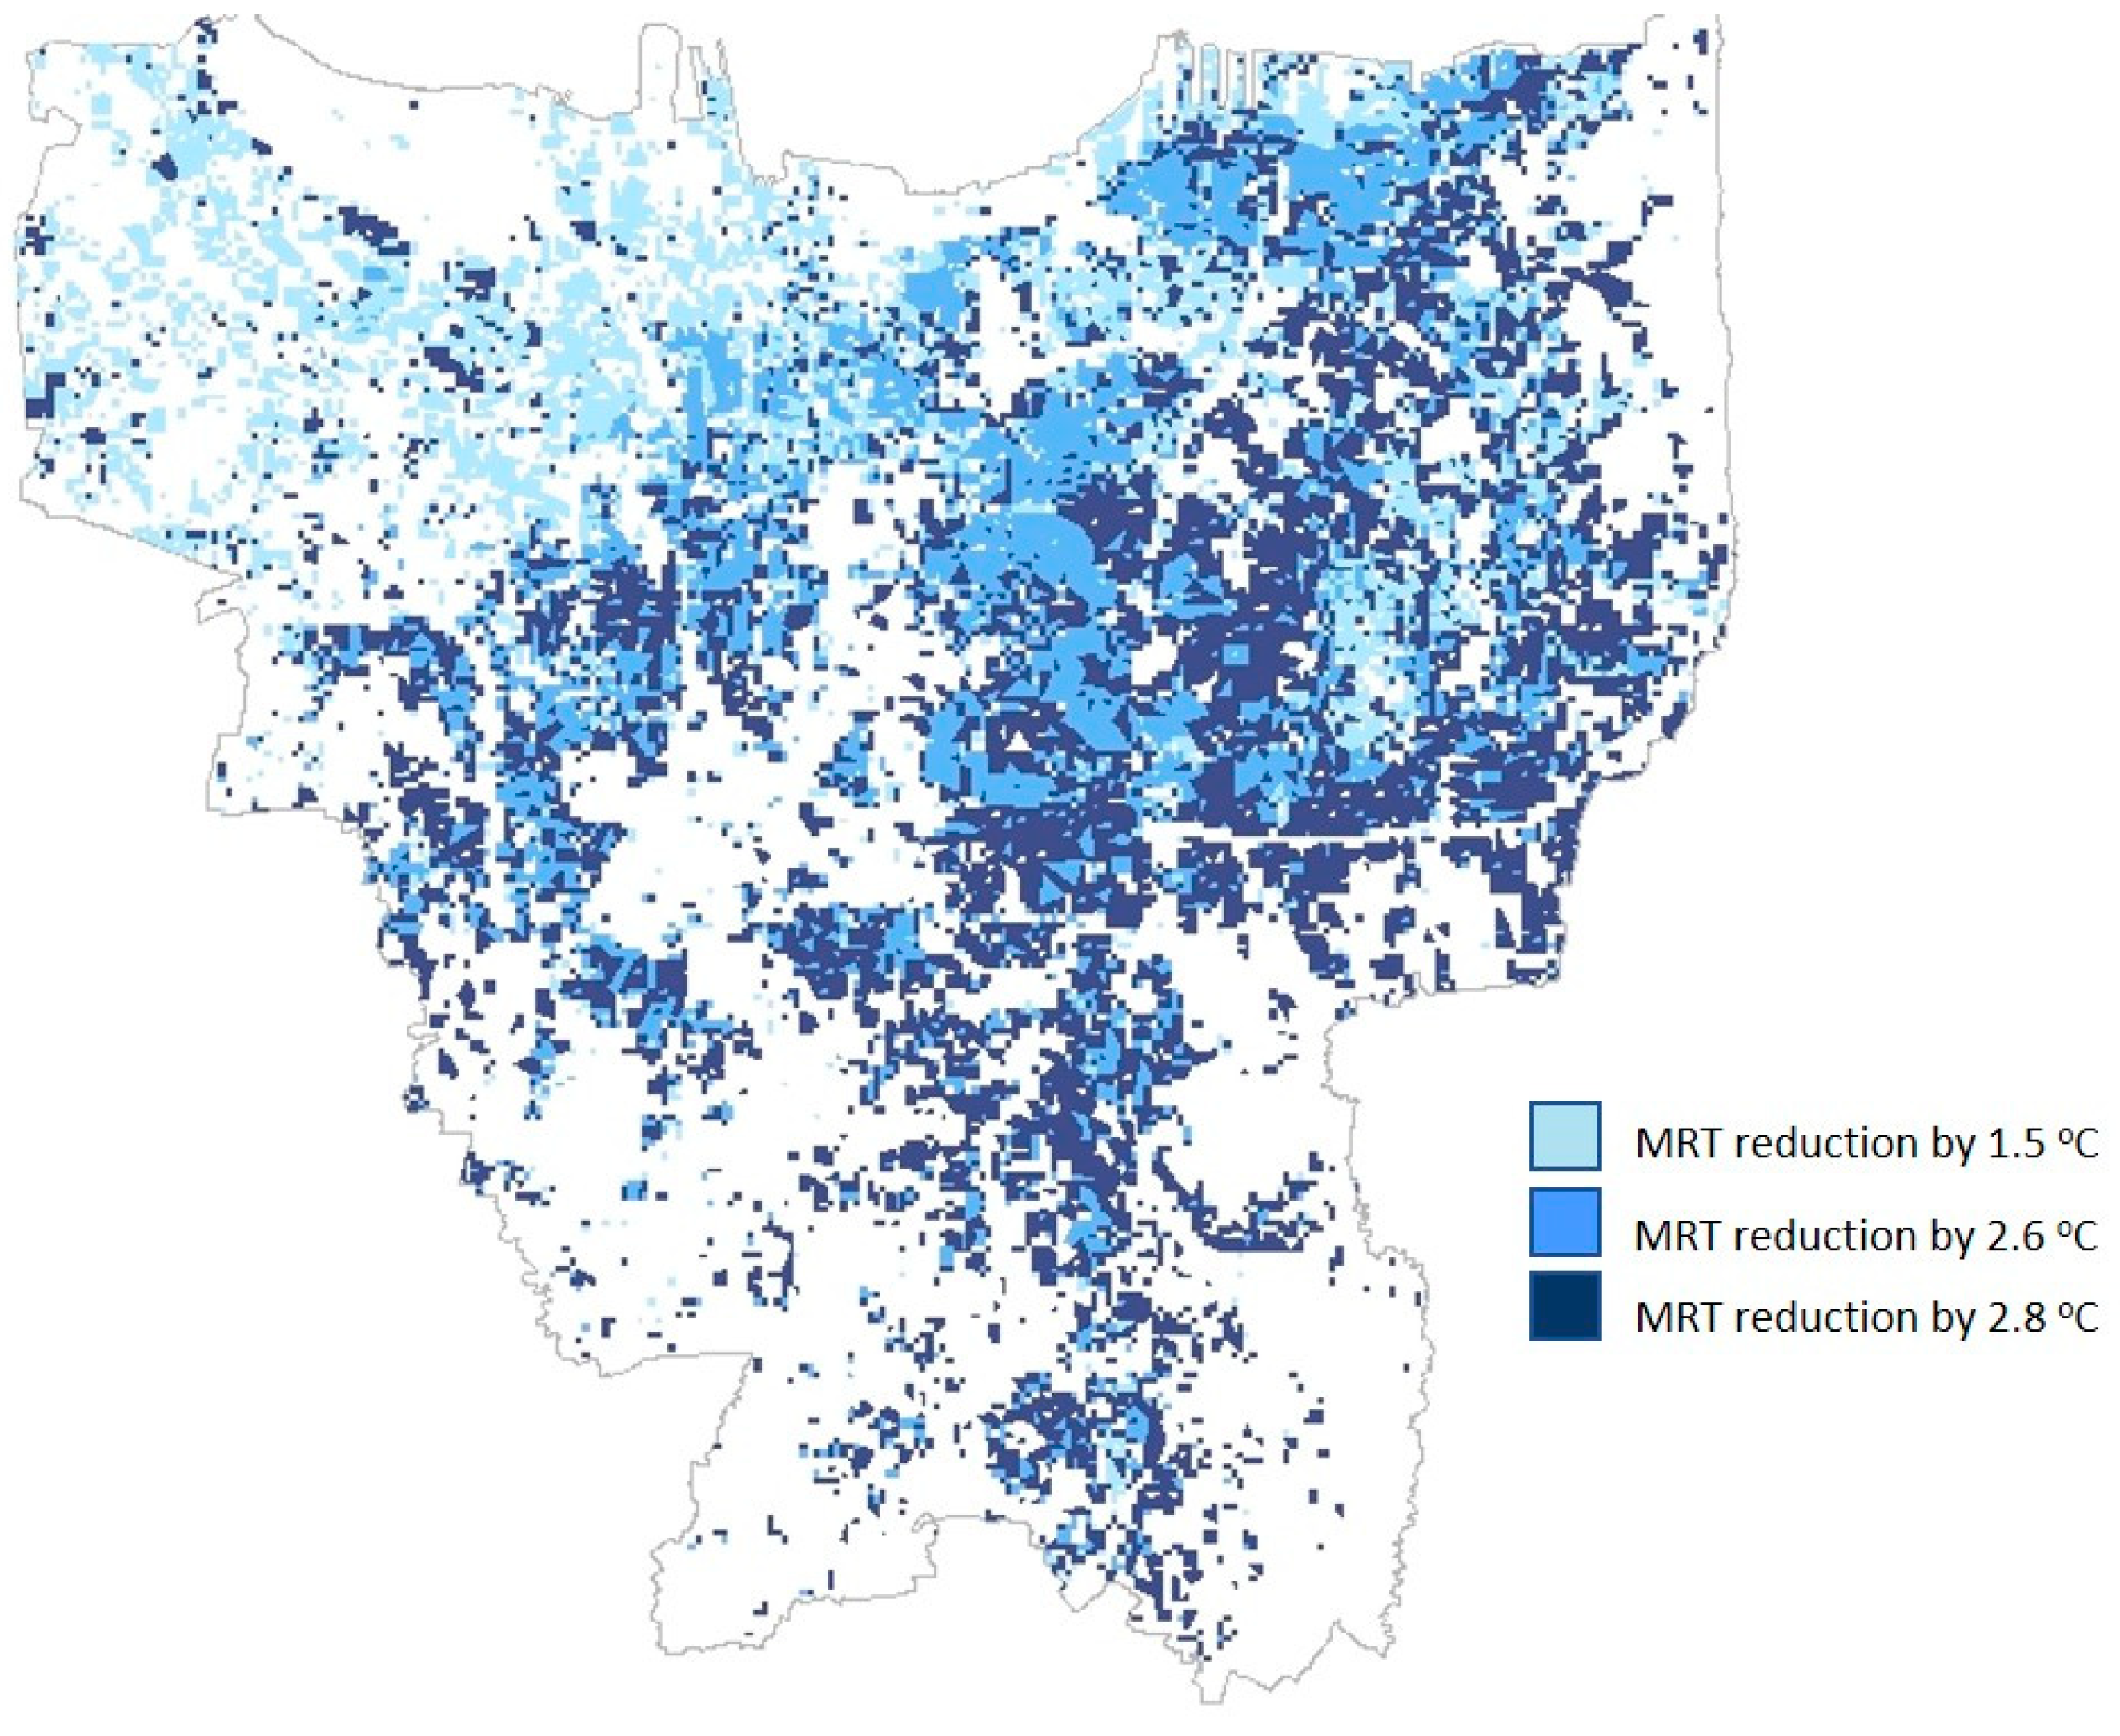
- Although the overall cooling provided by green cover is modest, there are some areas of the city that could be made comfortable by the addition of trees. These improvements need to consider local space use patterns and other urban form attributes (such as building shading) to maximize the benefits of cooler outdoor conditions.
Supplementary Materials
Author Contributions
Funding
Institutional Review Board Statement
Informed Consent Statement
Data Availability Statement
Conflicts of Interest
References
- Hajat, S.; Kosatky, T. Heat-related mortality: A review and exploration of heterogeneity. J. Epidemiol. Community Health 2010, 64, 753–760. [Google Scholar] [CrossRef] [PubMed]
- Johansson, E.; Emmanuel, R. The influence of urban design on the outdoor thermal comfort in the hot, humid city of Colombo, Sri Lanka. Int. J. Biometeorol. 2006, 51, 119–133. [Google Scholar] [CrossRef] [PubMed]
- Lu, S.-L.; Emmanuel, R.; Perera, N.; Ratnayake, R.; Grimmond, S.; Luo, Z.; Omidvar, H.; Sun, T. Reduction of overheating in Sri Lanka: An action research imperative? ARCOM 2020, 36, 243–252. [Google Scholar]
- Bowler, D.E.; Buyung-Ali, L.; Knight, T.M.; Pullin, A.S. Urban greening to cool towns and cities: A systematic review of the empirical evidence. Landsc. Urban Plan. 2010, 97, 147–155. [Google Scholar] [CrossRef]
- Adams, M.P.; Smith, P.L. A systematic approach to model the influence of the type and density of vegetation cover on urban heat using remote sensing. Landsc. Urban Plan. 2014, 132, 47–55. [Google Scholar] [CrossRef]
- Emmanuel, R. An Urban Approach to Climate Sensitive Design: Strategies for the Tropics, 1st ed.; Taylor & Francis: Abingdon, UK, 2005. [Google Scholar]
- Ong, B.L. Green plot ratio: An ecological measure for architecture and urban planning. Landsc. Urban Plan. 2003, 63, 197–211. [Google Scholar] [CrossRef]
- Wong, N.H.; Jusuf, S.K.; Syafii, N.I.; Chen, Y.; Hajadi, N.; Sathyanarayanan, H.; Manickavasagam, Y.V. Evaluation of the impact of the surrounding urban morphology on building energy consumption. Sol. Energy 2011, 85, 57–71. [Google Scholar] [CrossRef]
- Monteiro, M.V.; Doick, K.J.; Handley, P.; Peace, A. The impact of greenspace size on the extent of local nocturnal air temperature cooling in London. Urban For. Urban Green. 2016, 16, 160–169. [Google Scholar] [CrossRef]
- Maimaitiyiming, M.; Ghulam, A.; Tiyip, T.; Pla, F.; Latorre-Carmona, P.; Halik, U.; Caetano, M. Effects of green space spatial pattern on land surface temperature: Implications for sustainable urban planning and climate change adaptation. ISPRS J. Photogramm. Remote Sens. 2014, 89, 59–66. [Google Scholar] [CrossRef] [Green Version]
- Zhou, W.; Huang, G.; Cadenasso, M.L. Does spatial configuration matter? Understanding the effects of land cover pattern on land surface temperature in urban landscapes. Landsc. Urban Plan. 2011, 102, 54–63. [Google Scholar] [CrossRef]
- Nastran, M.; Kobal, M.; Eler, K. Urban heat islands in relation to green land use in European cities. Urban For. Urban Green. 2019, 37, 33–41. [Google Scholar] [CrossRef] [Green Version]
- Basnou, C. Ecosystem services provided by green infrastructure in the urban environment. CAB Rev. Perspect. Agric. Vet. Sci. Nutr. Nat. Resour. 2015, 10, 1–11. [Google Scholar] [CrossRef] [Green Version]
- Markevych, I.; Schoierer, J.; Hartig, T.; Chudnovsky, A.; Hystad, P.; Dzhambov, A.M.; de Vries, S.; Triguero-Mas, M.; Brauer, M.; Nieuwenhuijsen, M.J.; et al. Exploring pathways linking greenspace to health: Theoretical and methodological guidance. Environ. Res. 2017, 158, 301–317. [Google Scholar] [CrossRef] [PubMed]
- Nazarian, N.; Acero, J.A.; Norford, L. Outdoor thermal comfort autonomy: Performance metrics for climate-conscious urban design. Build. Environ. 2019, 155, 145–160. [Google Scholar] [CrossRef]
- Farrugia, S.; Hudson, M.D.; McCulloch, L. An evaluation of flood control and urban cooling ecosystem services delivered by urban green infrastructure. Int. J. Biodivers. Sci. Ecosyst. Serv. Manag. 2013, 9, 136–145. [Google Scholar] [CrossRef]
- Kruuse, A. GRaBS Expert Paper 6: The Green Space Factor and the Green Points System. London—The GRaBS Project. London, Town and Country Planning Association and GRaBS. 2011. Available online: https://www.tcpa.org.uk/Handlers/Download.ashx?IDMF=c6ecd8bc-a066-435f-80d6-d58e47ab39a7 (accessed on 23 January 2022).
- Vartholomaios, A.; Kalogirou, N.; Athanassiou, E.; Papadopoulou, M. The green space factor as a tool for regulating the urban microclimate in vegetation-deprived Greek cities. In Proceedings of the International Conference on “Changing Cities”: Spatial, Morphological, Formal & Socio-Economic Dimensions, Skiathos, Greece, 18–21 June 2013. [Google Scholar] [CrossRef]
- Keeley, M. The Green Area Ratio: An urban site sustainability metric. J. Environ. Plan. Manag. 2011, 54, 937–958. [Google Scholar] [CrossRef]
- Estoque, R.C.; Murayama, Y.; Myint, S.W. Effects of landscape composition and pattern on land surface temperature: An urban heat island study in the megacities of Southeast Asia. Sci. Total Environ. 2017, 577, 349–359. [Google Scholar] [CrossRef]
- Kusuma, W.L.; Chih-Da, W.; Yu-Ting, Z.; Hapsari, H.H.; Muhamad, J.L. PM2.5 Pollutant in Asia—A Comparison of Metropolis Cities in Indonesia and Taiwan. Int. J. Environ. Res. Public Health 2019, 16, 4924. [Google Scholar] [CrossRef] [Green Version]
- WHO. World Health Organisation. Urban Green Spaces and Health—A Review of Evidence. 2016. Available online: http://www.euro.who.int/__data/assets/pdf_file/0005/321971/Urban-green-spaces-and-health-review-evidence.pdf (accessed on 18 February 2020).
- Werner, C. Green Open Spaces in Indonesian Cities: Schisms between Law and Practice. Pac. Geogrphies 2014, 41, 26–31. Available online: http://www.pacific-geographies.org/wp-content/uploads/sites/2/2017/06/PG41_werner.pdf (accessed on 23 January 2022).
- Masoudi, M.; Tan, P.Y.; Liew, S.C. Multi-city comparison of the relationships between spatial pattern and cooling effect of urban green spaces in four major Asian cities. Ecol. Indic. 2019, 98, 200–213. [Google Scholar] [CrossRef]
- Geletič, J.; Lehnert, M.; Krč, P.; Resler, J.; Krayenhoff, E.S. High-Resolution Modelling of Thermal Exposure during a Hot Spell: A Case Study Using PALM-4U in Prague, Czech Republic. Atmosphere 2021, 12, 175. [Google Scholar] [CrossRef]
- Huang, P.-S.; Tsai, S.-M.; Lin, H.-C.; Tso, I.-M. Do Biotope Area Factor values reflect ecological effectiveness of urban landscapes? A case study on university campuses in central Taiwan. Landsc. Urban Plan. 2015, 143, 143–149. [Google Scholar] [CrossRef]
- Ching, J.; Mills, G.; Bechtel, B.; See, L.; Feddema, J.; Wang, X.; Ren, C.; Brousse, O.; Martilli, A.; Neophytou, M.; et al. WUDAPT: An Urban Weather, Climate, and Environmental Modeling Infrastructure for the Anthropocene. Bull. Am. Met. Soc. 2018, 99, 1907–1924. [Google Scholar] [CrossRef] [Green Version]
- Stewart, I.; Oke, T. Local climate zones for urban temperature studies. Bull. Am. Meteorological Soc. 2012, 93, 1879–1900. [Google Scholar] [CrossRef]
- Lam, C.K.C.; Lee, H.; Yang, S.-R.; Park, S. A review on the significance and perspective of the numerical simulations of outdoor thermal environment. Sustain. Cities Soc. 2021, 71, 102971. [Google Scholar] [CrossRef]
- Emmanuel, R.; Fernando, H.L.S. Urban heat islands in humid and arid climates: Role of urban form and thermal properties in Colombo, Sri Lanka and Phoenix, USA. Clim. Res. 2007, 34, 241–251. [Google Scholar] [CrossRef] [Green Version]
- Fahmy, M.; El-Hady, H.; Mahdy, M. LAI and Albedo measurements based methodology for numerical simulation of urban tree’s microclimate: A case study in Egypt. Int. J. Sci. Eng. Res. 2013, 7, 790–797. [Google Scholar]
- Gatto, E.; Buccolieri, R.; Aarrevaara, E.; Ippolito, F.; Emmanuel, R.; Perronace, L.; Santiago, J.L. Impact of Urban vegetation on outdoor thermal comfort: Comparison between a Mediterranean city (Lecce, Italy) and a northern European city (Lahti, Finland). Forests 2020, 11, 228. [Google Scholar] [CrossRef] [Green Version]
- Morakinyo, T.E.; Ouyang, W.; Lau, K.K.; Ren, C.; Ng, E. Right tree, right place (urban canyon): Tree species selection approach for optimum urban heat mitigation—Development and evaluation. Sci. Total Environ. 2020, 719, 137461. [Google Scholar] [CrossRef]
- Ouyang, W.; Morakinyo, T.E.; Ren, C.; Ng, E. The cooling efficiency of variable greenery coverage ratios in different urban densities: A study in a subtropical climate. Build. Environ. 2020, 174, 13. [Google Scholar] [CrossRef]
- Shinzato, P.; Simon, H.; Silva Duarte, D.H.; Bruse, M. Calibration process and parametrization of tropical plants using ENVI-met V4–Sao Paulo case study. Architect. Sci. Rev. 2019, 62, 112–125. [Google Scholar] [CrossRef]
- Acero, J.A.; Arrizabalaga, J. Evaluating the performance of ENVI-met model in diurnal cycles for different meteorological conditions. Theor. Appl. Climatol. 2018, 131, 455–469. [Google Scholar] [CrossRef]
- Salata, F.; Golasi, I.; de Lieto Vollaro, R.; de Lieto Vollaro, A. Urban microclimate and outdoor thermal comfort. A proper procedure to fit ENVI-met simulation outputs to experimental data. Sustain. Cities Soc. 2016, 26, 318–343. [Google Scholar] [CrossRef]
- Masoudi, M.; Tan, P.Y.; Fadaei, M. The effects of land use on spatial pattern of urban green spaces and their cooling ability. Urban Clim. 2021, 35, 100743. [Google Scholar] [CrossRef]
- Haaland, C.; van den Bosch, C.K. Challenges and strategies for urban green-space planning in cities undergoing densification: A review. Urban For. Urban Green. 2015, 14, 760–771. [Google Scholar] [CrossRef]
- Makaremi, N.; Salleh, E.; Jaafar, M.Z.; GhaffarianHoseini, A. Thermal comfort conditions of shaded outdoor spaces in hot and humid climate of Malaysia. Build. Environ. 2012, 48, 7–14. [Google Scholar] [CrossRef]
- Mazhar, M.; Brown, R.D.; Kenny, N.; Lenzholzer, S. Thermal comfort of outdoor spaces in Lahore, Pakistan: Lessons for bioclimatic urban design in the context of global climate change. Landsc. Urban Plan. 2015, 138, 110–117. [Google Scholar] [CrossRef]


| Landscape Elements | Berlin, Germany | Helsinki, Finland | Northwest England | Malmo, Sweden | Southampton, UK | London, UK | Seattle, USA | Washington, D.C. |
|---|---|---|---|---|---|---|---|---|
| Sealed areas (non-permeable surfacing without plant growth, including buildings without green roof) | 0.00 | 0.00 | 0.00 | 0.00 | 0.00 | 0.00 | 0.00 | 0.00 |
| Partially sealed areas 1, 2 (semi permeable surfacing) | 0.30 | 0.29 | 0.30 | 0.30 | 0.40 | 0.20 | 0.40 | |
| Semi-enclosed areas 1, 2 (permeable surfacing) | 0.50 | 0.40 | - | - | 0.20 | - | 0.50 | 0.50 |
| Vegetation surface not connected to surrounding soil with depth < 70 cm 1, 2 | 0.50 | - | 0.40 | 0.70 | 0.60 | 0.60 | - | 0.30 |
| Vegetation surface not connected to surrounding soil with depth > 70 cm 1, 2 | 0.70 | - | 0.60 | 0.90 | 1.00 | 0.80 | 0.60 | 0.60 |
| Vegetation surfaces connected to surrounding soil | 1.00 | - | 1.00 | 1.00 | - | 1.00 | - | - |
| Lawn, grass, other groundcover 1, 2 (plants less than 0.6 m tall) | - | 0.31 | 0.45 | 0.45 | 0.10 | 0.25 | ||
| Shrubs 1, 2 | - | 0.49 | 0.60 | 0.65 | 0.30 | 0.30 | ||
| Tree-small 1, 2 | - | 0.66 | 10.00 | 0.30 | 0.50 | |||
| Tree-medium 1, 2 | - | 0.00 | 15.00 | 0.60 | 0.60 | |||
| Tree-large 1, 2 | - | 0.80 | 20.00 | 0.90 | 0.70 | |||
| Large tree-preserved 1, 2 | - | 0.85 | 20.00 | 1.00 | 0.70 | |||
| Façade vegetation 1, 2 (Green vertical areas on external walls excluding window areas) | 0.50 | 0.26 | 0.70 | 0.60 | 0.40 | 0.80 | ||
| Roof greening 1, 2 | 0.70 | 0.47 | 0.60 | 0.65 | 0.60 | 0.60 | 0.70 | |
| Rainwater infiltration and storm-water features1, 2 | 0.20 | 0.47 | 0.20 | 0.20 | 0.20 | 0.20 | ||
| Bonus Elements 1, 3 | No | Yes | No | No | No | No | Yes | Yes |
| Parameter | Details | |
|---|---|---|
| Main parameters | Domain size | 400 m × 400 m |
| Grid size | dx = 5; dy = 5; dz = 3; (for LCZ 1, dx = 5; dy = 5; dz = 15) | |
| Start date | 15 June 2020 | |
| Start time | 18:00 | |
| Total simulation time | 30 h | |
| simple/full forcing | simple forcing | |
| Nesting grid | no nesting grid for LCZ 8, LCZ 6 and LCZ 3; (8 for LCZ 10 and 1) | |
| Climate | Wind speed measured in 10 m height (m/s) | 6 |
| Wind direction (deg) | 230 | |
| Roughness length at measurement site | 0.01 | |
| Min. Air Temperature (Tmin) | 26 °C | |
| Max. Air Temperature (Tmax) | 32 °C | |
| Min. Relative Humidity (qmin) | 71% | |
| Max. Relative Humidity (qmax) | 93% | |
| Soil condition | Initial Temperature upper layer (0–20 cm) (°C) | 29 |
| Initial Temperature middle layer (20–50 cm) (°C) | 28 | |
| Initial Temperature deep layer (50–200 cm) (°C) | 27 | |
| Initial Temperature bedrock layer (below 200 cm) (°C) | 26 | |
| Soil humidity upper layer (0–20 cm) (%) | 86 | |
| Soil humidity middle layer (20–50 cm) (%) | 78 | |
| Soil humidity deep layer (50–200 cm) (%) | 70 | |
| Soil humidity bedrock layer (below 200 cm) (%) | 65 |
| Landscape Elements | Proposed “New Green Factor” |
|---|---|
| Sealed areas (non-permeable surfacing without plant growth, including buildings without green roof) | 0.00 |
| Partially sealed areas (semi permeable surfacing) | 0.31 |
| Semi-enclosed areas (permeable surfacing) | 0.42 |
| Vegetation surface not connected to surrounding soil with depth < 70 cm | 0.52 |
| Vegetation surface not connected to surrounding soil with depth > 70 cm | 0.74 |
| Vegetation surfaces connected to surrounding soil | 1.00 |
| Lawn, grass, other groundcover (plants less than 2 feet tall) | 0.31 |
| Shrubs | 0.47 |
| Tree-small | 2.86 |
| Tree-medium | 4.05 |
| Tree-large | 5.60 |
| Large tree-preserved | 5.64 |
| Façade vegetation | 0.54 |
| Roof greening | 0.62 |
| Rainwater infiltration and storm-water features | 0.25 |
| Bonus Elements | No |
| LCZ Class | Fraction |
|---|---|
| LCZ 1—Compact high-rise | 7.46 |
| LCZ 2—Compact mid-rise | 2.43 |
| LCZ 3—Compact low-rise | 11.80 |
| LCZ 4—Open high-rise | 2.53 |
| LCZ 5—Open mid-rise | 2.24 |
| LCZ 6—Open low-rise | 15.35 |
| LCZ 7—Lightweight low-rise | 3.79 |
| LCZ 8—Large low-rise | 23.37 |
| LCZ 9—Sparsely built | 5.71 |
| LCZ 10—Heavy Industry | 11.65 |
| Non-built classes | 13.68 |
| Attributes | LCZ 1 | LCZ 3 | LCZ 6 | LCZ 8 | LCZ 10 |
|---|---|---|---|---|---|
| Location | Senayan Sub District, Kebayoran Baru District, South of Jakarta | Tambora District, West of Jakarta | Menteng District, Centre of Jakarta | Tegal Alur sub district, Kalideres, West of Jakarta | Rawabadak Selatan Sub District, Koja District, North of Jakarta |
| Sub-district area | 1.53 Km2 | 0.32 Km2 | 2.44 Km2 | 4.97 Km2 | 1.0162 Km2 |
| Population | 5969; population density: 12.03 people/Km2 | 29,728 people/KM2; population density 92.9 people/Km2 | 29,347; population density: 12.03 people/Km2 | 101,137; population density: 20.36 people/Km2 | 49,817; population density of 49,022 people/Km2 |
| Key characteristics | One of the major sub-area of the Central Business District of Jakarta | Highly dense populated, one of the most populated sub-district in South East Asia | Cultural and heritage residential conservation Area | Growing residential area with small industries, informal characteristics | Part of state-owned oil and natural gas company in Jakarta |
| Built form | Dense, several tall buildings more than ten stories; free-standing buildings closely spaced. Low sky view; steel, concrete, and glass construction. Mostly paved, few trees, high heating demand, and heavy traffic | Highly densely populated area | 1–2 stories detached residential buildings, varied construction materials, dense trees, and abundant plant cover, low space cooling demand, low traffic | 1–2 stories tall industrial buildings with large building footprint, varied construction materials, few trees, mostly paved or hard-packed. Moderate cooling demand and moderate traffic | Mid-rise industrial structure, openly spaced on hard-packed surface, with construction material dominated by steel, concrete, and metal, few trees and low traffic |
| Landscape Elements | Factor | LCZ 8 | LCZ 6 | LCZ 3 | LCZ 10 | LCZ 1 | |||||||||||||||
|---|---|---|---|---|---|---|---|---|---|---|---|---|---|---|---|---|---|---|---|---|---|
| Base Case | Best Scenario | Base Case | Best Scenario | Base Case | Best Scenario | Base Case | Best Scenario | Base Case | Best Scenario | ||||||||||||
| Sealed areas, (non-permeable surfacing without plant growth, including buildings without green roof) | 0.00 | 0.00 | 0.00 | 0.00 | 0.00 | 0.00 | 0.00 | 0.00 | 0.00 | 0.00 | |||||||||||
| Road | 0.00 | 7362.30 | 0.00 | 7362.30 | 0.00 | 22,367.83 | 0.00 | 22,367.83 | 0.00 | 8348.10 | 0.00 | 8348.10 | 0.00 | 55,458.08 | 0.00 | 55,458.08 | 0.00 | 68,693.72 | 0.00 | 68,693.72 | 0.00 |
| Buildings | 0.00 | 105,876.57 | 0.00 | 105,876.57 | 0.00 | 103,146.16 | 0.00 | 103,146.16 | 0.00 | 145,852.07 | 0.00 | 145,852.07 | 0.00 | 44,077.61 | 0.00 | 44,077.61 | 0.00 | 52,175.02 | 0.00 | 52,175.02 | 0.00 |
| Partially sealed areas (semi permeable surfacing) | 0.31 | 23,380.56 | 7300.46 | 23,380.56 | 7300.46 | 0.00 | 0.00 | 0.00 | 8348.10 | 2606.65 | 60,464.31 | 18,879.67 | 60,464.31 | 18,879.67 | 0.00 | 0.00 | |||||
| Semi-enclosed areas (permeable surfacing) | 0.42 | 23,380.56 | 9819.84 | 23,380.56 | 9819.84 | 0.00 | 0.00 | 0.00 | 0.00 | 0.00 | 0.00 | 29,356.60 | 12,329.77 | 0.00 | 0.00 | ||||||
| Vegetation surface not connected to surrounding soil with depth <70 cm | 0.52 | 0.00 | 0.00 | 0.00 | 0.00 | 0.00 | 0.00 | 0.00 | 0.00 | 0.00 | |||||||||||
| Vegetation surface not connected to surrounding soil with depth >70 cm | 0.74 | 0.00 | 0.00 | 0.00 | 0.00 | 0.00 | 0.00 | 0.00 | 0.00 | 0.00 | |||||||||||
| Vegetation surfaces connected to surrounding soil | 1.00 | 0.00 | 34,486.01 | 34,486.01 | 34,486.01 | 34,486.01 | 5799.83 | 5799.83 | 5799.83 | 5799.83 | 0.00 | 0.00 | 39,131.26 | 39,131.26 | 39,131.26 | 39,131.26 | |||||
| Lawn, grass, other groundcover (plants less than 2 feet tall) | 0.31 | 0.00 | 0.00 | 0.00 | 0.00 | 0.00 | 0.00 | 0.00 | 0.00 | 0.00 | |||||||||||
| Shrubs | 0.47 | 0.00 | 0.00 | 4757.61 | 2222.48 | 740.00 | 345.69 | 740.00 | 345.69 | 984.70 | 459.99 | 984.70 | 459.99 | 0.00 | 0.00 | ||||||
| Tree–small | 2.86 | 16.00 | 45.83 | 116.00 | 332.26 | 123.00 | 352.31 | 123.00 | 352.31 | 31.00 | 88.79 | 31.00 | 88.79 | 18.00 | 51.56 | 81.00 | 232.01 | 34.00 | 97.39 | 77.00 | 220.55 |
| Tree–medium | 4.05 | 9.00 | 36.45 | 29.00 | 117.45 | 92.00 | 372.60 | 107.00 | 433.35 | 0.00 | 83.00 | 336.15 | 4.00 | 16.20 | 58.00 | 234.90 | 13.00 | 52.65 | 62.00 | 251.10 | |
| Tree–large | 5.60 | 0.00 | 3.00 | 16.80 | 0.00 | 0.00 | 0.00 | 13.00 | 72.80 | 0.00 | 23.00 | 128.80 | 0.00 | 24.00 | 134.40 | ||||||
| Large tree–preserved | 5.64 | 0.00 | 10.00 | 56.37 | 10.00 | 56.37 | 0.00 | 0.00 | 0.00 | 0.00 | 0.00 | ||||||||||
| Façade vegetation | 0.54 | 0.00 | 0.00 | 0.00 | 8276.45 | 4492.93 | 0.00 | 0.00 | 0.00 | 0.00 | 280,227.49 | 152,123.49 | |||||||||
| Roof greening | 0.62 | 0.00 | 105,876.57 | 65,276.15 | 0.00 | 0.00 | 9678.73 | 5967.23 | 0.00 | 116,681.65 | 71,937.81 | 0.00 | 25,388.28 | 15,652.65 | 56,366.00 | 34,751.36 | |||||
| Rainwater infiltration and stormwater features | 0.25 | 0.00 | 0.00 | 0.00 | 0.00 | 0.00 | 0.00 | 0.00 | 0.00 | ||||||||||||
| TOTAL AREA | 17,202.58 | 82,862.95 | 35,267.29 | 48,010.69 | 6234.31 | 81,187.72 | 19,407.42 | 47,917.80 | 39,281.30 | 226,612.17 | |||||||||||
| 160,000 | 10.75% | 51.79% | 22.04% | 30.01% | 3.90% | 50.74% | 12.13% | 29.95% | 24.55% | 141.63% | |||||||||||
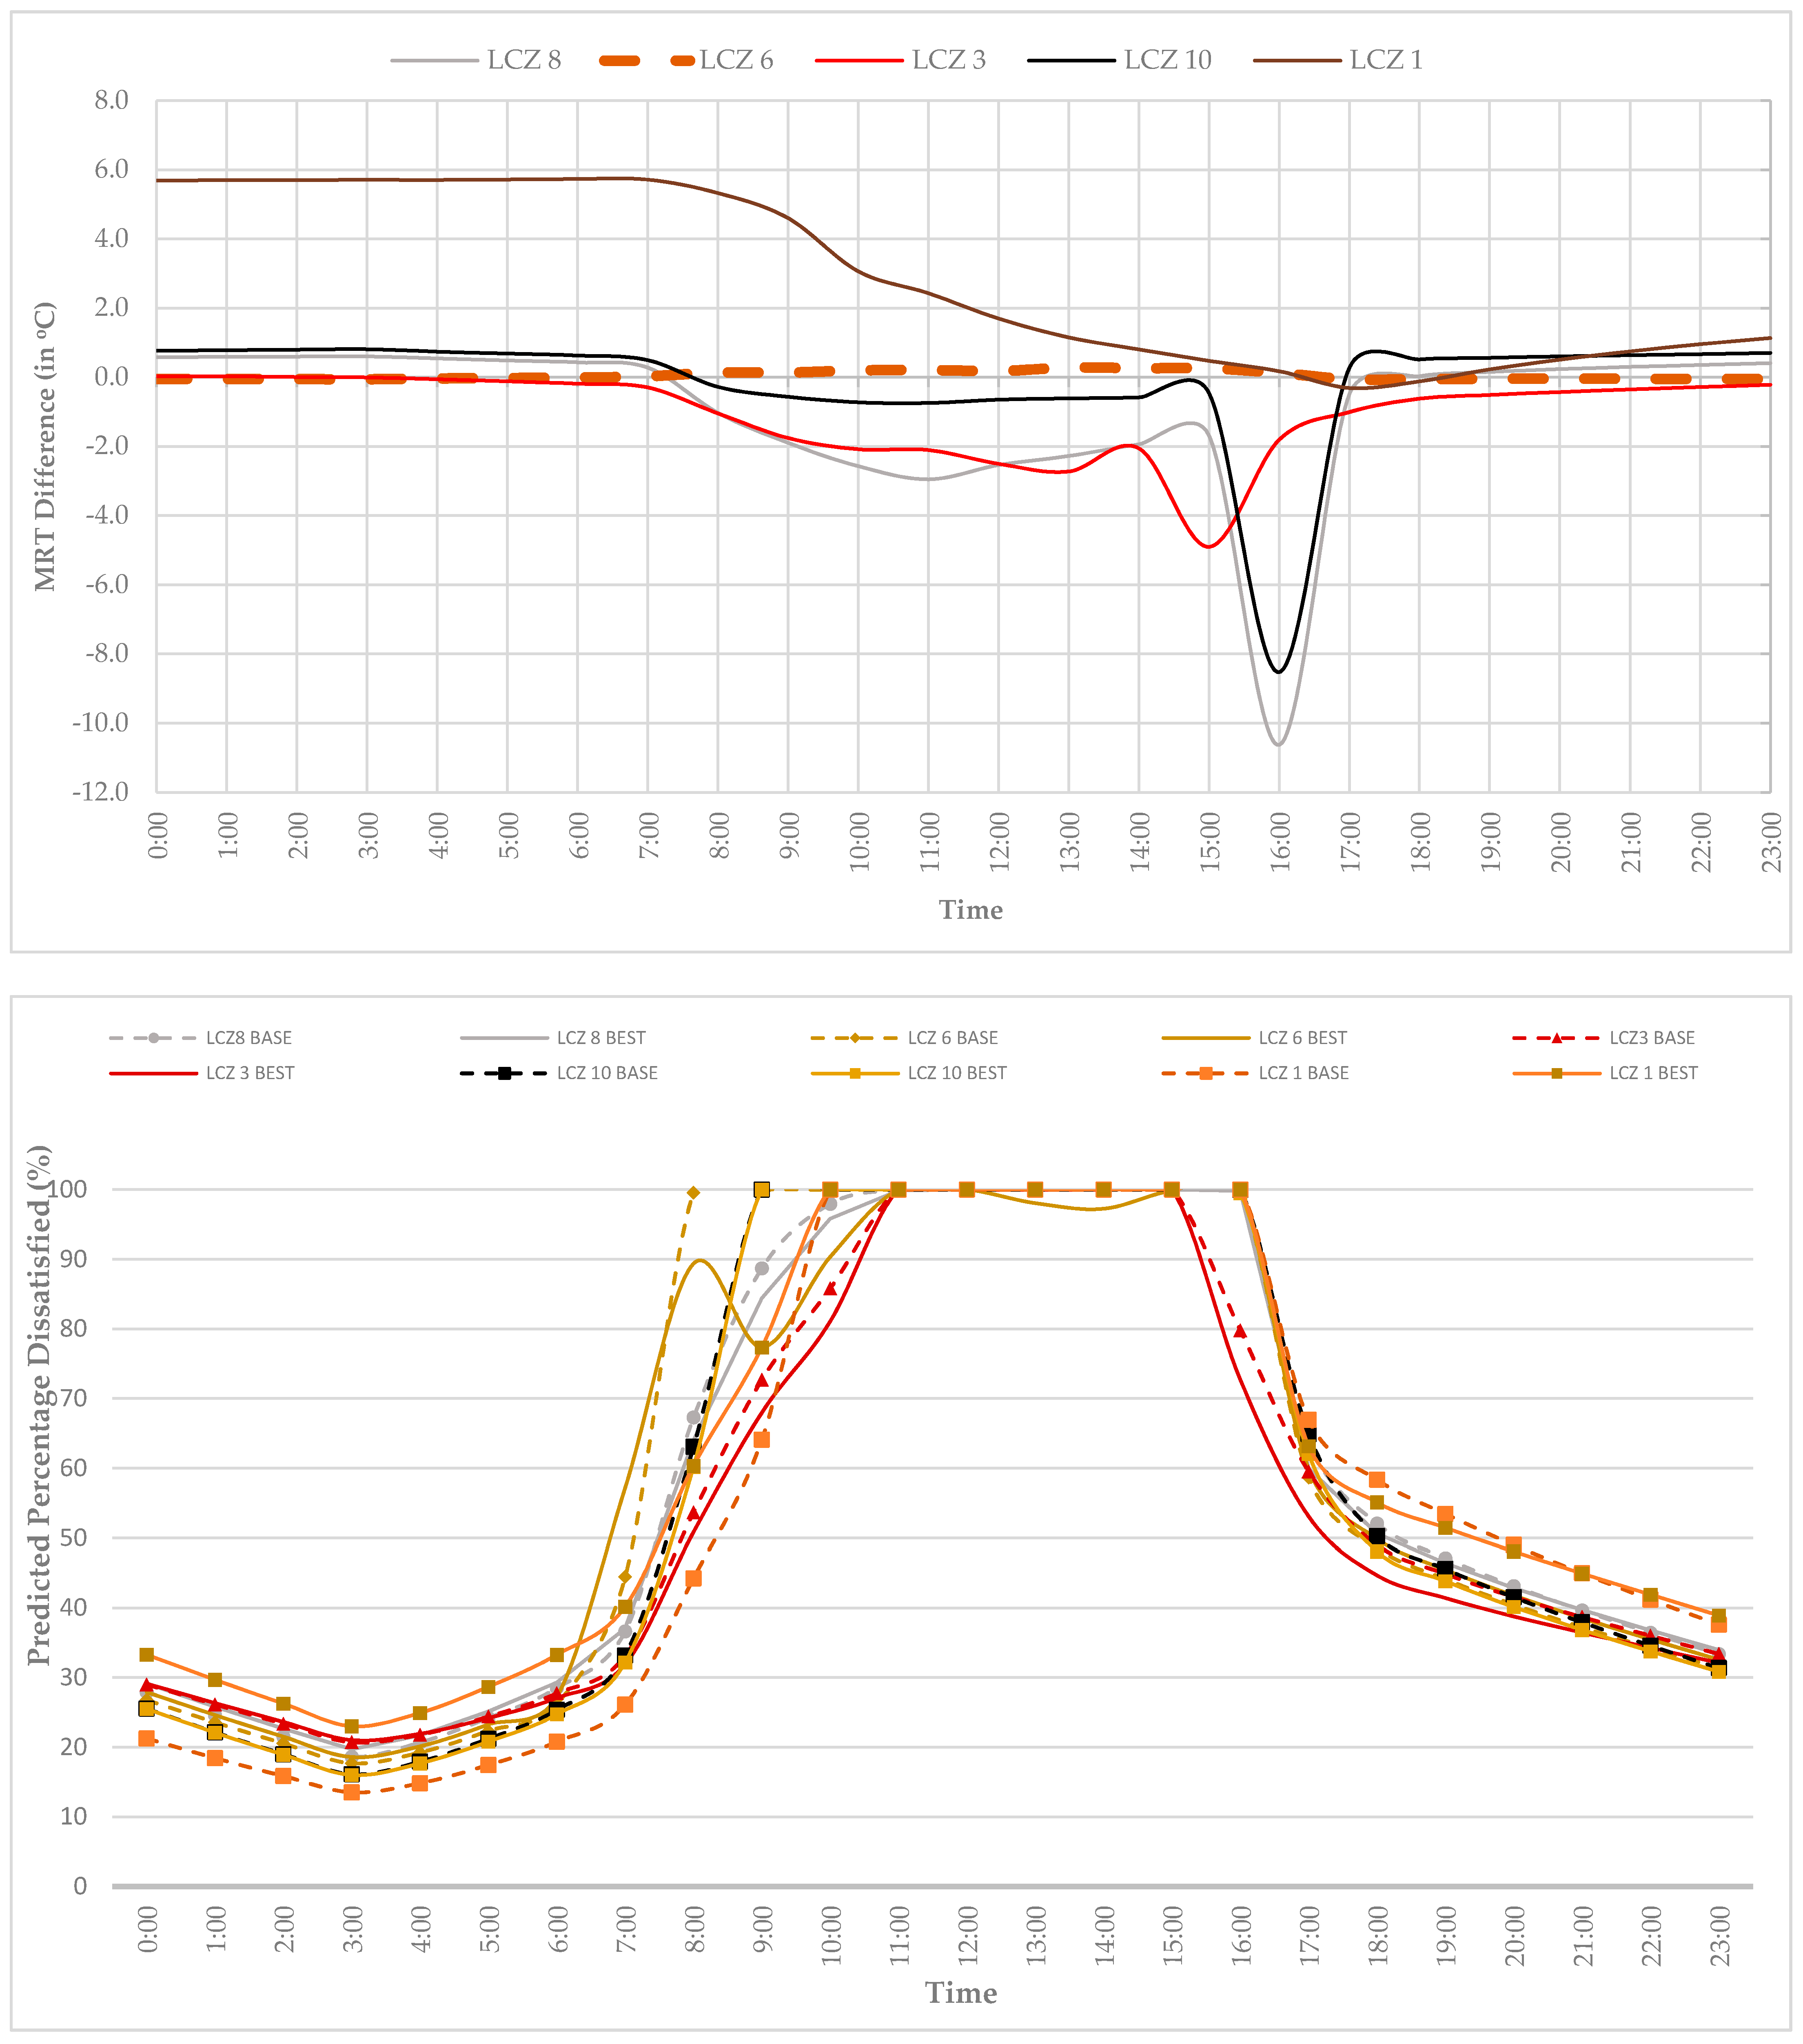
| LCZ8 | LCZ6 | LCZ3 | LCZ10 | LCZ1 | ||||||
|---|---|---|---|---|---|---|---|---|---|---|
| Base | Best | Base | Best | Base | Best | Base | Best | Base | Best | |
| MRTmin (°C) | 43.95 | 41.1 | 40.32 | 40.75 | 35.72 | 32.86 | 46.87 | 45.18 | 36.81 | 36.65 |
| MRTmax (°C) | 71.5 | 68.8 | 68.7 | 69.1 | 64.19 | 61.86 | 75.16 | 73.86 | 65.35 | 66.64 |
| “Best” Possible Green Area | Max MRT Reduction | % of Total Land Area of Jakarta | |
|---|---|---|---|
| LCZ 8 | 52% | 2.8 | 23.37% |
| LCZ 3 | 51% | 2.6 | 11.80% |
| LCZ 10 | 30% | 1.5 | 11.65% |
Publisher’s Note: MDPI stays neutral with regard to jurisdictional claims in published maps and institutional affiliations. |
© 2022 by the authors. Licensee MDPI, Basel, Switzerland. This article is an open access article distributed under the terms and conditions of the Creative Commons Attribution (CC BY) license (https://creativecommons.org/licenses/by/4.0/).
Share and Cite
Stepani, H.M.N.; Emmanuel, R. How Much Green Is Really “Cool”? Target Setting for Thermal Comfort Enhancement in a Warm, Humid City (Jakarta, Indonesia). Atmosphere 2022, 13, 184. https://doi.org/10.3390/atmos13020184
Stepani HMN, Emmanuel R. How Much Green Is Really “Cool”? Target Setting for Thermal Comfort Enhancement in a Warm, Humid City (Jakarta, Indonesia). Atmosphere. 2022; 13(2):184. https://doi.org/10.3390/atmos13020184
Chicago/Turabian StyleStepani, Hanna Meiria Naomi, and Rohinton Emmanuel. 2022. "How Much Green Is Really “Cool”? Target Setting for Thermal Comfort Enhancement in a Warm, Humid City (Jakarta, Indonesia)" Atmosphere 13, no. 2: 184. https://doi.org/10.3390/atmos13020184