
A Step to Develop Heat-Health Action Plan: Assessing Heat Waves’ Impacts on Mortality

Abstract
:1. Introduction
2. Materials and Methods
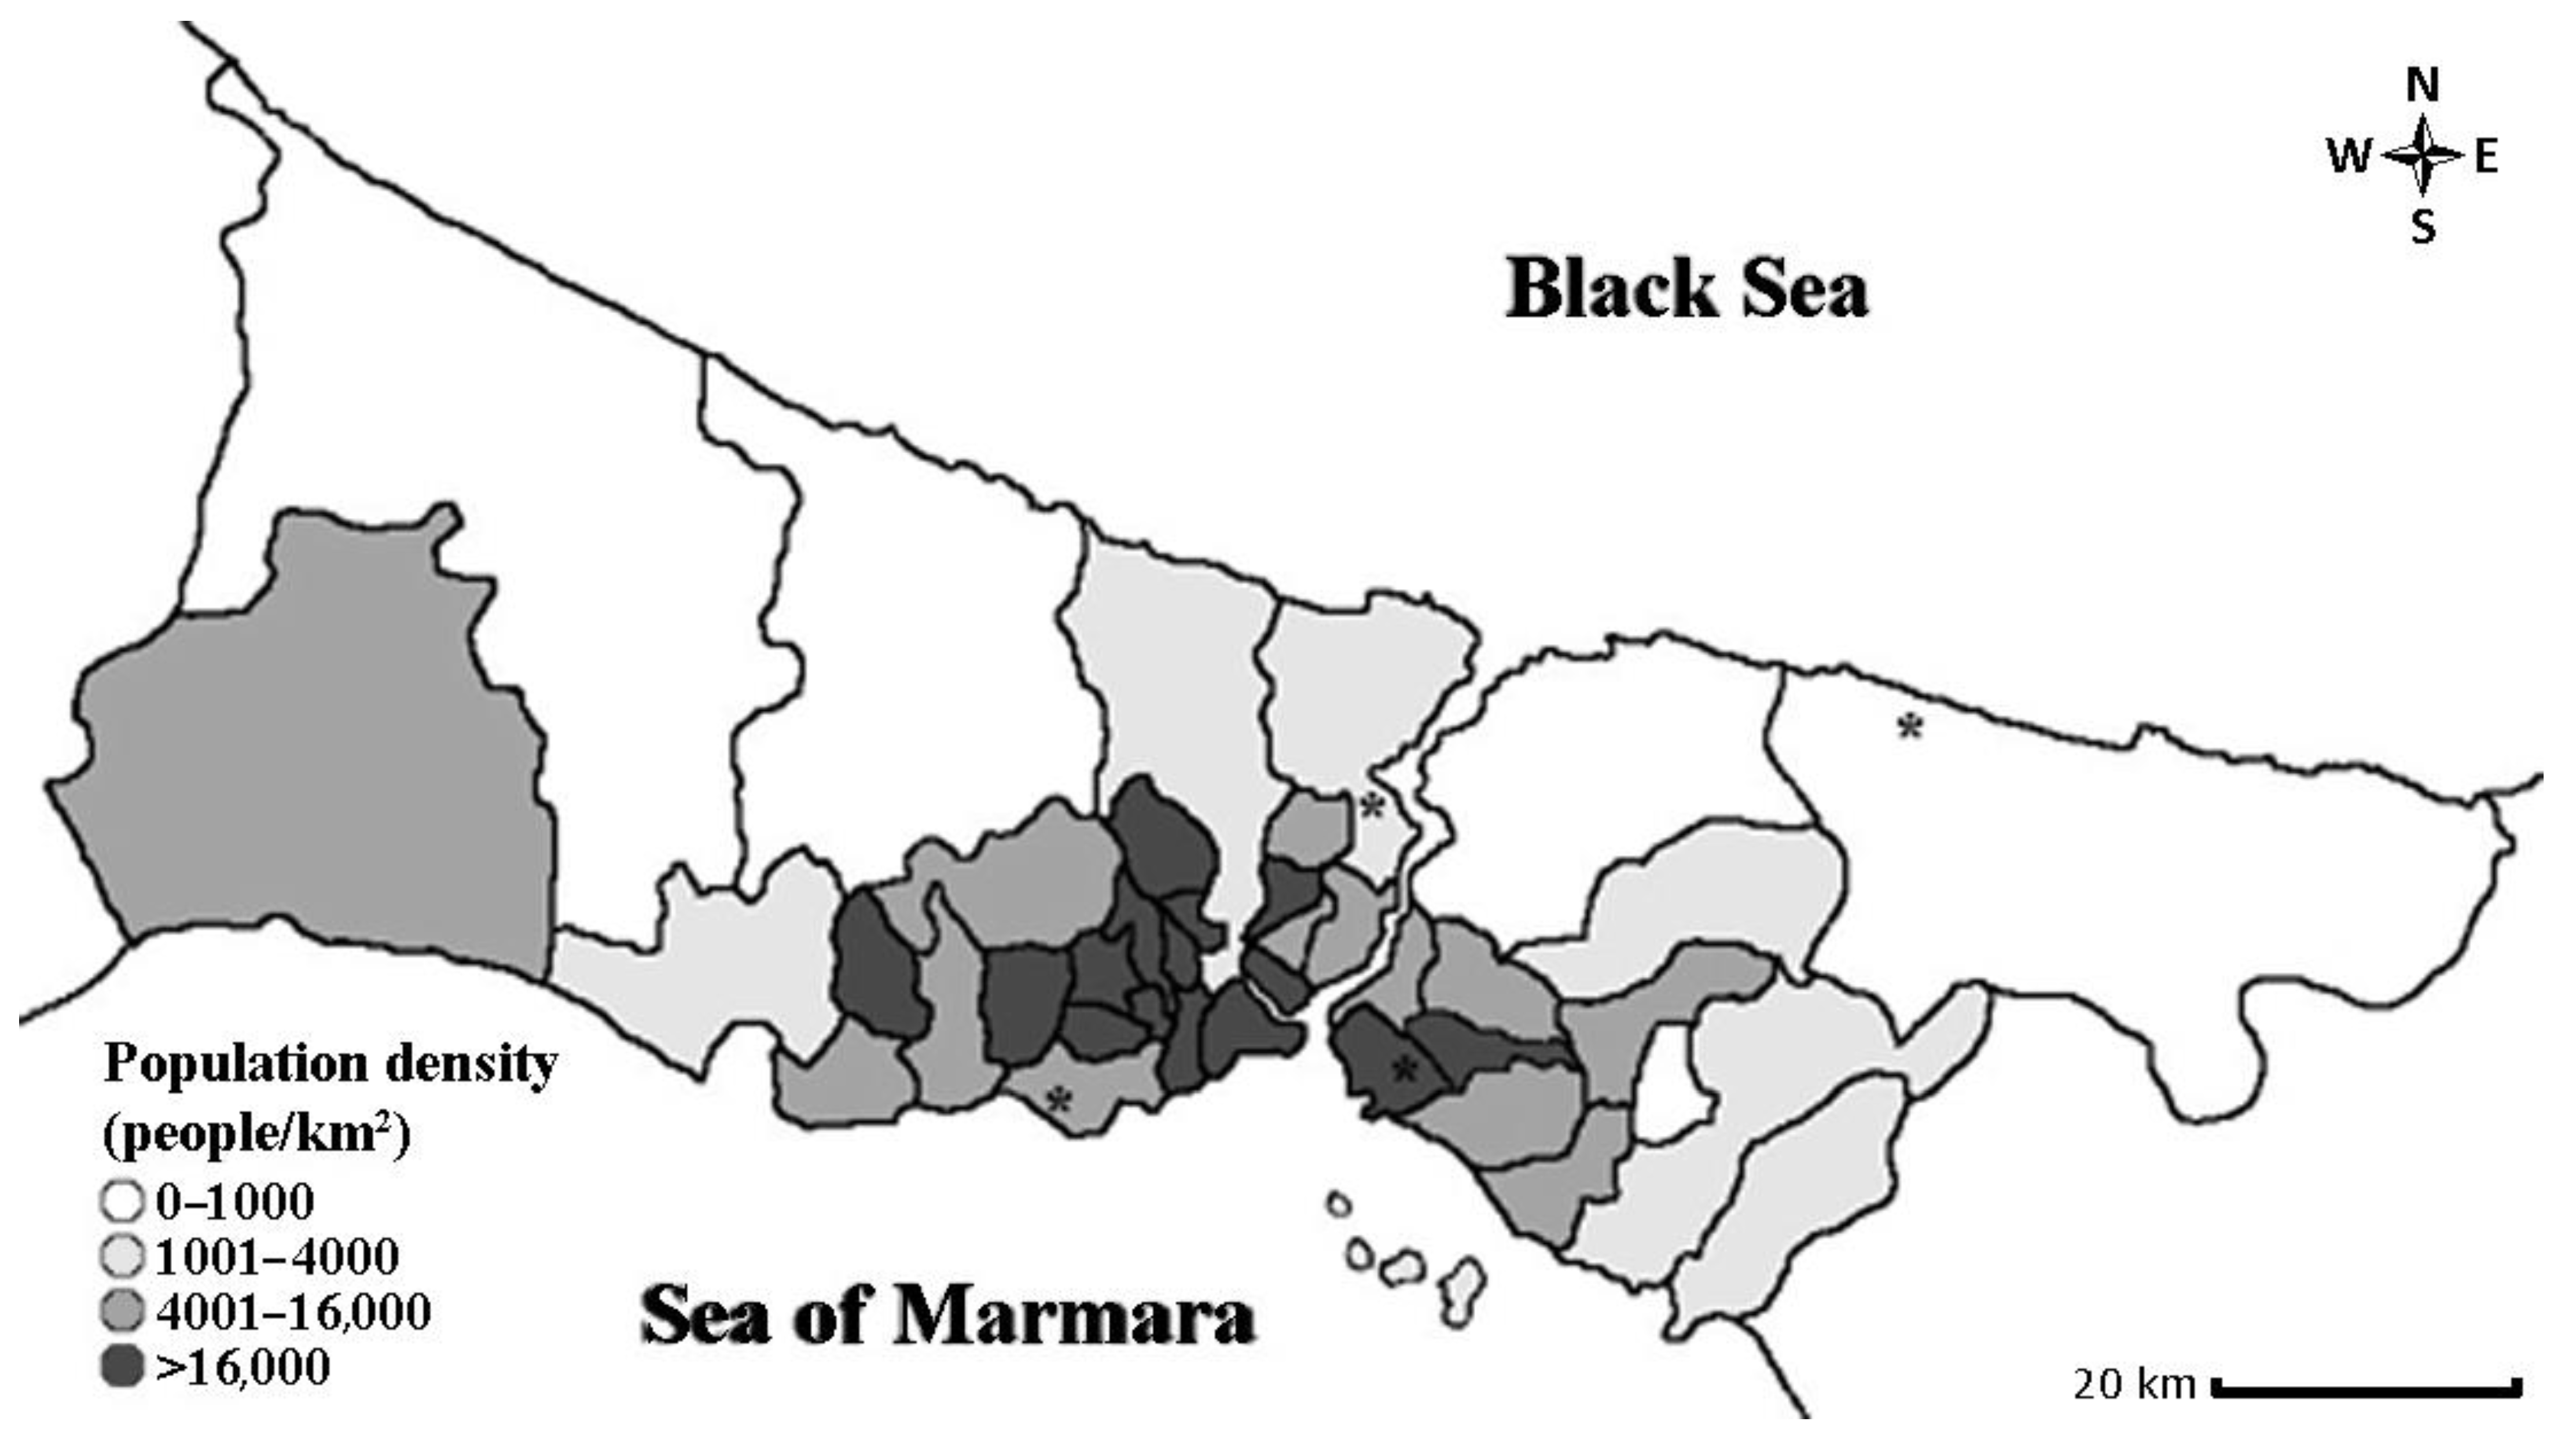
2.1. Study Area
2.2. Meteorological Data
2.3. Mortality Data and Ethics Approval
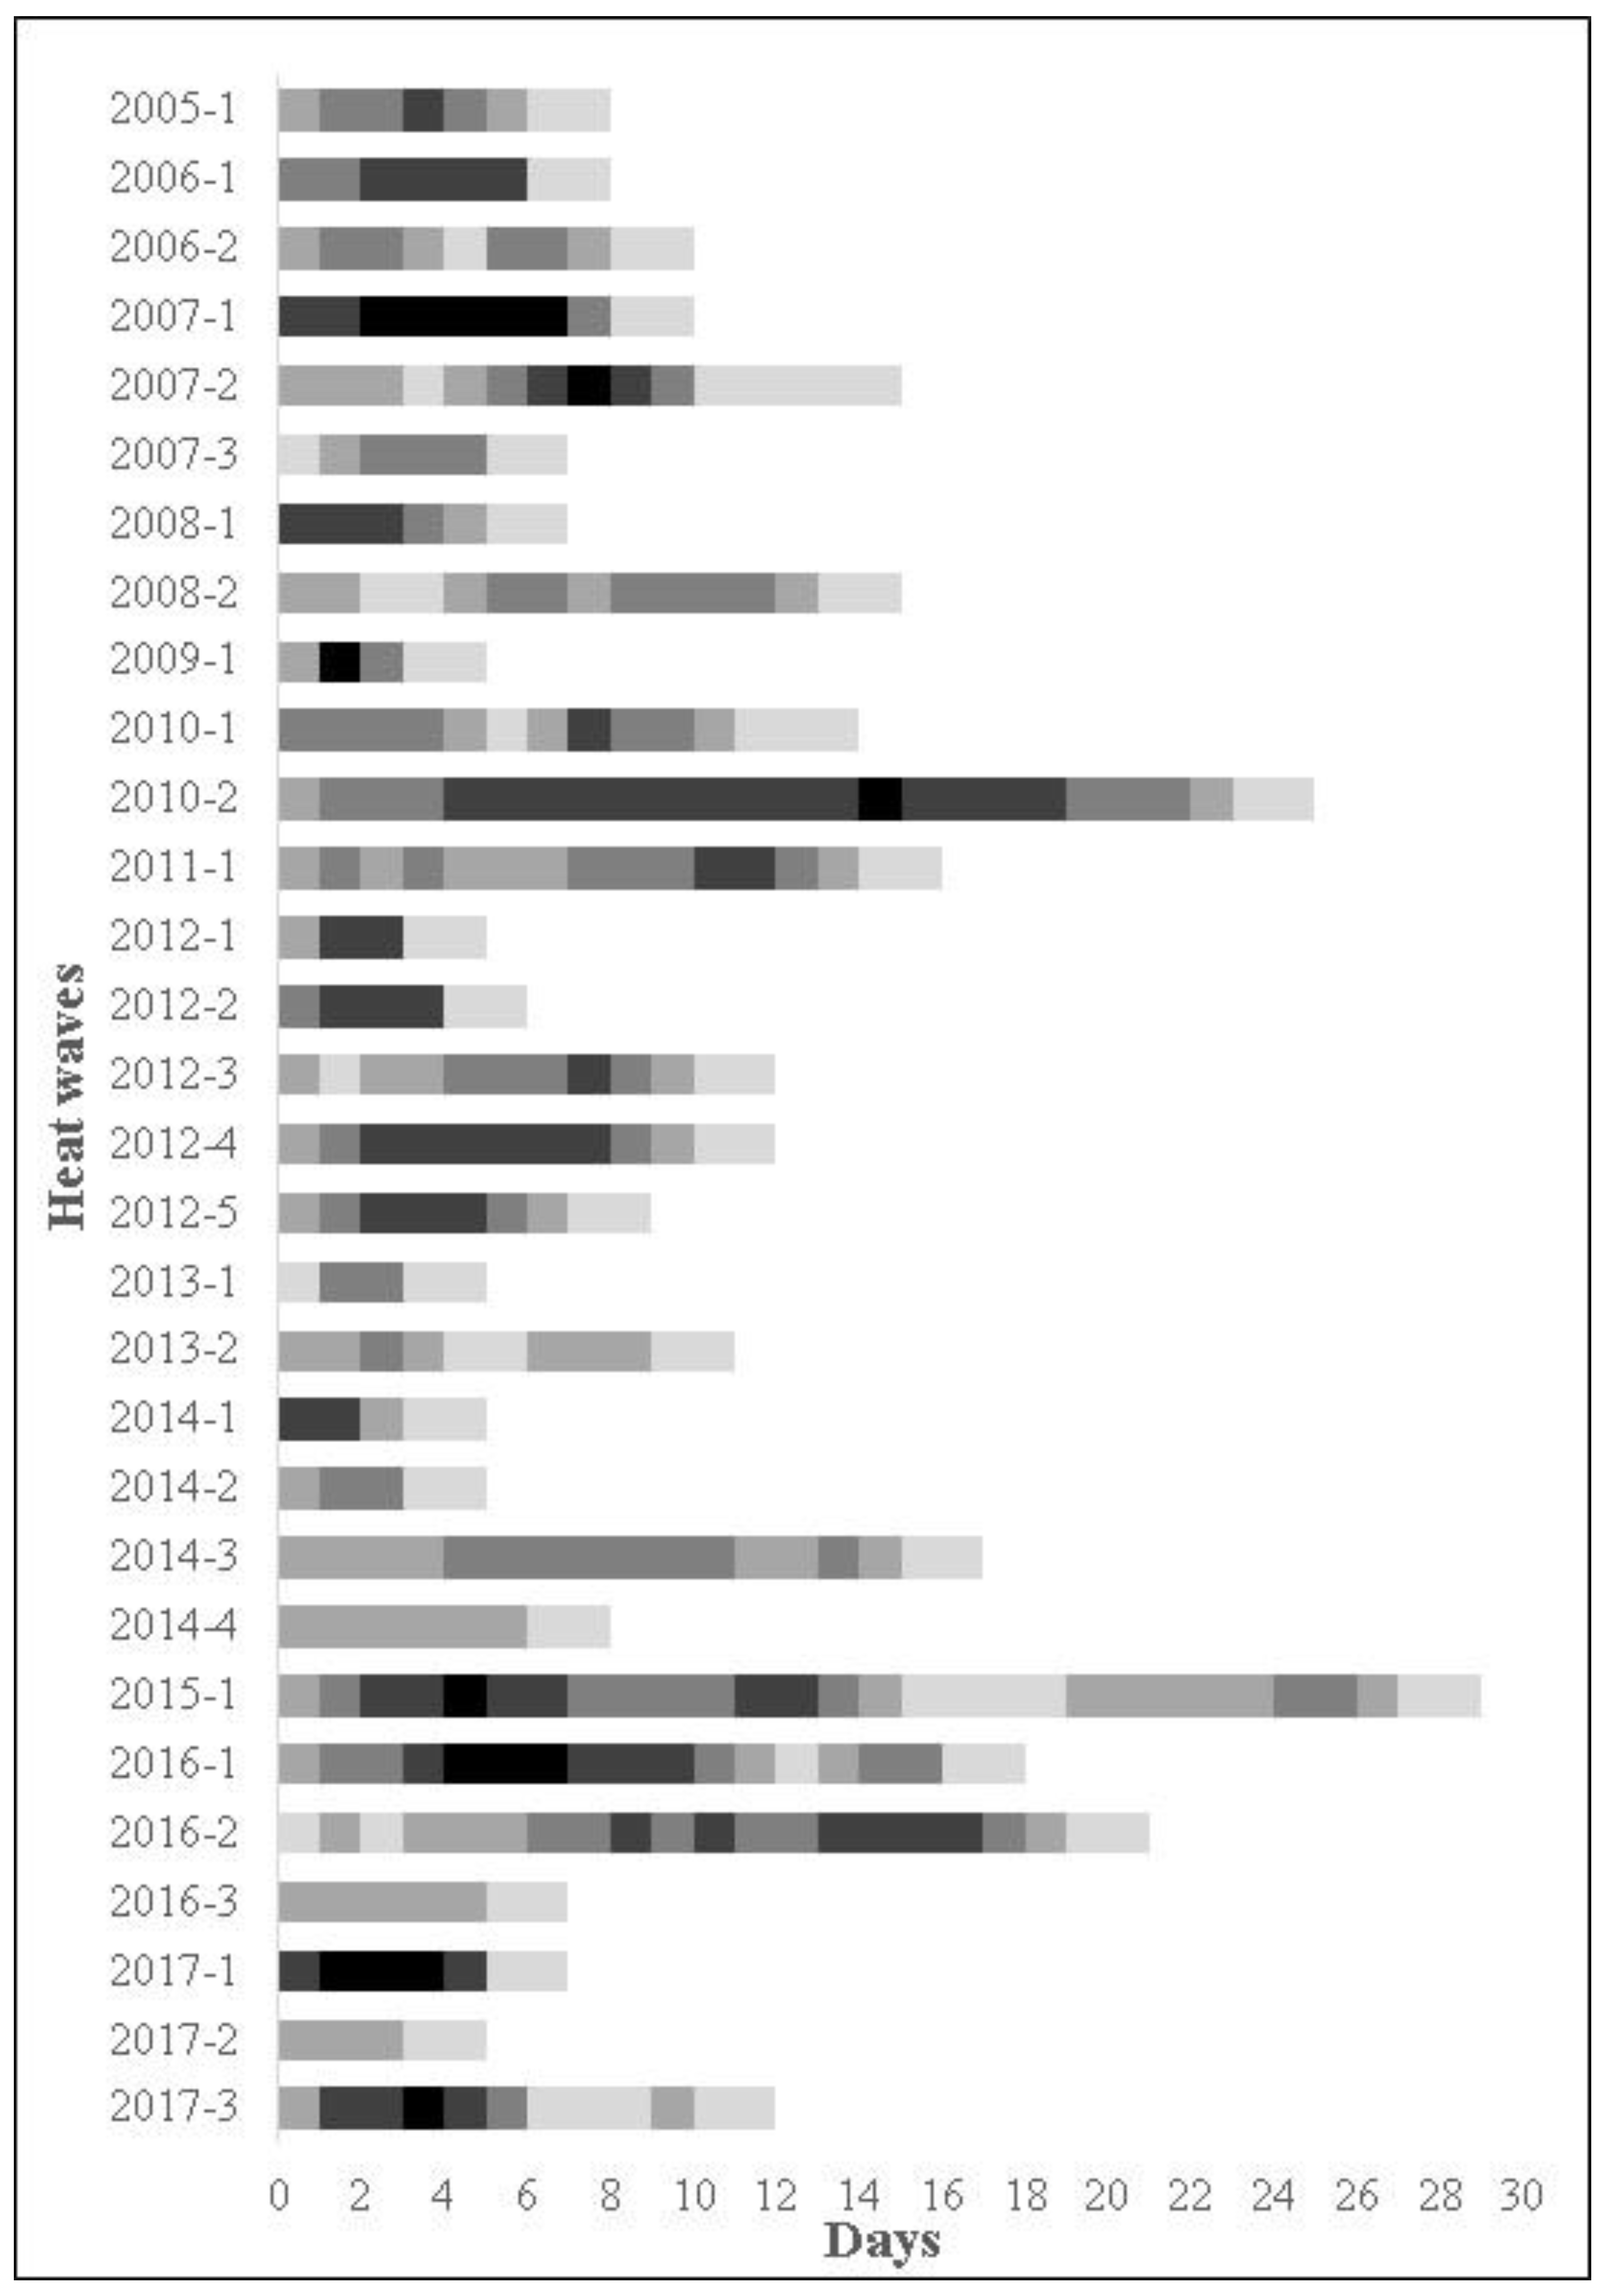
2.4. Definition of Heat Wave and Reference Period
2.5. Statistical Analysis
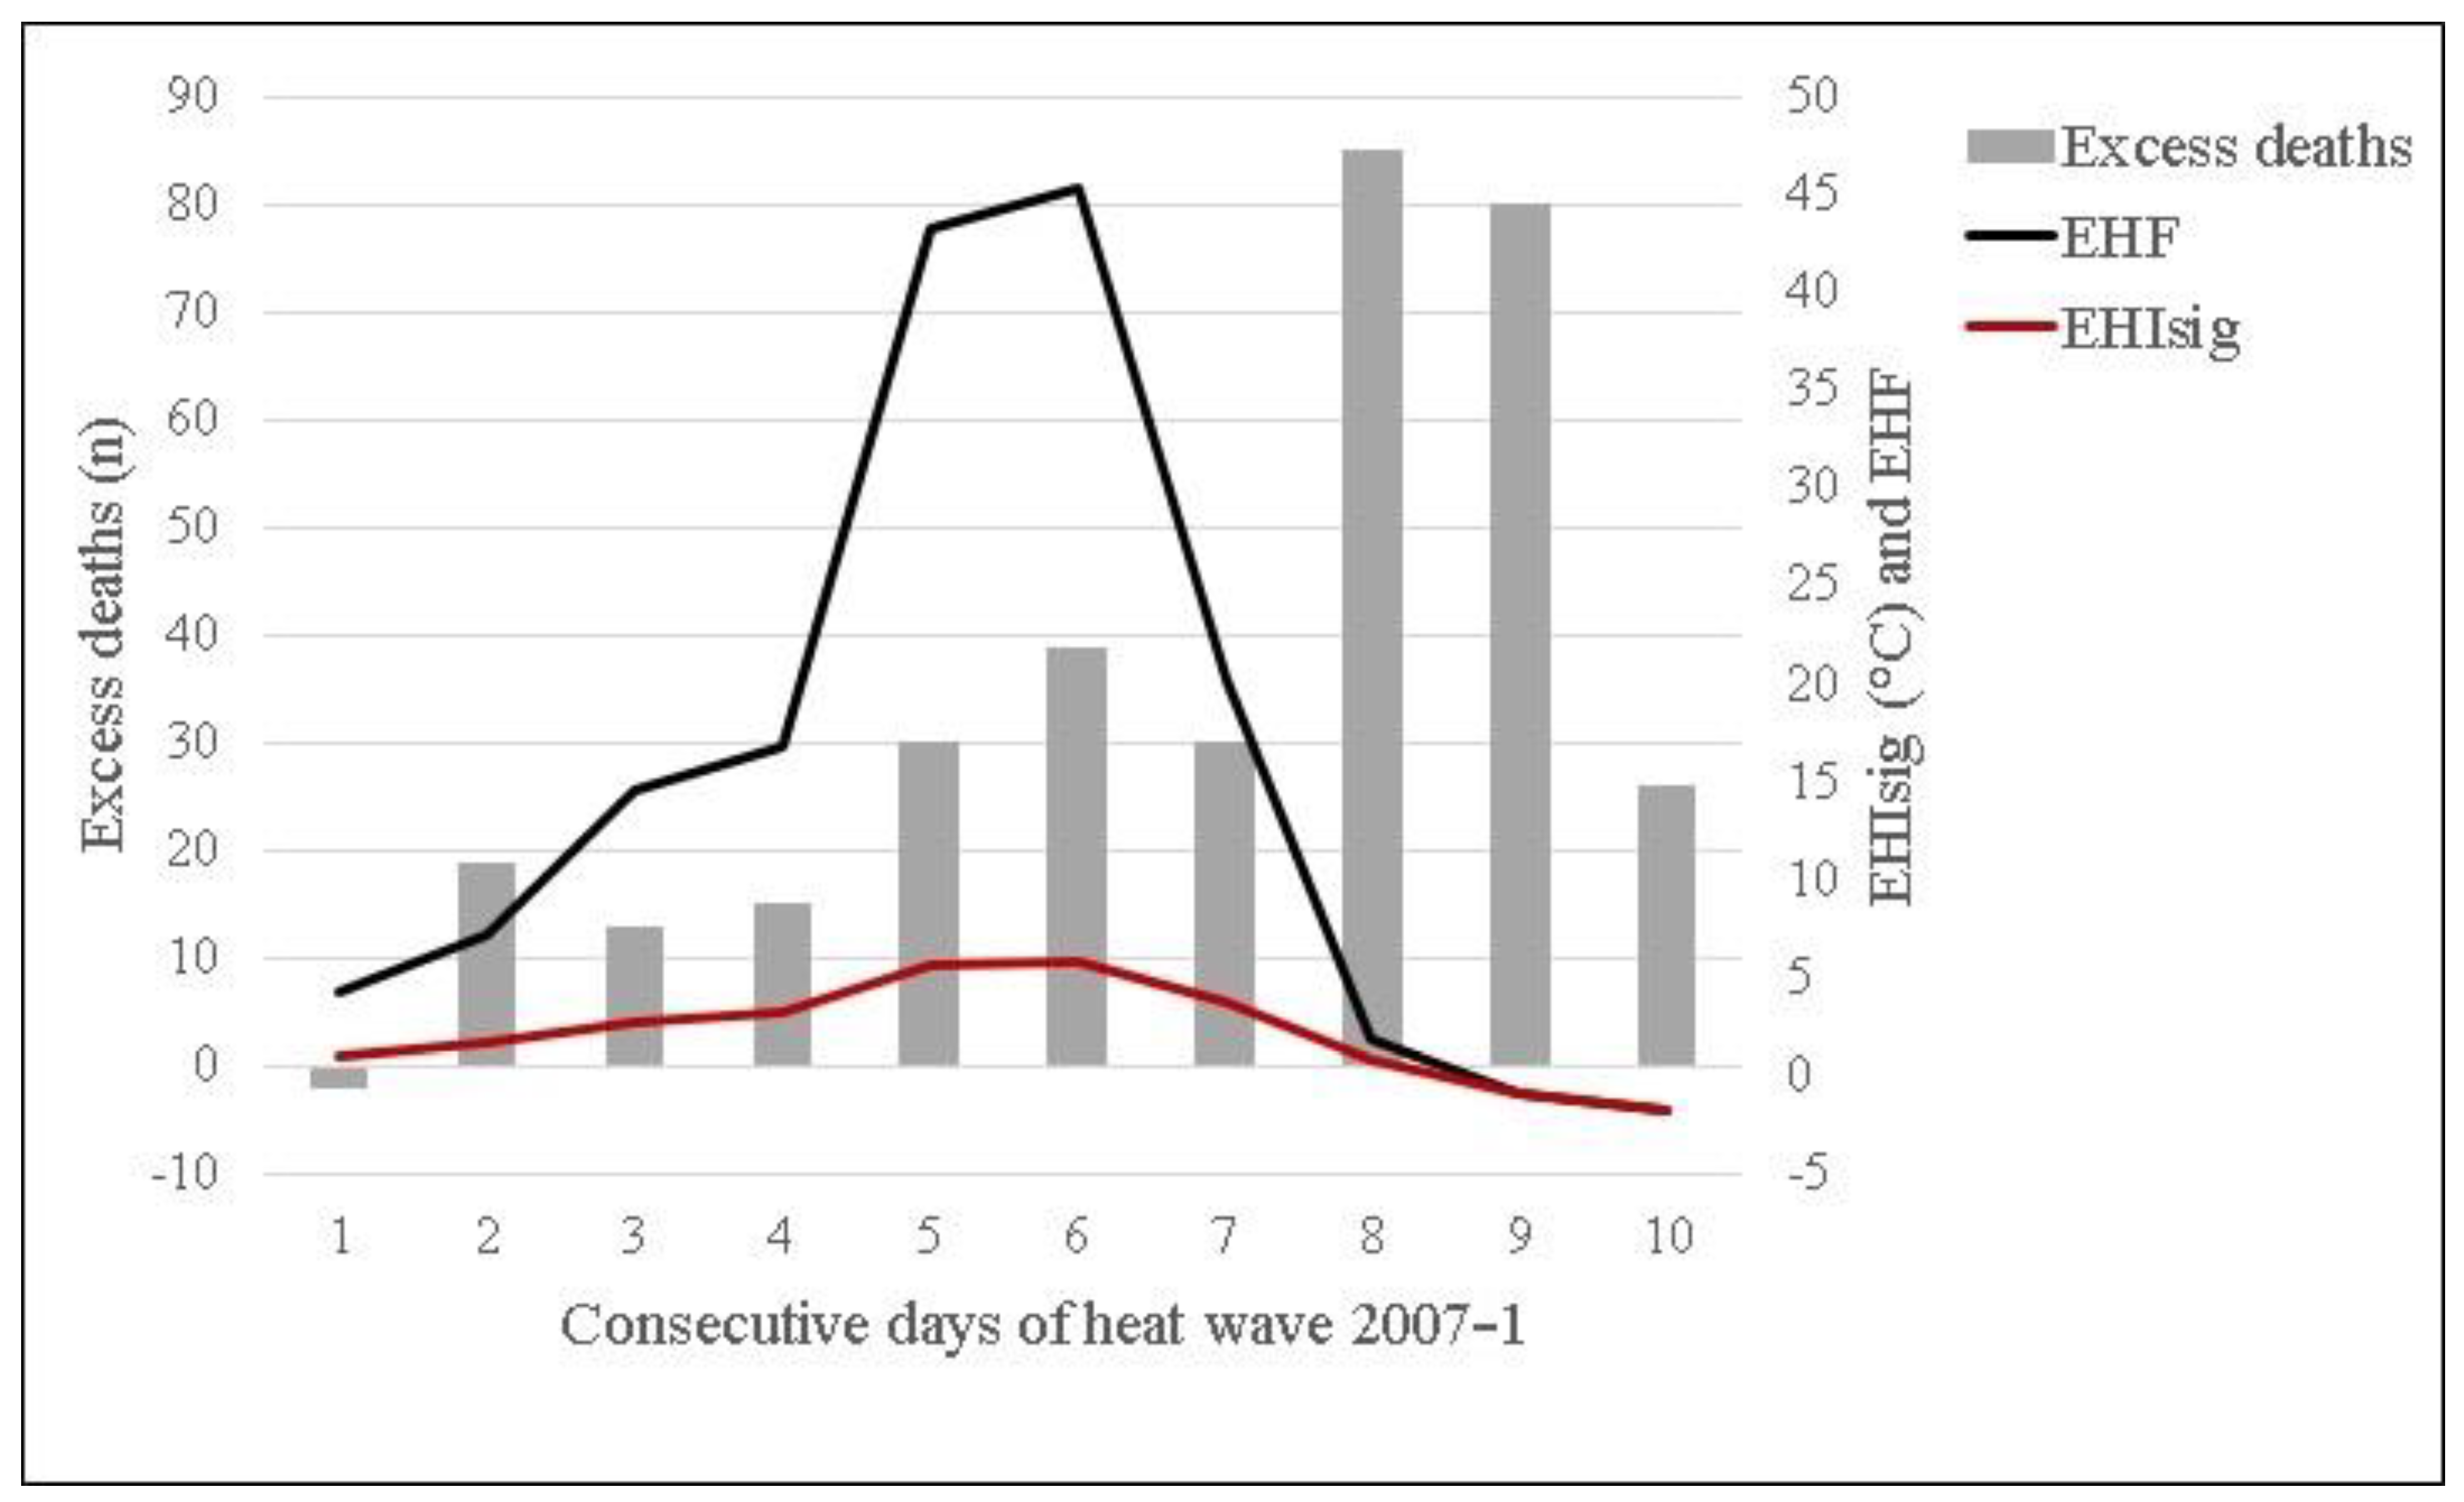
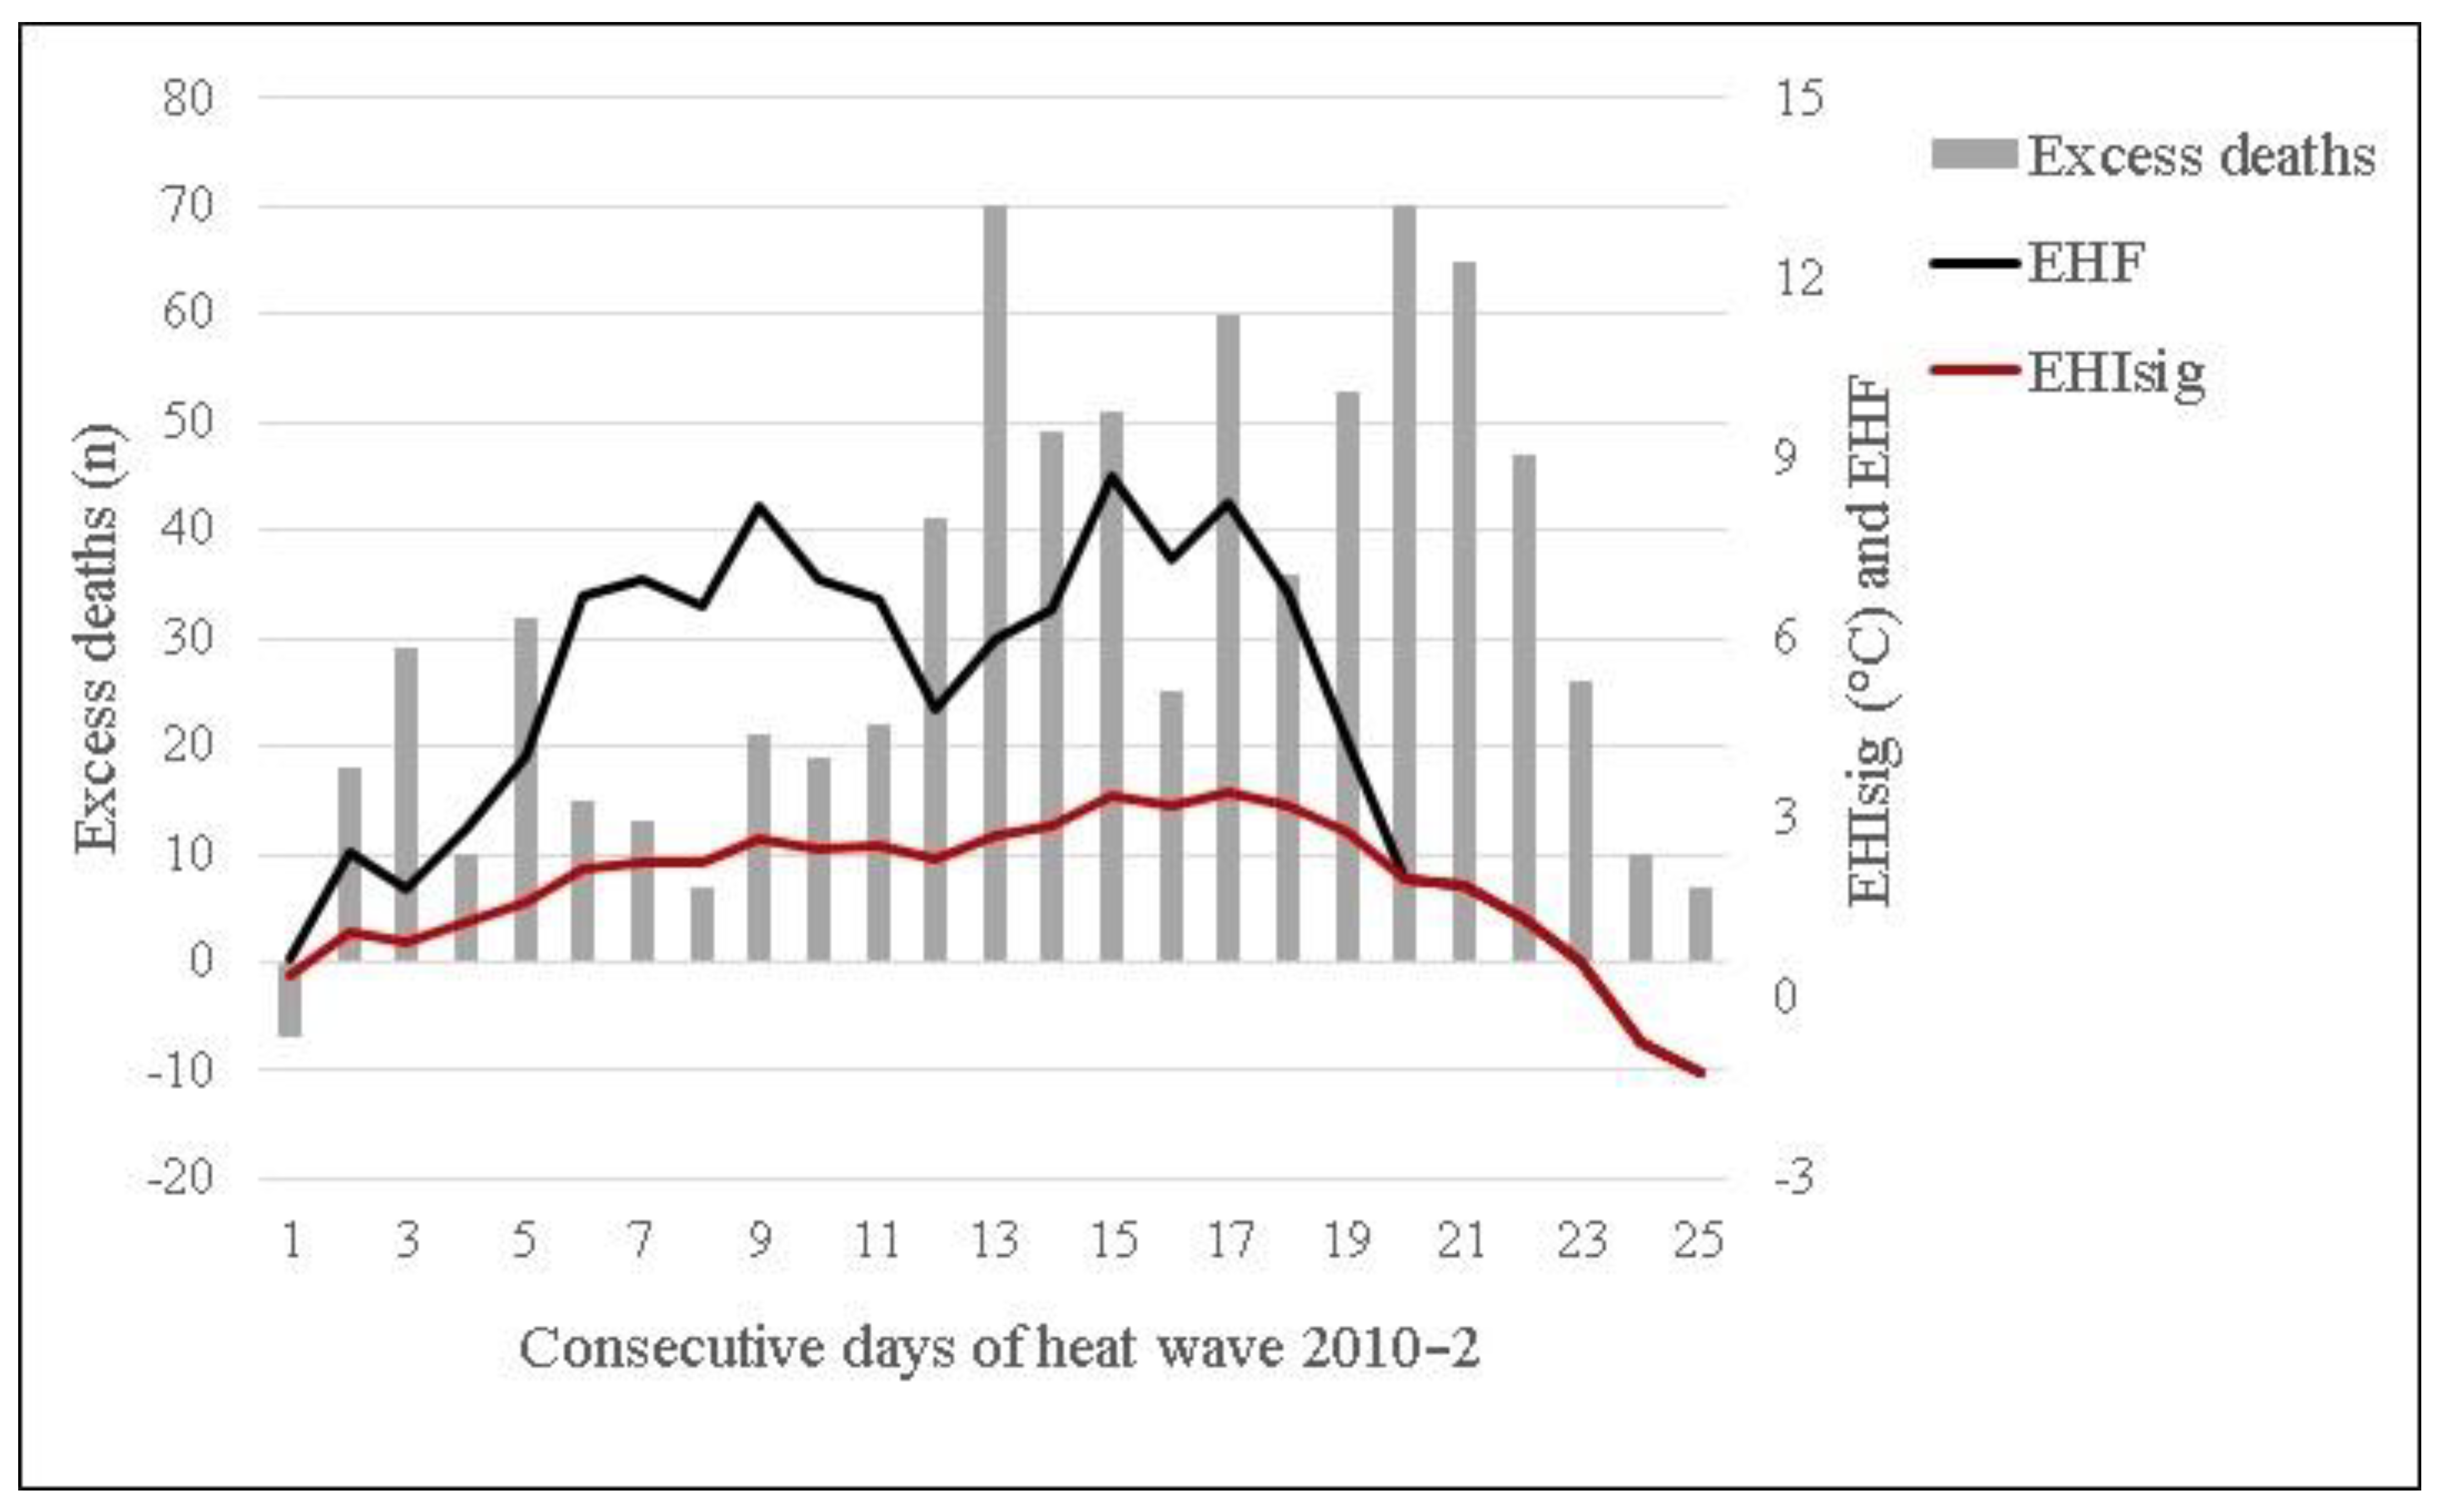
3. Results
4. Discussion
5. Conclusions
Author Contributions
Funding
Institutional Review Board Statement
Informed Consent Statement
Data Availability Statement
Acknowledgments
Conflicts of Interest
References
- IPCC. Summary for Policymakers. In Climate Change 2021: The Physical Science Basis; Contribution of Working Group I to the Sixth Assessment Report of the Intergovernmental Panel on Climate Change; Masson-Delmotte, V., Zhai, P., Pirani, A., Connors, S.L., Péan, C., Berger, S., Caud, N., Chen, Y., Goldfarb, L., Gomis, M.I., et al., Eds.; Cambridge University Press: Cambridge, UK; New York, NY, USA, 2021; pp. 3–32. [Google Scholar] [CrossRef]
- Perkins, S.E.; Alexander, L.V.; Nairn, J.R. Increasing frequency, intensity and duration of observed global heatwaves and warm spells. Geophys. Res. Lett. 2012, 39, 1–5. [Google Scholar] [CrossRef]
- Russo, S.; Dosio, A.; Graversen, R.G.; Sillmann, J.; Carrao, H.; Dunbar, M.B.; Singleton, A.; Montagna, P.; Barbola, P.; Vogt, J.V. Magnitude of extreme heat waves in present climate and their projection in a warming world. JGR Atmos. 2014, 119, 12–500. [Google Scholar] [CrossRef] [Green Version]
- Kuglitsch, F.G.; Toreti, A.; Xoplaki, E.; Della-Marta, P.M.; Zerefos, C.S.; Türkeş, M.; Luterbacher, J. Heat wave changes in the eastern Mediterranean since 1960. Geophys. Res. Lett. 2010, 37, 1–5. [Google Scholar] [CrossRef] [Green Version]
- Bleyer, A.S. The ınfluence of atmospheric conditions on the mortality of ınfants suffering with gastro-intestinal disorders: A study of the summers of 1910, 1911 and 1912 in St. Louis. Am. J. Dis. Child. 1913, 6, 319–325. [Google Scholar] [CrossRef] [Green Version]
- Ellis, F.P.; Princé, H.P.; Lovatt, G.; Whittington, R.M. Mortality and morbidity in Birmingham during the 1976 heatwave. Q. J. Med. 1980, 49, 1–8. [Google Scholar] [CrossRef] [PubMed]
- Robine, J.M.; Cheung, S.L.; Le Roy, S.; Van Oyen, H.; Griffiths, C.; Michel, J.P.; Herrmann, F.R. Death toll exceeded 70,000 in Europe during the summer of 2003. C R Biol. 2008, 331, 171–178. [Google Scholar] [CrossRef] [PubMed]
- Azhar, G.S.; Mavalankar, D.; Nori-Sarma, A.; Rajiva, A.; Dutta, P.; Jaiswal, A.; Sheffield, P.; Knowlton, K.; Hess, J.J.; Ahmedabad HeatClimate Study Group. Heat-related mortality in India: Excess all-cause mortality associated with the 2010 Ahmedabad heat wave. PLoS ONE 2014, 9, e91831. [Google Scholar] [CrossRef]
- Khan, N.; Shahid, S.; Ismail, T.B.; Wang, X.J. Spatial distribution of unidirectional trends in temperature and temperature extremes in Pakistan. Theor. Appl. Climatol. 2019, 136, 899–913. [Google Scholar] [CrossRef]
- Kanat, Z.; Keskin, A. Dünyada iklim değişikliği üzerine yapılan çalışmalar ve Türkiye’de mevcut durum. Atatürk Üniv. Ziraat Fak. Derg. 2018, 49, 67–78. [Google Scholar]
- Turkey Ministry of Environment and Urbanization. Turkey’s National Climate Change Adaptation Strategy and Action Plan 2011–2023. Available online: https://webdosya.csb.gov.tr/db/iklim/editordosya/file/eylem%20planlari/uyum_stratejisi_eylem_plani_EN_Final.pdf (accessed on 29 June 2022).
- Gürkan, H.; Eskioğlu, O.; Yazıcı, B.; Şensoy, S.; Kömüşçü, A.Ü.; Çalık, Y. Projected trends in heat and cold waves under effect of climate change. In Proceedings of the 8th Atmospheric Sciences Symposium, Istanbulm, Turkey, 1–4 November 2017; pp. 111–122. [Google Scholar]
- Unal, Y.S.; Tan, E.; Mentes, S.S. Summer heat waves over western Turkey between 1965 and 2006. Theor. Appl. Climatol. 2013, 112, 339–350. [Google Scholar] [CrossRef]
- Turkish Statistical Institute. Address Based Population Registration System Results. 2020. Available online: https://data.tuik.gov.tr/Bulten/Index?p=Adrese-Dayali-Nufus-Kayit-Sistemi-Sonuclari-2020-37210/ (accessed on 20 May 2022).
- Matthies, F.; Bickler, G.; Hales, S.; Marín, N.C. (Eds.) Heat-Health Action Plans: Guidance; World Health Organization: Copenhagen, Denmark, 2008. [Google Scholar]
- Can, G.; Şahin, Ü.; Sayılı, U.; Dubé, M.; Kara, B.; Acar, H.C.; İnan, B.; Sayman, Ö.A.; Lebel, G.; Bustinza, R.; et al. Excess mortality in Istanbul during extreme heat waves between 2013 and 2017. Int. J. Environ. Res. Public Health 2019, 16, e4348. [Google Scholar] [CrossRef] [PubMed] [Green Version]
- Leone, M.; D’Ippoliti, D.; De Sario, M.; Analitis, A.; Menne, B.; Katsouyanni, K.; Donato, F.K.D.; Basagana, X.; Ben Salah, A.; Casimiro, E.; et al. A time series study on the effects of heat on mortality and evaluation of heterogeneity into European and Eastern-Southern Mediterranean cities: Results of EU CIRCE project. Environ. Health 2013, 12, e55. [Google Scholar] [CrossRef] [PubMed] [Green Version]
- Oray, N.C.; Oray, D.; Aksay, E.; Atilla, R.; Bayram, B. The impact of a heat wave on mortality in the emergency department. Medicine 2018, 97, e13815. [Google Scholar] [CrossRef] [PubMed]
- Amengual, A.; Homar, V.; Romero, R.; Brooks, H.E.; Ramis, C.; Gordaliza, M.; Alonso, S. Projections of heat waves with high impact on human health in Europe. Glob. Planet. Change 2014, 119, 71–84. [Google Scholar] [CrossRef]
- Bölük, E. Köppen Iklim Sınıflandırmasına Göre Türkiye Iklimi; Meteoroloji Genel Müdürlüğü: Ankara, Turkey, 2016. Available online: https://www.mgm.gov.tr/FILES/iklim/iklim_siniflandirmalari/koppen.pdf (accessed on 20 May 2022).
- Ezber, Y.; Sen, O.L.; Kindap, T.; Karaca, M. Climatic effects of urbanization in Istanbul: A statistical and modeling analysis. Int. J. Climatol. 2007, 27, 667–679. [Google Scholar] [CrossRef]
- United Nations, Department of Economic and Social Affairs, Population Division. World Urbanization Prospects: The 2018 Revision; United Nations: New York, NY, USA, 2019; Available online: https://esa.un.org/unpd/wup/ (accessed on 26 June 2022).
- Istanbul Metropolitan Municipality Istanbul Statistics Office. 2019. Available online: https://istatistik.istanbul/index.html#dashboard/ (accessed on 22 May 2022).
- Nairn, J.R.; Fawcett, R.J. The excess heat factor: A metric for heatwave intensity and its use in classifying heatwave severity. Int. J. Environ. Res. Public Health 2014, 12, 227–253. [Google Scholar] [CrossRef] [Green Version]
- McGregor, G.R.; Bessemoulin, P.; Ebi, K.; Menne, B. (Eds.) Heatwaves and Health: Guidance on Warning-System Development; World Meteorological Organization and World Health Organization: Geneva, Switzerland, 2015; Available online: https://dro.dur.ac.uk/28811/1/28811.pdf (accessed on 25 June 2022).
- Loridan, T.; Coates, L.; Argueso, D.; Perkins-Kirkpatrick, S.E.; McAneney, J. The Excess Heat Factor as a metric for heat-related fatalitis: Defining heatwave risk categories. Aust. J. Emerg. Manag. 2016, 31, 31–37. [Google Scholar]
- Royé, D.; Codesido, R.; Tobías, A.; Taracido, M. Heat wave intensity and daily mortality in four of the largest cities of Spain. Environ. Res. 2020, 182, e109027. [Google Scholar] [CrossRef]
- Lebel, G.; Bustinza, R.; Dubé, M. Évaluation du Fichier Hebdomadaire des Décès pour L’estimation des Impacts des Vagues de Chaleur; Institut national de santé publique du Québec: Québec, QC, Canada, 2015; Available online: https://www.inspq.qc.ca (accessed on 5 December 2022).
- Erlat, E.; Türkeş, M.; Aydin-Kandemir, F. Observed changes and trends in heatwave characteristics in Turkey since 1950. Theor. Appl. Climatol. 2020, 145, 137–157. [Google Scholar] [CrossRef]
- Demirtaş, M. High impact heat waves over the Euro-Mediterranean region and Turkey-in concert with atmospheric blocking and large dynamical and physical anomalies. Anadolu Univ. J. Sci. Technol. A-Appl. Sci. Eng. 2017, 18, 97–114. [Google Scholar] [CrossRef] [Green Version]
- Williams, S.; Venugopal, K.; Nitschke, M.; Nairn, J.; Fawcett, R.; Beattie, C.; Wynwood, G.; Bi, P. Regional morbidity and mortality during heatwaves in South Australia. Int. J. Biometeorol. 2018, 62, 1911–1926. [Google Scholar] [CrossRef] [PubMed]
- Scalley, B.D.; Spicer, T.; Jian, L.; Xiao, J.; Nairn, J.; Robertson, A.; Weeramanthri, T. Responding to heatwave intensity: Excess Heat Factor is a superior predictor of health service utilisation and a trigger for heatwave plans. Aust. N. Z. J. Public Health 2015, 39, 582–587. [Google Scholar] [CrossRef] [PubMed]
- Bouchama, A.; Knochel, J.P. Heat stroke. N. Engl. J. Med. 2002, 346, 1978–1988. [Google Scholar] [CrossRef] [PubMed]
- Hajat, S.; Kovats, R.S.; Atkinson, R.W.; Haines, A. Impact of hot temperatures on death in London: A time series approach. J. Epidemiol. Community Health 2002, 56, 367–372. [Google Scholar] [CrossRef] [Green Version]
- Toulemon, L.; Barbieri, M. The mortality impact of the August 2003 heat wave in France: Investigating the ‘harvesting’ effect and other long-term consequences. Popul. Stud. 2008, 62, 39–53. [Google Scholar] [CrossRef] [Green Version]
- Huynen, M.M.; Martens, P.; Schram, D.; Weijenberg, M.P.; Kunst, A.E. The impact of heat waves and cold spells on mortality rates in the Dutch population. Environ. Health Perspect. 2001, 109, 463–470. [Google Scholar] [CrossRef]
- Goodman, P.G.; Dockery, D.W.; Clancy, L. Cause-specific mortality and the extended effects of particulate pollution and temperature exposure. Environ. Health Perspect. 2004, 112, 179–185. [Google Scholar] [CrossRef]
- Tong, S.; Wang, X.Y.; Barnett, A.G. Assessment of heat-related health impacts in Brisbane, Australia: Comparison of different heatwave definitions. PLoS ONE 2010, 5, e12155. [Google Scholar] [CrossRef]


| Years | Population | Daily Average Number of Deaths (Rate/100k) | Average of Tis (°C) (Min–Max) | Number and Length (Days) of Heat Waves |
|---|---|---|---|---|
| 2004 | 11,910,733 | 101 (0.85) | 22.3 (16.8–26.9) | 0 (0) |
| 2005 | 12,128,577 | 106 (0.87) | 23.1 (15.9–27.4) | 1 (8) |
| 2006 | 12,351,506 | 112 (0.91) | 23.6 (16.5–28.7) | 2 (8, 10) |
| 2007 | 12,573,836 | 117 (0.93) | 25.0 (19.5–32.7) | 3 (10, 15, 7) |
| 2008 | 12,697,164 | 129 (1.02) | 24.2 (16.7–28.0) | 2 (7, 15) |
| 2009 | 12,915,158 | 134 (1.04) | 24.0 (19.8–27.4) | 1 (5) |
| 2010 | 13,255,685 | 150 (1.13) | 24.9 (17.4–30.1) | 2 (14, 25) |
| 2011 | 13,624,240 | 147 (1.08) | 23.6 (18.6–27.8) | 1 (16) |
| 2012 | 13,854,740 | 159 (1.15) | 25.1 (19.2–29.3) | 5 (5, 6, 12, 12, 9) |
| 2013 | 14,160,467 | 155 (1.09) | 24.2 (18.3–27.4) | 2 (5, 11) |
| 2014 | 14,377,018 | 173 (1.20) | 24.6 (18.5–28.4) | 4 (5, 5, 17, 8) |
| 2015 | 14,657,434 | 179 (1.22) | 24.3 (18.8–28.9) | 1 (29) |
| 2016 | 14,804,116 | 187 (1.26) | 25.0 (17.3–28.9) | 3 (18, 21, 7) |
| 2017 | 15,029,231 | 187 (1.24) | 24.3 (18.4–29.2) | 3 (7, 5, 12) |
| HW | Start–End Date | Days | Average of Daily Mean Temp. (°C) | Max EHF | Total EHF | Number of Excess Deaths | RR | 95% CI | p-Value |
|---|---|---|---|---|---|---|---|---|---|
| 2005-1 | 30 Jul–6 Aug | 8 | 26.65 | 3.56 | 13.02 | 61 | 1.07 | 1.00–1.15 | 0.046 |
| 2006-1 | 25 Jun–2 Jul | 8 | 25.53 | 7.52 | 26.79 | 102 | 1.12 | 1.04–1.19 | 0.001 |
| 2006-2 | 14 Aug–23 Aug | 10 | 26.53 | 1.91 | 8.30 | 108 | 1.10 | 1.03–1.17 | 0.002 |
| 2007-1 | 21 Jun–30 Jun | 10 | 27.11 | 45.36 | 153.41 | 339 | 1.31 | 1.23–1.38 | <0.001 |
| 2007-2 | 17 Jul–31 Jul | 15 | 26.81 | 10.07 | 31.05 | 158 | 1.10 | 1.04–1.15 | 0.001 |
| 2007-3 | 20 Aug–26 Aug | 7 | 26.93 | 2.61 | 7.09 | 68 | 1.09 | 1.01–1.17 | 0.021 |
| 2008-1 | 23 Jun–29 Jun | 7 | 25.39 | 6.27 | 18.42 | 115 | 1.13 | 1.06–1.21 | <0.001 |
| 2008-2 | 12 Aug–26 Aug | 15 | 26.72 | 3.12 | 14.72 | 185 | 1.10 | 1.05–1.15 | <0.001 |
| 2010-1 | 14 Jul–27 Jul | 14 | 26.49 | 3.50 | 19.29 | 203 | 1.10 | 1.05–1.16 | <0.001 |
| 2010-2 | 29 Jul–22 Aug | 25 | 28.16 | 8.71 | 112.14 | 783 | 1.22 | 1.18–1.27 | <0.001 |
| 2011-1 | 16 Jul–31 Jul | 16 | 26.56 | 3.78 | 24.26 | 154 | 1.07 | 1.02–1.11 | 0.004 |
| 2012-1 | 11 Jun–15 Jun | 5 | 24.98 | 5.47 | 9.82 | 67 | 1.09 | 1.01–1.17 | 0.022 |
| 2012-3 | 7 Jul–18 Jul | 12 | 26.61 | 4.18 | 16.93 | 227 | 1.12 | 1.07–1.18 | <0.001 |
| 2012-4 | 21 Jul–1 Aug | 12 | 27.23 | 6.46 | 33.47 | 133 | 1.07 | 1.02–1.13 | 0.006 |
| 2013-2 | 12 Aug–22 Aug | 11 | 26.44 | 1.69 | 3.75 | 154 | 1.09 | 1.04–1.15 | <0.001 |
| 2015-1 | 24 Jun–28 Jun | 29 | 27.06 | 9.06 | 60.22 | 506 | 1.10 | 1.07–1.14 | <0.001 |
| 2016-1 | 16 Jun–3 Jul | 18 | 25.86 | 9.88 | 70.06 | 295 | 1.09 | 1.05–1.14 | <0.001 |
| 2016-2 | 23 Jul–12 Aug | 21 | 27.12 | 5.79 | 44.31 | 309 | 1.08 | 1.04–1.12 | <0.001 |
| 2016-3 | 17 Aug–23 Aug | 7 | 26.81 | 1.10 | 3.92 | 94 | 1.08 | 1.02–1.14 | 0.013 |
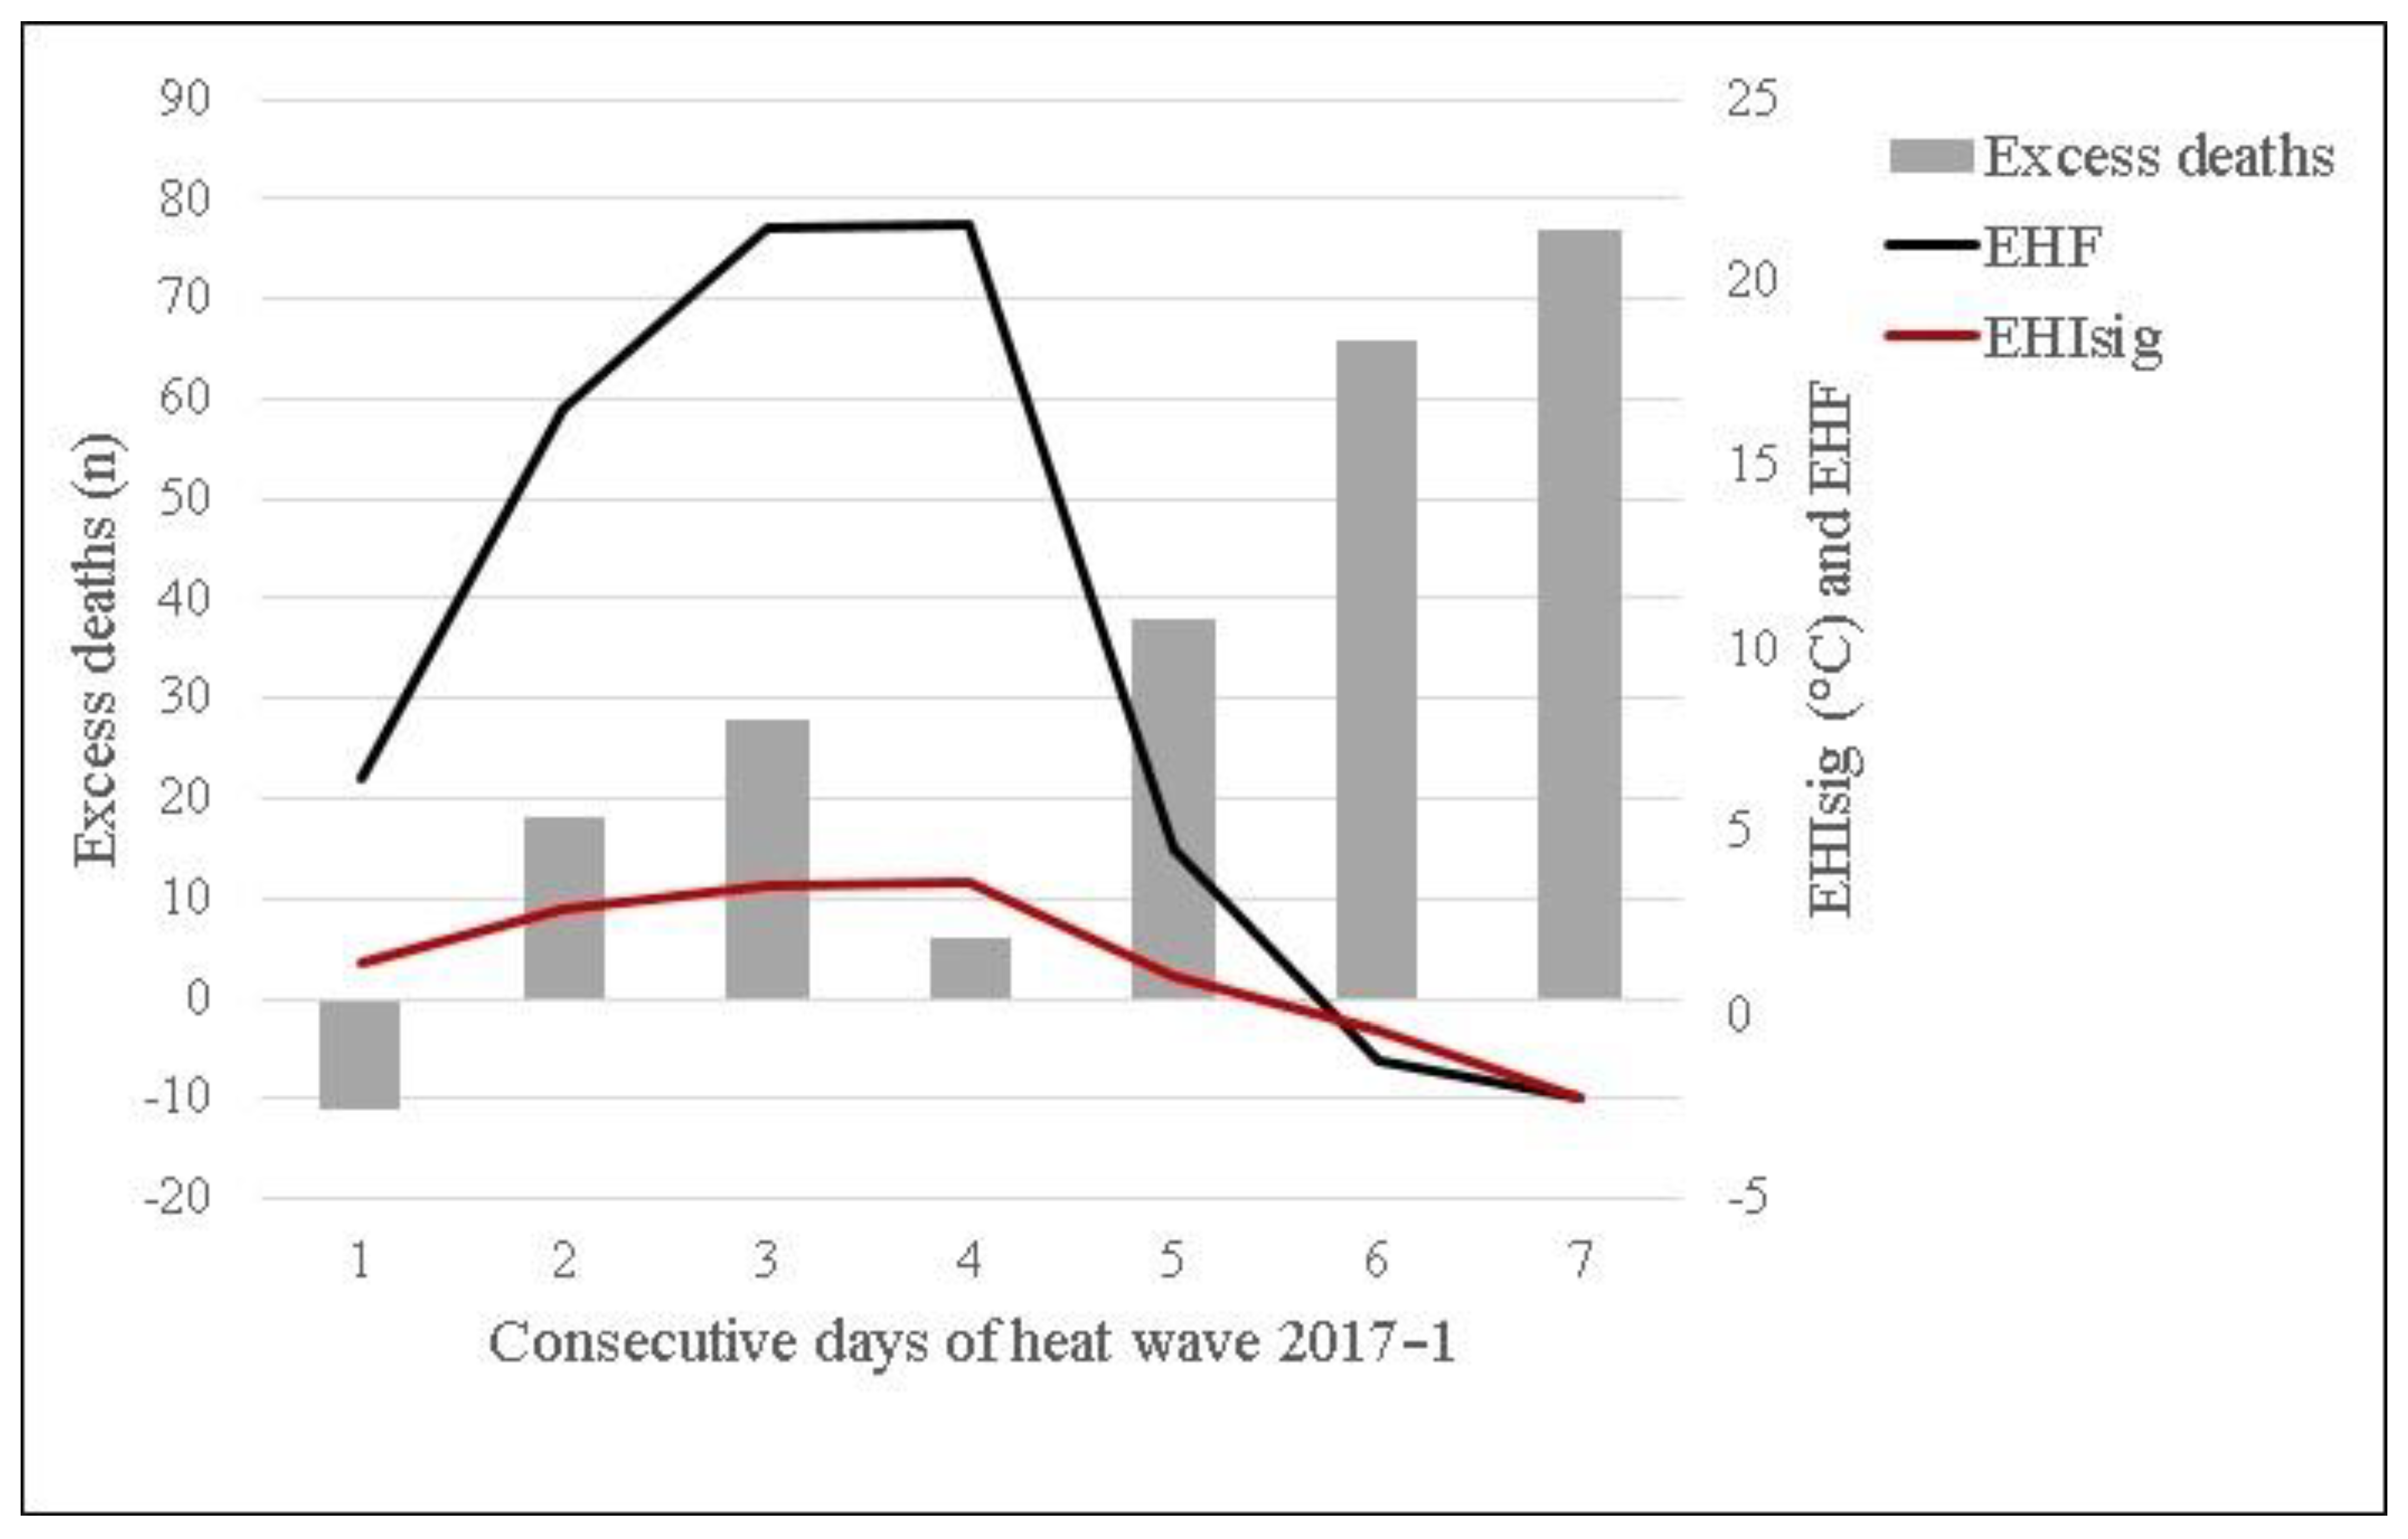
| 2017-1 | 27 Jun–3 Jul | 7 | 27.00 | 21.59 | 70.64 | 220 | 1.17 | 1.11–1.23 | <0.001 |
| Total | 257 | 4,281 |
| HW | Start–End Date | Days | Average of Daily Mean Temp. (°C) | Max EHF | Total EHF | RR | 95% CI | p-Value |
|---|---|---|---|---|---|---|---|---|
| 2009-1 | 21 Jun–25 Jun | 5 | 24.97 | 9.94 | 13.03 | 1.06 | 0.98–1.14 | 0.134 |
| 2012-2 | 21 Jun–26 Jun | 6 | 25.72 | 7.21 | 20.84 | 1.02 | 0.95–1.09 | 0.583 |
| 2012-5 | 3 Aug–11 Aug | 9 | 27.49 | 6.10 | 18.94 | 0.99 | 0.94–1.05 | 0.774 |
| 2013-1 | 23 Jun–27 Jun | 5 | 24.87 | 1.57 | 3.21 | 1.03 | 0.96–1.10 | 0.468 |
| 2014-1 | 24 Jun–28 Jun | 5 | 24.77 | 5.02 | 8.60 | 1.04 | 0.97–1.11 | 0.263 |
| 2014-2 | 9 Jul–13 Jul | 5 | 26.12 | 2.83 | 5.57 | 1.02 | 0.96–1.10 | 0.488 |
| 2014-3 | 21 Jul–6 Aug | 17 | 26.70 | 3.08 | 19.25 | 1.03 | 0.99–1.08 | 0.125 |
| 2014-4 | 10 Aug–17 Aug | 8 | 26.90 | 0.82 | 4.24 | 1.05 | 1.00–1.11 | 0.061 |
| 2017-2 | 23 Jul–27 Jul | 5 | 26.05 | 0.37 | 0.78 | 1.05 | 0.98–1.12 | 0.180 |
| 2017-3 | 2 Aug–13 Aug | 12 | 27.02 | 9.18 | 28.76 | 0.99 | 0.95–1.04 | 0.758 |
Publisher’s Note: MDPI stays neutral with regard to jurisdictional claims in published maps and institutional affiliations. |
© 2022 by the authors. Licensee MDPI, Basel, Switzerland. This article is an open access article distributed under the terms and conditions of the Creative Commons Attribution (CC BY) license (https://creativecommons.org/licenses/by/4.0/).
Share and Cite
Çulpan, H.C.; Şahin, Ü.; Can, G. A Step to Develop Heat-Health Action Plan: Assessing Heat Waves’ Impacts on Mortality. Atmosphere 2022, 13, 2126. https://doi.org/10.3390/atmos13122126
Çulpan HC, Şahin Ü, Can G. A Step to Develop Heat-Health Action Plan: Assessing Heat Waves’ Impacts on Mortality. Atmosphere. 2022; 13(12):2126. https://doi.org/10.3390/atmos13122126
Chicago/Turabian StyleÇulpan, Hazal Cansu, Ümit Şahin, and Günay Can. 2022. "A Step to Develop Heat-Health Action Plan: Assessing Heat Waves’ Impacts on Mortality" Atmosphere 13, no. 12: 2126. https://doi.org/10.3390/atmos13122126