1. Introduction
A third of the global population relies on biomass and kerosene to meet their cooking and heating energy needs [
1]. In Kenya, combined estimates indicate that 74.5% of households use biomass and kerosene for cooking, with rural areas having the highest proportion (93.4%) compared to urban areas at 44.6% [
2]. This is despite growing concerns on the effect of biomass fuels and kerosene on household air quality and its associated health and non-health impacts.
The responsibility for collection, transportation and use of wood fuel largely lies on women and children. They not only bear the largest burden of exposure to risks during wood collection and transportation [
3], but also endure toxic kitchen emissions associated with traditional fuels, with added implications for health including adverse pregnancy outcomes [
4,
5,
6,
7,
8]. Most times, women and young girls are also the caretakers of young children and spend time in kitchen environments causing early life exposure to air pollutants which may influence subsequent health outcomes [
9].
The combustion of biomass fuels in rudimentary stoves such as the three-stone stove commonly found in rural African homes, has been associated with high levels of pollutant emissions. Evidence from rural Kenya show that women and girls were expose to extremely high levels of particulate matter [
10,
11] as well as high levels of carbon monoxide [
12,
13]. These studies reported peaks in pollutant concentrations during cooking episodes, indicating higher personal exposure for cooks and other household members present in the kitchen environment during cooking. Similarly high levels of kitchen emissions have been documented in other countries across Africa [
14,
15,
16].
This study seeks to characterize the fuel-stove mix in a rural community in Eastern Kenya, and profile fine particulate matter and gaseous pollutants in kitchens.
2. Materials and Methods
2.1. Study Design
We use cross-sectional data from a baseline survey targeting 2000 households sampled using a two-stage approach. We implemented a household baseline survey to assess current household sources of energy and willingness to shift to cleaner options.
We purposively sampled 20 households from the survey participants based on primary cooking fuel to ensure representation of the range of fuels used in the community (
Table A1). In addition, we considered equipment safety and ease of access to the households for deployment of the monitoring equipment.
The Handheld 3016 IAQTM Airborne Particle Counter (Lighthouse Worldwide Solutions, Medford, MA, USA) uses a laser-diode light source and collection optics for particle size detection (particle size range 0.3–10 μm). Particulate matter was monitored using the Lighthouse Handheld 3016 IAQ Airborne Particle Counter set in mass concentration mode, and mass concentration logged every minute. Purging procedure was done weekly according to manufacturer instructions.
The particle counter was anchored on a Wolfpack® Modular Area Monitor as an integrated system via the respective brackets. Each instrument logged data separately and left to run for at least 12 h to cover the typical three cooking periods in a day. The Wolfpack® Modular Area Monitor had two GrayWolf DirectSense® probes plugged in and simultaneously monitoring Sulfur Dioxide (SO2), Total Volatile Organic Compounds (TVOCs), Carbon Dioxide (CO2), Nitrogen Dioxide (NO2), Carbon Monoxide (CO), temperature and Relative Humidity. After setting up the Wolfpack unit, probes were allowed to stabilize, and data logged at one-minute intervals. All monitors were placed one meter off the ground and a similar distance from the cookstove.
For each household, air quality monitoring was conducted every other day over a 7-day period to allow for an assessment of variation in emission levels between weekdays and weekends. This translated to four days of monitoring in a week for most households (
Table A2), totalling to 71 days or 1505 h of monitoring. Monitoring ran from February to April 2021, which coincided with the end of the dry season (in mid- March) and the long rains (late March/April). It is worth noting that 2021 long rains in the area failed and the period was relatively dry.
2.2. Kitchen Characteristics
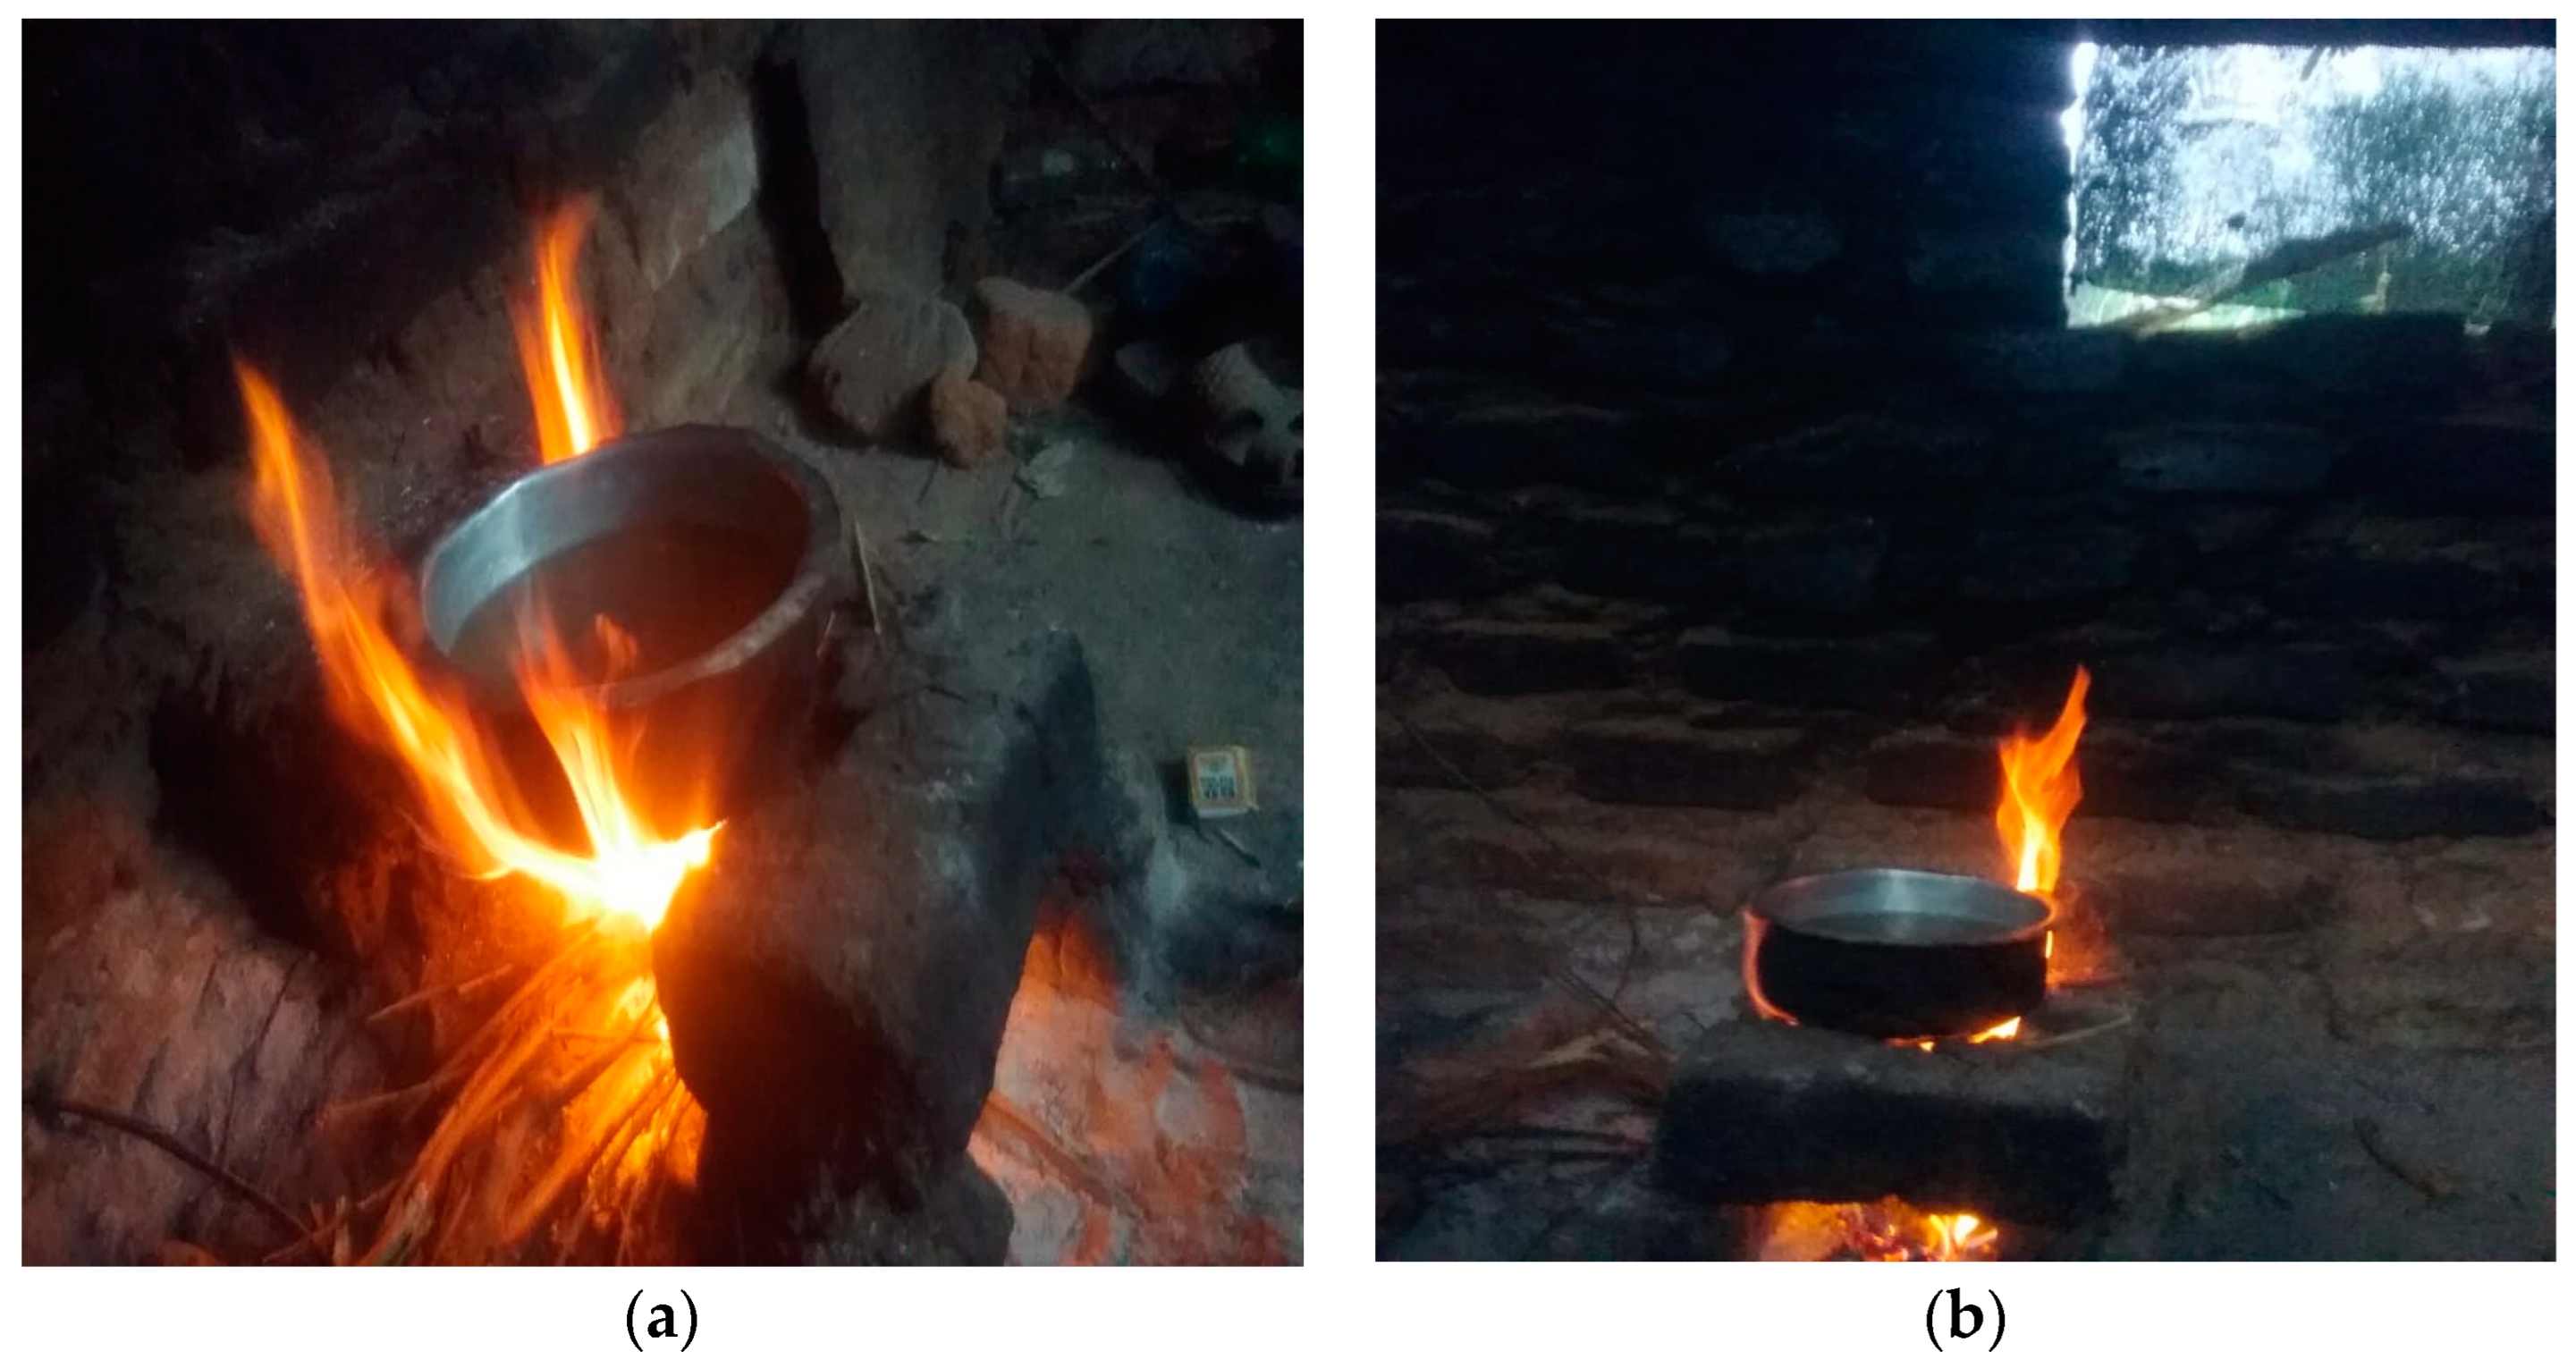
Most of the households sampled for air quality monitoring had a separate kitchen (stand-alone house) which was mostly a one-roomed structure with earthen floors. A traditional three-stone stove (
Figure 1a) or a variation of this with the stones covered with mud (
Figure 1b) was the most common type of cooking stove in the area. In a few of the sampled homes, the kitchen was part of the main house/room.
2.3. Data Analysis
Survey data was analysed using Stata software version 15.1 [
17] to produce descriptive tables using the svy command, after applying sample weights. Analysis of fine particulate matter was done separately from gas pollutants. We excluded from the analysis two households that were monitored for less than three days and computed time weighted daily average concentrations of particulate matter, CO, SO
2, NO
2, CO
2 and TVOCs by fuel types as well as the overall average over the monitoring period for each household. Average CO concentrations were computed at 24 h, 8 h, 1 h, and 15 min intervals. The Kruskal-Wallis rank-sum test method is suitable for testing differences in particulate matter concentrations among fuel types (4 levels) because particulate matter observations are independent in each fuel type and the distribution type of PM
2.5 and PM
10 data is unknown. Kruskal-Wallis test was used to check for differences in PM
2.5 and PM
10 concentrations between different types of fuel at a significant level of 5%.
3. Results
3.1. Household Cooking Fuels
Table 1 presents the range of primary and secondary fuels used in the study community.
Secondary fuels were used alongside the primary fuel in 1462/1703 (86.1%) households, reportedly for their ability to cook fast in 927/1703 (63.6%) households.
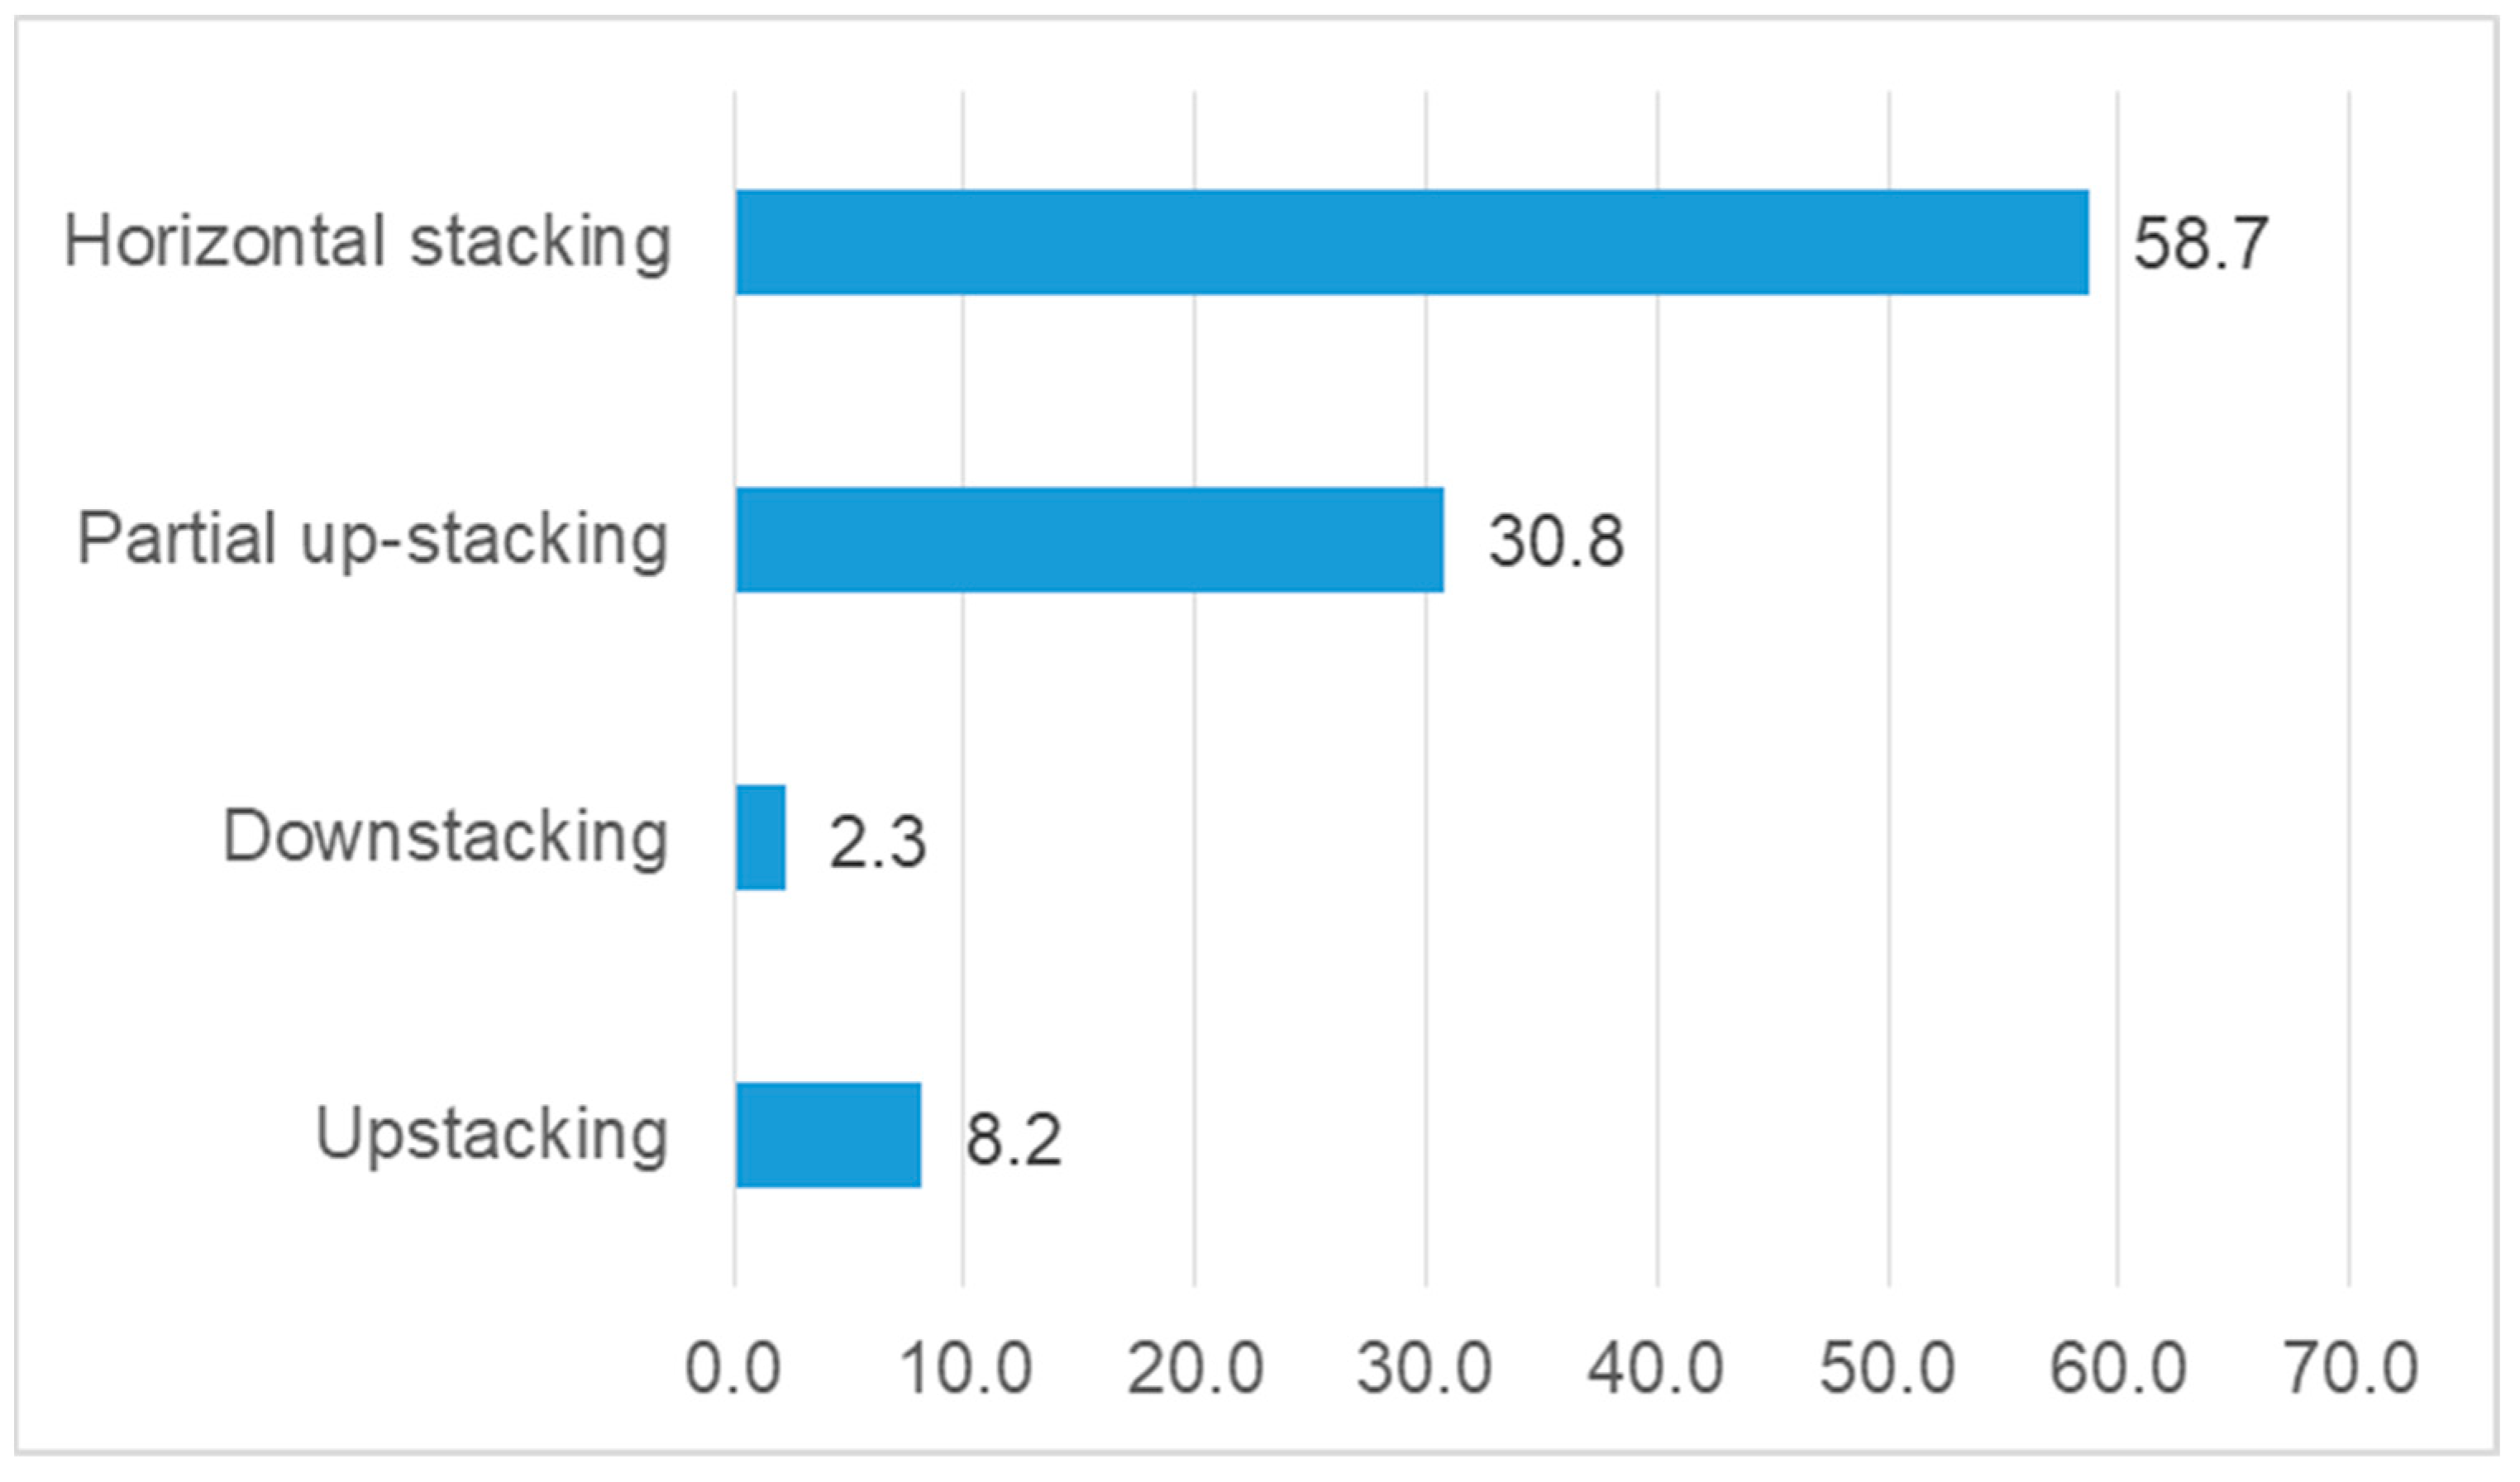
We present stacking behaviour in households and coin terminologies for different fuel combinations as described and shown below (
Figure 2). In this paper, we use the terms “higher rung” and “lower rung” fuels to refer, respectively, to fuels that fall higher on the fuel ladder such as LPG, and those falling lower on the ladder such as firewood. Results show up-stacking (use of a “lower rung” primary fuel and a “higher rung” secondary fuel) accounting for 8.2% while down-stacking (use of a “higher rung” primary fuel and a “lower rung” secondary fuel) accounting for 2.3%. In addition, 58.7% of households used “lower rung” fuels as both primary and secondary fuels- in what we term as horizontal stacking while 30.8% of households used both “higher rung” and “lower rung” secondary fuels (we coin the term partial up-stacking for such households).
3.2. Kitchen Emissions Levels
The levels of particulate matter are presented in
Table 2 below across the different primary cooking fuels reported. We present hourly and daily variations of PM
2.5 and PM
10 by fuel type. Emission trends of SO
2, NO
2, CO and TVOC are also shown making comparison with WHO guidelines for short-term exposure (24 h).
Time-weighted average (TWA) daily concentrations of PM2.5 and PM10 was highest in wood-using households and varied significantly (χ2 (2) = 22,978, df = 3, p < 0.001 and χ2 (2) =8677.4, df = 3, p < 0.001, respectively) between different fuel types. We compare PM2.5 and PM10 levels in households that use LPG as their primary fuel with households using other primary cooking fuels.
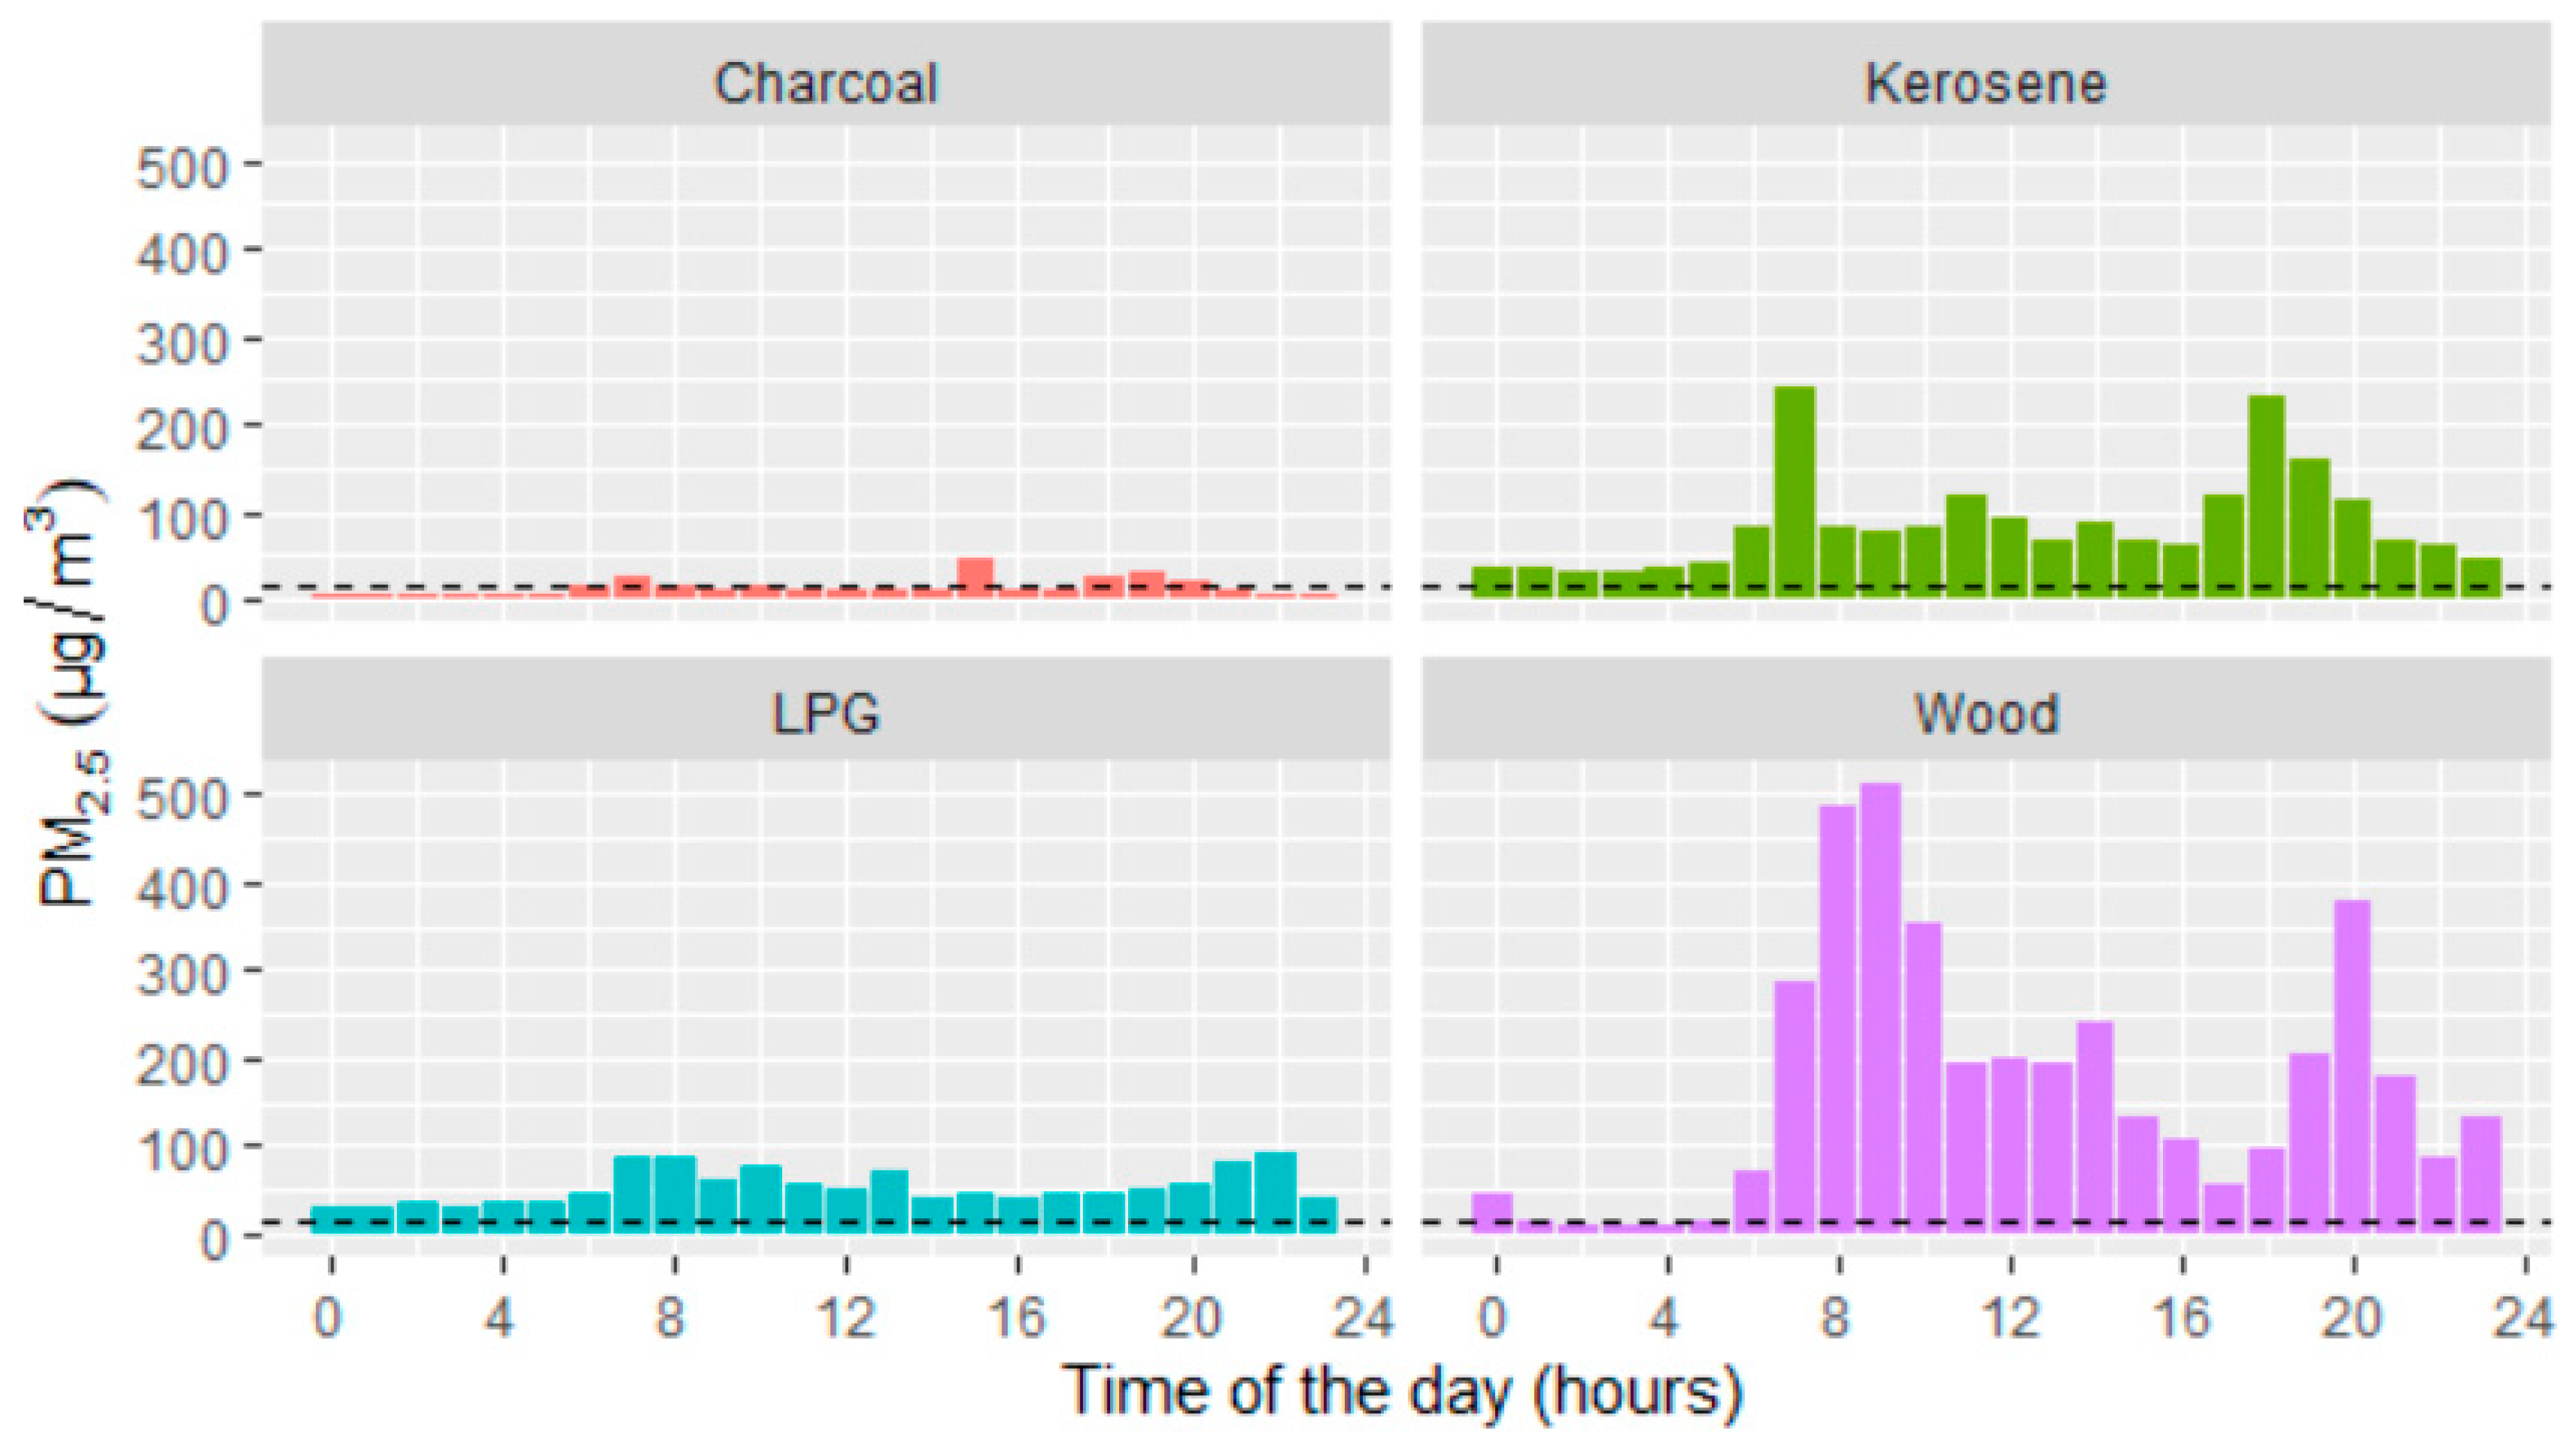
PM
2.5 hourly mean concentrations were high in wood- and kerosene-using households with consistent peaks in the morning and evening hours, typical cooking time among households in the study area (
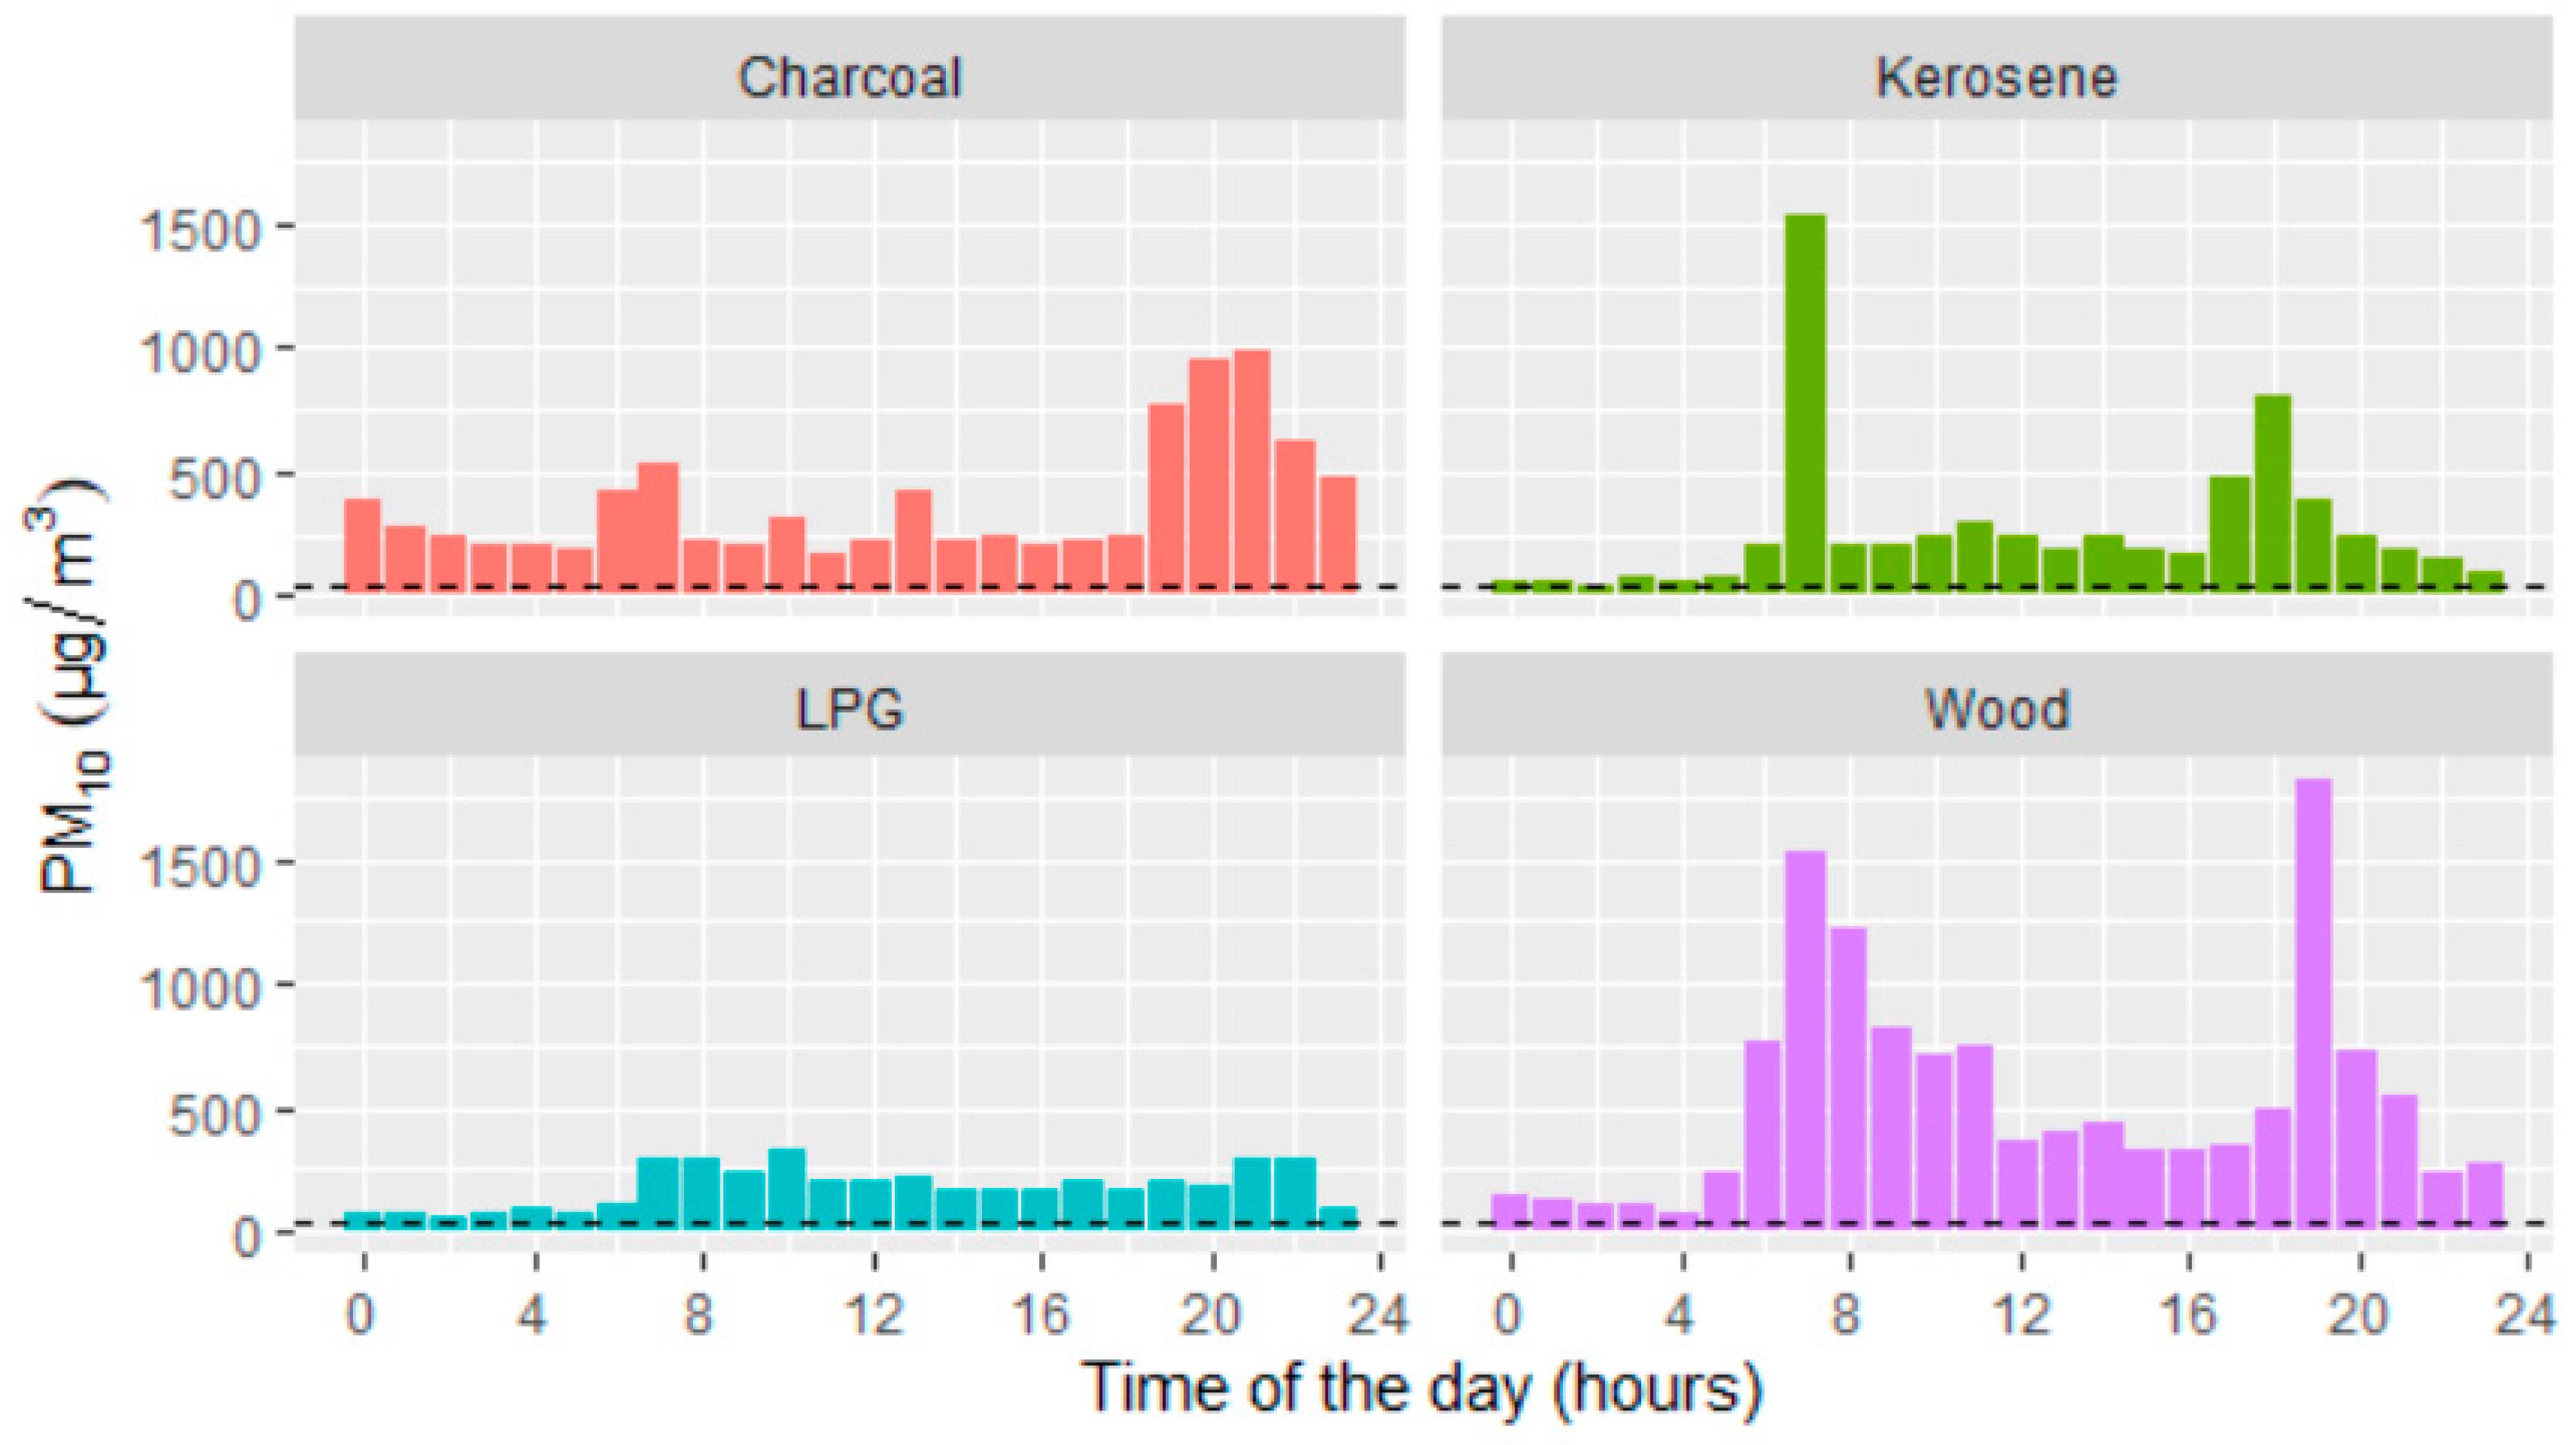
Figure 3). Households using charcoal and wood had high PM
10 hourly mean concentrations with peak concentrations coinciding with morning and evening cooking times (
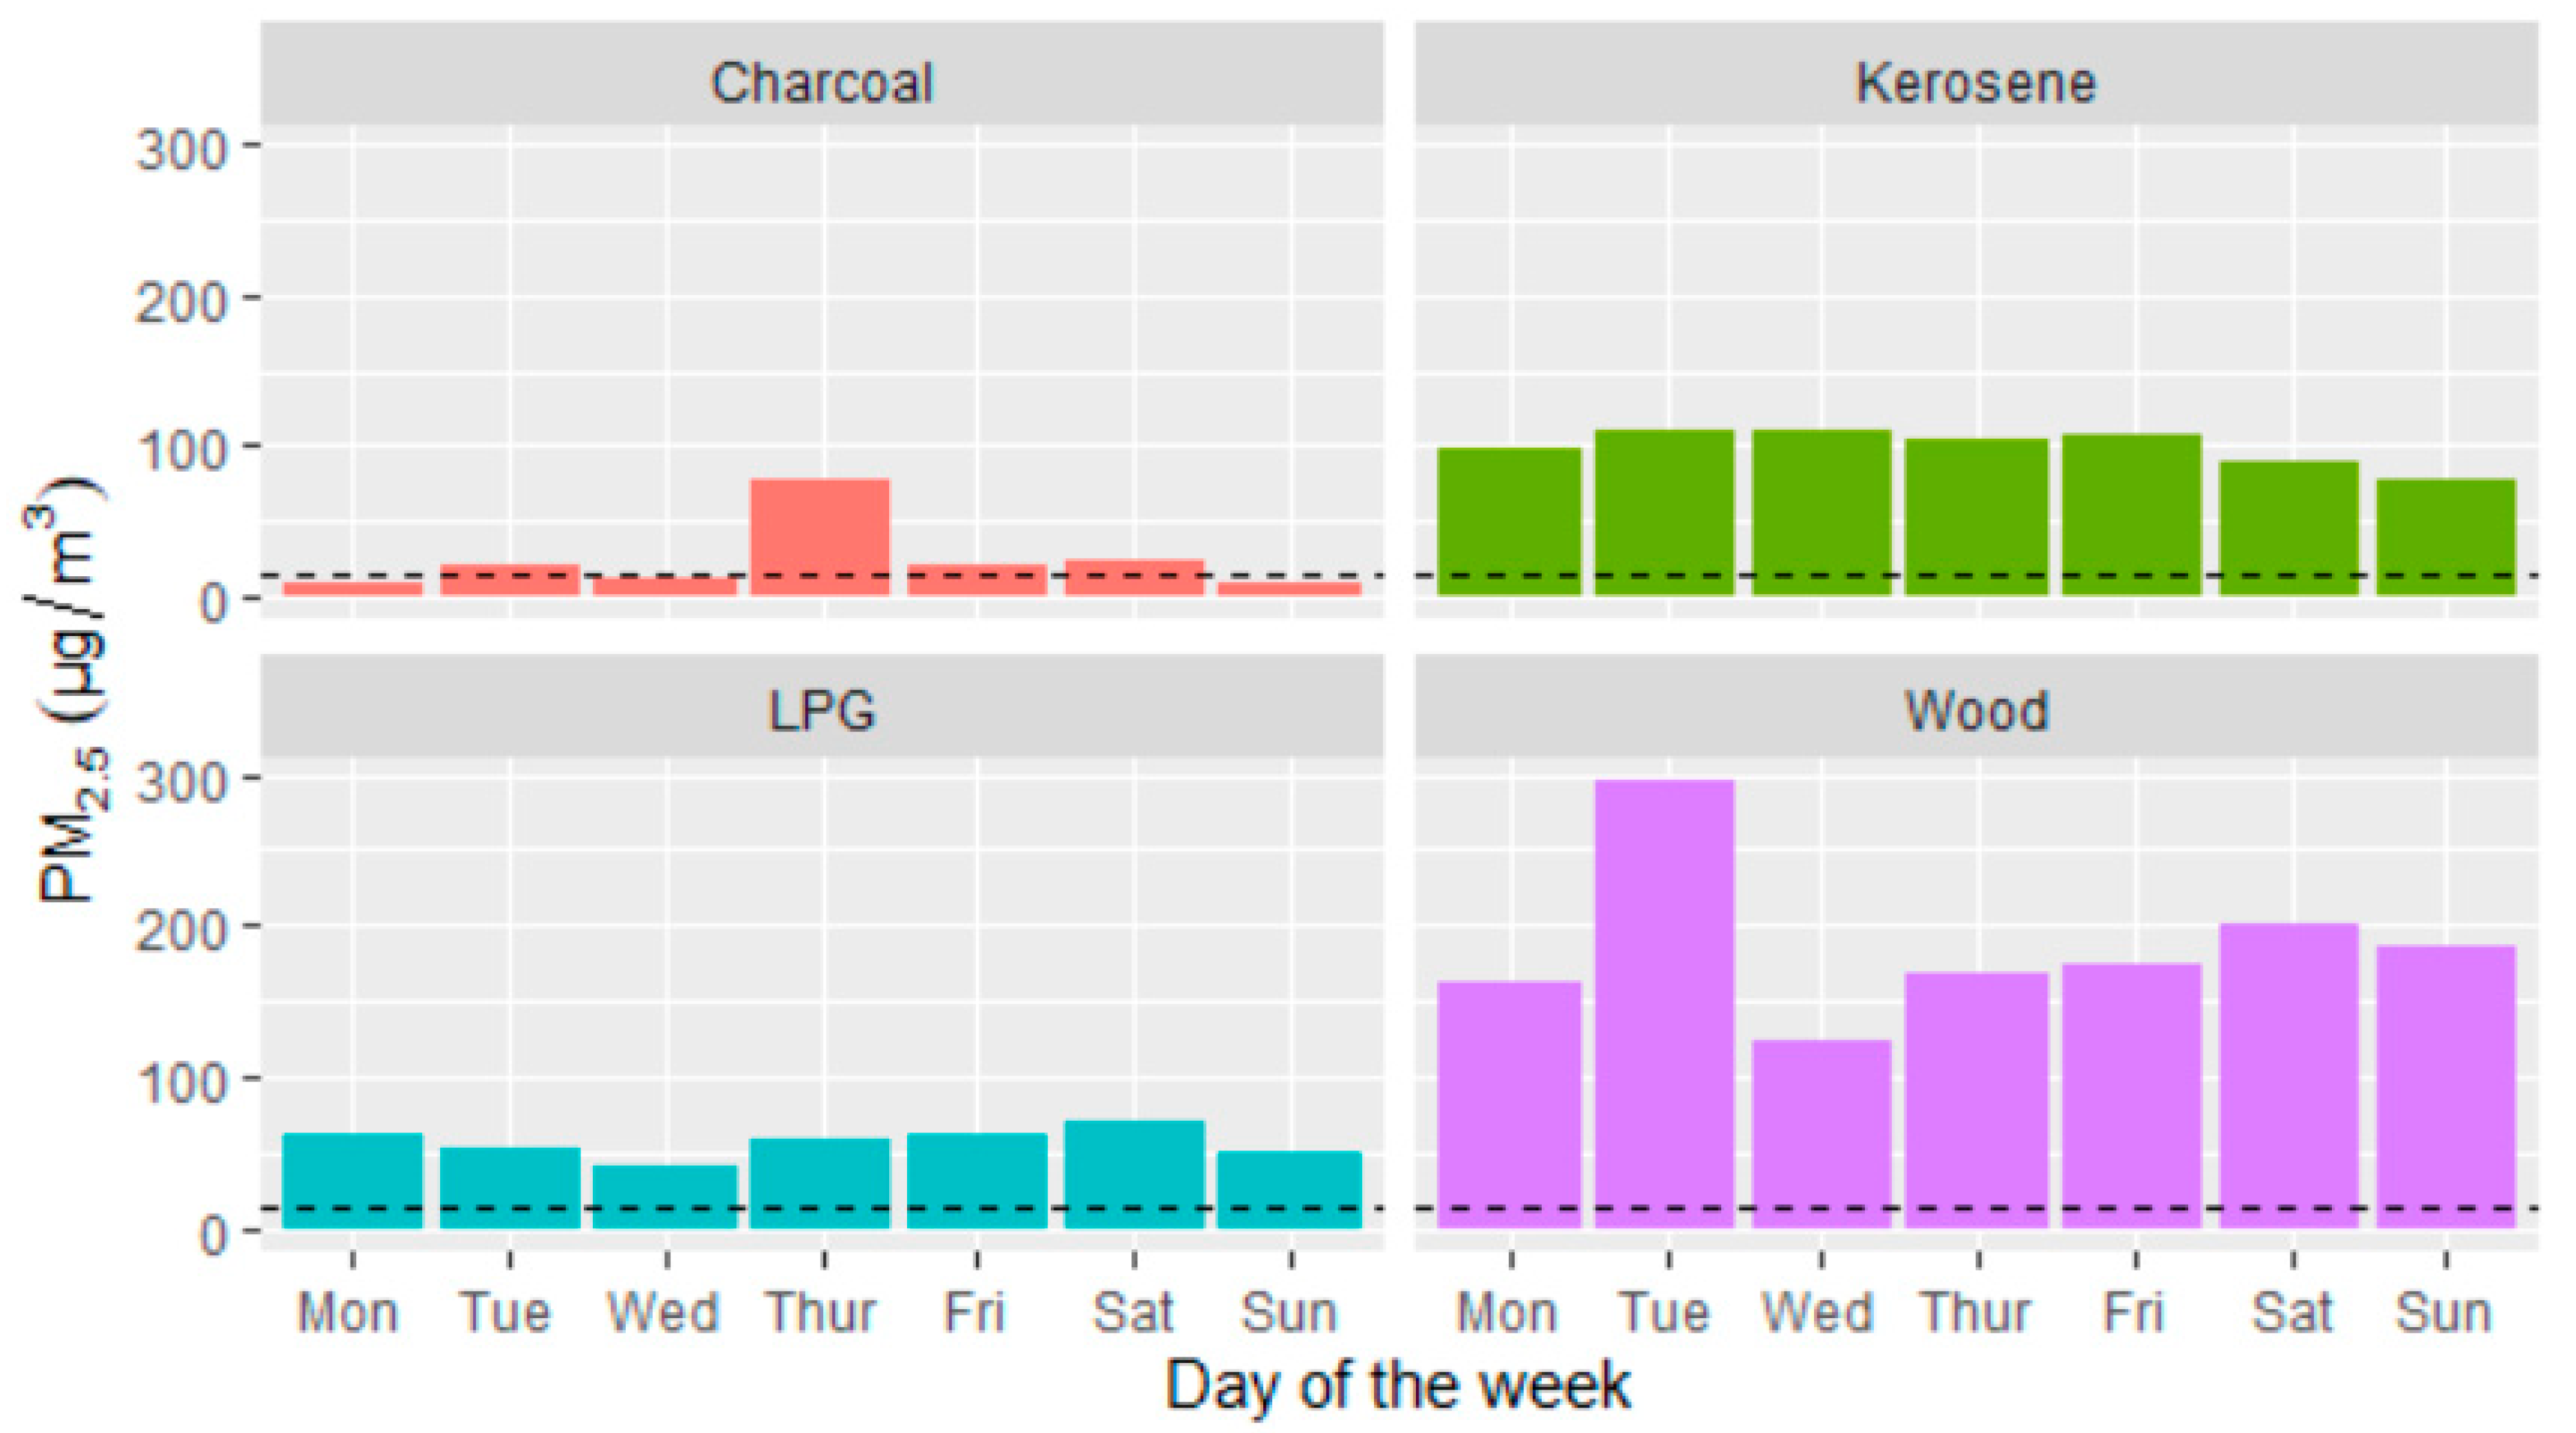
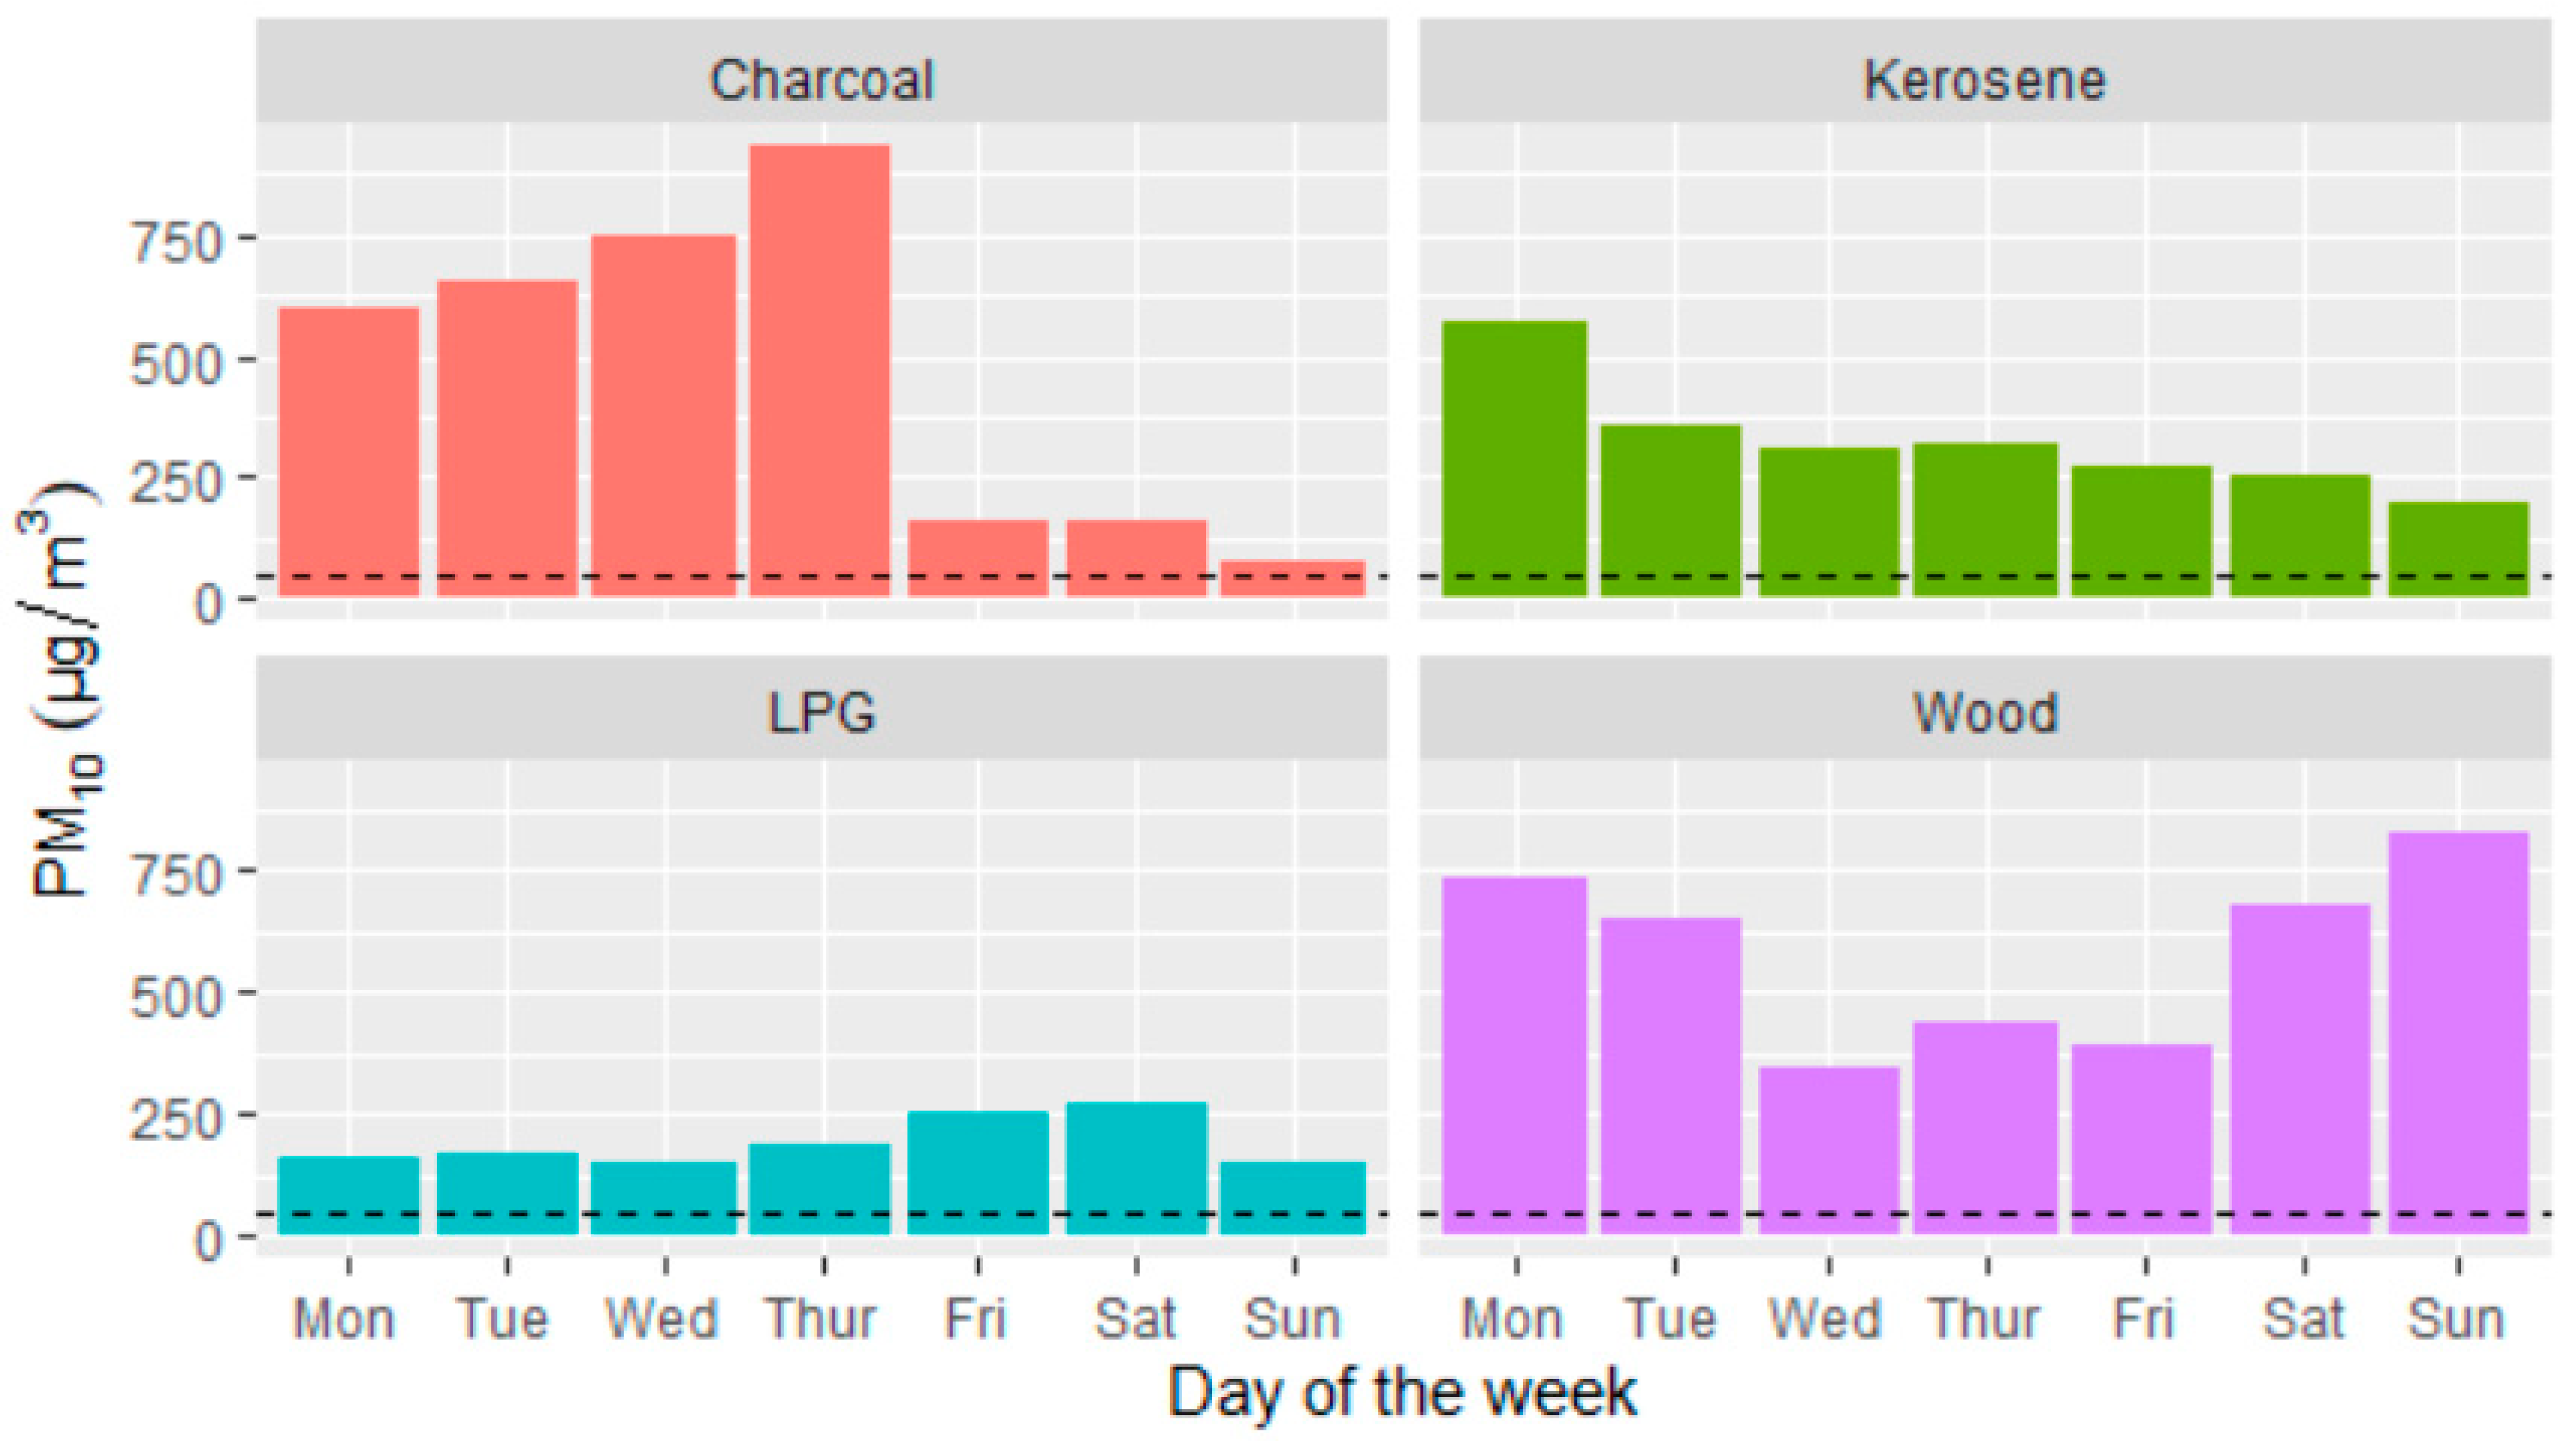
Figure 4). PM
10 concentration in LPG-using households was low and stable. PM
2.5 and PM
10 concentration varied by day of the week and was stable in kerosene- and LPG-using households (
Figure 5 and
Figure 6). In some of the days, PM
2.5 and PM
10 concentration spikes were observed in charcoal- and wood-using households. This could point to households switching between the two fuels with lower use of charcoal accompanied by increased use of wood over the weekend. This potentially points to availability of children at the end of the school week, who can accompany older females to collect more firewood for use over the weekend.
Daily mean SO
2 and NO
2 concentrations were below 1µg/m
3, which is indicative of minimal to zero traffic-related sources (
Table 3). CO emissions across different cooking fuels was low and within recommended levels (
Table 3).
4. Discussion
Our study has demonstrated the dominance of wood (94.2%) as a primary source of cooking energy for households in this rural community, while also showing the high prevalence of stacking with charcoal being the most preferred secondary fuel. Recent findings from a cooking sector study showed that 86% of rural households relied on firewood for cooking [
18].
We present the levels of gaseous emissions and particulate matter in households using wood, charcoal, LPG or kerosene as their primary cooking fuel. Daily average concentrations of PM
2.5 were high and beyond WHO limits in households using wood fuel, kerosene and LPG. Studies have found wood using homes to have extremely high particulate pollution, in some cases exceeding guideline levels in the order of 100 or higher [
10,
11,
19]. This underscores the potential risk to health in an area where 94% of households rely on wood as their primary fuel. Although LPG is a more processed fuel compared to traditional cooking fuels like wood, PM
2.5 levels in LPG using households were considerably high in this setting. This is likely due to fuel stacking practices common in rural households where emissions from traditional cooking fuels compound exposure to fine particles. Similar findings were reported for urban slum households where wood, charcoal and kerosene using homes had the highest PM
2.5 levels while LPG and electricity users also had high levels [
20]. In addition, most kitchens in the study community have earthen floors which when swept contribute to particulate pollution from dust.
Gaseous pollutants were below guideline levels. The low prevalence of LPG as well as the rural nature of the study community where traffic influence on indoor levels of SO2 and NO2 was very low explain these findings.
The spatial orientation and location of rural kitchens is a key factor to consider in characterizing collective household exposure to fine particles and toxic gases. Rural households in this community have a separate kitchen a few yards from the main house as a ‘corrective strategy’ to reduce exposure to other household members during cooking times, with the cook having the highest exposure. Therefore, these emission profiles provide crude estimates and are not an accurate measure of personal exposure to fine particles and toxic gases.
Limitations
We acknowledge the following limitations in our study:
Emissions were not analysed separately when households switched between fuels to characterize confounding secondary fuels.
We present uncorrected values since we did not collect data to compute a correction factor.
Kitchen HAP levels estimated in this study may not reflect actual exposure to individual household members. Monitoring personal exposure to fine particles and gaseous pollutants would give more accurate exposure assessment and shed light into the effectiveness of building kitchens a few yards from the main house.
The study did not assess the emissions associated with the use of LPG
We are, however, confident that the findings of this study present critical evidence needed for action to improve air quality in rural kitchens and in effect protect the health of the most exposed household members i.e., women and children.
5. Conclusions
Rural households in this study community primarily depend on wood fuel for cooking, exposing household members to fine particulate matter and toxic gases. To reduce HAP in rural households, interventions that encourage the transition to affordable cleaner fuels need to be scaled up.
Author Contributions
Conceptualization, D.M. and K.M.; Methodology, K.M.; Data Analysis and Visualization, D.M.; Resources, K.M.; Writing—Original Draft Preparation, D.M.; Writing—Original draft preparation, Review & Editing, D.M. and K.M.; Supervision, K.M.; Project administration, D.M.; Funding Acquisition, K.M. All authors have read and agreed to the published version of the manuscript.
Funding
This research was funded by the Royal Society under the FLAIR fellowship, Grant number FLR/R1/191733.
Institutional Review Board Statement
The study was conducted according to the guidelines of the Declaration of Helsinki and approved by the Ethics Committee of Amref Health Africa (protocol code AMREF-ESRC P690-2019, and 24 July 2020). The National Commission for Science, Technology and Innovation granted a research permit (License No.: NACOSTI/P/20/3410 and NACOSTI/P21/8989) for the study.
Informed Consent Statement
Informed consent was obtained from all subjects involved in the study.
Data Availability Statement
The data presented in this study are available on request from the corresponding author. The data are not publicly available because the study is still ongoing. Data anonymization and upload to a public portal would only be possible after closure of the project.
Acknowledgments
We are thankful to community members in Mbiuni-Kathama for taking part in the study and providing invaluable insights regarding cooking fuels. Additionally we thank local leaders whose support ensured our entry into the community to conduct the study. Finally, we are grateful to the Royal Society for funding this work under the FLAIR fellowship (FLR/R1/191733).
Conflicts of Interest
The authors declare no conflict of interest. The funders had no role in the design of the study; in the collection, analyses, or interpretation of data; in the writing of the manuscript; or in the decision to publish the results
Appendix A
Table A1.
Distribution of primary and secondary fuels in households recruited for air quality monitoring.
Table A1.
Distribution of primary and secondary fuels in households recruited for air quality monitoring.
| Primary Fuel | Secondary Fuel | Total |
|---|
| Wood | Charcoal | LPG | Kerosene | None |
|---|
| Wood | | 5 | | | 3 | 8 |
| Charcoal | | | | 3 | | 3 |
| LPG | 1 | 3 | | 1 | | 2 |
| Kerosene | | 2 | | | | 5 |
Table A2.
Hours per day when particulate matter monitoring was done in different households.
Table A2.
Hours per day when particulate matter monitoring was done in different households.
| Primary Fuel | HH No | Hours Monitored Per Day | Days Monitored |
|---|
| Wood | | Day 1 | Day 2 | Day 3 | Day 4 | |
| 4 * | 24 | | | | 1 |
| 5 | 23 | 23 | 24 | 24 | 4 |
| 6 | 24 | 24 | 24 | | 3 |
| 7 | 18 | 24 | 16 | 24 | 4 |
| 8 * | 23 | 11 | | | 2 |
| 9 | 24 | 24 | 24 | | 3 |
| 11 | 24 | 24 | 24 | 22 | 4 |
| 12 | 24 | 23 | 23 | 24 | 4 |
| 13 | 24 | 24 | 24 | 19 | 4 |
| 20 | 24 | 24 | 24 | 24 | 4 |
| Charcoal | 14 | 21 | 24 | 24 | 24 | 4 |
| 17 | 24 | 24 | 24 | 24 | 4 |
| 19 | 24 | 20 | 15 | | 3 |
| LPG | 1 | 24 | 24 | 22 | 24 | 4 |
| 2 | 22 | 24 | 24 | | 4 |
| 10 | 24 | 24 | 20 | | 3 |
| 15 | 22 | 24 | 24 | 20 | 4 |
| 18 | 12 | 16 | 12 | 8 | 4 |
| Kerosene | 3 | 24 | 24 | 24 | 24 | 4 |
| 16 | 24 | 24 | 24 | 24 | 4 |
References
- WHO. Household Air Pollution and Health. 2021. Available online: https://www.who.int/news-room/fact-sheets/detail/household-air-pollution-and-health (accessed on 14 June 2022).
- KNBS. 2019 Kenya Population and Housing Census Volume IV: Distribution of Population by Socio-Economic Characteristics. Kenya National Bureau of Statistics. 2019. Available online: https://www.knbs.or.ke/download/2019-kenya-population-and-housing-census-volume-iv-distribution-of-population-by-socio-economic-characteristics/ (accessed on 14 June 2022).
- Parikh, J. Hardships and health impacts on women due to traditional cooking fuels: A case study of Himachal Pradesh, India. Energy Policy 2011, 39, 7587–7594. [Google Scholar]
- Bickton, F.M.; Ndeketa, L.; Sibande, G.T.; Nkeramahame, J.; Payesa, C.; Milanzi, E.B. Household air pollution and under-five mortality in sub-Saharan Africa: An analysis of 14 demographic and health surveys. Environ. Health Prev. Med. 2020, 25, 67. [Google Scholar]
- Njenga, M.; Gitau, J.K.; Mendum, R. Women’s work is never done: Lifting the gendered burden of firewood collection and household energy use in Kenya. Energy Res. Soc. Sci. 2021, 77, 102071. [Google Scholar]
- Okello, G.; Devereux, G.; Semple, S. Women and girls in resource poor countries experience much greater exposure to household air pollutants than men: Results from Uganda and Ethiopia. Environ. Int. 2018, 119, 429–437. [Google Scholar]
- Owili, P.O.; Muga, M.A.; Pan, W.C.; Kuo, H.W. Cooking fuel and risk of under-five mortality in 23 Sub-Saharan African countries: A population-based study. Int. J. Environ. Health Res. 2017, 27, 191–204. [Google Scholar]
- Roberman, J.; Emeto, T.I.; Adegboye, O.A. Adverse Birth Outcomes Due to Exposure to Household Air Pollution from Unclean Cooking Fuel among Women of Reproductive Age in Nigeria. Int. J. Environ. Res. Public Health 2021, 18, E634. [Google Scholar]
- Po, J.Y.T.; FitzGerald, J.M.; Carlsten, C. Respiratory disease associated with solid biomass fuel exposure in rural women and children: Systematic review and meta-analysis. Thorax 2011, 66, 232–239. [Google Scholar]
- Ezzati, M.; Saleh, H.; Kammen, D.M. The contributions of emissions and spatial microenvironments to exposure to indoor air pollution from biomass combustion in Kenya. Environ. Health Perspect. 2000, 108, 833–839. [Google Scholar]
- Bruce, N.; Bates, E.; Nguti, R.; Gitonga, S.; Kithinji, J.; Doig, A. Reducing Indoor Air Pollution through Participatory Development in Rural Kenya. Indoor Air 2002. Available online: https://www.researchgate.net/publication/248762862_Reducing_Indoor_Air_Pollution_through_Participatory_Development_in_Rural_Kenya/citation/download (accessed on 14 June 2022).
- Ochieng, C.A.; Vardoulakis, S.; Tonne, C. Are rocket mud stoves associated with lower indoor carbon monoxide and personal exposure in rural Kenya? Indoor Air 2013, 23, 14–24. [Google Scholar]
- Majdan, M.; Svaro, M.; Bodo, J.; Taylor, M.; Muendo, R.M. Assessment of the biomass related indoor air pollution in Kwale district in Kenya using short term monitoring. Afr. Health Sci. 2015, 15, 972–981. [Google Scholar]
- Fullerton, D.G.; Semple, S.; Kalambo, F.; Suseno, A.; Malamba, R.; Henderson, G.; Ayres, J.G.; Gordon, S.B. Biomass fuel use and indoor air pollution in homes in Malawi. Occup. Environ. Med. 2009, 66, 777–783. [Google Scholar]
- Dionisio, K.L.; Howie, S.; Fornace, K.M.; Chimah, O.; Adegbola, R.A.; Ezzati, M. Measuring the exposure of infants and children to indoor air pollution from biomass fuels in The Gambia. Indoor Air 2008, 18, 317–327. [Google Scholar]
- Van Vliet, E.D.S.; Asante, K.; Jack, D.W.; Kinney, P.L.; Whyatt, R.M.; Chillrud, S.N.; Livesy, A.; Charles, Z.; Seth, O. Personal exposures to fine particulate matter and black carbon in households cooking with biomass fuels in rural Ghana. Environ. Res. 2013, 127, 40–48. [Google Scholar]
- StataCorp. Stata Statistical Software: Release 15; StataCorp LLC.: College Station, TX, USA, 2017. [Google Scholar]
- KHCSS. Publication-Kenya Household Cooking Sector Study, 2019-Energypedia. 2019. Available online: https://energypedia.info/wiki/Publication_-_Kenya_Household_Cooking_Sector_Study,_2019 (accessed on 14 June 2022).
- Irankunda, E.; Gasore, J. Assessing the Effects of Household Wood Burning on Particulate Matter in Rwanda. Int. J. Environ. Sustain. Dev. 2021, 10, 2312–5764. [Google Scholar]
- Muindi, K.; Kimani-Murage, E.; Egondi, T.; Rocklov, J.; Ng, N. Household Air Pollution: Sources and Exposure Levels to Fine Particulate Matter in Nairobi Slums. Toxics 2016, 4, 12. [Google Scholar]
| Publisher’s Note: MDPI stays neutral with regard to jurisdictional claims in published maps and institutional affiliations. |
© 2022 by the authors. Licensee MDPI, Basel, Switzerland. This article is an open access article distributed under the terms and conditions of the Creative Commons Attribution (CC BY) license (https://creativecommons.org/licenses/by/4.0/).


