Article

Lightning Identification Method Based on Deep Learning

1
Ningbo Meteorological Service Center, Ningbo 315012, China
2
Ningbo Meteorological Safety Technology Center, Ningbo 315012, China
3
School of Computer Science, Hangzhou Dianzi University, Xiasha Higher Education Zone, Hangzhou 310018, China
4
Ningbo Meteorological Network and Equipment Support Center, Ningbo 315012, China
5
Key Laboratory of Atmosphere Sounding, China Meteorological Administration, Chengdu 610225, China
6
Xiangshan Meteorological Bureau, Ningbo 315600, China
*
Author to whom correspondence should be addressed.
Atmosphere 2022, 13(12), 2112; https://doi.org/10.3390/atmos13122112
Submission received: 28 September 2022 / Revised: 18 November 2022 / Accepted: 13 December 2022 / Published: 16 December 2022

Abstract

:
In this study, a deep learning method called Lightning-SN was developed and used for cloud-to-ground (CG) lightning identification. Based on artificial scenarios, this network model selects radar products that exhibit characteristic factors closely related to lightning. Advanced time of arrival and direction lightning positioning data were used as the labeling factors. The Lightning-SN model was constructed based on an encoder–decoder structure with 25 convolutional layers, five pooling layers, five upsampling layers, and a sigmoid activation function layer. Additionally, the maximum pooling index method was adopted in Lightning-SN to avoid characteristic boundary information loss in the pooling process. The gradient harmonizing mechanism was used as the loss function to improve the model performance. The evaluation results showed that the Lightning-SN improved the segmentation accuracy of the CG lightning location compared with the traditional threshold method, according to the 6-minute operating period of the current S-band Doppler radar, exhibiting a better performance in terms of lightning location identification based on high-resolution radar data. The model was applied to the Ningbo area of Zhejiang Province, China. It was applied to the lightning hazard prevention in the hazardous chemical park in Ningbo. The composite reflectivity and radial velocity were the two dominant factors, with a greater influence on the model performance than other factors.

1. Introduction

Lightning is a type of intensive discharge phenomenon that can produce instantaneous destruction because of the powerful currents, scorching heat, intense electromagnetic radiation, violent shock waves, and other physical effects it produces. Lightning itself can be divided into intra-cloud lightning, which does not come into contact with the ground, and cloud-to-ground (CG) lightning. However, CG lightning is the primary cause of lightning disasters, making it the focus of lightning monitoring. The meso- and small-scale features of strong convective weather make it difficult to monitor and provide early thunderstorm warnings [1].
Advanced time of arrival and direction (ADTD) lightning positioning has been widely used in the field of lightning monitoring and warning [2,3]. The time of arrival (TOA) positioning technique adopted in this system uses the time difference between the arrival of lightning-generated electromagnetic pulses at different stations to position and locate the lightning. The lightning positioning data obtained using the TOA method are CG lightning data. Moreover, the ADTD system can be used to obtain the geographic position of the CG lightning, its amplitude, polarity, and other parameters. It is an important tool for analyzing the spatiotemporal distribution of CG lightning activity [4]. Owing to environmental interference, the actual TOA detection errors can reach several hundred meters or even several kilometers, and the detection efficiency is not uniform [5]. Although the ADTD lightning positioning system is a real-time monitoring system, it is unable to identify the structure and evolution of convective weather, making it difficult to construct models for its generation, dissipation, and evolution [6].
Weather radar is one of the tools for strong convective weather monitoring and can detect the structure of convective systems over a broad area with high spatiotemporal resolution [7]. Consequently, meteorologists have proposed various methods for thunderstorm weather monitoring and warning based on radar data. Previous studies have mainly focused on threshold parameter extraction for lightning occurrence by analyzing radar data [8,9], including echo intensity (reflectivity), radial velocity, and spectral width. Physical variables with clear meteorological meaning can be obtained by examining raw radar data [10]. Li et al. [11] proposed nine identification indicators based on radar echo intensity products at different heights. Through a comparative analysis of these nine indicators, the lightning identification indicators for thunderstorms in Nanjing, China, could be obtained—that is, a −10 °C altitude and an approximate echo intensity of 40 dBz. These results were consistent with those of previous studies [12,13,14]. Based on these indexes, a statistical analysis was conducted of 41 convective cloud clusters within 200 km of the Qihe radar station, China, in July–August 2009 and June 2010 [15]. The results showed that the probability of detection (POD) was 96%, the false alarm ratio (FAR) was 14%, and the critical success index (CSI) was 83% [15].
Most traditional identification methods employ the principle of characteristic thresholds. They require extensive prior knowledge and do not benefit from abundant historical data. Despite the advantages of simplicity and efficiency, they only consider the radar echo characteristics at grid points, and spatial variations are not considered. Consequently, these methods are sensitive to noise and have a high FAR and poor performance in nonlinear processes, such as strong convective weather. Accordingly, the study of the spatiotemporal relationship between CG lightning and radar products to establish an identification algorithm for nonlinear lightning areas based on radar data—which could result in better lightning monitoring and early warning—is of great significance.
Deep learning (DL) is a new branch of machine learning. It has garnered wide attention in many fields, including voice and image recognition, and computer vision. In general, machine learning methods require specialized prior knowledge, and the features are selected manually. However, DL methods avoid these drawbacks. By constructing DL models with many hidden layers, DL methods can learn features using large volumes of training data, improving feature representation [16]. Lightning area identification involves identifying the time and area where lightning could possibly occur based on available meteorological data. Semantic segmentation networks in the field of DL assign each pixel of an input image with a semantic category, before obtaining a dense pixel-wise classification.
The fully convolutional neural network (FCNN) was first proposed in 2015 and realized pixel-level semantic segmentation [17]. The FCNN algorithm replaced the full connection layer of the convolutional neural network (CNN) with a 1 × 1 convolution layer to achieve pixel-level dense prediction. Deconvolution was used to upsample the feature map, and a jump layer connection was proposed to fully integrate the global semantic information and the local position information to achieve accurate segmentation. Although the FCNN could realize the conversion from a classification network to a segmentation network, the upsampling process was still rough, resulting in significant semantic information loss in the feature map, heavily impacting segmentation accuracy [18]. Consequently, Liu et al. [19] constructed an inversion algorithm for daytime sea fog based on geostationary meteorological satellite data, which used an FCNN for preprocessing and a fully connected conditional random field (CRF) for post processing. With the help of the CRF, this algorithm could overcome the problem of over-smoothed and ambiguous images extracted using the FCNN and provide clearer fog area boundaries. Additionally, researchers have attempted to distinguish between pixel-wise clouds and snow based on the FCNN algorithm and GF-1 satellite remote sensing images [20]. SegNet (Vijay Badrinarayanan, Cambridge, UK) is a semantic-segmentation network that can transfer the location index of the maximum pooling values to a decoder to further improve the resolution of segmented images [21]. Consequently, many scholars have applied SegNet to image segmentation. For example, Li et al. [22] applied SegNet to perform effective cloud classification by training a cloud classification neural network based on multiangle remote sensing image information. Using multi-source observational data and high-resolution numerical forecast data, Zhou et al. [23] established a lightning nowcast model based on the SegNet semantic segmentation model. The performance of the nowcast model was considerably better than that of traditional methods. However, its algorithm was aimed at forecasting, and the model structure was unsuitable for identification assignment. The employed data were mainly satellite data, and the spatiotemporal resolution could not satisfy the requirements of refined meteorological services. Among radar products, only composite reflectivity was used; thus, it was difficult to reflect the spatial structure of the cloud body. The model used cross-entropy as the loss function, so the effects of detection error and sample imbalance on model performance could not be eliminated.
At present, a key challenge for lightning warning services is to further exploit deep semantic segmentation algorithms to achieve more accurate lightning location identification by extracting lightning features from meteorological data with high spatiotemporal resolution.
Owing to the overlapping physical meaning of radar products, the characteristic factors in DL algorithms have not improved [24,25]. Consequently, based on the spatiotemporal correlation between lightning and radar data, this study referred to the results of previous studies and manual experience to select radar products that were closely related to the characteristic factors of lightning—including composite reflectivity (CR), echo-top (ET) height, radial velocity (V), liquid water content (LWC), and the echo of the plane-position indicator (PPI). Quality-controlled lightning positioning data were used as labeling factors. Based on SegNet, the model structure was further optimized after considering the large sample imbalances and the characteristics of radar data, after which the lightning features were extracted from the radar products. Finally, the model performance was validated experimentally, and the importance of each characteristic factor in the model was examined. Different types of strong convection were tested to compare and analyze the performance of the proposed model, the traditional threshold method, and other semantic segmentation methods.

2. Methods: Data Sources and Preprocessing
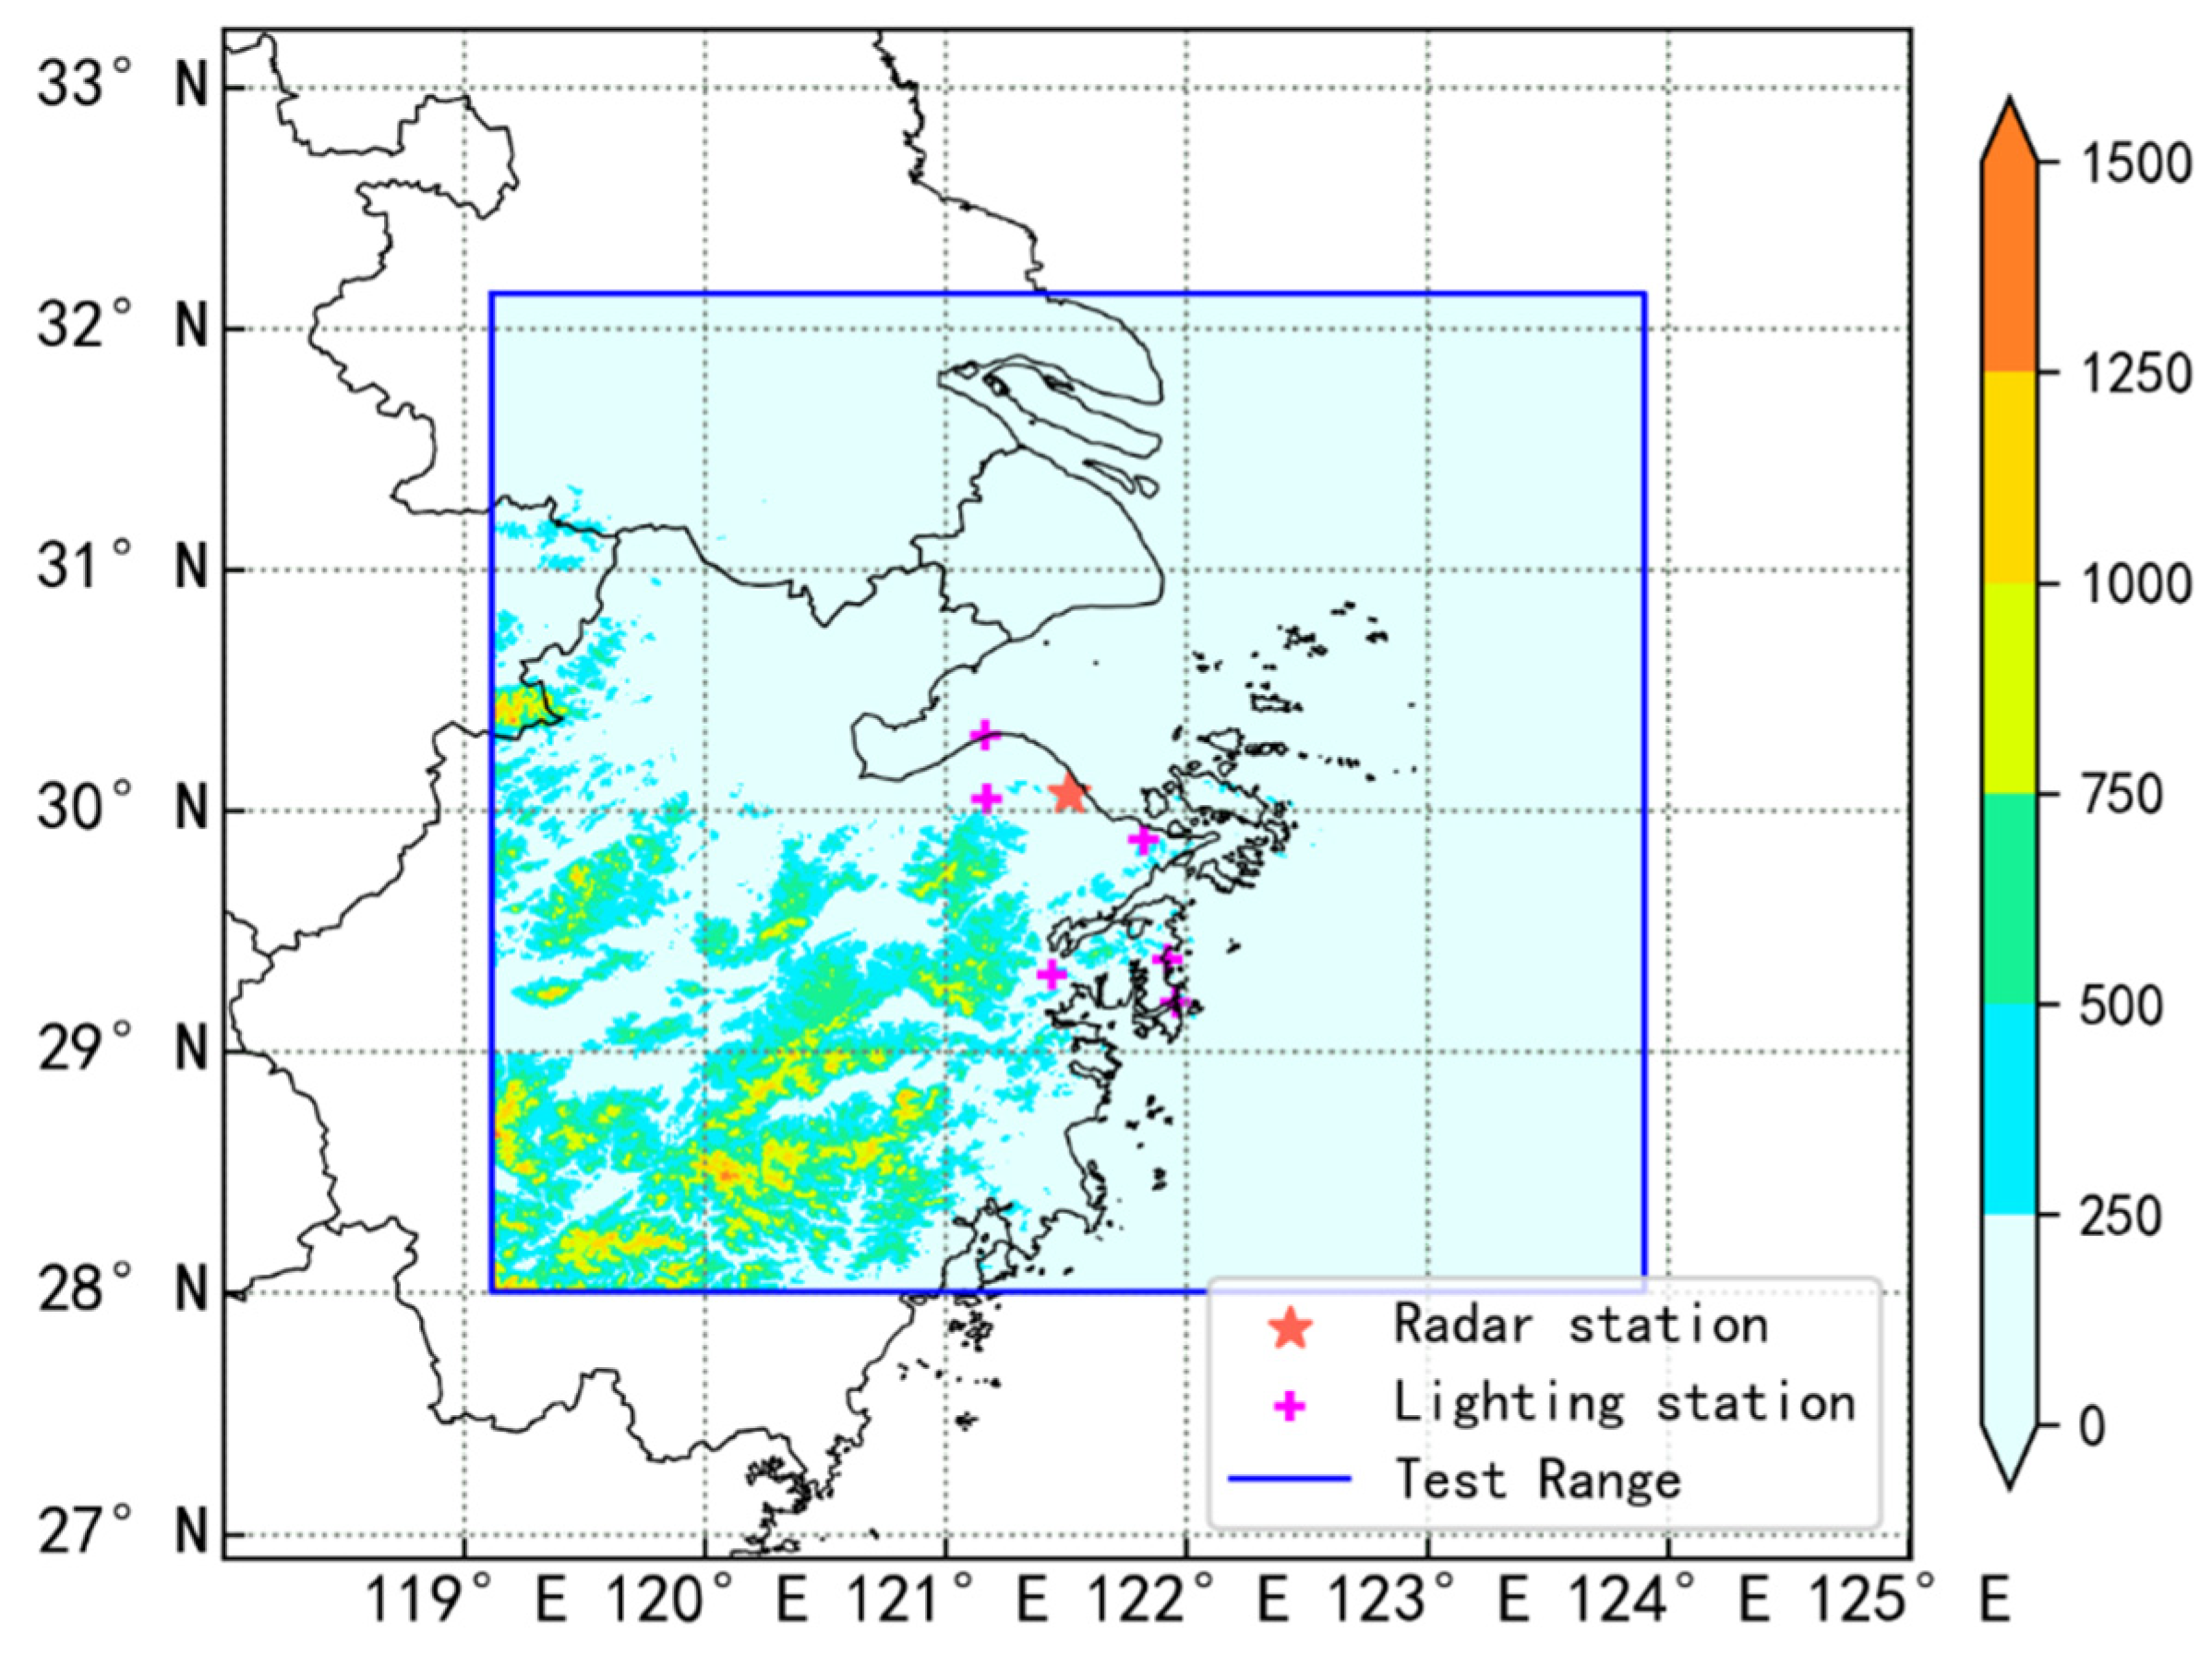
2.1. Data Sources

The data used in this study included S-band Doppler radar data and CG lightning records from the ADTD lightning positioning system provided by the Ningbo Meteorological Bureau between August 2009 and December 2021. As shown in Figure 1, the radar is located on Dapeng Mountain, Ningbo City, China (30.0697° N, 121.5094° E). In 2019, the radar was upgraded to a dual-polarization radar with a resolution of 250 m. However, to fully utilize the historical data, all the radar data used in this study were single-polarization data. The single-polarization radar had an effective detection radius of 230 km and a spatiotemporal resolution of 1 km and 6 min. The ADTD lightning positioning system comprised six observation stations (Beilun, Yuyao, Hangzhou Bay, Ninghai, Damutu, and Shipu) and one central data processing system. The theoretical detection efficiency of the system was 80%, the temporal resolution of the CG lightning monitoring was of the order of milliseconds, and the theoretical spatial resolution was 300 m.
Nineteen radar products were utilized as the characteristic factors in this study (Table 1), including ET, CR, V, vertically integrated liquid (VIL), vertically integrated liquid density (VILD), recognition of clouds (ROC), and PPI. The ET indicates the strength of vertical airflow within a thunderstorm—that is, the higher the ET, the more intensive the convection. The ET is an essential factor in strong lightning processes [26]. The echo intensity, expressed as the PPI and CR, reflects the development stage of convection. The spatial distribution of lightning is consistent with that of strong echoes [27]. The V product can reveal the strengthening or weakening of lightning activity. To some extent, there is a correlation between the V product and the lightning activity [28]. Both the VIL and VILD indicate the water vapor conditions in the convective cloud, with suitable water vapor being favorable for lightning generation [29]. The ROC product combines the SHY95 method and the Biggerstaff and Listemaa (BL) algorithm to distinguish stratus, warm clouds, and convective clouds [30,31]. The probability of lightning in different cloud bodies varies, and convective clouds are most likely to produce it. The CR at different altitudes and V and PPI at different elevation angles help to better extract the spatial characteristics of lightning.
The electromagnetic waves generated in CG lightning return strokes can be used for lightning positioning. The positioning accuracy of the system can be affected by the positioning technology, terrain environment, and climatic conditions, which can greatly impact the quality of the labeling factor. Accordingly, quality control of the lightning positioning data is required to ensure data accuracy. In the 1980s, it was proposed that ADTD lightning positioning systems could mistake intra-cloud lightning for CG lightning [32]. In this study, following the suggestion of the IEEE working group, CG lightning data with an absolute current amplitude of less than 2 kA and greater than 200 kA were removed [33]. Based on the measurement principle, there are four types of CG lightning positioning methods: two-station amplitude, two-station hybrid, three-station hybrid, and four-station algorithm methods. It was found that errors were produced primarily by the first two methods, whereas the three-station hybrid and four-station algorithms exhibited smaller errors [34]. Data quality is one of the factors that determines model performance. Based on the technical requirements for lightning monitoring and warning in explosive and fire-hazardous places (Standard No. T/CMSA0012-2019) [35], the algorithm records the data of three stations or more to improve the quality of the labeling factors as much as possible. In this study, the overlapping area (28.0492°–32.0812° N, 119.185°–123.8442° E) of the radar and lightning positioning system was chosen as the experimental area to test the proposed algorithm. The horizontal resolution of the experimental area was 1 × 1 km, with 448 × 448 grid points.

2.2. Data Preprocessing

First, the 19 radar products were converted from polar coordinates to Earth coordinates (latitude and longitude) and then interpolated to 448 × 448 grids. Subsequently, the data were folded into a three-dimensional grid of size 448 × 448 × 19 based on the corresponding spatial dimension. Lightning records could be obtained for each scanning period based on the starting and ending times of the volume scan. The records were mapped onto 448 × 448 grids based on the spatial relationship of the radar data. For each grid, the data denote whether lightning occurs within 1 km2 of the surrounding area during each volume scan. The value was set to one for occurrence and zero for non-occurrence. Finally, the characteristic and label factors were folded into the data samples of lightning identification with a size of 448 × 448 × 20.
The radar and lightning data between August 2009 and September 2021 were selected for this study, permitting the construction of a sample dataset A. Owing to the meso- and small-scale characteristics of severe convective weather, the positive and negative CG lightning volume imbalance in the samples was a challenge for model training. As the accuracy of the model without lightning prediction is relatively good, the data selection needed to be adjusted to reduce the model losses caused by negative samples—that is, the lightning occurrence frequency in the volume scanning period was chosen as an indicator to select as many lightning occurrence samples as possible for model training. As the frequency of lightning per unit time is inversely proportional to its probability, the higher the set lightning number threshold, the smaller the number of data samples available. A decrease in the number of samples reduces the generalization performance of the model. Consequently, the lightning number and sample number thresholds were mutually constrained for model performance. To select the appropriate lightning number threshold, 580,168 samples were extracted from dataset A for the period 2011 to 2017. Furthermore, 30,628 data samples with lightning were extracted and used to generate pre-training dataset B. The number of samples in dataset B was approximately 5.28% of that in dataset A, and the maximum value of the lightning number was 672. The samples in dataset B were then classified into 10 categories according to the multiple relationships of the lightning number, the number in each category being counted separately. The classification statistics are shown in Figure 2.
To identify the appropriate lightning number threshold, this study conducted pre–training on dataset B. The specific method was to first divide sample dataset B into a training dataset and test dataset at a ratio of 9:1. The training dataset was then filtered one-by-one using thresholds of 1, 2, 4, 8, 16, 32, 64, 128, 256, and 512. After each filtering, the training dataset was pre-trained using the SegNet model. The validation set was then randomly selected from the filtered training set during the training process, its number accounting for 10% of the total number of training sets. The model loss function used cross-entropy with a model learning efficiency of 0.001. The test dataset was evaluated using the CSI after pre-training. Figure 2 shows the variations in algorithm performance for different threshold cases. It is evident that the algorithm performance increases and then decreases as the number of training datasets decreases. The optimal lightning threshold was found to be between 4 and 16. The filtering and pre-training procedures were then repeated using this threshold range as a boundary and setting the variation step of the lightning number threshold to 1. The lightning number threshold with the best performance was 10. Finally, sample dataset A was filtered with a lightning threshold of 10 to obtain sample dataset C for formal model training. The ratio of the CG positive to negative category in dataset C was 0.00014. Sample dataset C was divided into training and testing datasets at a ratio of 10:1, while the validation dataset was randomly selected from the training dataset during the training process, the number being 20% of the total training dataset. Considering the specificity of the elevation angle of the radar echo data, each grid corresponded to a different spatial distance and altitude. Consequently, conventional data enhancement methods—such as displacement, rotation, and deformation—were not adopted.

3. Deep Learning (DL) Network

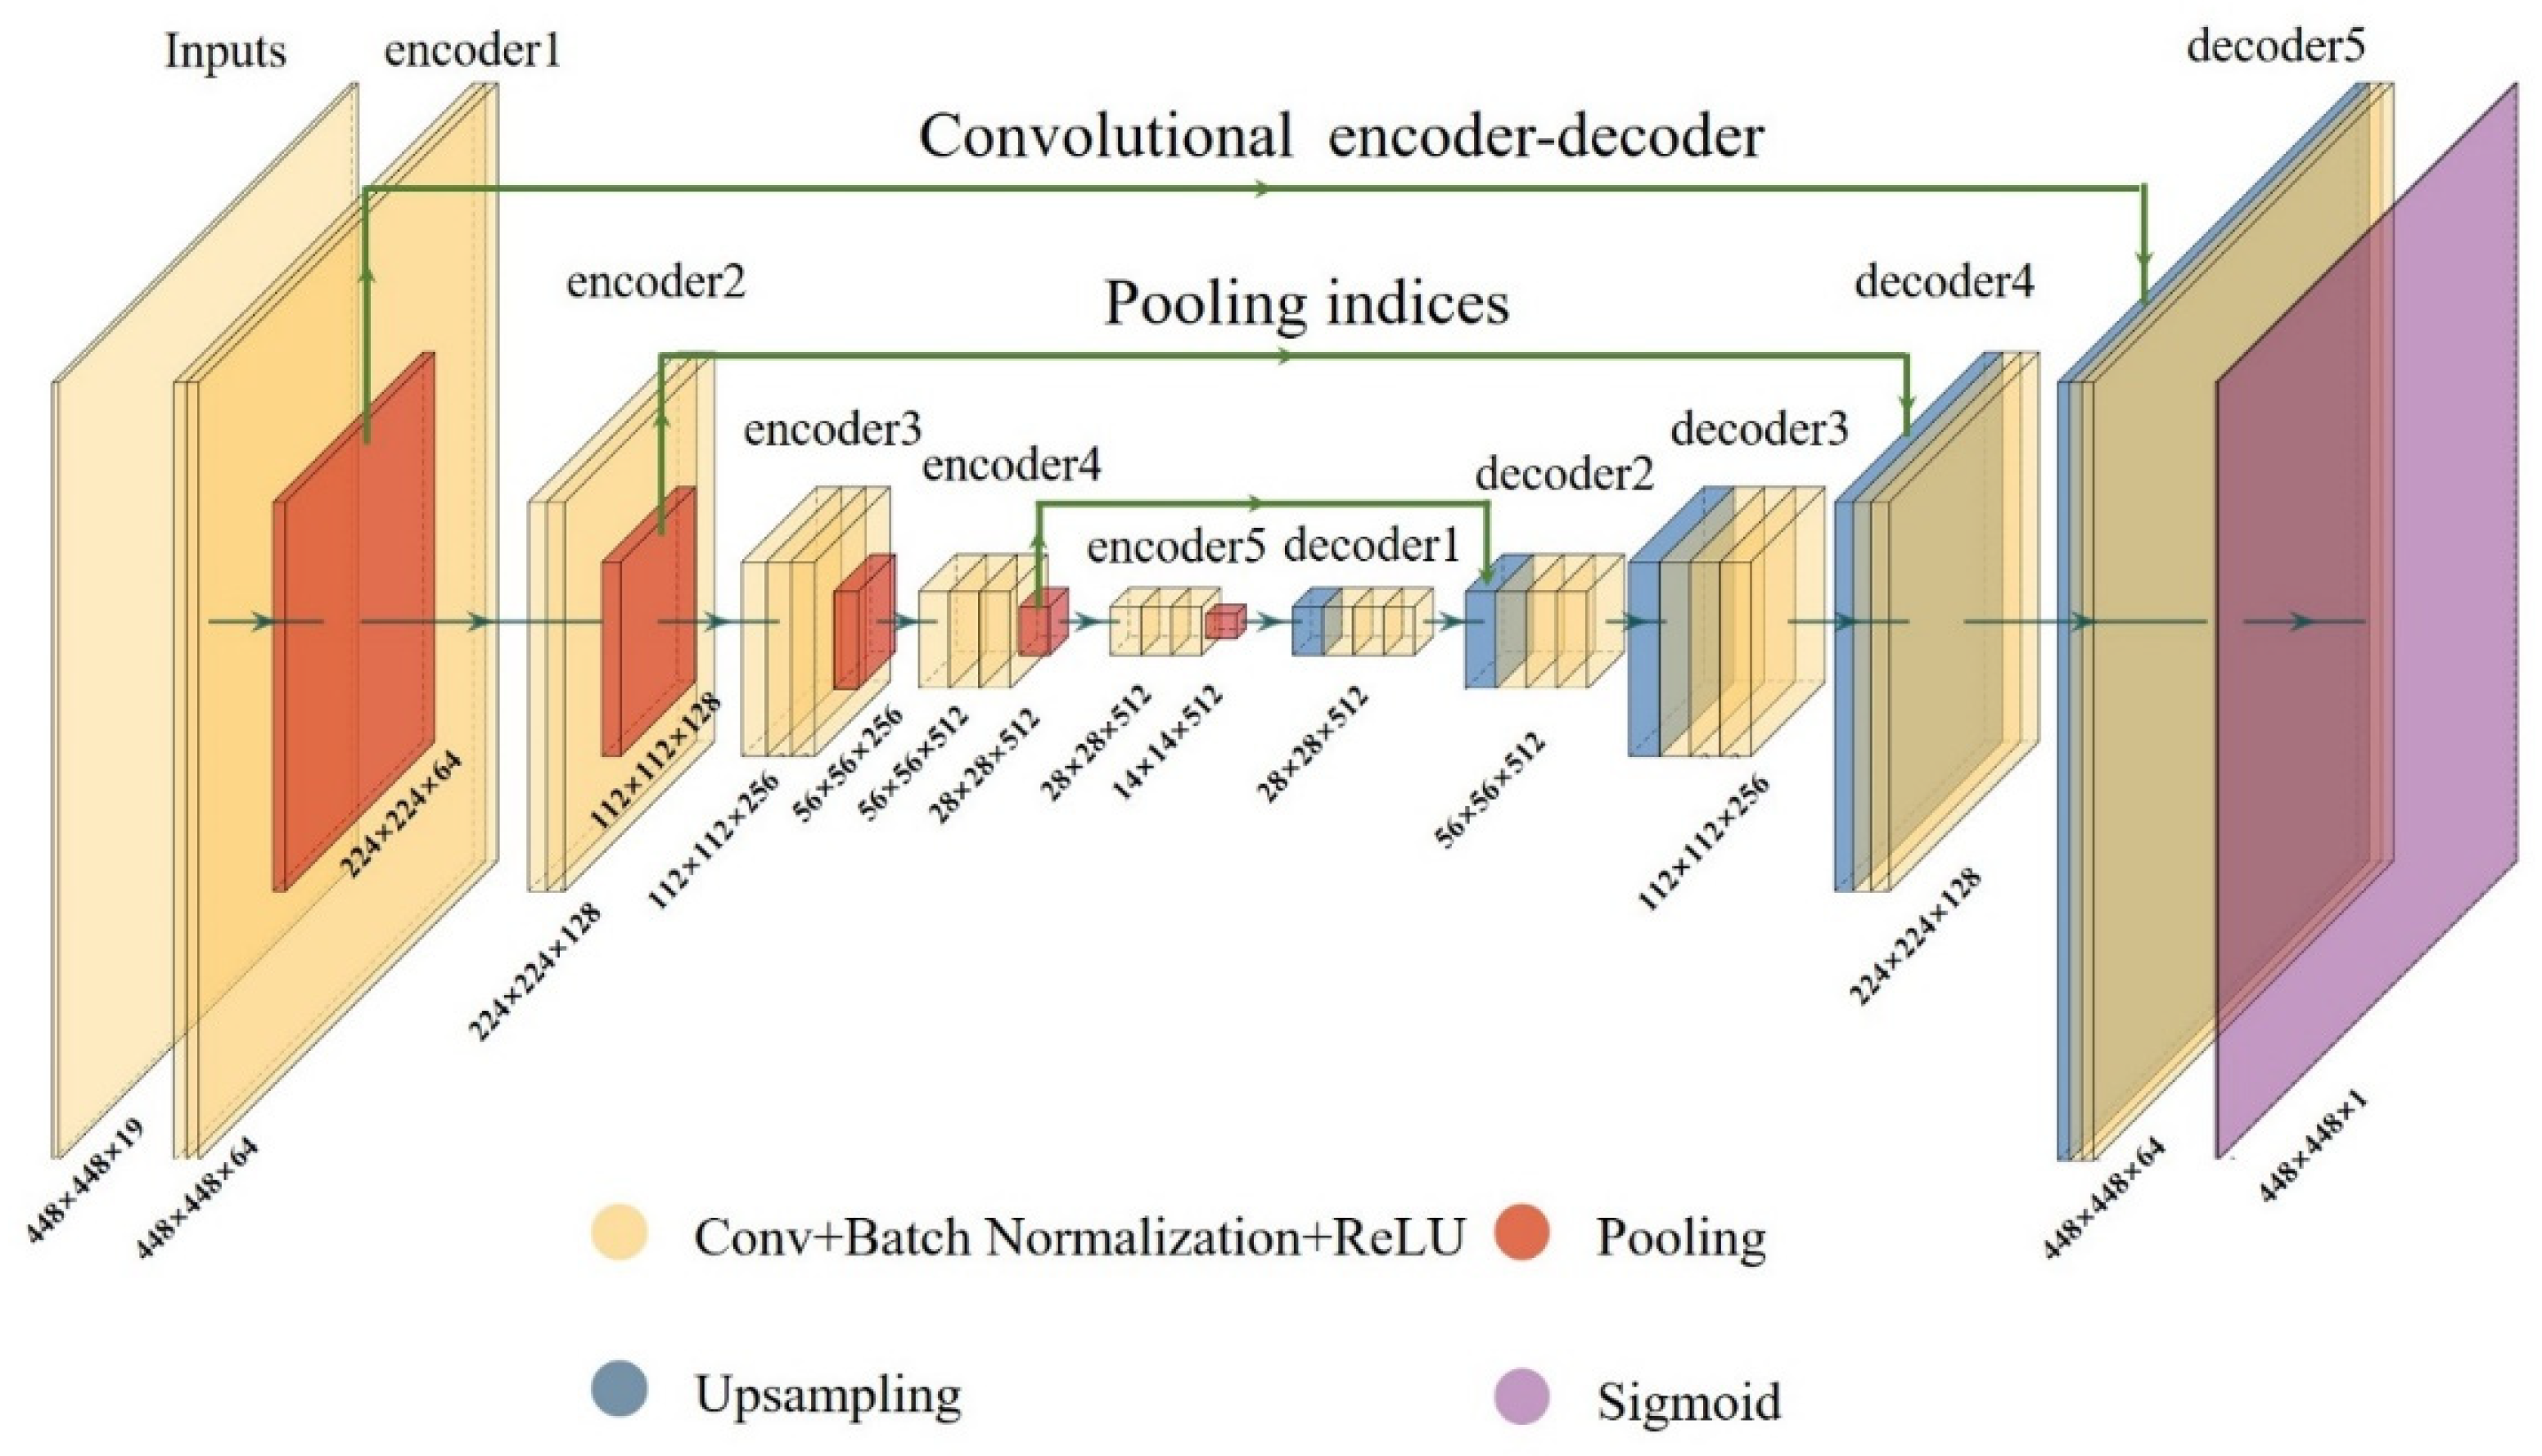
3.1. Network Structure

SegNet is a well-proven and high-performance semantic segmentation DL model. In other semantic segmentation algorithms, the conventional sampling operation loses spatial information and decreases the feature map resolution. However, one of the advantages of SegNet is that it introduces a specially designed downsampling method that solves the problem of boundary information loss. The lightning location in the CG lightning samples can be extremely small and scattered; therefore, the algorithm must have fine segmentation capabilities to accurately segment it. Based on the advantage of SegNet in refining segmentation and the fusion of multiple characteristic factors, a lightning location identification network model that could be adapted to the characteristics of radar data—namely, the Lightning-SN model—was built in this study. The model structure is shown in Figure 3.
Compared to the classical SegNet network model, the Lightning-SN model adds the upsampling and downsampling operations and adjusts the size of the convolutional kernel to adapt the radar data. Similar to the SegNet network model, the Lightning-SN model was built with a symmetrical encoder–decoder structure, followed by a pixel-wise classification layer. The encoder directly employs the first five modules of the VGG16 DL model with a total of 13 convolutional layers. The decoder maintains a structure symmetrical to the encoder, the network structure of which is illustrated in Figure 3. The input of the model is 448 × 448 × 19 grid data. In the encoder structure, the convolutional layer with a 3 × 3 convolutional kernel is abbreviated as Conv, the batch normalization layer is marked as Batch Normalization, and the activation function layer is marked as ReLU.
The convolutional layer extracts features from the input data by using a randomly generated convolutional kernel. The value distribution of the output data of the convolutional layer can be adjusted following the batch regularization rules, which enables the neural network to be trained without adapting to the data distribution, accelerating convergence and suppressing overfitting. The adjusted data can then be input to the activation function ReLU, which increases the nonlinear relationship between the layers of the neural network and improves the gradient descent efficiency. The three hidden layers constitute a fixed pairing widget that combines the contextual information for feature extraction. The pooling layer employs a maximum pooling method with a pooling kernel size of 2 × 2 and a step size of 2. At each downsampling step, the resolution of the feature map is reduced to a quarter of its original size, and the number of feature channels is doubled. At each upsampling step, the feature map resolution is increased four times, and the number of feature channels is halved. These two layers perform downsampling and upsampling functions, while the pooling layer is used to increase the receptive field, enabling the later convolutional nuclei to obtain more global contextual information.
As downsampling reduces the output resolution, an upsampling layer must be added to increase the output resolution. In this study, the entire network was operated symmetrically with five down samples and five up samples to achieve a constant resolution. To avoid feature map boundary information loss during this processing procedure, the network saves the positioning information of the maximum characteristic value in each pooling window in the downsampling operation during the encoding phase—namely, the maximum pooling index. In the decoding stage, the input feature map is upsampled using the maximum pooling index, enabling reconstruction from low-dimensional vectors to high-dimensional vectors by mapping the low-resolution feature map to a high-spatial-resolution feature map. Finally, the convolution operation is performed in the final layer of the network with a 1 × 1 convolution kernel. The characteristic vector is then mapped by the sigmoid activation function to a probability vector between 0 and 1 for each pixel, which can be used as a probabilistic description of the binary prediction with a resolution of 448 × 448.

3.2. Loss Function Improvement
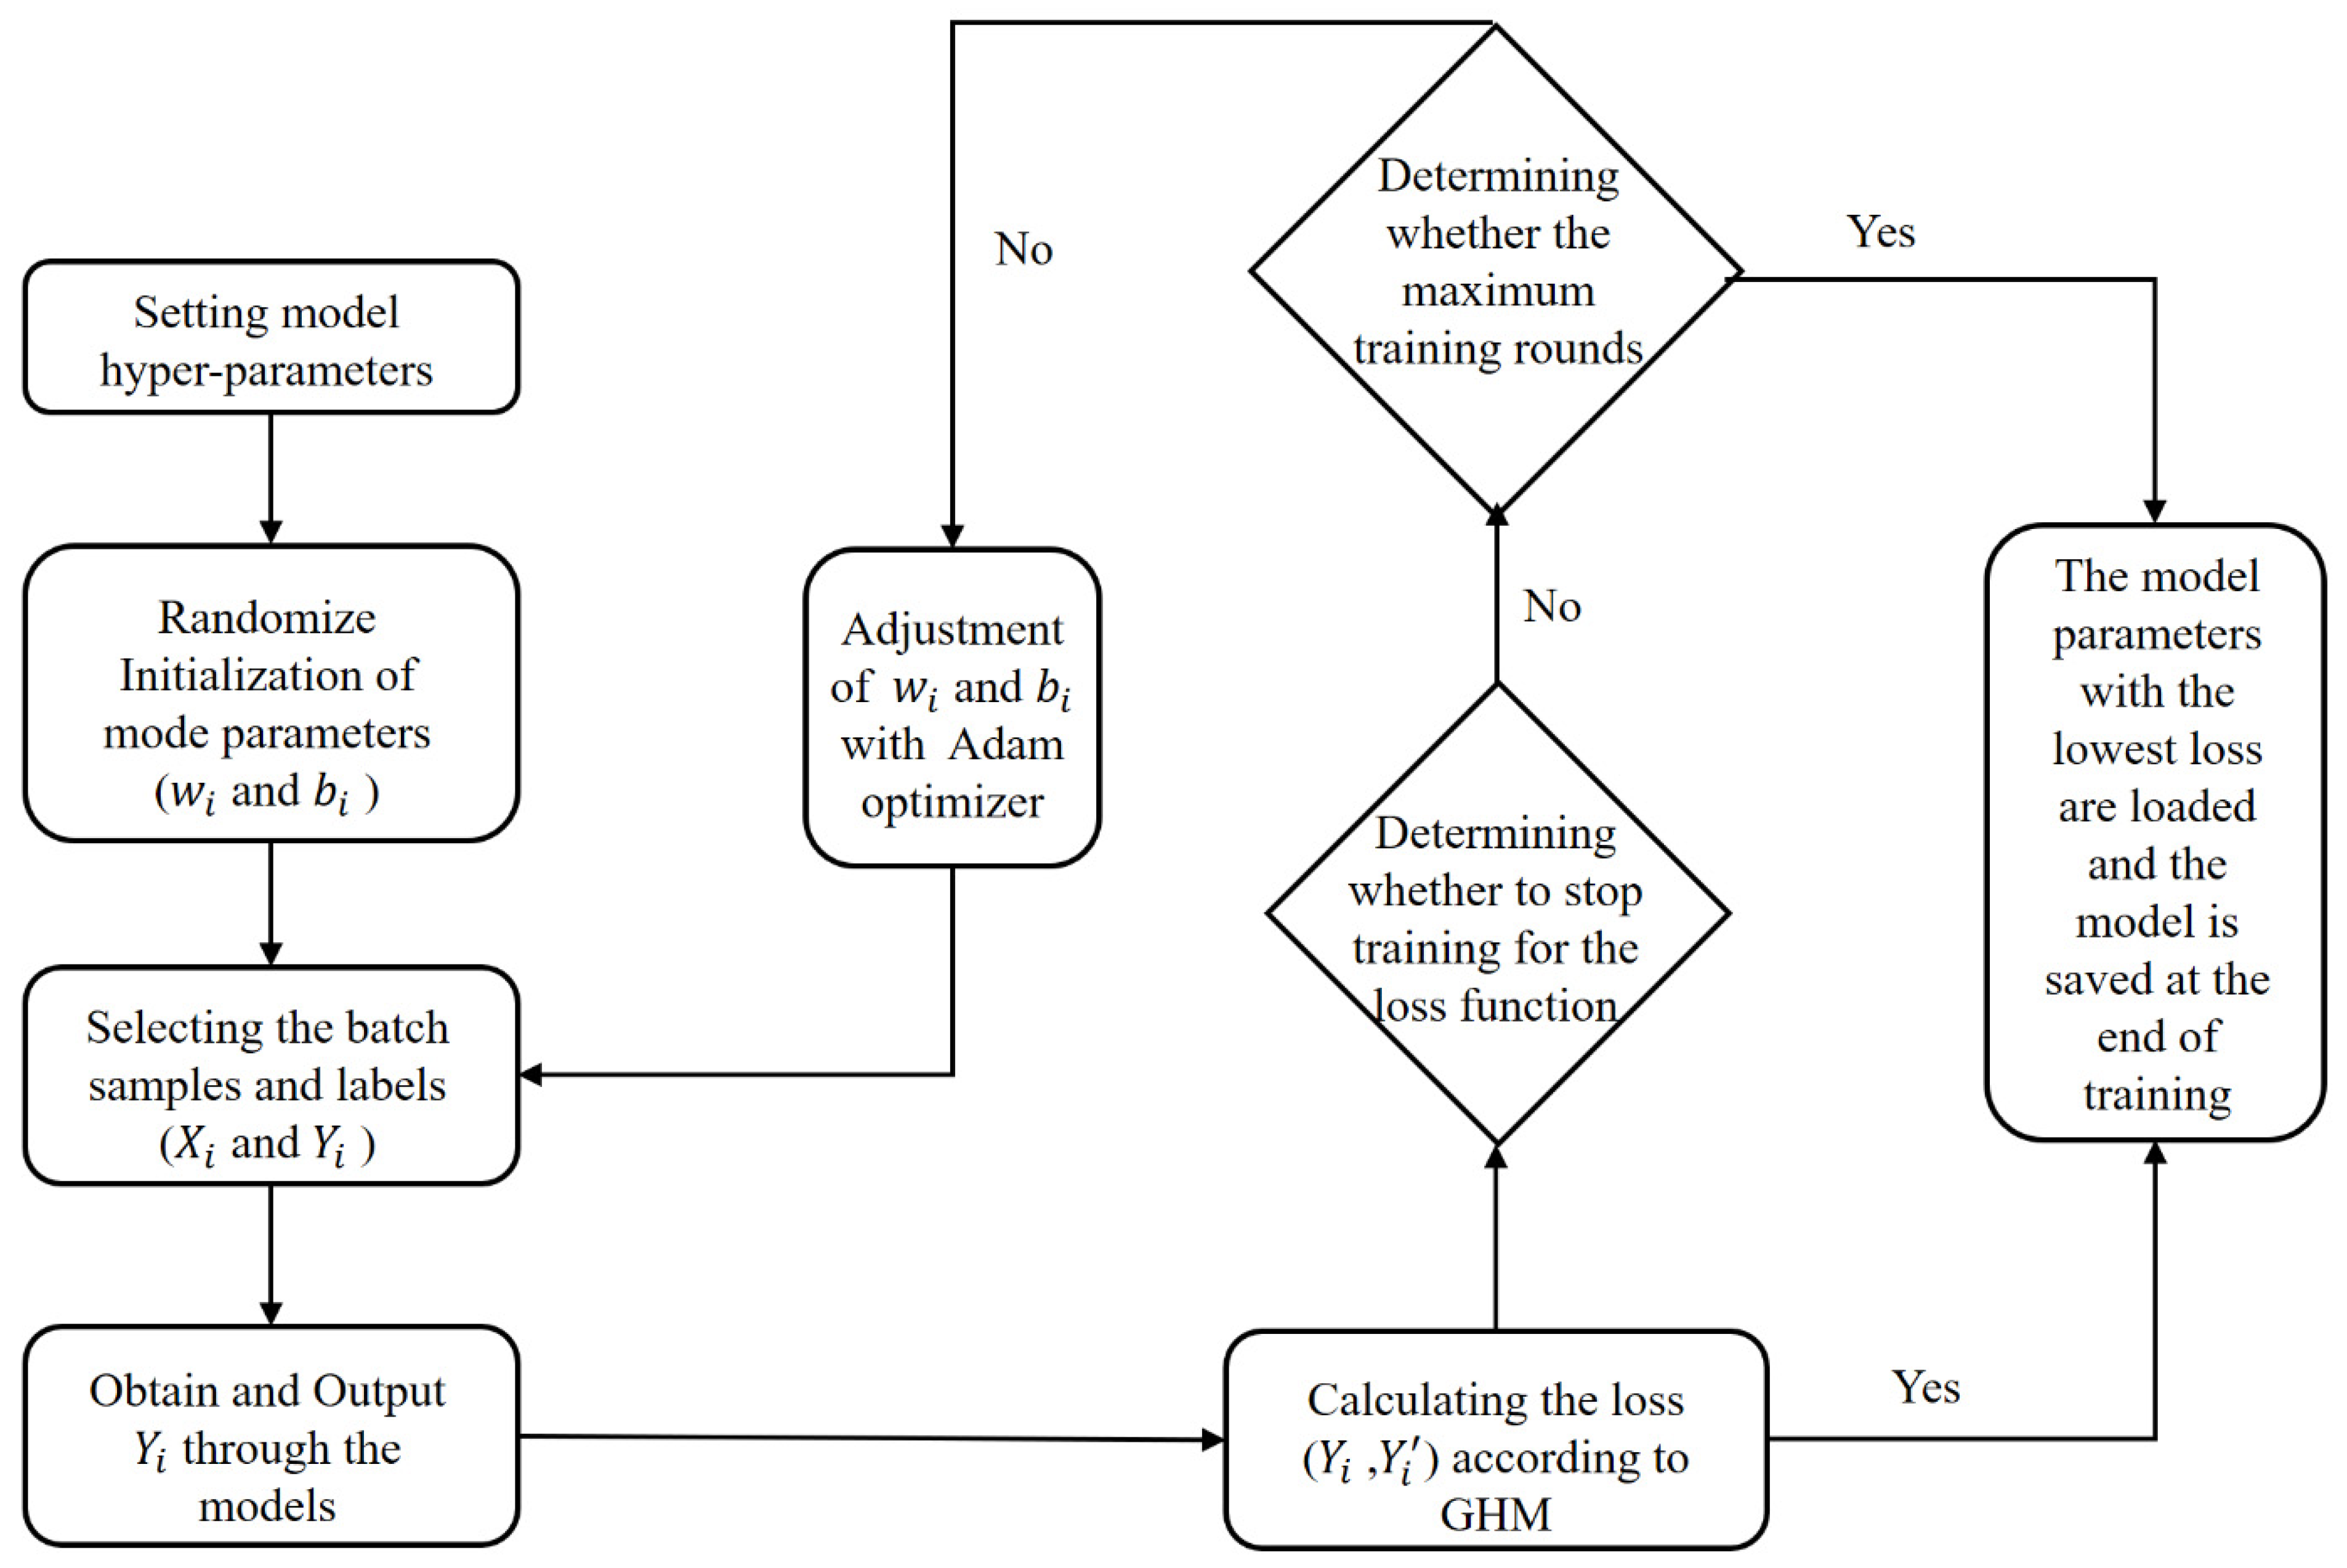
The loss function can be used to measure the proximity between the model output distribution and sample labeling distribution, which can have a major impact on model performance. However, CG lightning data identification is a dichotomous problem, as the majority of the space and time series within the radar detection range are free of CG lightning, even during thunderstorms, which is manifested by the presence of a large number of negative samples. The negative samples contribute to the loss values by dominating the update direction of the gradient, leading to model performance degradation when the loss values are calculated using the cross-entropy loss function conventionally used for dichotomous recognition [23]. Moreover, the suspected CG lightning features in the radar image are generally located in the transition zone between CG lightning areas. As the network model cannot learn the information of complex samples with suspected CG lightning, it can be difficult to distinguish the boundary of a lightning region. Further, lightning can be recognized in areas far from the convection owing to the long discharge paths of a few lightning bolts or due to measurement errors from the lightning detection equipment. The processing of these outliers can have a major impact on algorithm performance. Li et al. [36] proposed a gradient harmonizing mechanism (GHM) algorithm based on a standard cross-loss function. The concept of gradient modulus can be expressed as follows:
g = p p * = 1 p p * = 1 p p * = 0 ,
where g denotes the difficulty level of the sample and its contribution to the overall gradient; g is large when the number of simple samples is large.
The contribution of simple samples dominates gradient sharing. A certain number of outlier samples exist in the large gradient modulus because the distribution of the gradient modulus of the outlier samples is quite different from that of the overall gradient modulus, and it can be difficult for the model to process these samples. Consequently, training the model with outlier samples can lead to overall performance degradation. However, the GHM method sets the gradient interval based on the gradient distribution range, the number of samples in each gradient interval being counted. The gradient density (GD(g)), which represents the number of samples in a certain unit interval, can be defined based on the number of samples in the interval and the length of the interval, as follows:
GD g = 1 l ε g k = 1 N δ g k , g ,
where δ g k , g denotes the number of samples with a gradient modulus length in the range g ε 2 , g + ε 2 in samples of 1–N, and l ε g denotes the interval length. The reciprocal of GD(g) indicates the weight loss of the sample. The larger the density, the smaller the weight. For each sample, the new classification loss can be obtained by simply multiplying the cross-entropy loss (LCE) of the sample by the reciprocal of GD(g), as follows:
L GHM = i = 1 N LCE p i , p i * GD g i .
To balance the positive and negative samples without focusing too much on outlier samples, the GHM algorithm with a 10-gradient interval was adopted to calculate the losses.

4. Model Training

4.1. Hyperparameter Setting

Hyperparameters are parameters that can be set before model training, rather than those obtained via training. In general, the hyperparameters require manual optimization, and the model training performance can be improved by selecting an optimized set of hyperparameters. The proposed Lightning-SN network model also requires setting the sample size, batch size, iteration times, training learning rate, and other hyperparameters, as shown in Table 2.

4.2. Model Tuning

The parameters of the weights and offsets in the Lightning-SN model are the foundation for classification. Moreover, the model training process involves continuously adjusting the parameter values. The model can achieve a classification function only through effective training. The backpropagation (BP) algorithm is the most commonly employed model optimization algorithm [37], which adjusts the parameters in the direction of the negative gradient of the target. In this study, the Lightning-SN network model was trained based on the BP algorithm, as shown in Figure 4.
First, one batch of training samples is selected before the start of iteration training and is used as the model input (the forward propagation algorithm) to obtain the prediction results of the entire batch. The loss value between the predicted and true values is then calculated using the GHM method. Finally, the loss values are optimized using the extended BP algorithm (Adam algorithm), and the model parameters are updated according to the opposite direction of the loss gradient [38]. Iterative model training reduces the loss. Testing based on the validation set is implemented and recorded for each fixed cycle. The training is terminated when the losses in the validation set no longer decrease after five epochs, and the model with the lowest loss in training is saved.
A graphics processor (GPU) was used to display the calculation progress during training. An NVIDIA RTX 1080TI graphics card (NVIDIA Corporation, United States) was used as the hardware. The test results indicated that lightning identification can be completed within 30 ms in the experimental area with a 1-km grid interval, indicating that the proposed algorithm can be used in practice.

5. Experimental Results and Analysis

5.1. Evaluation Metrics

Considering an extreme case with unbalanced positive and negative samples, the generic accuracy (ACC) index was inapplicable. To precisely reflect the model identification capability, CSI, POD (also referred to as recall), FAR, and F1-score were used to quantify the model performance. The valid POD, FAR, CSI, and F1-score values were in the range of (0, 1). Higher CSI, POD, and F1-score values and lower FAR values indicate better model performance. Table 3 lists the related definitions of CG lightning identification.
The POD denotes the ratio between the number of lightning events correctly identified by the algorithm and the number actually observed, indicating the identification strength of the algorithm. The FAR represents the lightning misreport rate of the algorithm. The precision is the ratio of the number of lightning events correctly identified by the algorithm to the total number of identified lightning events. CSI refers to the probability of successful lightning detection by the algorithm, which reflects the capability of the algorithm to successfully identify actual lightning. The POD and precision seem to have no relationship based on their expressions, but they are mutually constrained in terms of the identification results. The F1-score is the weighted average of the POD and precision. The F1-score is large only when both the POD and precision are large, and it is the more rigorous model evaluation metric. The equations for calculating the five evaluation metrics are as follows:
Precision = TP TP + FP ,
FAR = FP TP + FP ,
POD = TP TP + FN ,
CSI = TP TP + FP + FN ,
F 1 - score = 2 · POD · Precision POD + Precision .

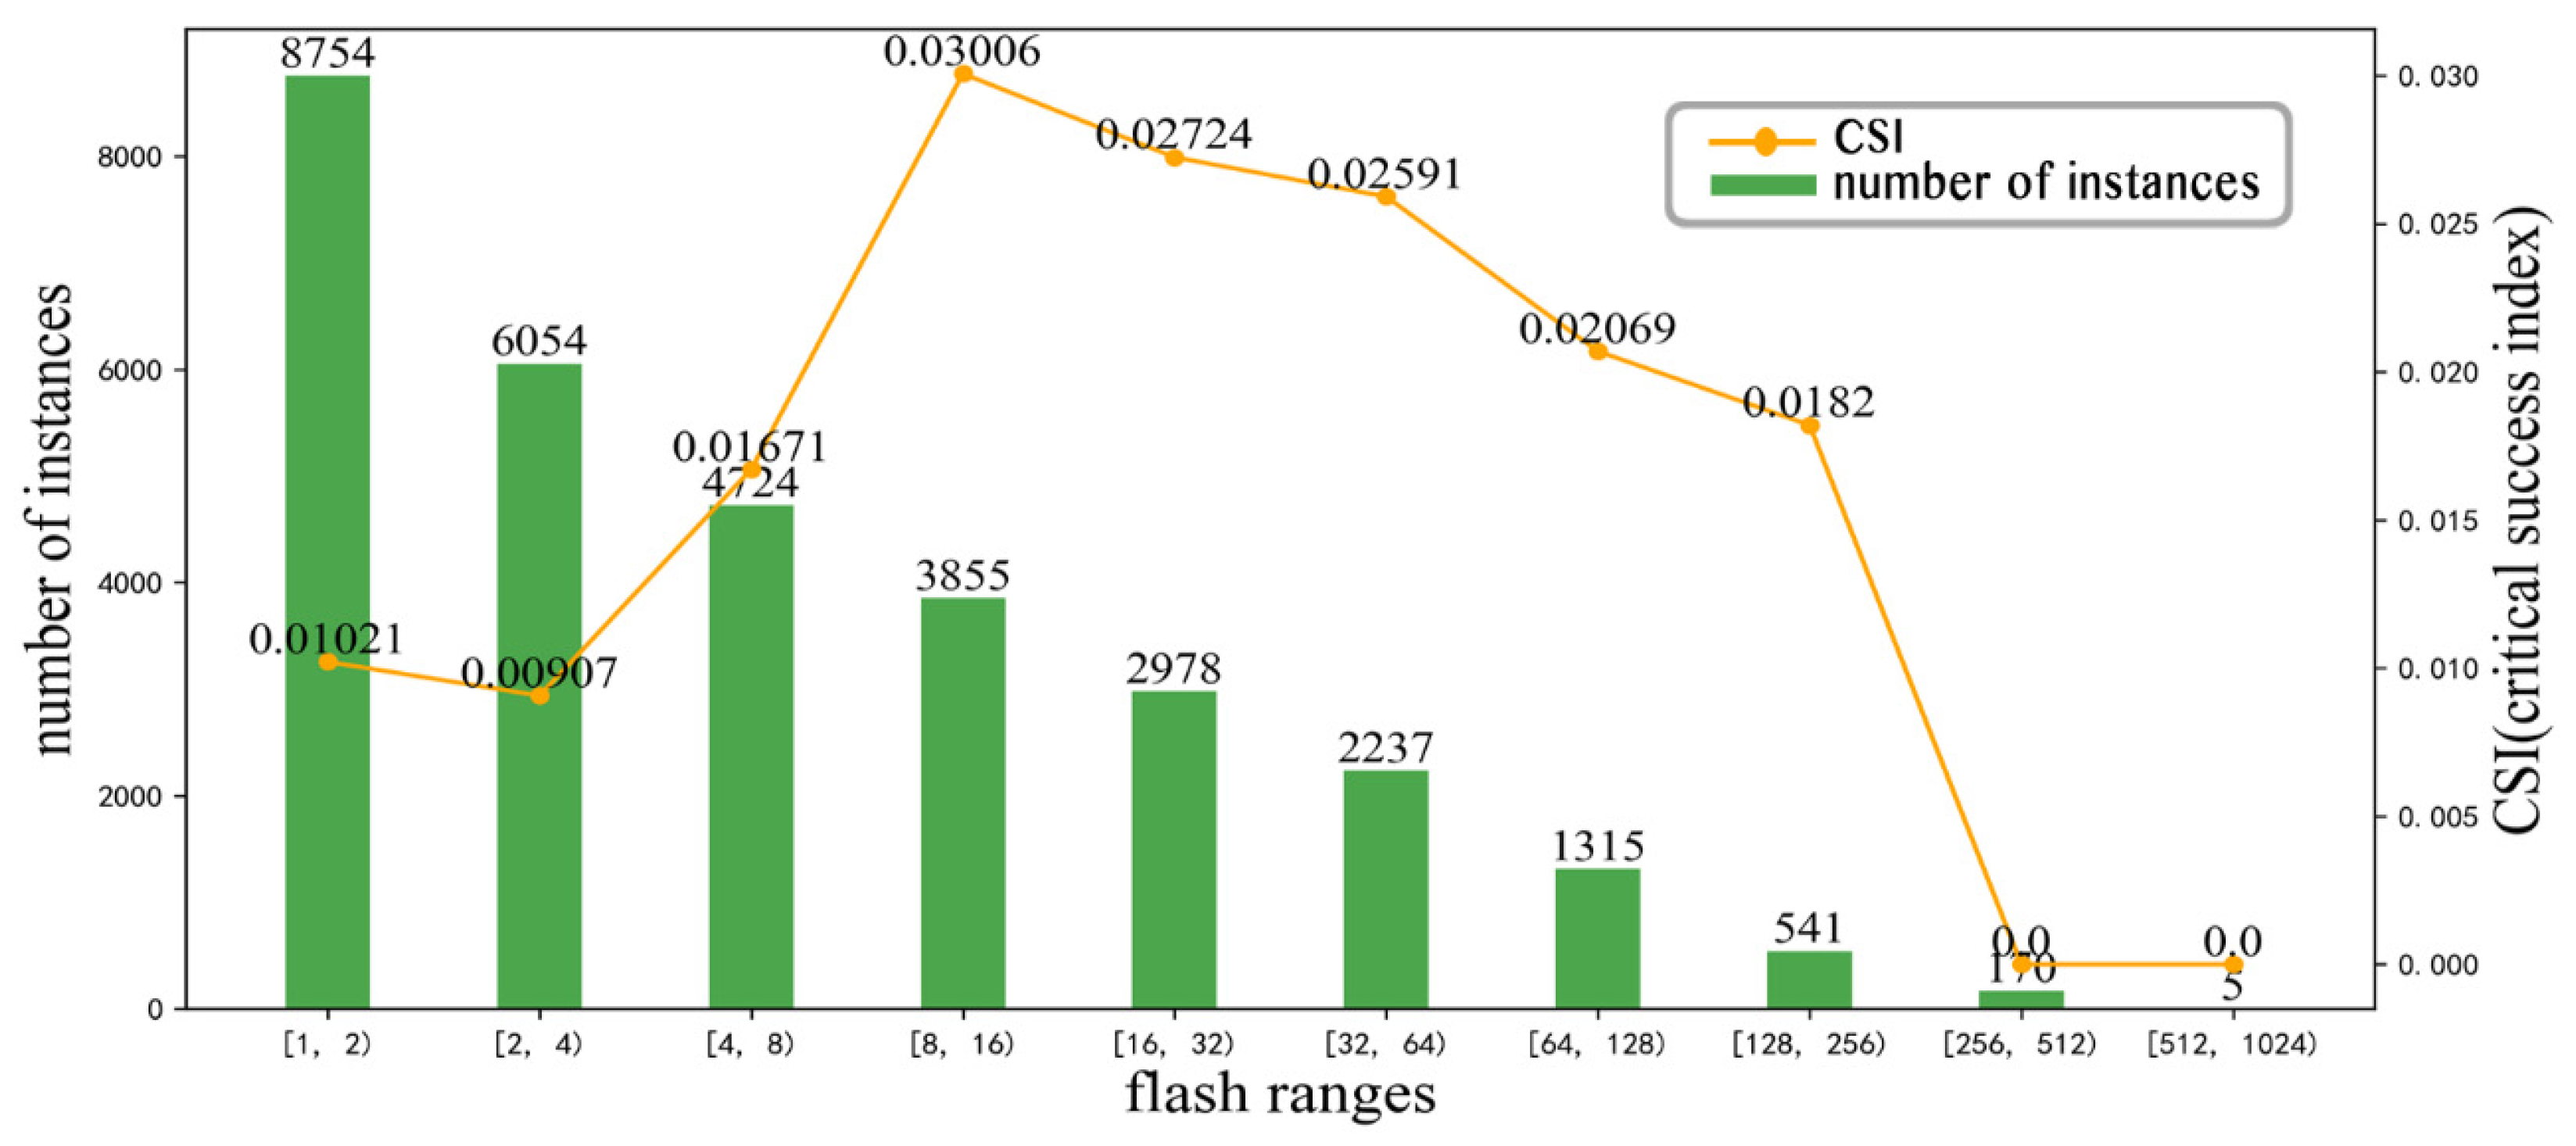
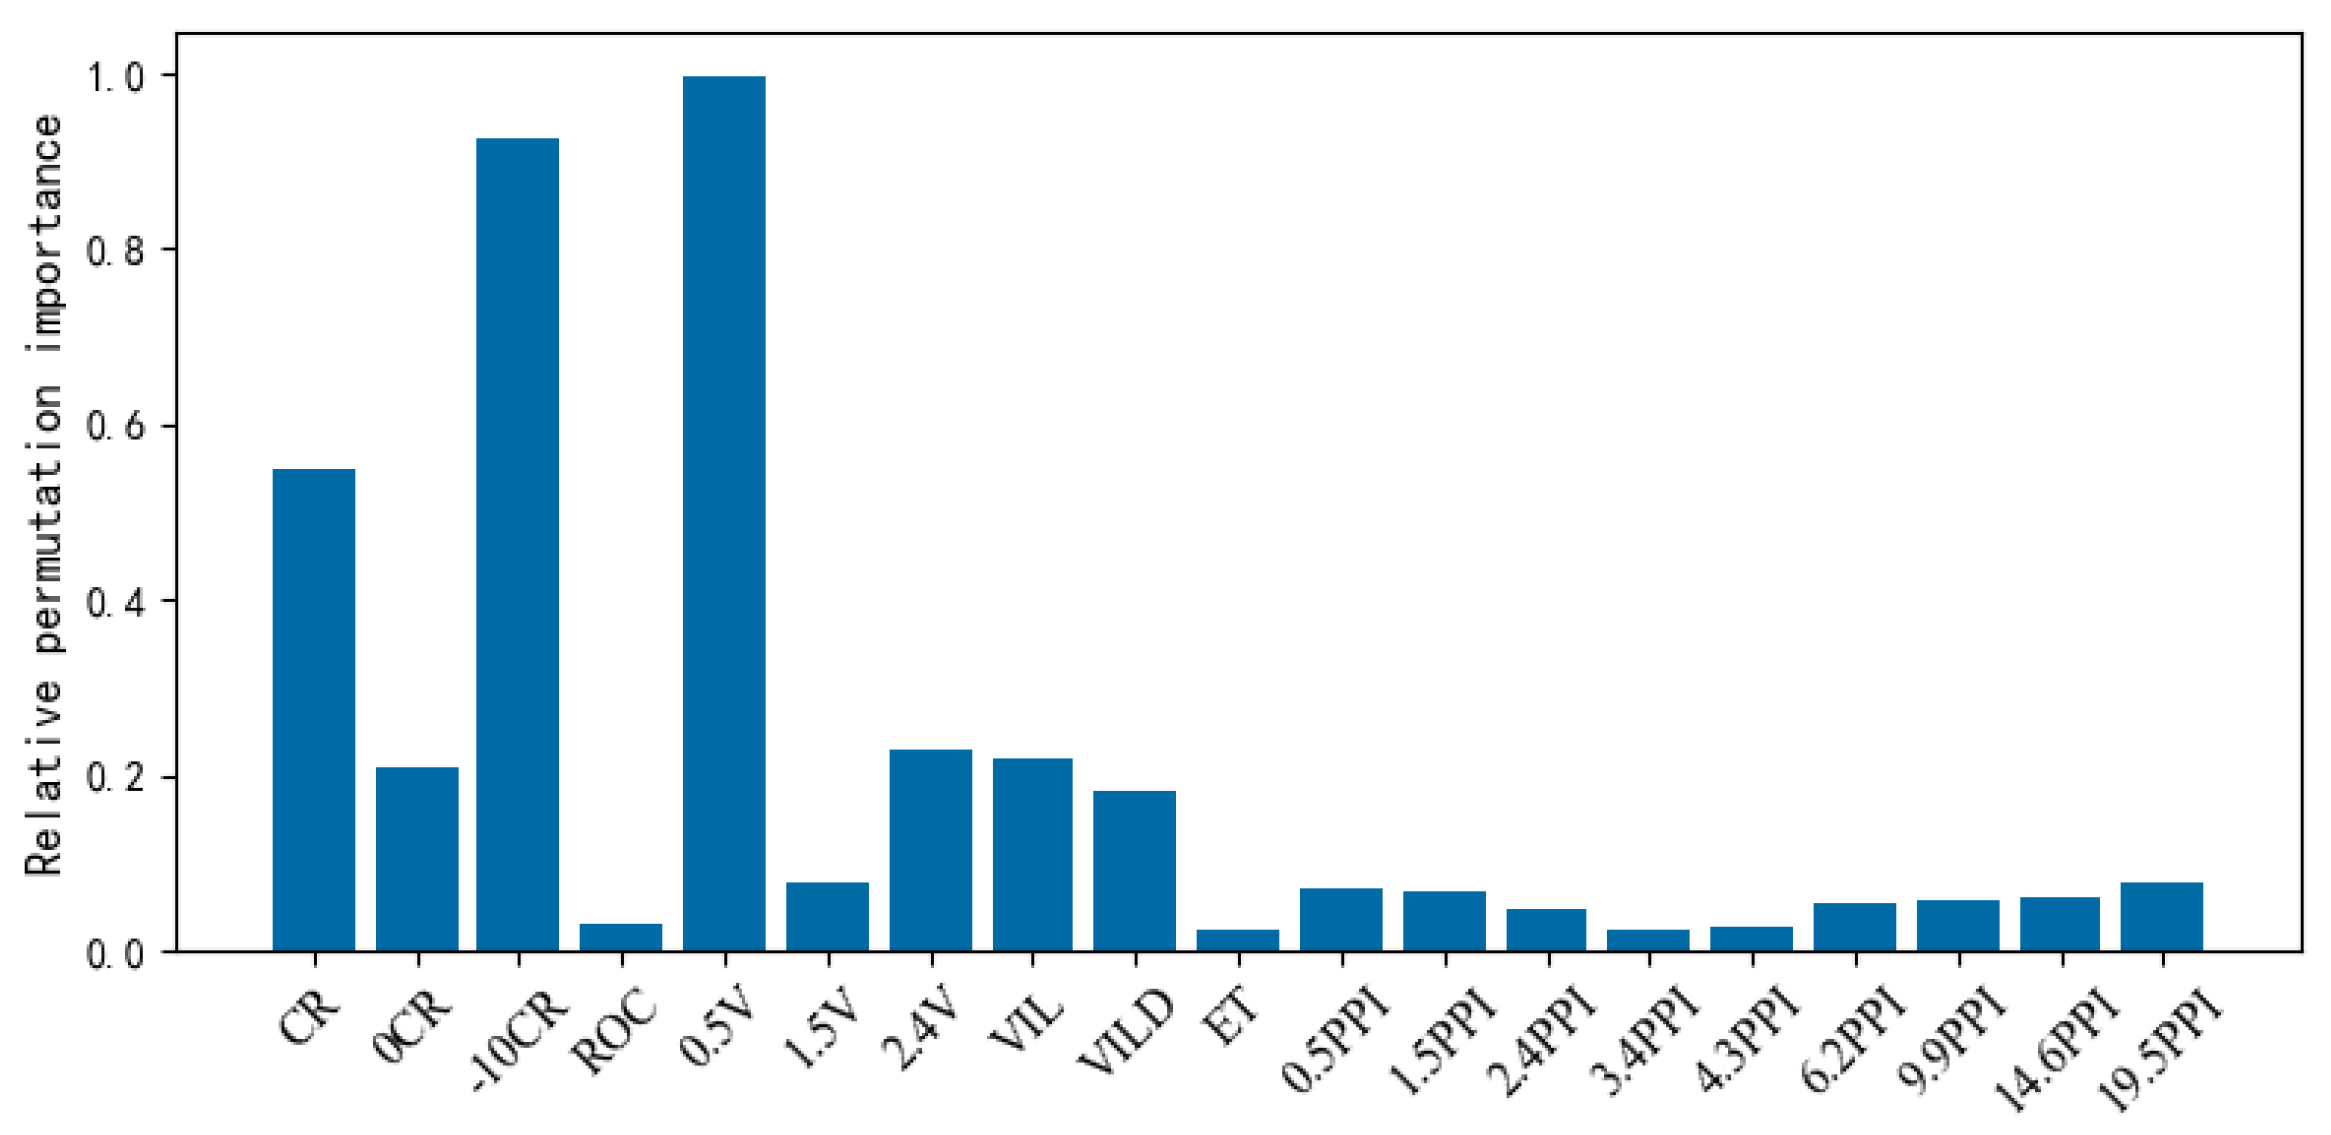
5.2. Importance of the Characteristic Factors

One approach to measure the importance of a characteristic is to train the classifier without this characteristic and then observe the score. However, this approach requires retraining of the classifier for each characteristic, which is computationally expensive. Breiman et al. [39] proposed a permutation importance method for the random forest method, which could be used to evaluate the importance of the characteristic factors in traditional machine learning and DL models. In particular, a random arrangement of the characteristic factor in the testing set is disrupted (i.e., inputting noise for a variable) and then input into the prediction model to obtain identification results; the difference between this identification and the normal prediction results is calculated—the larger the difference, the more important it is. If the difference is not significant, it is possible that the characteristic factor is not important or that there is an information overlap with other characteristic factors, such as a linear correlation. The importance evaluation in this study was based on the CSI scoring method, the relative importance of each characteristic factor being defined as:
CSI relative i = CSI original i CSI shuffled i CSI original i
To minimize random errors in the evaluation process, five random disruption operations were performed for each characteristic factor, and the final results were averaged.
As shown in Figure 5, all characteristic factors provide positive effects. CR, −10CR, and 0.5 V are three very effective factors. Note that −10CR is also an identification factor of the traditional threshold method. It is evident that manual experience can provide a reference for selecting model characteristic factors. The radial velocity at a 0.5-degree elevation angle is the largest contributor to the model accuracy among all factors, indicating that the model extracts the velocity feature well. The importance of 0CR, 2.4 V, VIL, and VILD indicates that the water vapor condition is also correlated with lightning occurrence. The importance of PPI factors is relatively low because they are likely to be collinear with the CR factors. The ET is an essential index for the manual identification of lightning; however, it is not important in the model.

5.3. Comparison between Algorithms

It is generally accepted that the probability of lightning is extremely high when the echo reaches 40 dBz at a −10 °C altitude [11,12,13,14]. The lead time used in this study was 6 min, which is shorter than the lead time commonly used by the traditional threshold method. Thus, the threshold method using this value was used as a comparable algorithm to measure the performance of the Lightning-SN model. Furthermore, a comparative study with other semantic segmentation algorithms—including FCNN, DeepLab-V3, and BiSeNet—was conducted under the same conditions to further verify the effectiveness of the Lightning-SN model.
DeepLabV3 is an image–semantic segmentation model of ASPP (atrous spatial pyramid pooling) with dilated convolution. BiSeNet is a bidirectional segmentation network that contains both spatial and context paths. Consequently, a feature fusion module was used to fuse the feature maps of both. These algorithms were then compared experimentally using the testing sets under the same hyperparameters. The results of the quantitative analysis are shown in Table 4.
It is evident that these DL models perform better than the traditional threshold methods. The CSI and FAR index scores for the Lightning-SN model were 0.04145 and 0.92965, respectively. Compared to the traditional threshold method, the Lightning-SN model improved the CSI by 0.02457 (a rate of increase of 145.6%), the POD by 0.07255 (a rate of increase of 379.8%), and FAR by 0.05125 (a reduction rate of 5.2%).
Overall, the accuracy of the Lightning-SN model showed a great improvement. The improvement in model performance depends primarily on an increase in the identification accuracy of the positive samples. The FCNN only uses the deepest semantic information for prediction, and it can be difficult to achieve accurate segmentation owing to the underutilization of detailed information. The FCNN is optimized by DeepLab-V3+ using atrous convolution, which can help extract image features and increase the receptive field. Compared with the FCNN, the proposed model decreased the downsampling depth, adjusted the role of deep characteristics in the prediction, and further improved the segmentation of the lightning location. BiSeNet also achieved good results by designing a spatial path component to address the missing spatial information issue. The Lightning-SN model designed in this study obtained the best segmentation results by using a specially designed upsampling method with a pooling index to reduce the information missing during the upsampling and downsampling operations and to enhance the estimation of boundaries and contours. Moreover, the selection of the loss function had a remarkable impact on the model performance; the selection of cross-entropy as the loss function did not converge in multiple model training. For the Lightning-SN model, the CSI score improved by 85.13% after the GHM loss function was replaced by cross-entropy. Additionally, other semantic segmentation models (such as RefineNet, PSPNet, U-Net, and Mask RCNN) were tested. The results show that they were less effective than the traditional threshold method, which may be because of the lack of spatial transformation invariance.
As is evident from the numerical values, the model had low accuracy and a high false alarm ratio. This is because a strict metric was used during model evaluation, and lightning is considered to be a strike—that is, it is correctly predicted—only when the lightning falls strictly in the recognition grid. By contrast, other studies have used domain–based metrics to relax the “strike” criterion by specifying grid points within a radius (r) [23,40,41]. The Lightning-SN model has a high spatiotemporal resolution of 1 km and 6 min, but in other related studies, coarser spatiotemporal resolutions have often been used [42,43]. Moreover, systematic errors in the lightning location data of the ADTD can cause the lightning data to contain a large number of outlier points. Previous studies have often directly used the threshold method to remove these points [44]. Although this can improve model performance, it weakens the identification ability of the model for weak lightning. Despite the low evaluation index of the proposed Lightning-SN model, its identification results can be satisfactory in practical applications owing to the higher spatial resolution.

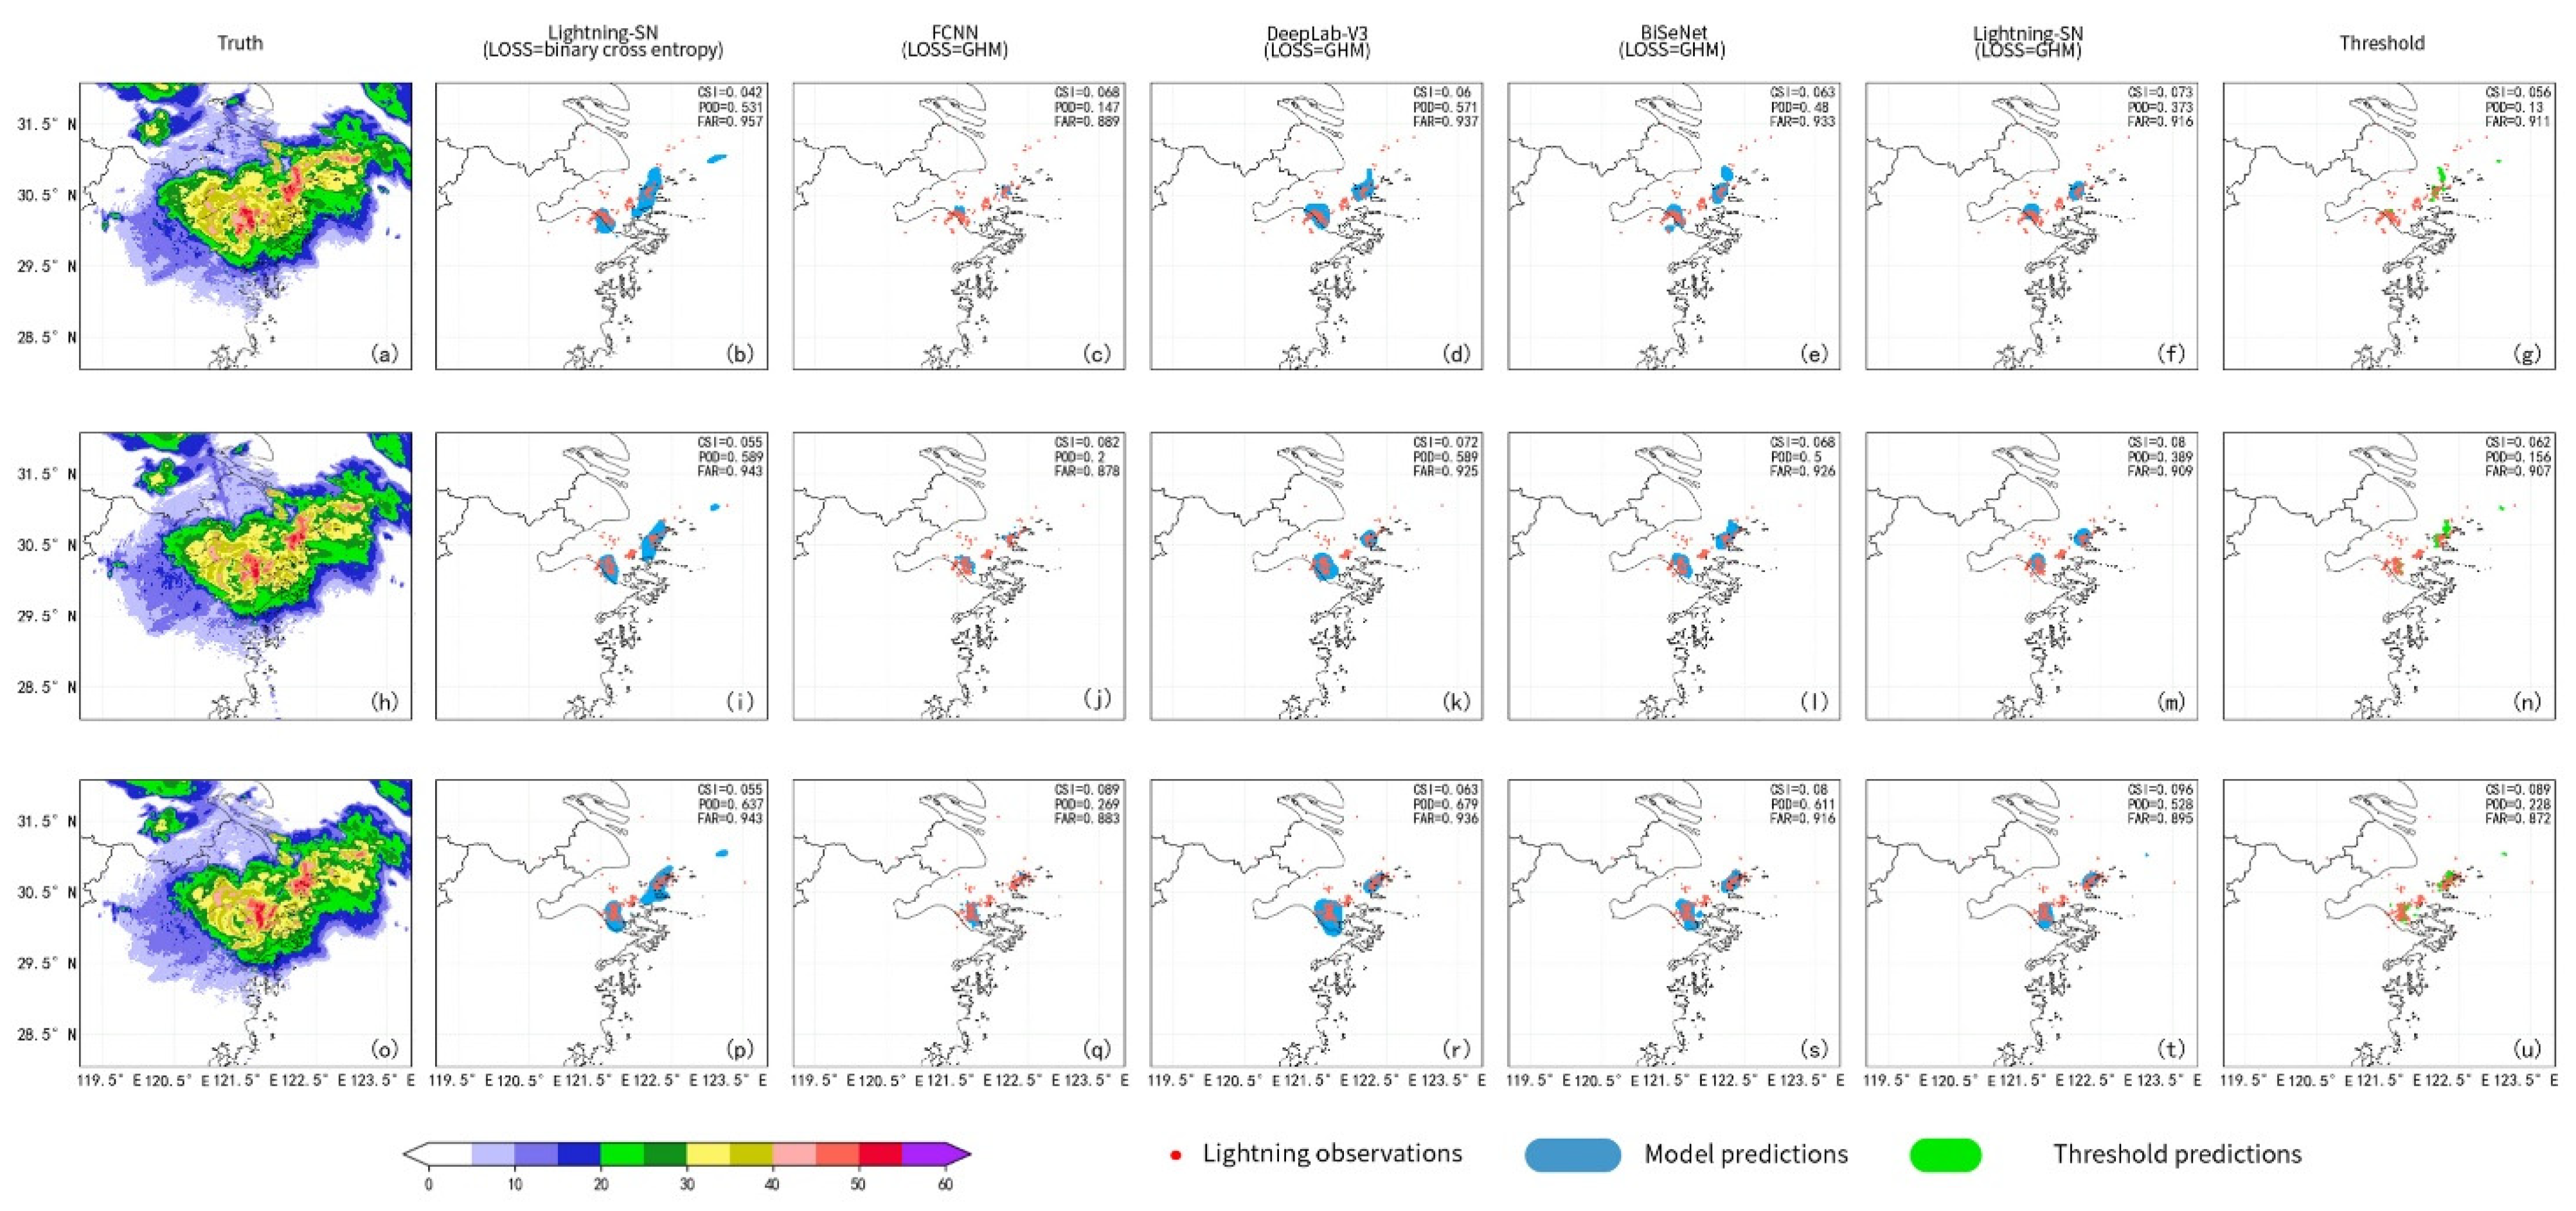
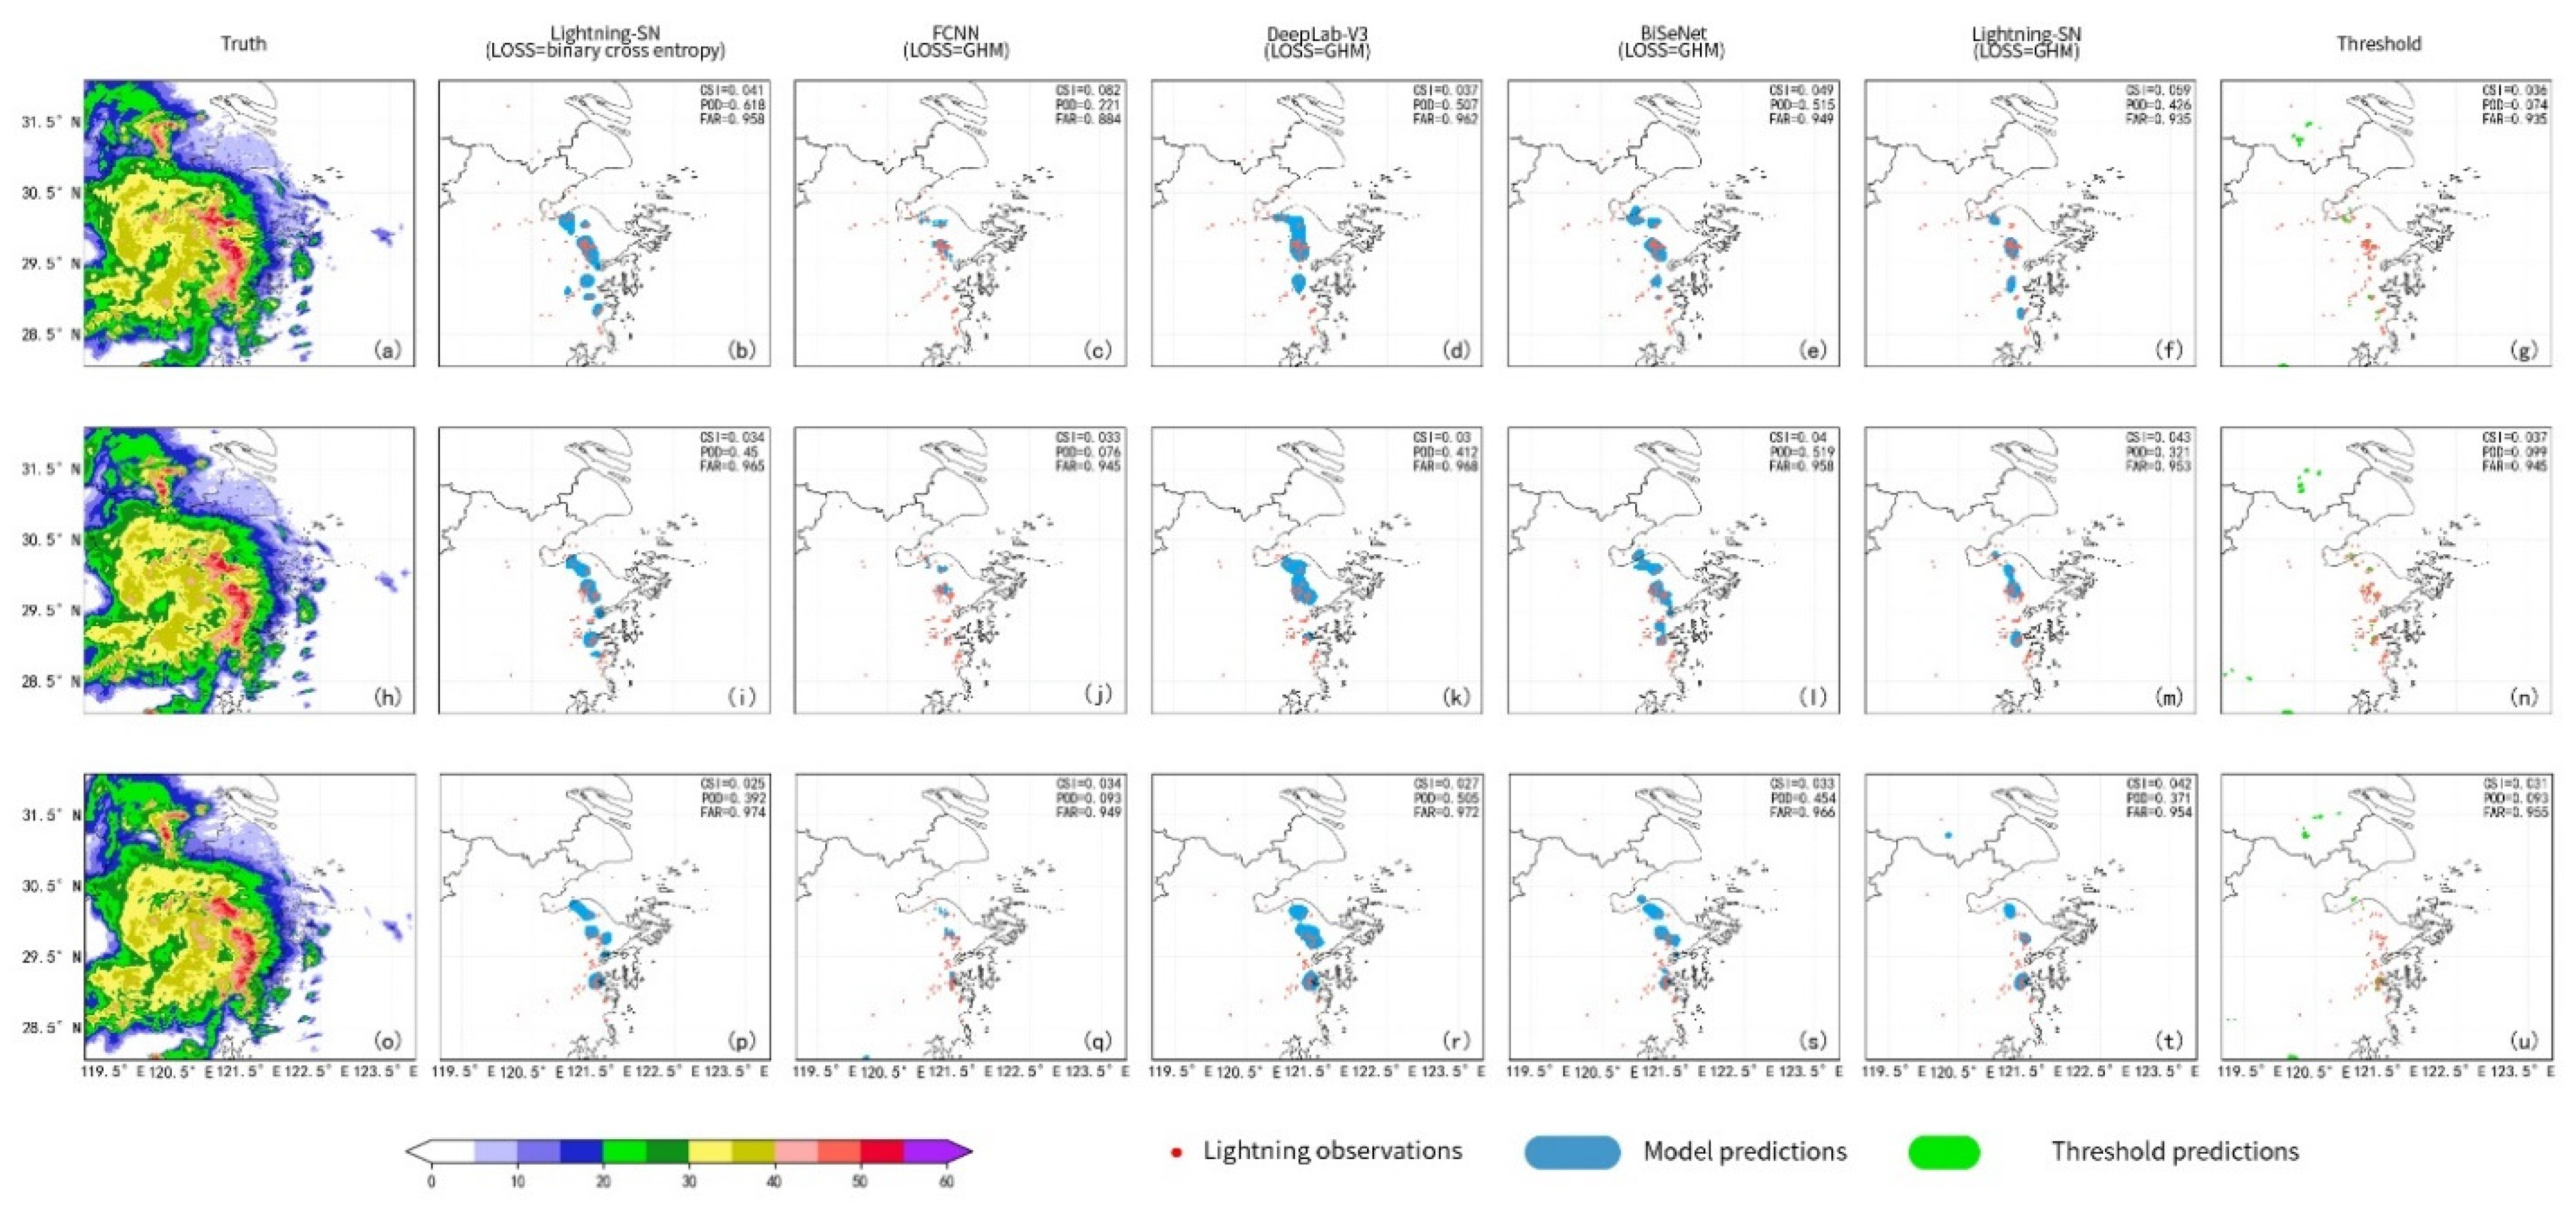
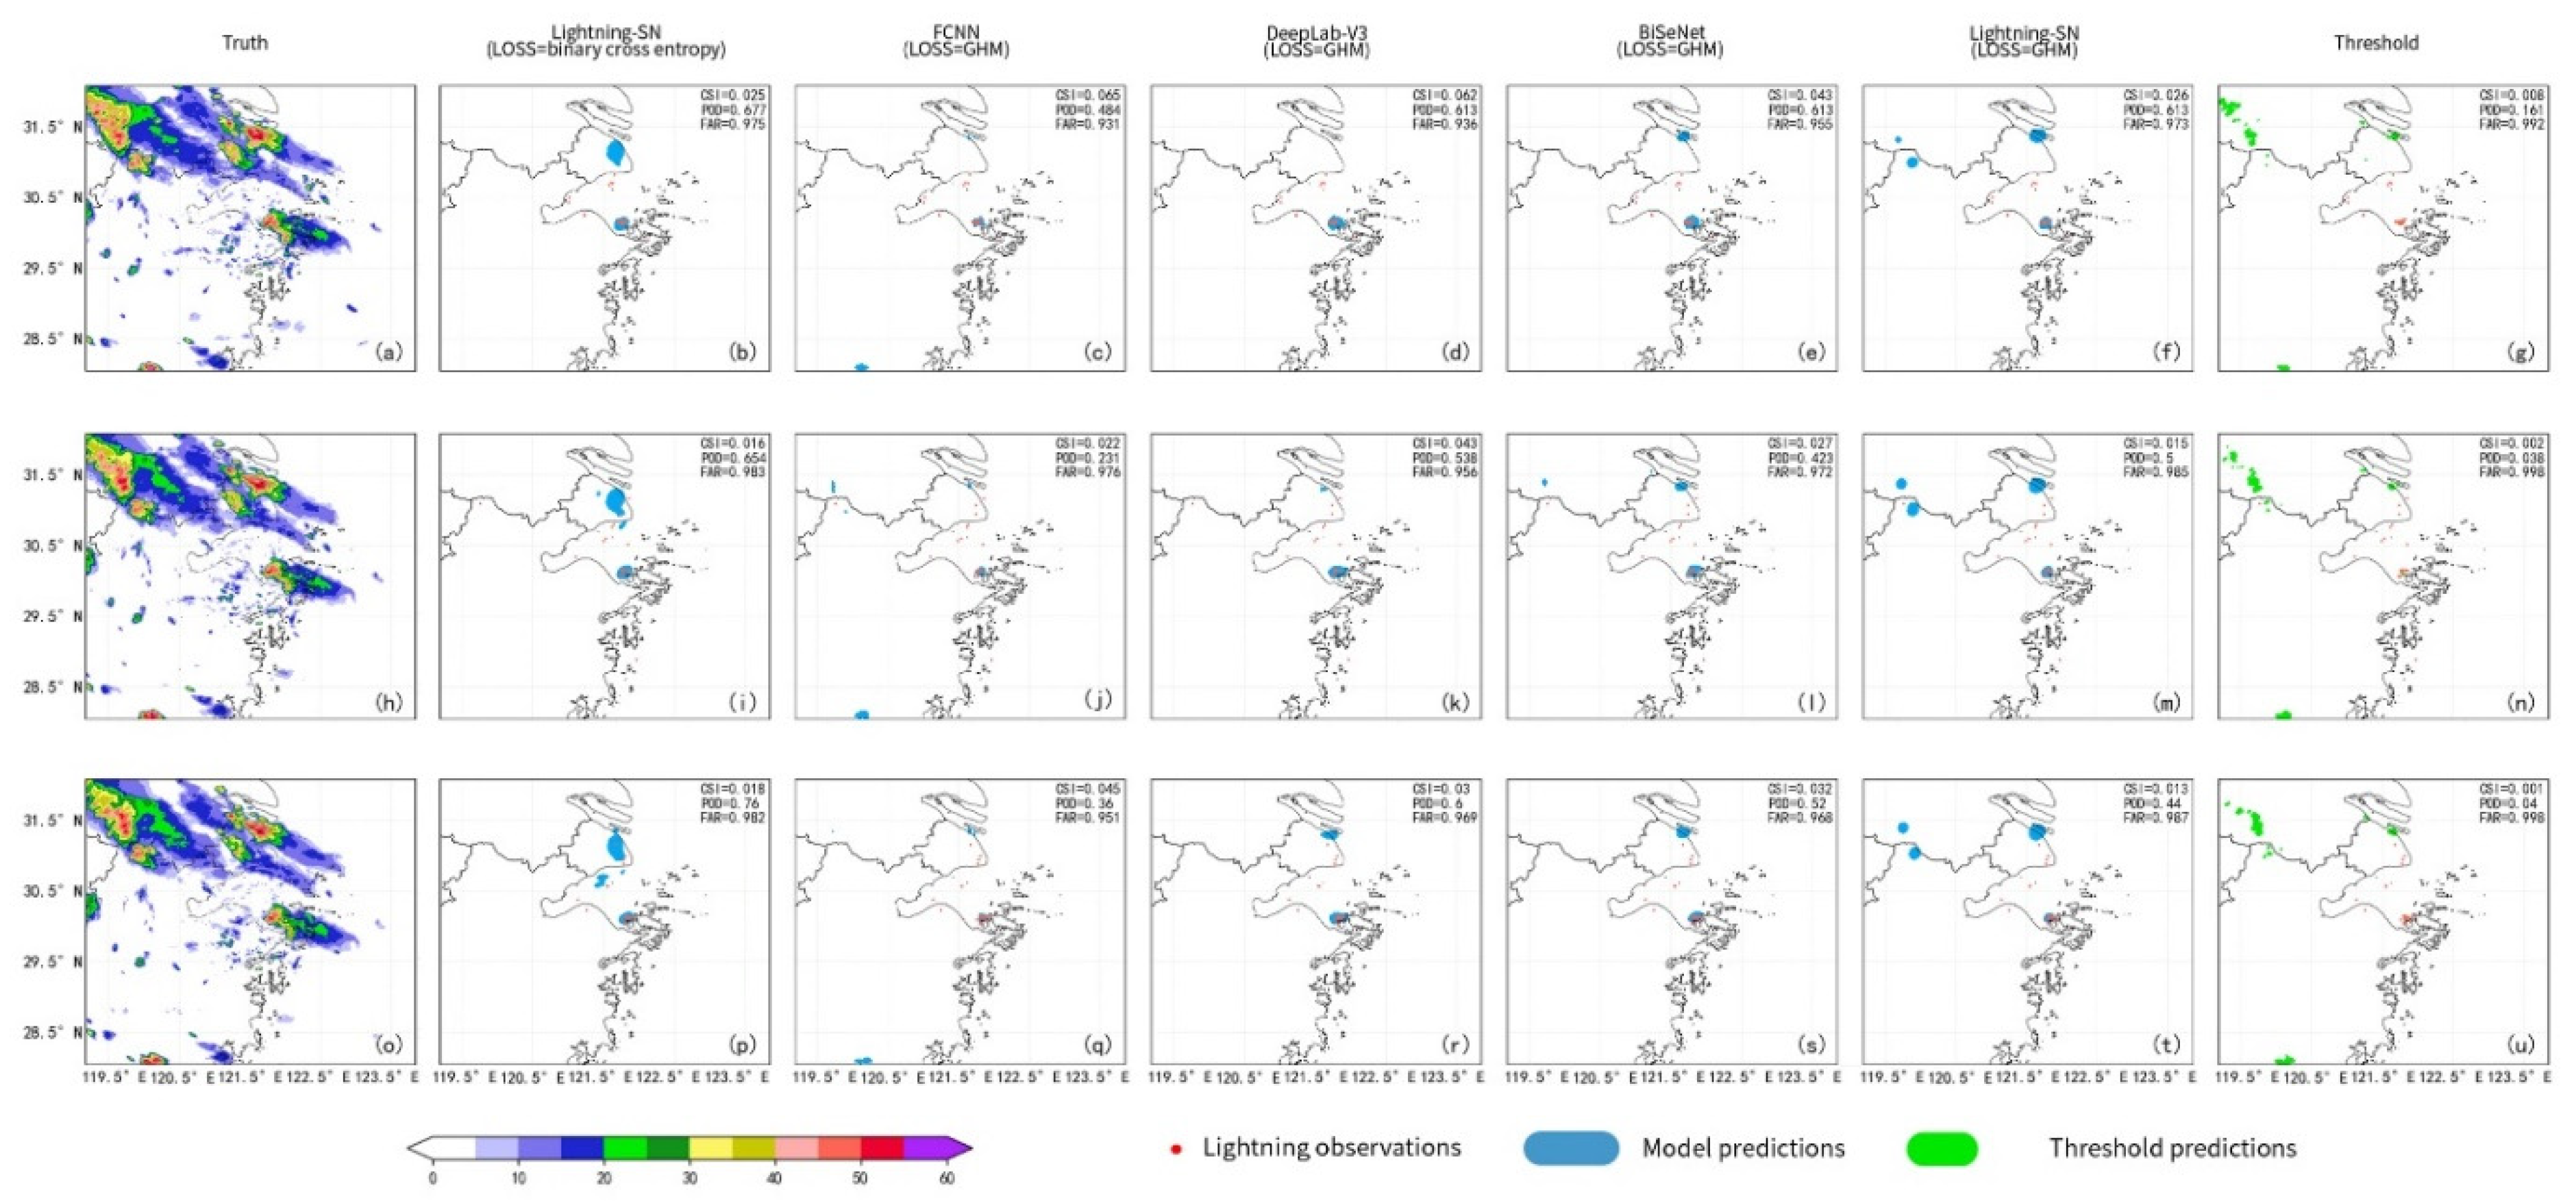
5.4. Case Test Results

In this study, different types of strong convective weather in the Ningbo area were selected to illustrate the identification effects of the algorithm.
Case 1: Influenced by the eastward movement of the bow echo, strong convective weather occurred in most parts of Zhejiang Province from the night of 10 May to the morning of 11 May 2021. Figure 6 shows the radar echoes, algorithm identification results, and identification results of the comparable algorithm between 00:36 and 00:54 on 11 May 2021. As is evident, the Lightning-SN algorithm improved the mean CSI value by 42.3% compared with the threshold method in three consecutive identifications. Owing to the better portrayal of the CG lightning location with a similar bow echo shape, the CG lightning location identified by the threshold method was only sporadically distributed on the bow echo with a relatively high missing alarm ratio.
Case 2: In the early evening of 14 May 2021, influenced by the southwest airflow from the northwest side of the western Pacific subtropical high, severe convective echoes began to develop and move in an east-north-easterly direction from northwest Jiangxi and south Anhui to southwestern Zhejiang Province. From 23:36 to 23:54, the supercell storm affected Hangzhou Bay and the Shaoxing Area. Figure 7 shows that the Lightning-SN algorithm improved the mean CSI score by 20.3% over the threshold method in three consecutive identifications. The recognition results better identify the distribution of the CG lightning location in this weather system. The objective identification of the CG lightning location using the Lightning-SN algorithm is consistent with the observed CG lightning in multiple volume scanning periods. By contrast, the falling areas of CG lightning identified by other comparable algorithms are much smaller.
Case 3: A western-Pacific subtropical high gradually moved northward during the daytime on 10 July 2021. Influenced by the high-level shortwave trough from late afternoon to early evening, scattered thunderstorms occurred from the south of Jiangsu to the north of Zhejiang, with hourly rainfall exceeding 50 mm at partial stations, accompanied by 8–10 grade thunderstorm gales. As is evident from Figure 8, the Lightning-SN algorithm improved the mean CSI score by 300% over the threshold method in three consecutive identifications, and the mean FAR value decreased by 1.43%. The identification results accurately capture the CG lightning location at the center of scattered strong storms. By comparison, the comparable algorithm had a large number of false alarms in northwestern and southwestern Zhejiang. It is clear that the Lightning-SN algorithm exhibited good nonlinear identification capabilities and strong robustness.
The above cases show that for the banded severe convective storms, supercell storms and dispersed intense storms, the DL algorithms generally have higher accuracy in identifying the ground location of CG lightning than traditional threshold methods. There are fewer misreports, while the range of false alarms is significantly reduced. Although the Lightning-SN algorithm is optimal in terms of batch evaluation, it is not the most effective in a specific case. Additionally, the observed lightning location was found to have a large number of outliers. In this regard, both traditional and DL algorithms have difficulty extracting their features.

6. Conclusions

In this study, multiple radar products closely related to lightning were used as characteristic factors, and quality-controlled lightning positioning data were used as label factors. Subsequently, a network model that could be adapted to the characteristics of radar data (namely, the Lightning-SN model) was designed based on the SegNet model. The loss function—which could overcome the imbalance between the positive and negative proportions of the data, the imbalance of the difficulty levels, and multiple outliers—was selected. Through model training and testing, the following conclusions could be drawn.
The Lightning-SN algorithm designed in this study attempted to address the lightning identification problem with a DL approach. The validation test results showed that the algorithm exhibited large performance improvements in comparison to a traditional generic threshold method under the 1-km and 6-minute spatiotemporal resolution conditions of the experimental area. Additionally, the Lightning-SN model exhibited excellent segmentation capabilities of lightning locations.
Due to the serious imbalance between positive and negative labeling factors in the training samples, the model structure, loss function selection, and data quality can have a major impact on model training effectiveness. Improper selection not only weakens model performance, but also causes the trained model to have “garbage outputs,” such as all zeros or ones. The samples in the dataset were not better. In this study, the lightning occurrence frequency in the volume scanning period was used as the threshold to filter the algorithm dataset, and the size of this threshold was balanced to enhance the proportion of positive samples and prevent the degradation of model generalization. The best threshold was then determined using pre–training experimental methods. The experimental results revealed that a suitable threshold could greatly improve the algorithm performance.
Considering the characteristics of radar data, the model structure should be designed to avoid data enhancement operations such as translation and rotation, and to preserve spatial invariance as much as possible. Moreover, the quality control of lightning positioning data can effectively enhance the training accuracy of the model. In this study, the training accuracy of the model was greatly improved after the quality control for the training lightning positioning data, using the conditions of “excluding two-station amplitude locations, two-station hybrid locations, and lightning current amplitudes of less than 2 kA and more than 200 kA.” Consequently, the lightning location could be identified using DL techniques.
In future work, higher resolution meteorological data could be introduced as characteristic factors to improve the model identification performance. The identification technique combined with the radar extrapolation technique works well in operational systems for short-term lightning warnings. Integrating the lightning recognition algorithm and radar echo extrapolation method could help realize the purpose of lightning short-term forecasting. The performance of the lightning-warning algorithm could be optimized by adjusting the lead time of the deep learning algorithm. Moreover, the approach is applicable to the identification of other strong convective weather, including hail and thunderstorm gales.

Author Contributions

Data curation, Z.Q. and L.H.; writing—original draft preparation, Z.Q. and D.W.; visualization, Z.Q., H.Y. and J.Y.; weather data analysis, D.W. and X.S.; writing—review and editing, L.H. and Y.N.; funding acquisition, Z.Q. and L.H. All authors have read and agreed to the published version of the manuscript.

Funding

This research was funded by the Natural Science Foundation of Ningbo, grant number 202003N4193, and the Key Laboratory for Atmospheric Sounding of China, grant number 2021KLAS02Z.

Institutional Review Board Statement

Not applicable.

Informed Consent Statement

Not applicable.

Data Availability Statement

The raw/processed data required to reproduce these findings cannot be shared at this time, as the data also form part of an ongoing study.

Acknowledgments

The authors are extremely thankful to the anonymous reviewers for their constructive comments and interesting suggestions that were helpful in improving the quality of our paper.

Conflicts of Interest

The authors declare no conflict of interest.

Glossary

PoolingThe pooling operation is also called undersampling or downsampling. It is mainly applied to feature downsampling and to compress the data and number of parameters.
ConvolutionThe convolution operation is used to extract the features of the original data using the parameters of the convolution kernel. Each convolution kernel represents one feature.
Semantic segmentationAn image is composed of numerous pixels. The semantic segmentation is the segmentation of pixels according to the different semantic meanings expressed in the image.
Encoder–decoder structureThe encoder is an unsupervised neural network model. It learns the implicit features of the input data. The decoder is also a neural network model. It reconstructs the original input data with new features learned by the encoder. The encoder-decoder structure is a general model framework in deep learning.
Batch normalizationTo achieve the objective of homogeneous data distribution, the distribution of the input values of each neuron in each layer of the neural network is forced back to a standard normal distribution with mean 0 and variance 1 by some normalization means.
ReLUThe Rectified Linear Unit is a common activation function used in artificial neural networks. Compared with other activation functions, it can achieve more efficient gradient descent and back propagation.
Dilated convolutionThe dilated convolution is designed to expand the reception field by injecting holes into the standard convolution map. The size of the reception field symbolizes the network’s learning of global features.
ASPPThe atrous spatial pyramid pooling is a module using multiple parallel cavity convolution layers with different sampling frequencies. The purpose is to increase the reception field and enhance the ability of the network to obtain multi-scale contextual information without degrading the sampling accuracy.
Context pathBiSegNet is a specially defined module in the network. This module improves the reception field and semantic level with a series of convolutions to obtain a large range of contextual information.
SHY95SHY95 is a classification method for precipitation clouds

References

  1. Xiao, Y.; Xiao, Z.; Xiu, W. The advances in the nowcasting techniques on thunderstorms and severe convection. Acta Meteorol. Sin. 2012, 70, 311–337. [Google Scholar]
  2. Jia, L.; Zhi, W.; Yan, R.; Guang, L.; Ya, H. Analysis of thunderstorm days based on lightning location system and manual observation. Meteorol. Sci. Technol. 2012, 40, 132–136. [Google Scholar]
  3. Li, J.; Shen, S.; Liao, R.; Li, B. Analysis of the lightning current amplitude change characteristics in Chongqing area. High Volt. Eng. 2010, 36, 2918–2923. [Google Scholar]
  4. Li, J.; Guo, X.; Xiao, W. Relationship of Cloud-Ground lightning activities with radar echo and precipitation in storms of Beijing. J. Nanjing Inst. Meteorol. 2006, 29, 228–234. [Google Scholar]
  5. Shi, X. Comparative analysis on detection efficiency of two ADTD lightning location systems. Meteorol. Hydrol. Mar. Instrum. 2016, 33, 6–12. [Google Scholar]
  6. Zhao, W.; Lu, T.; Zhang, Y.; Li, Y.; Zhou, X. Method for lightning warning based on multisource observations. Meteorol. Sci. Technol. 2020, 48, 438–442. [Google Scholar]
  7. Zhou, Z.; Min, J.; Peng, X. Extended-VAP method for retrieving wind field from single-doppler radar. (I): Methods and contrast experiment. Plateau Meteorol. 2006, 25, 516–524. [Google Scholar]
  8. Peng, L.; Wan, Q.-L.; Wang, Q.; Yi, Y. The study of the relation between lightning flash and CINRAD Doppler radar’s echo in the central Area of Guangdong. J. Trop. Meteorol. 2007, 23, 171–176. [Google Scholar]
  9. Shi, Y.; Zhang, Y.; Zheng, D.; Meng, Q.; Yao, W.; Liu, H. The relationship between lightning activity and radar echo characteristics of thunderstorm in Beijing area. Meteorol. Mon. 2012, 38, 66–71. [Google Scholar]
  10. Xiao, Y.; Xiu, Y.; Ting, X. Principles and Applications of Doppler Weather Radar; China Meteorological Press: Beijing, China, 2006. [Google Scholar]
  11. Li, F.; Huang, X.; Wang, Z.; Feng, X.; Jiao, X. A preliminary study on lightning identification criteria based on radar data in Nanjing. Sci. Meteorol. Sin. 2010, 30, 202–207. [Google Scholar]
  12. Vincent, B.R.; Carey, L.D.; Schneider, D.; Keeter, K.; Gonski, R. Using WSR-88d reflectivity for the prediction of cloud to ground lightning: A central North Carolina study. Natl. Weather Dig. 2003, 27, 35–44. [Google Scholar]
  13. Yang, Y.; Helen, P. Investigating the potential of using radar echo reflectivity to nowcast Cloud-to-Ground lightning initiation over southern Ontario. Weather. Forecast. 2010, 25, 1235–1248. [Google Scholar] [CrossRef]
  14. Huang, X.; Ma, Y.; Hu, S. Extrapolation and effect analysis of weather radar echo sequence based on deep learning. Acta Meteorol. Sin. 2021, 79, 817–827. [Google Scholar]
  15. Wu, L.; Feng, G.; Yang, Z.; Huang, L.; Cheng, B. Application study of radar data in lightning warning. J. Chendu Univ. Info. Technol. 2010, 25, 524–530. [Google Scholar]
  16. Arel, I.; Rose, D.; Karnowski, T.P. Deep machine learning—A new frontier in artificial intelligence research [Research Frontier]. IEEE Comput. Intell. Mag. 2010, 5, 13–18. [Google Scholar] [CrossRef]
  17. Long, J.; Shelhamer, E.; Darrell, T. Fully convolutional networks for semantic segmentation. IEEE Trans. Pattern Anal. Mach. Intell. 2015, 39, 640–651. [Google Scholar]
  18. Zhang, X.; Yao, Q.; Zhao, J.; Jin, Z.; Feng, Y. Image semantic segmentation based on a fully convolutional neural network. Comput. Eng. Appl. 2022, 1–16. Available online: http://kns.cnki.net/kcms/detail/11.2127.TP.20211220.0930.002.html (accessed on 15 December 2022).
  19. Liu, S.; Yi, L.; Zhang, S.; Shi, X.; Xue, Y. A study of daytime sea fog retrieval over the Yellow Sea based on fully convolutional networks. Trans. Oceanol. Limnol. 2019, 6, 13–22. [Google Scholar]
  20. Zhan, Y.J.; Wang, J.; Shi, J.P.; Cheng, G.; Yao, L.; Sun, W. Distinguishing cloud and snow in satellite images via deep convolutional network. IEEE Geosci. Remote Sens. Lett. 2017, 14, 1785–1789. [Google Scholar] [CrossRef]
  21. Badrinarayanan, V.; Kendall, A.; Cipolla, R. SegNet: A deep convolutional encoder-decoder architecture for scene segmentation. IEEE Trans. Pattern Anal. Mach. Intell. 2017, 39, 2481–2495. [Google Scholar] [CrossRef]
  22. Li, J.; Zhao, P.; Fang, W.; Song, S. Cloud detection of multi-angle remote sensing image based on deep learning. J. Atmos. Environ. Opt. 2020, 15, 13. [Google Scholar]
  23. Zhou, K.; Zheng, Y.; Dong, W.; Wang, T. A deep learning network for cloud-to-ground lightning nowcasting with multisource data. J. Atmos. Ocean. Technol. 2020, 37, 927–942. [Google Scholar] [CrossRef] [Green Version]
  24. Friedman, J.H. On bias, variance, 0/1—Loss, and the curse-of-dimensionality. Data Min. Knowl. Discov. 1997, 1, 55–77. [Google Scholar] [CrossRef]
  25. Berisha, V.; Krantsevich, C.; Hahn, S.; Dasarathy, G.; Turaga, P.; Liss, J. Digital medicine and the curse of dimensionality. NPJ Digit. Med. 2021, 4, 153. [Google Scholar] [CrossRef]
  26. Li, K.; Wei, M.; Yao, Y. Analysis and mechanism study on the correlation between lightning and radar data in severe weather. J. Trop. Meteorol. 2006, 22, 265–272. [Google Scholar]
  27. Jing, S. The cloud-to-ground lightning related to the reflectivity parameters: Case study. Atmos. Sci. 2002, 1, 21–33. [Google Scholar]
  28. Chang, Y.; Chen, D.; Guo, Z. Research on the relationship of doppler radar and the lightning warning. Meteorol. Environ. Sci. 2010, 33, 36–39. [Google Scholar]
  29. Liu, W.; Gou, S.; Fu, Z. Application of radar data in lightning warning over the Northeast of Tibetan Plateau. Meteorol. Mon. 2015, 41, 1253–1259. [Google Scholar]
  30. Steiner, M.; Houze, R.A., Jr.; Yuter, S.E. Climatological characterization of three-dimensional storm structure from operational radar and rain gauge data. J. Appl. Meteorol. 1995, 34, 1978–2007. [Google Scholar] [CrossRef]
  31. Biggerstaff, M.J.; Listemaa, S.A. An improved scheme for convective/stratiform echo classification using radar reflectivity. J. App. Meteorol. 2000, 39, 2129–2150. [Google Scholar] [CrossRef]
  32. Cheng, H.; Wang, Y.; Liu, J.; Liu, B. Lightning location data controlling based on normal distribution fitting and testing. J. Meteorol. Sci. 2015, 35, 195–198. [Google Scholar]
  33. Whitehead, J.T.; Chisholm, W.A.; Anderson, J.G.; Clayton, R.; Elahi, H.; Eriksson, A.J.; Grzybowski, S.; Hileman, A.R.; Janischewskyj, W.; Longo, V.J.; et al. IEEE working report: Estimating lightning performance of transmission lines 2 updates to analytical models. IEEE Trans. Power Deliv. 1993, 8, 1254–1267. [Google Scholar]
  34. Xiecheng, W.; Yao, T.; Ming, X.; Yanqing, L.; Fengjiao, L.; Defeng, X. Research on error analysis and screening method of lightning drop point based on location method. J. Catastrophol. 2021, 36, 41–46. [Google Scholar]
  35. Wang, X.; Qing, J.; Yu, R. T/CMSA0012—2019 Technical Requirements for Lightning Monitoring and Early Warning in Explosion and Fire Hazard Sites; China Meteorological Service Association: Beijing, China, 2019. [Google Scholar]
  36. Li, B.; Liu, Y.; Wang, X. Gradient harmonized single-stage detector. In Proceedings of the AAAI Conference on Artificial Intelligence, Honolulu, HI, USA, 27 January–1 February 2019. [Google Scholar]
  37. McClelland, J.L.; Rumelhart, D.E. Parallel Distributed Processing: Explorations in the Microstructure of Cognition: Foundations; MIT Press: Cambridge, MA, USA, 1986. [Google Scholar]
  38. Kingma, D.; Ba, J. Adam: A method for stochastic optimization. arXiv 2014, arXiv:1412.6980. [Google Scholar]
  39. Breiman, L. Random forests. Mach. Learn. 2001, 45, 5–32. [Google Scholar] [CrossRef]
  40. Geng, Y.A.; Li, Q.; Lin, T.; Jiang, L.; Liangtao, X.; Zheng, D.; Yao, W.; Lyu, W.; Zhang, Y. LightNet: A dual spatiotemporal encoder network model for lightning prediction. In Proceedings of the 25th ACM SIGKDD International Conference, Anchorage, AK, USA, 4–8 August 2019; ACM: New York, NY, USA, 2019. [Google Scholar]
  41. Lin, T.; Li, Q.; Geng, Y.; Jiang, L.; Xu, L.; Zheng, D.; Yao, W.; Lyu, W.; Zhang, Y. Attention–based dual–source spatiotemporal. neural network for lightning forecast. IEEE Access 2019, 7, 158296–158307. [Google Scholar] [CrossRef]
  42. Brodehl, S.; Müller, R.; Schömer, E.; Spichtinger, P.; Wand, M. End–to–End prediction of lightning. events from geostationary satellite images. Remote Sens. 2022, 14, 3760. [Google Scholar] [CrossRef]
  43. Geng, Y.; Li, Q.; Lin, T.; Yao, W.; Xu, L.; Zheng, D.; Zhou, X.; Zheng, L.; Lyu, W.; Zhang, Y. A deep learning framework for lightning forecasting. With multi-source spatiotemporal data. Q. J. R. Meterorol. Soc. 2021, 147, 4048–4062. [Google Scholar] [CrossRef]
  44. Lu, M.; Zhang, Y.; Ma, Z.; Yu, M.; Chen, M.; Zheng, J.; Wang, M. Lightning strike location identification based on. 3D weather radar data. Front. Environ. Sci. 2021, 9, 714067. [Google Scholar] [CrossRef]
Figure 1. Locations of the weather radar and ADTD lightning positioning system stations in Ningbo. The red star denotes the radar station, the purple crosses represent the lightning observation stations, and the blue box indicates the experimental area with color representing the topography.
Atmosphere 13 02112 g001
Figure 2. The impacts analysis of the change in the threshold values of lightning frequency on the performance of data sample filtering algorithm.
Atmosphere 13 02112 g002
Figure 3. Network structure of the Lightning-SN model.
Atmosphere 13 02112 g003
Figure 4. Training workflow of the Lightning-SN network model.
Atmosphere 13 02112 g004
Figure 5. Relative permutation importance of each characteristic factor in the Lightning-SN model. CR (composite reflectivity), ROC (recognition of clouds), V (velocity), VIL (vertically integrated liquid), VILD (vertically integrated liquid density), ET (echo-top height), PPI (echo of the plane-position indicator).
Atmosphere 13 02112 g005
Figure 6. Lightning identification results from 0:36 to 0:54 on 11 May 2021 based on (a,h,o) radar composite reflectivity; (b,i,p) the Lightning-SN algorithm (LOSS = binary cross entropy); (c,j,q) the FCNN algorithm (LOSS = GHM); (d,k,r) the DeepLab-V3 algorithm (LOSS = GHM); (e,l,s) the BiSeNet algorithm (LOSS = GHM); (f,m,t) the Lightning-SN algorithm (LOSS = GHM); and (g,n,u) the threshold method in the (ag) 0:36–0:42, (hn) 0:42–0:48, and (ou) 0:48–0:54 radar volume scanning period.
Atmosphere 13 02112 g006
Figure 7. Similar to Figure 6, but for lightning identification from 23:36 to 23:54 on 14 May 2021. (ag) 23:36–23:42; (hn) 23:42–23:48; (ou) 23:48–23:54.
Atmosphere 13 02112 g007
Figure 8. Similar to Figure 6, but for lightning identification from 16:00 to 16:18 on 10 July 2021. (ag) 16:00–16:06; (hn) 16:06–16:12; (ou) 16:12–16:18.
Atmosphere 13 02112 g008
Table 1. Radar products used for cloud-to-ground (CG) lightning identification.
No.DataPhysical MeaningNo.DataPhysical Meaning
1CRComposite reflectivity110.5 PPIEcho information at E 0.5°
20 CRComposite reflectivity of 0 °C altitude121.5 PPIEcho information at E 1.5°
3−10 CRComposite reflectivity −10 °C altitude132.4 PPIEcho information at E 2.4°
4ROCStratus clouds, warm clouds, and convective clouds143.4 PPIEcho information at E 3.4°
50.5 VRadial velocity at a 0.5° elevation angle154.3 PPIEcho information at E 4.3°
61.5 VRadial velocity at a 1.5° elevation angle166.2 PPIEcho information at E 6.2°
72.4 VRadial velocity at a 2.4° elevation angle179.9 PPIEcho information at E 9.9°
8VILVertically integrated liquid1814.6 PPIEcho information at E 14.6°
9VILDVertically integrated liquid density1919.5 PPIEcho information at E 19.5°
10ETEcho-top height
Table 2. Model hyperparameter information.
HyperparameterSetting
Training sample size448 × 448 × 19
Batch size8
Iteration times30
Learning rate10−3
OptimizerAdam optimizer
Loss functionGHM (bin = 10)
PaddingThe resolution of the input and output feature maps remain constant, with no padding.
Table 3. Definitions of CG lightning identification results.
Identification
PresenceAbsence
ObservationPresenceTPFN
AbsenceFPTN
Table 4. Performance comparison between different models.
AlgorithmLOSSCSIPODFARF1-Score
FCNNGHM0.02510.077050.964110.04897
DeepLab–V3GHM0.026870.08220.961620.05233
BiSeNetGHM0.027720.085880.960680.05394
Threshold/0.016880.01910.98090.0332
Lightning-SNBinary cross-entropy0.022390.035550.942940.04381
Lightning-SNGHM0.041450.091650.929650.0796
Note: Each model was trained five times to avoid random errors, and the best model results were used for comparison.
Publisher’s Note: MDPI stays neutral with regard to jurisdictional claims in published maps and institutional affiliations.

