Article

Quantifying the Source Contributions to Poor Atmospheric Visibility in Winter over the Central Plains Economic Region in China

State Key Laboratory of Atmospheric Boundary Layer Physics and Atmospheric Chemistry (LAPC), Institute of Atmospheric Physics, Chinese Academy of Sciences, Beijing 100029, China
*
Authors to whom correspondence should be addressed.
Atmosphere 2022, 13(12), 2075; https://doi.org/10.3390/atmos13122075
Submission received: 17 November 2022 / Revised: 6 December 2022 / Accepted: 7 December 2022 / Published: 9 December 2022
(This article belongs to the Special Issue Air Pollution in China (2nd Edition))

Abstract

:
The Central Plains Economic Region (CPER) is one of the most polluted regions in China. Air pollution has caused visibility degradation due to the light extinction of fine particles (PM2.5). However, the source of light extinction and visibility degradation is still unclear. In this study, the nested air quality prediction model system coupled with an online tracer-tagging module has been used to quantify the contribution of emission sectors and regions to visibility degradation. The light extinction coefficients were well reproduced over CPER. The results showed that resident-related emissions, traffic and industry were the main sectors of visibility degradation over CPER, contributing 55~62%, 10~28%, and 9~19%, respectively. The contribution of local emissions and regional transport was also investigated, and the results showed that regional transport dominated the light extinction (56~68%), among which transport within Henan province contributes significantly (12~45%). Sensitivity tests showed that the reduction in the resident-related sector was more effective than that of the industry sector. Emission control of 40% in resident-related, industry, and traffic sectors over the whole region can achieve the goal of good visibility. This study will provide scientific suggestions for the control strategies development to mitigate visibility degradation over CPER.

1. Introduction

Visibility refers to the horizontal distance at which an observer can just see a black object viewed against the sky background. Visibility is affected by the concentration of aerosol particles and meteorological conditions like relative humidity [1,2]. Atmospheric visibility is inversely related to light extinction caused by gas and aerosols through scattering and absorbing solar radiation [3]. During the heavy haze pollution period, visibility degradation due to light extinction of high aerosol concentration will delay traffic and affect human safety [4,5]. Therefore, it is urgent to develop control strategies to mitigate visibility degradation.
The aerosol extinction coefficient is associated with mass concentration, chemical composition, and size distribution. Extensive studies on the formation mechanism and source apportionment of haze pollution have been conducted [6,7,8,9]. Studies about aerosol light extinction were mainly focused on the extinction contribution of different components based on observations. Organic matter, ammonium nitrate, and ammonium sulfate were the three dominant species that contributed to the light extinction coefficient in Beijing [10,11,12]. Human activities played a leading role in the increasing optical extinction [2]. Observation showed that the PM2.5 concentration decrease dominated by NH4NO3 mass reduction during COVID-19 caused improving visibility in Wuhan [13]. A few studies have investigated the contribution of emission sectors to light extinction using receptor-based models based on observation [10]. Li et al. [14] investigated that industry and residential sectors are dominant sources of visibility degradation in 2013 in China using the source-oriented CMAQ model and suggested different mitigation strategies were needed for different regions and seasons. However, few studies have quantitatively evaluated the relative contributions of both emission sectors and emission regions to light extinction and visibility degradation [15].
The Central Plains Economic Region (CPER) is one of the most polluted regions in China in recent years (https://www.mee.gov.cn/hjzl/sthjzk/zghjzkgb/, accessed on 7 November 2022). The CPER is consist of 30 prefecture-level cities including all cities in Henan province, the southeast of Shanxi province, the south of Hebei province, the southwest of Shandong province and the northwest of Anhui province, with Zhengzhou as the center. Pollution composition characterization [16,17], formation mechanisms [18], and source apportionment [19,20] in the CPER were investigated. Du et al. [19] found that resident-related sectors, fugitive dust, traffic, and industry emissions were the main sources of PM2.5 over CPER. Researchers also pointed out that the source contributions to PM2.5 mass are different from those to aerosol light extinction [14]. However, studies about light extinction in the CPER are rare. Furthermore, significant improvements in air quality and surface brightening have been seen over eastern and central China since the implementation of the clean air action plan in 2013 [21,22]. The concentration of sulfate decreased sharply due to the wide application of desulfurization technology during the clean air action in recent years, and nitrate and secondary organic aerosols began to dominate particle light extinction [23]. The source of visibility degradation over the CPER since 2013 is still unclear.
The nested air quality prediction model system (NAQPMS) coupled with an online tracer-tagging module has been developed and was used to predict the concentration of PM2.5 and chemical components in December 2017 in the Central Plains, the sector sources of PM2.5 and the impacts of reduction strategies on pollution [19]. The objective of this study is to quantify the sector and region contribution to visibility impairment in December 2017 over CPER. First, the light extinction coefficient was calculated by NAQPMS coupled with an online tracer tagging module. Then, the contribution of different emission sectors and regions to visibility degradation was quantified. Finally, the impacts of control measures on visibility improvement were estimated.

2. Materials and Methods

2.1. Visibility Data

Hour visibility data was obtained from National Climate Data Center (NCDC). Visibility data from surface synoptic observations was selected according to Li et al. [24]. Light extinction coefficient (bext) was converted from visibility according to Koschmieder’s law as Equation (1) [25]:
b e x t = l n 0.05 V i s
where 0.05 is the contract threshold, according to the recommendation from the WMO observation handbook [14,26]. Vis is visibility and the unit of visibility is km. The unit of bext is km−1.

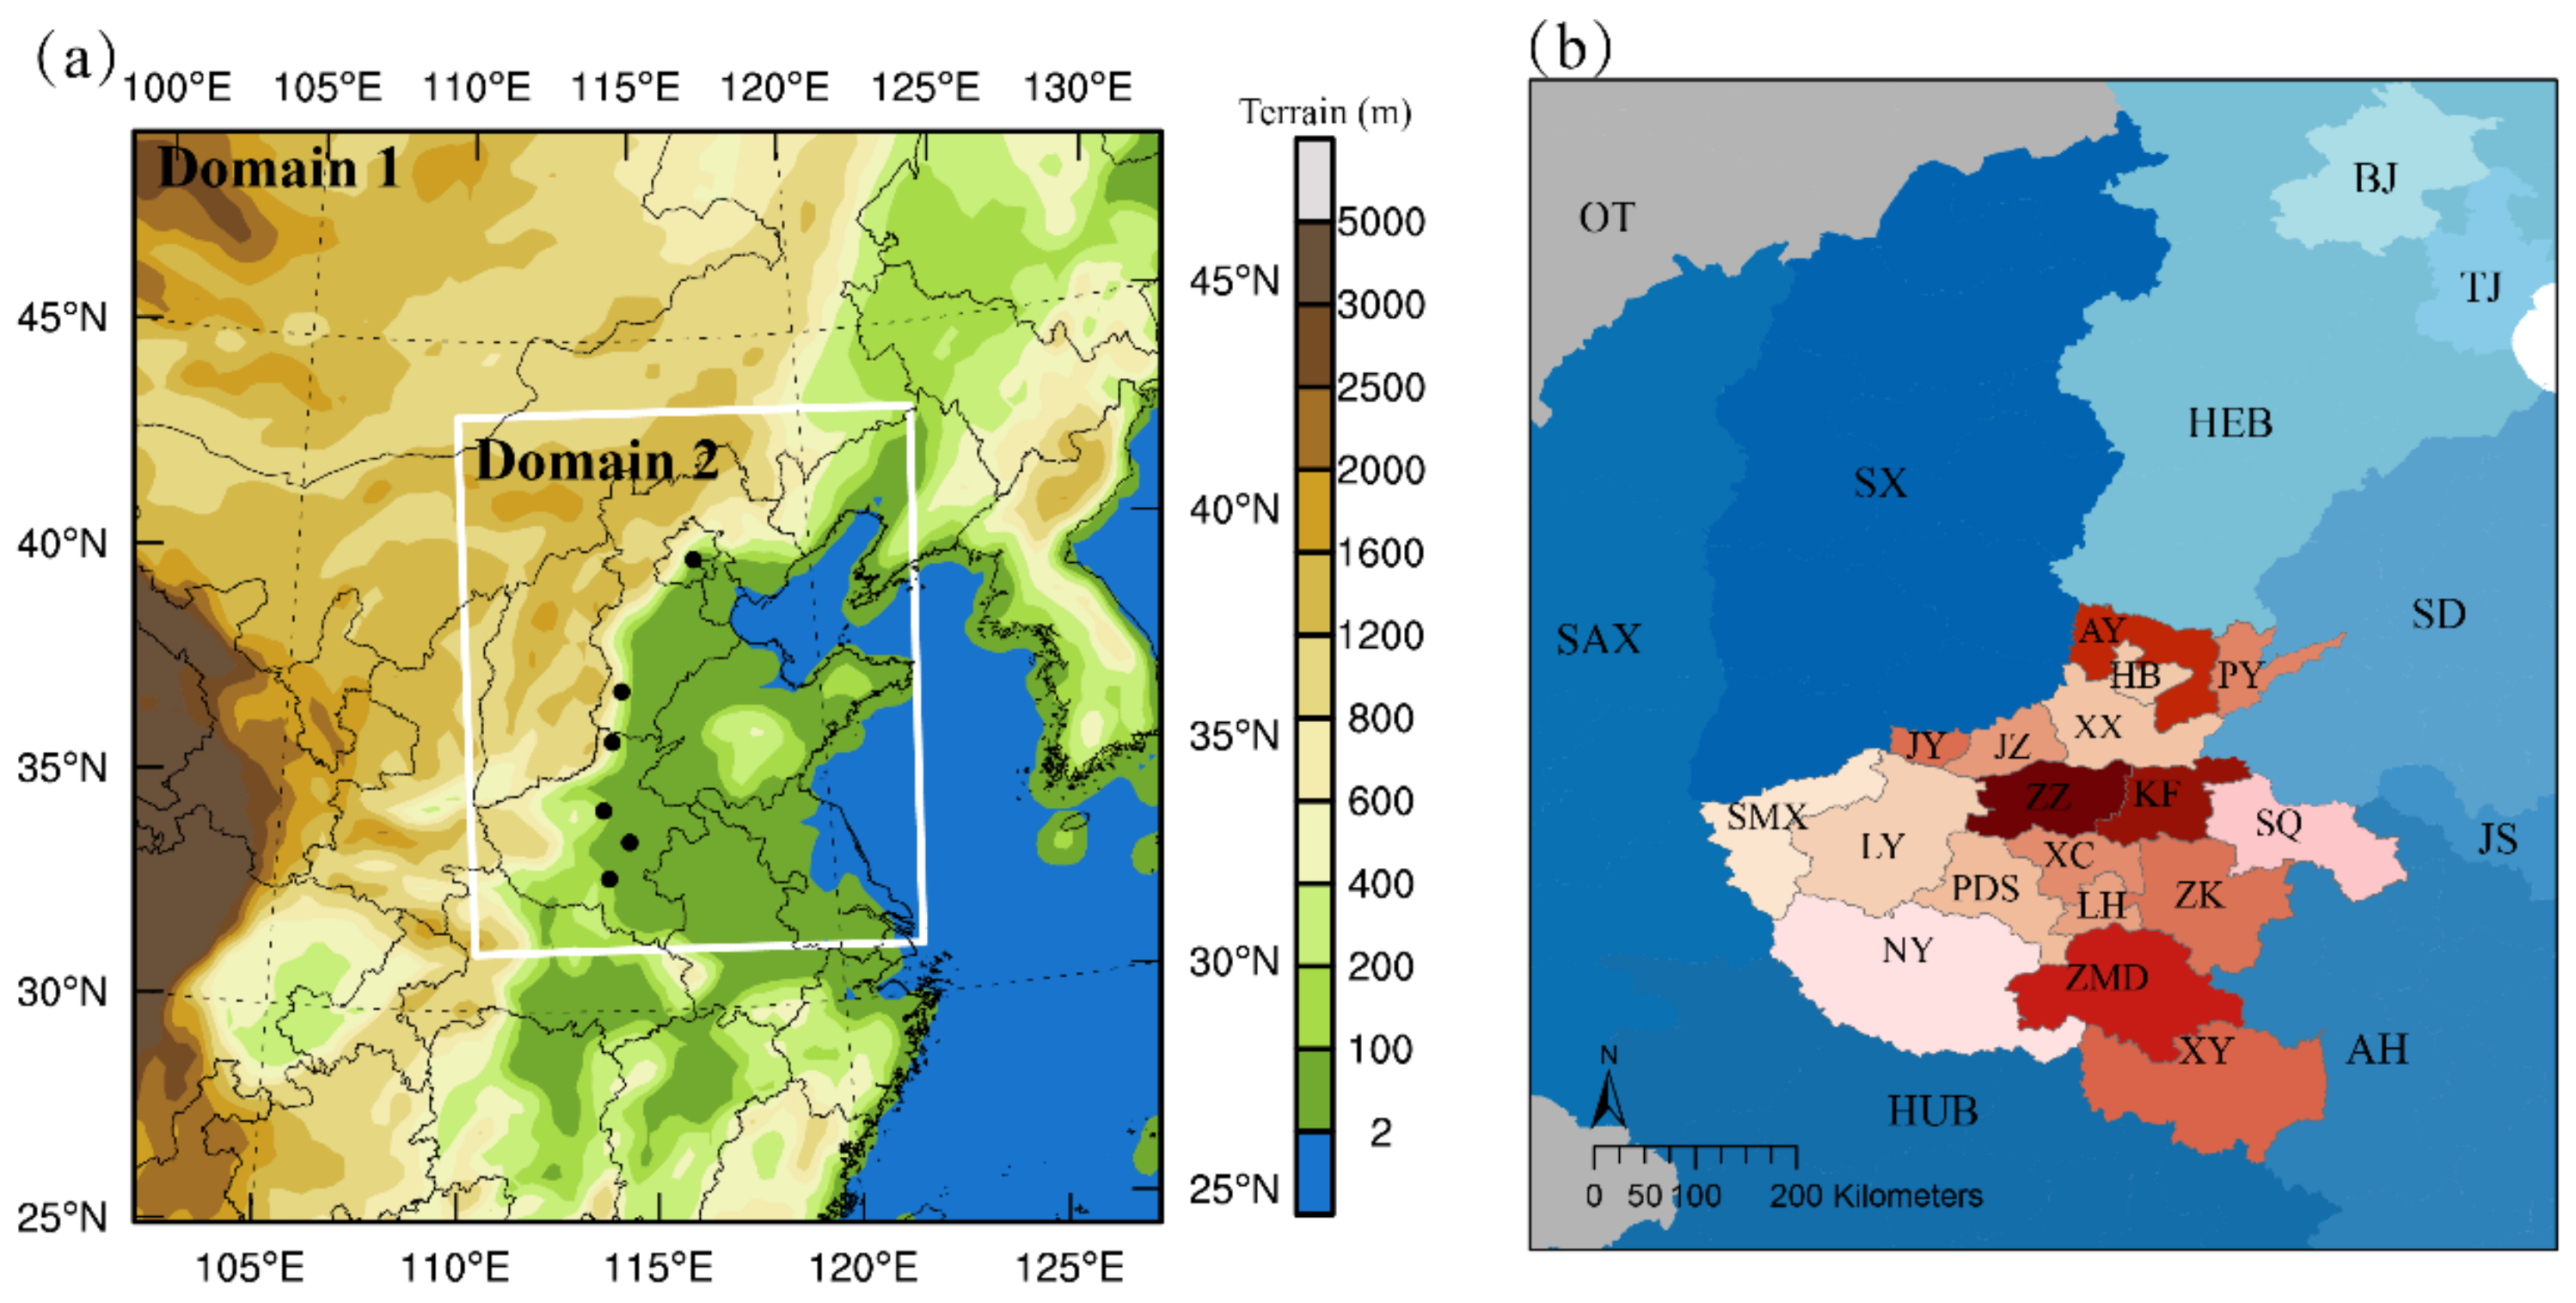
2.2. Air Quality Model

NAQPMS is a three-dimension air quality model developed by the Institute of Atmospheric and Physics, Chinese Academy of Sciences [27]. An online tracer-tagging module was coupled to NAQPMS to quantify the contribution of different sectors and regions to PM2.5 and ozone [20,28,29]. For gas-phase chemistry, the carbon bond mechanism version Z (CBMZ) was used [30]. For secondary inorganic aerosols, the thermodynamic model ISORROPIA was used to calculate the composition [31]. For secondary organic aerosols, the two-product module based on Odum et al. [32] was adopted. The heterogeneous scheme considering aerosol water and mixing state developed by Li et al. [33] was coupled to NAQPMS to improve the simulation performance of secondary inorganic aerosols. More details about updates of NAQPMS can be seen in previous studies [33,34,35]. The NAQPMS with the tracer-tagging module was applied to a two-nested domain in this study. The tracer-tagging module traces the emission sectors and geographical locations of precursors and attributes pollutant concentrations to different regions and sectors at each simulation step without influencing the standard calculations. Secondary particles are attributed to a specific precursor (e.g., sulfate to sulfur dioxide, nitrate to gaseous nitric acid, ammonium to ammonia). The mesoscale Weather Research and Forecasting (WRF, version 3.6.1) model (https://www.mmm.ucar.edu/models/wrf, accessed on 7 November 2022) was used to provide hourly meteorological field data for NAQPMS. Parameterized schemes used in the simulation of WRF were YSU planetary boundary layer scheme [36], Noah land surface scheme [37], Goddard short and long wave radiation [38,39], and Lin microphysics scheme [40].
NAQPMS used two nested domains with the first domain covering East China and the second nested domain covering the North China Plain (Figure 1a). The horizontal resolutions were 27 km and 9 km, respectively. The 0.1° × 0.1° anthropogenic emission over China was obtained from the Multiresolution Emission Inventory for China (MEIC), developed by Tsinghua University (http://www.meicmodel.org, accessed on 7 November 2022). Localized emission inventory over Henan province provided by Zhengzhou University [41] was used in this study. The emission sectors include resident-related sector (resident and agriculture), industry, power, traffic, and fugitive dust emissions. In source tagging calculation, the simulation domain was divided into twenty-eight regions, including Zhengzhou, Anyang, Kaifeng, Hebi, Xinxiang, Jiaozuo, Puyang, Jiyuan, Xinyang, Zhumadian, Sanmenxia, Luoyang, Pingdingshan, Luohe, Xuchang, Zhoukou, Shangqiu, Nanyang, Beijing, Tianjin, Hebei province, Shandong province, Jiangsu province, Anhui province, Hubei province, Shaanxi province, Shanxi province, and other regions (shown in Figure 1b).
Model performance on the evolution of PM2.5 in December 2017 has been evaluated over the North China Plain. Additionally, simulations of chemical composition in several cities in Henan province were evaluated [19]. Overall, NAQPMS can well reproduce the spatial and temporal evolution of PM2.5 and its components over the Central Plains Economic Region. The previous study has laid the foundation for investigating the source of visibility degradation in this study.

2.3. Calculation of Light Extinction Coefficient

In this study, the source contribution of bext was used as a proxy for the source contribution of visibility degradation. Light extinction includes scattering and absorption associated with gases and particles [42]:
b e x t = b a g + b s g + b a p + b s p
where b a g is the gas absorption coefficient mainly due to NO2, b s g is the Rayleigh scattering coefficient by clean air, b a p is the absorption coefficient due to particles, and b s p is the scattering coefficient due to particles.
The calculation of b e x t was based on the IMPROVE algorithm prosed by Malm [43].
b e x t 0.00033 × N O 2 + 0.01 + 0.01 × B C + 0.003 × f R H × N H 4 N O 3 + 0.003 × f R H × ( N H 4 ) 2 S O 4 + 0.004 × O M + 0.001 × F i n e   D u s t + 0.0006 × C o a r s e   M a s s
where f(RH) is the hygroscopic growth factor for secondary inorganic aerosols calculated by Pan et al. [44]. Mass concentration of components is shown in brackets.

3. Results

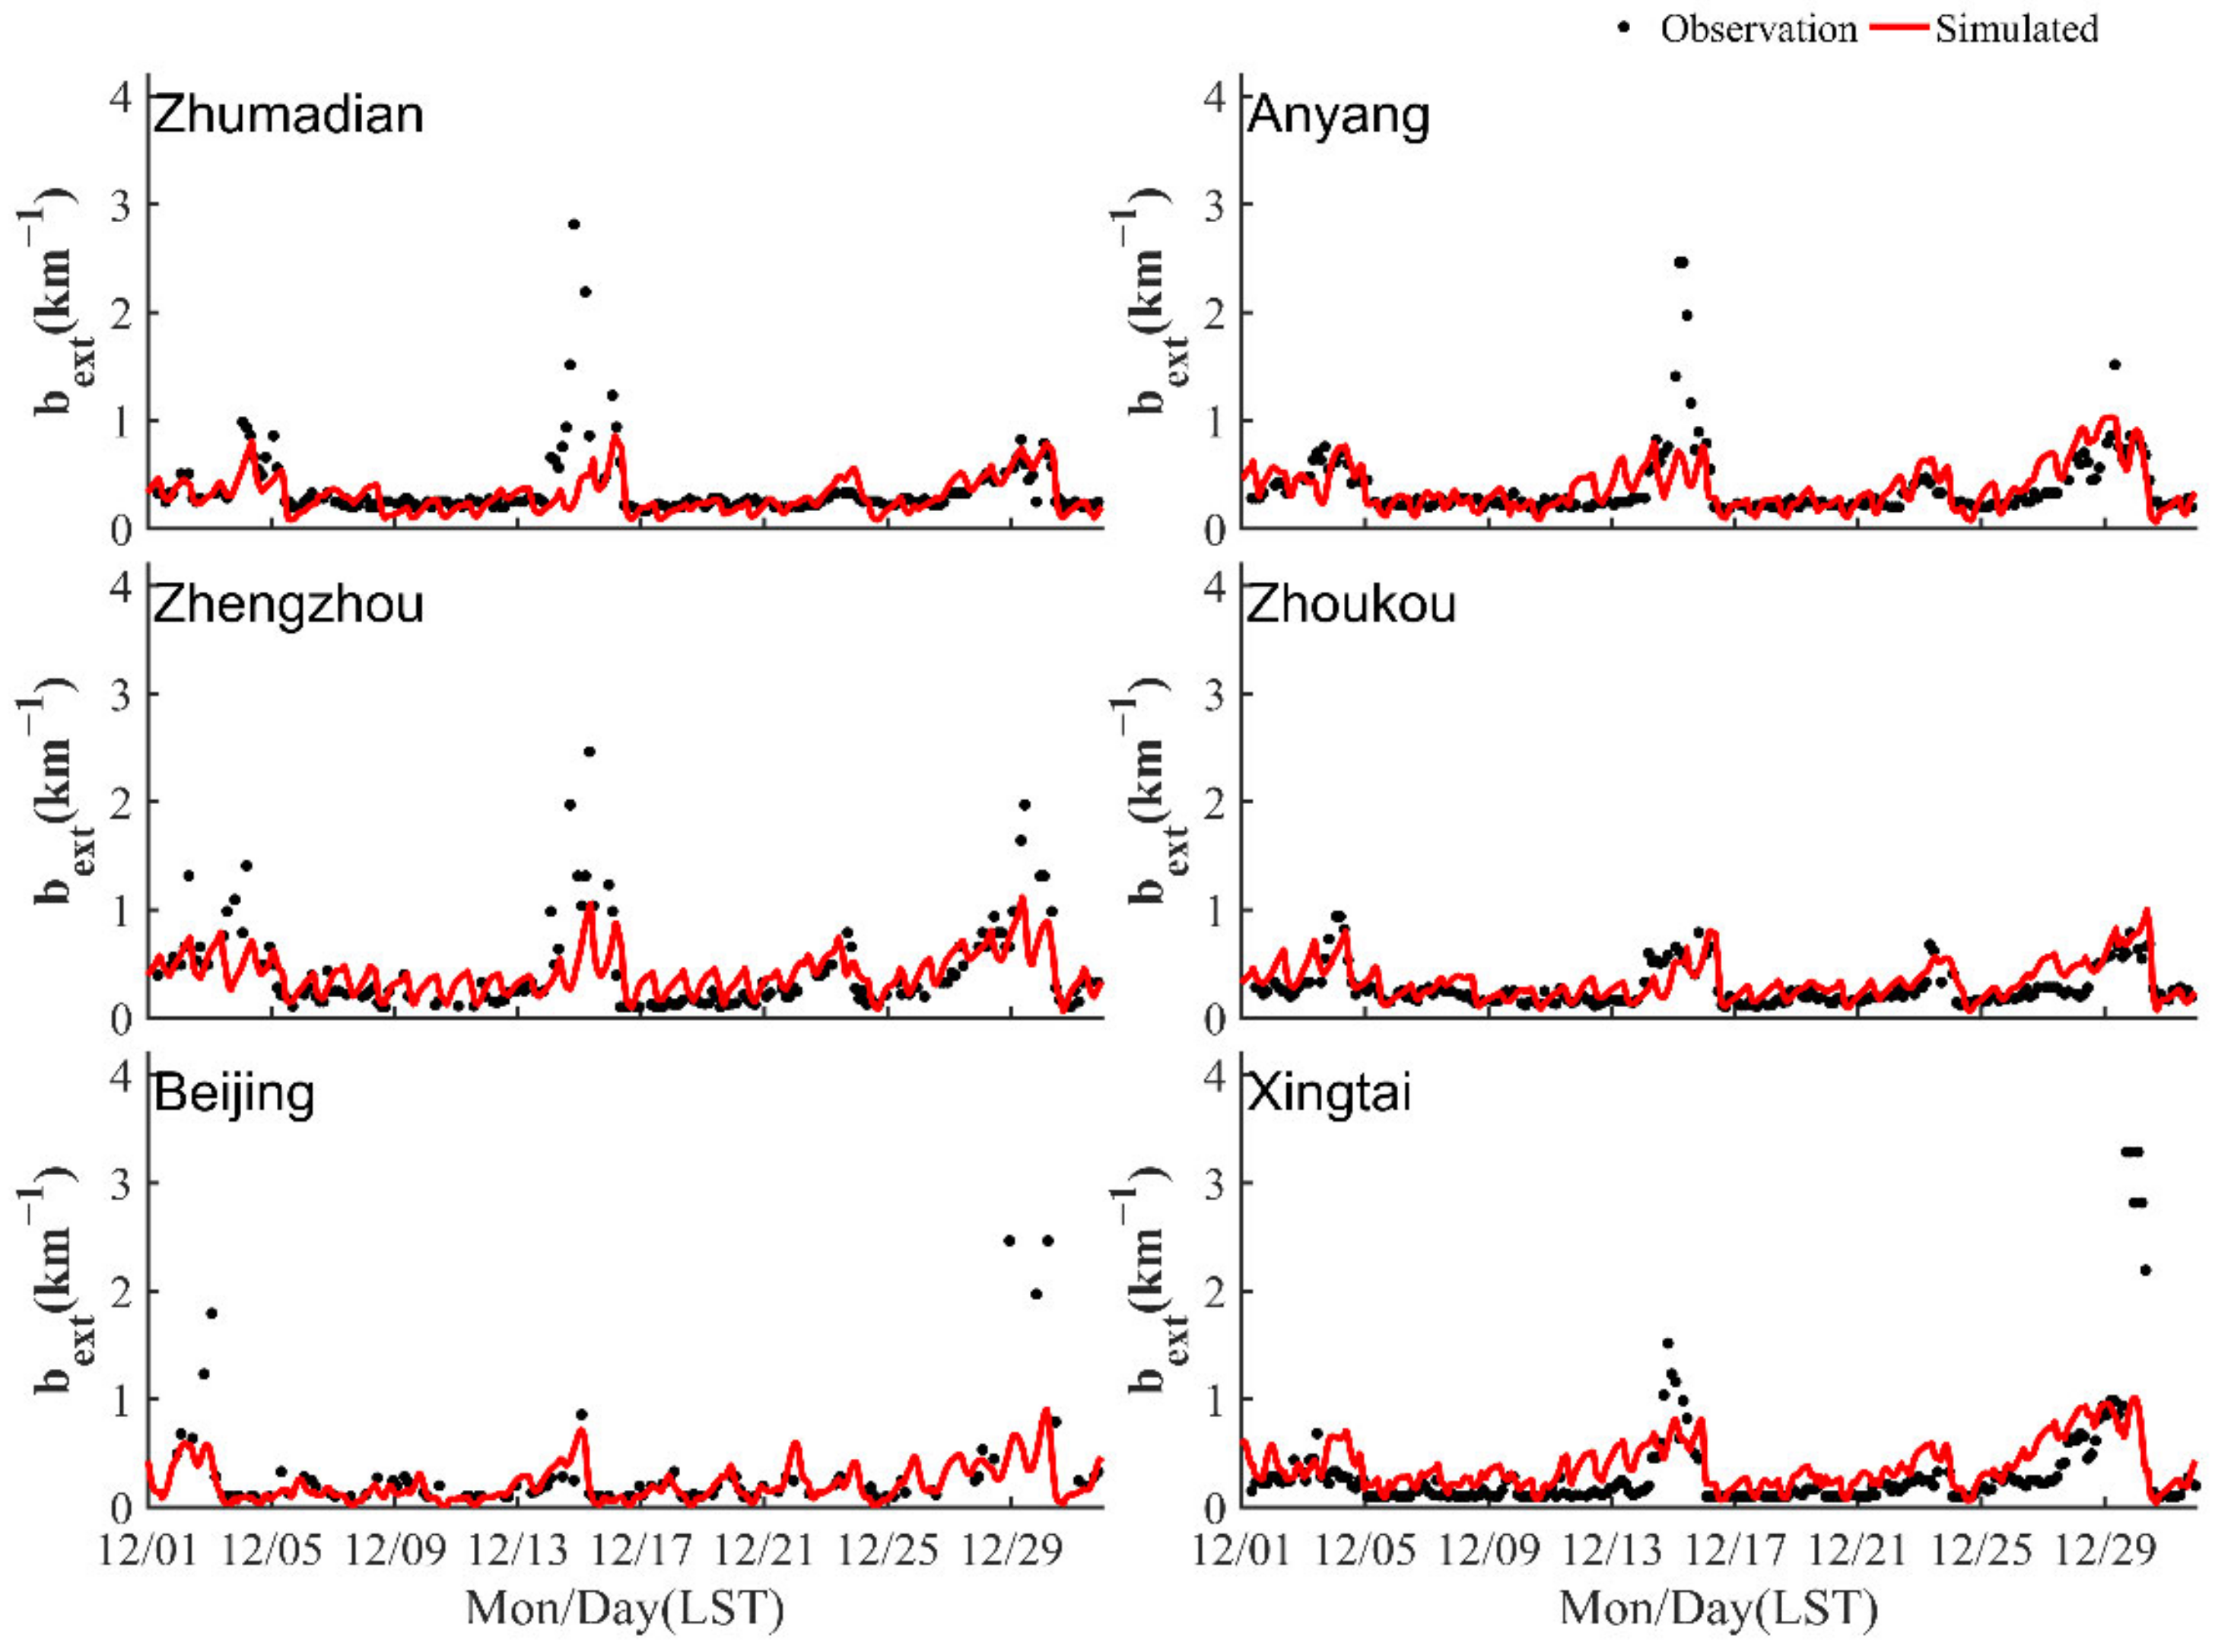
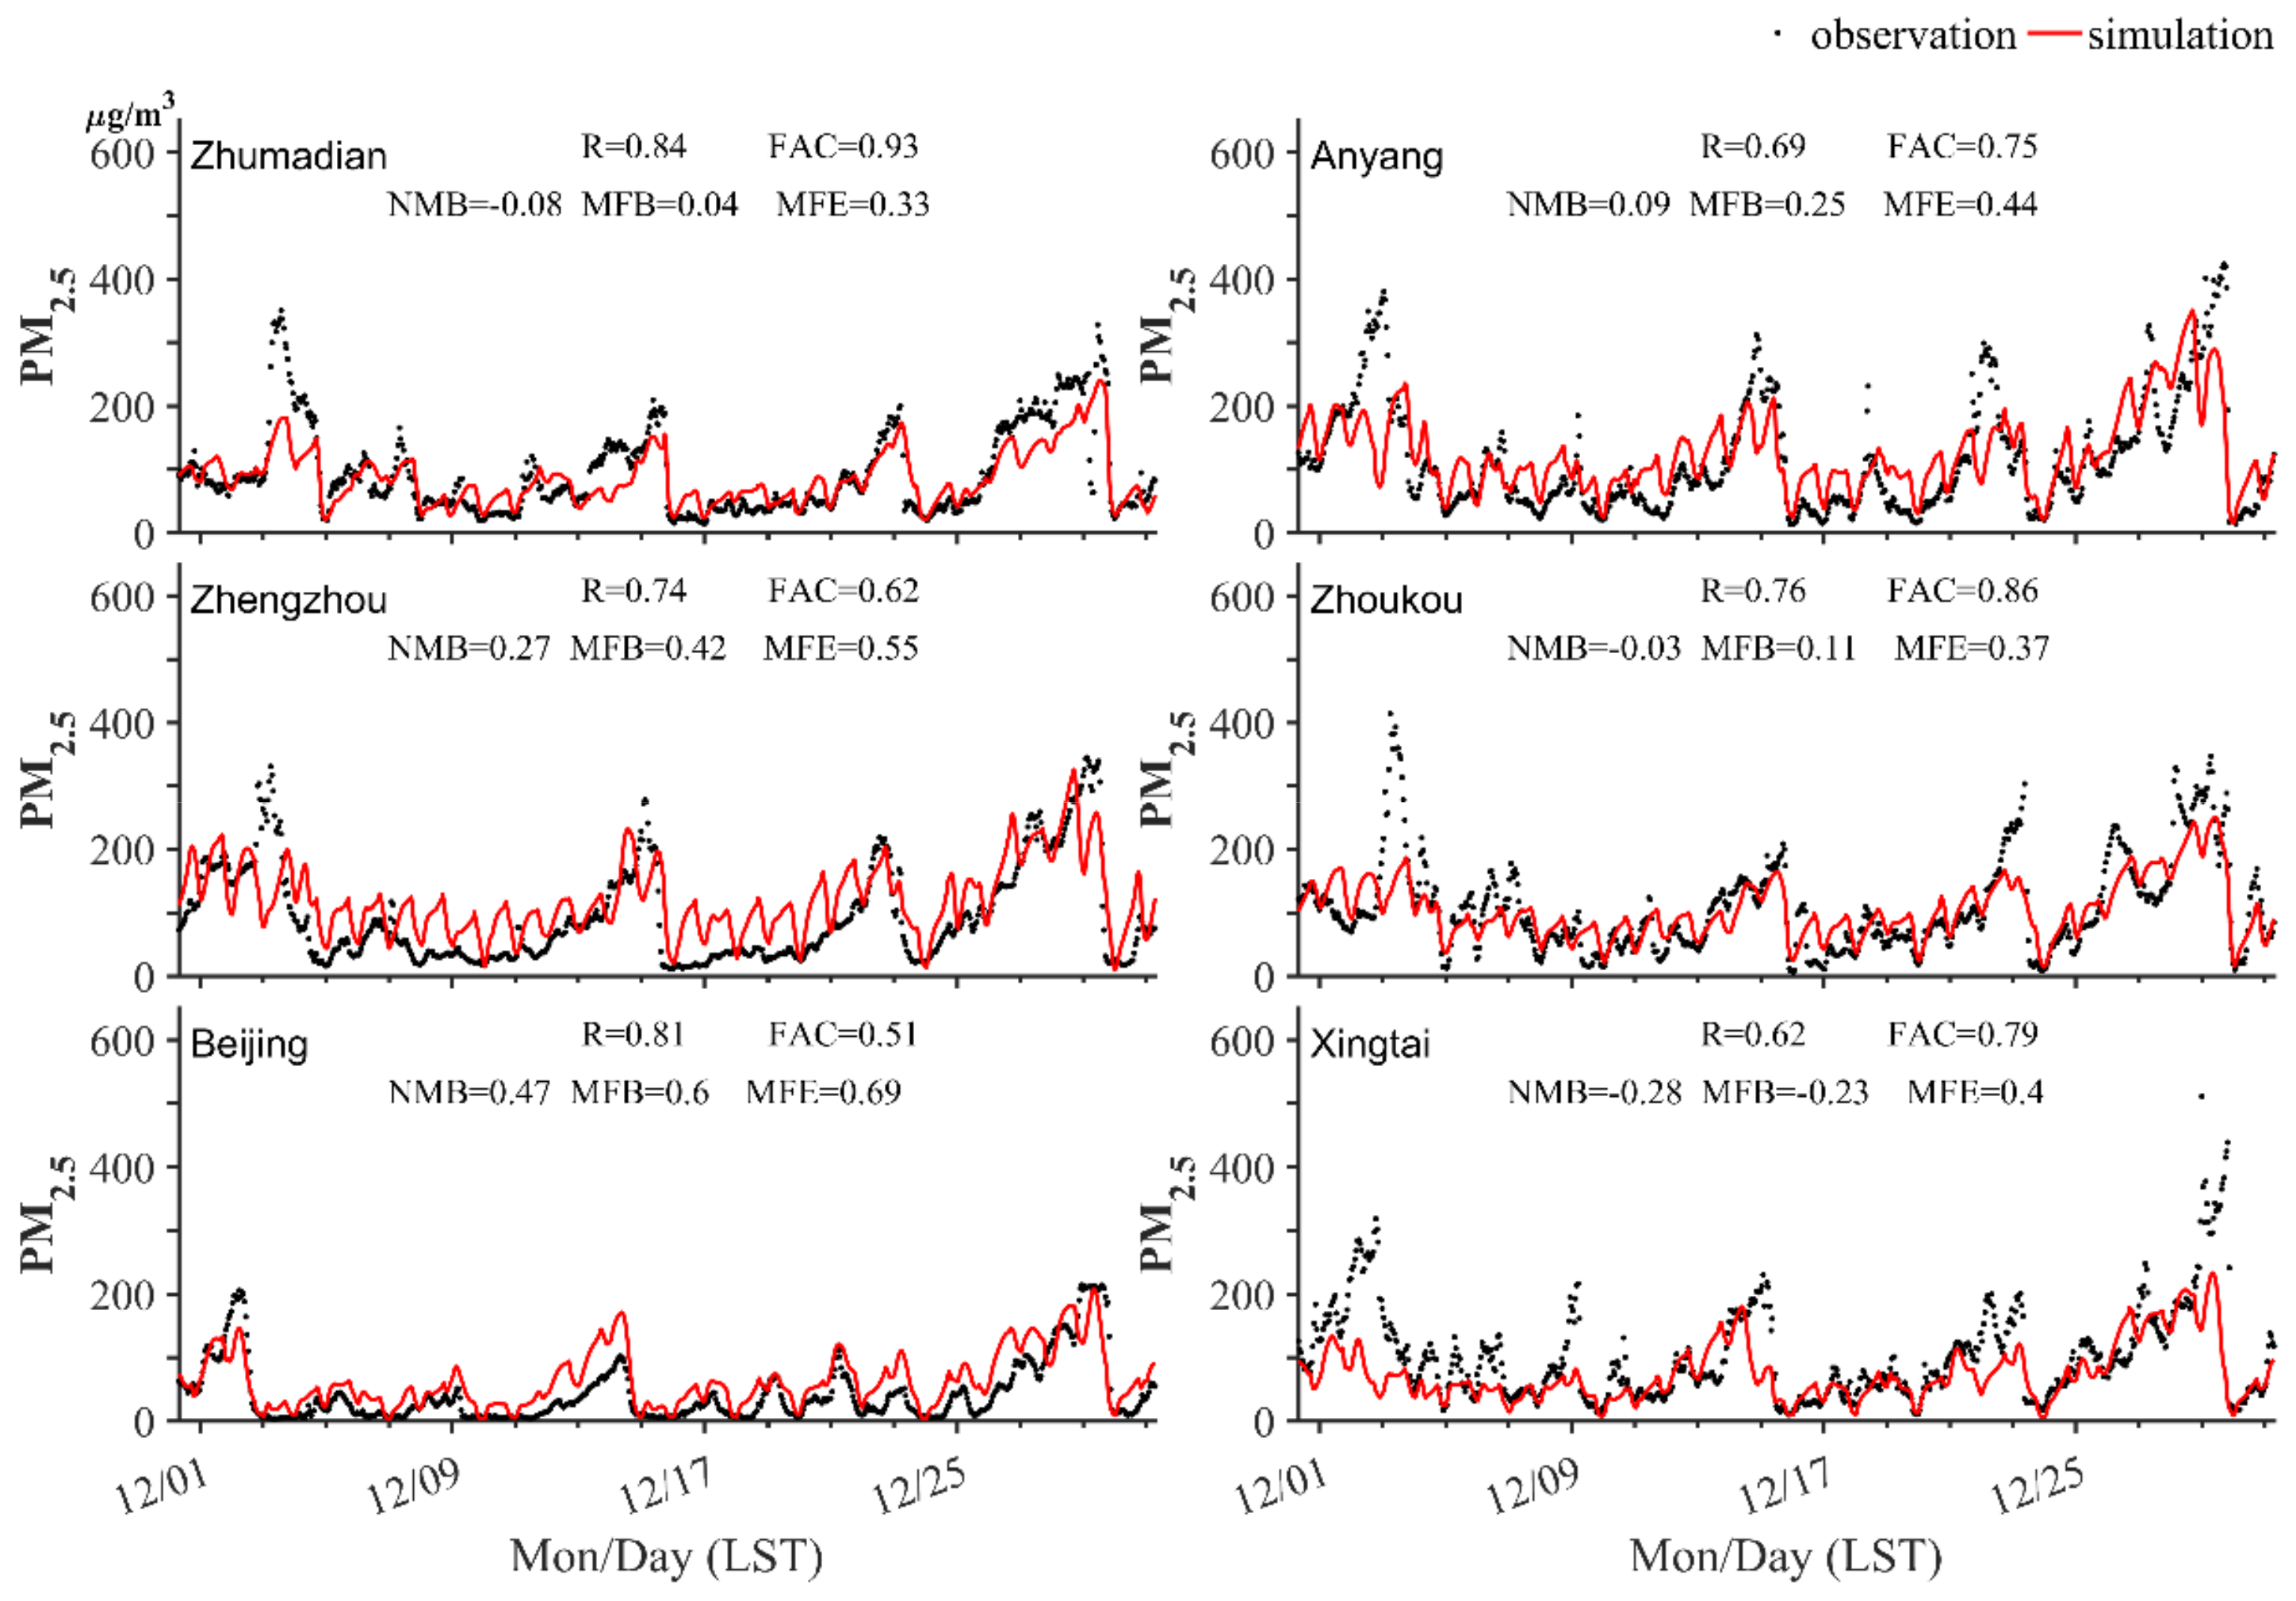
3.1. Model Validation

The statistical parameters, including the mean observed values (MO), mean predicted values (MP), correlation coefficient (R), normalized mean bias (NMB), mean fractional bias (MFB), and mean fractional error (MFE) were used to quantitatively assess the model performance (Table A1 in Appendix A). According to Boylan and Russell [45], the predicted PM2.5 concentrations were generally within the acceptable performance criteria as MFB was within ±0.6 and MFE was within ±0.75 (Figure A1 in Appendix A). The NAQPMS reproduced the evolution of bext well in six representative cities in the Central Plains Economic Region and surrounding regions (Figure 2). It should be noted that there was an underestimation of peak value, and this may be related to the underestimation of PM2.5 concentration. The R between the observed and simulated extinction coefficients was in the range of 0.44 to 0.75, and more than 57% of the simulated results at most sites were within a factor of 2 of the observations (Table 1). In general, the NAQPMS model reasonably reproduces the spatial and temporal variations in the concentrations of aerosol and light extinction coefficient, providing confidence in the quantifying source contributions to visibility degradation in each city.

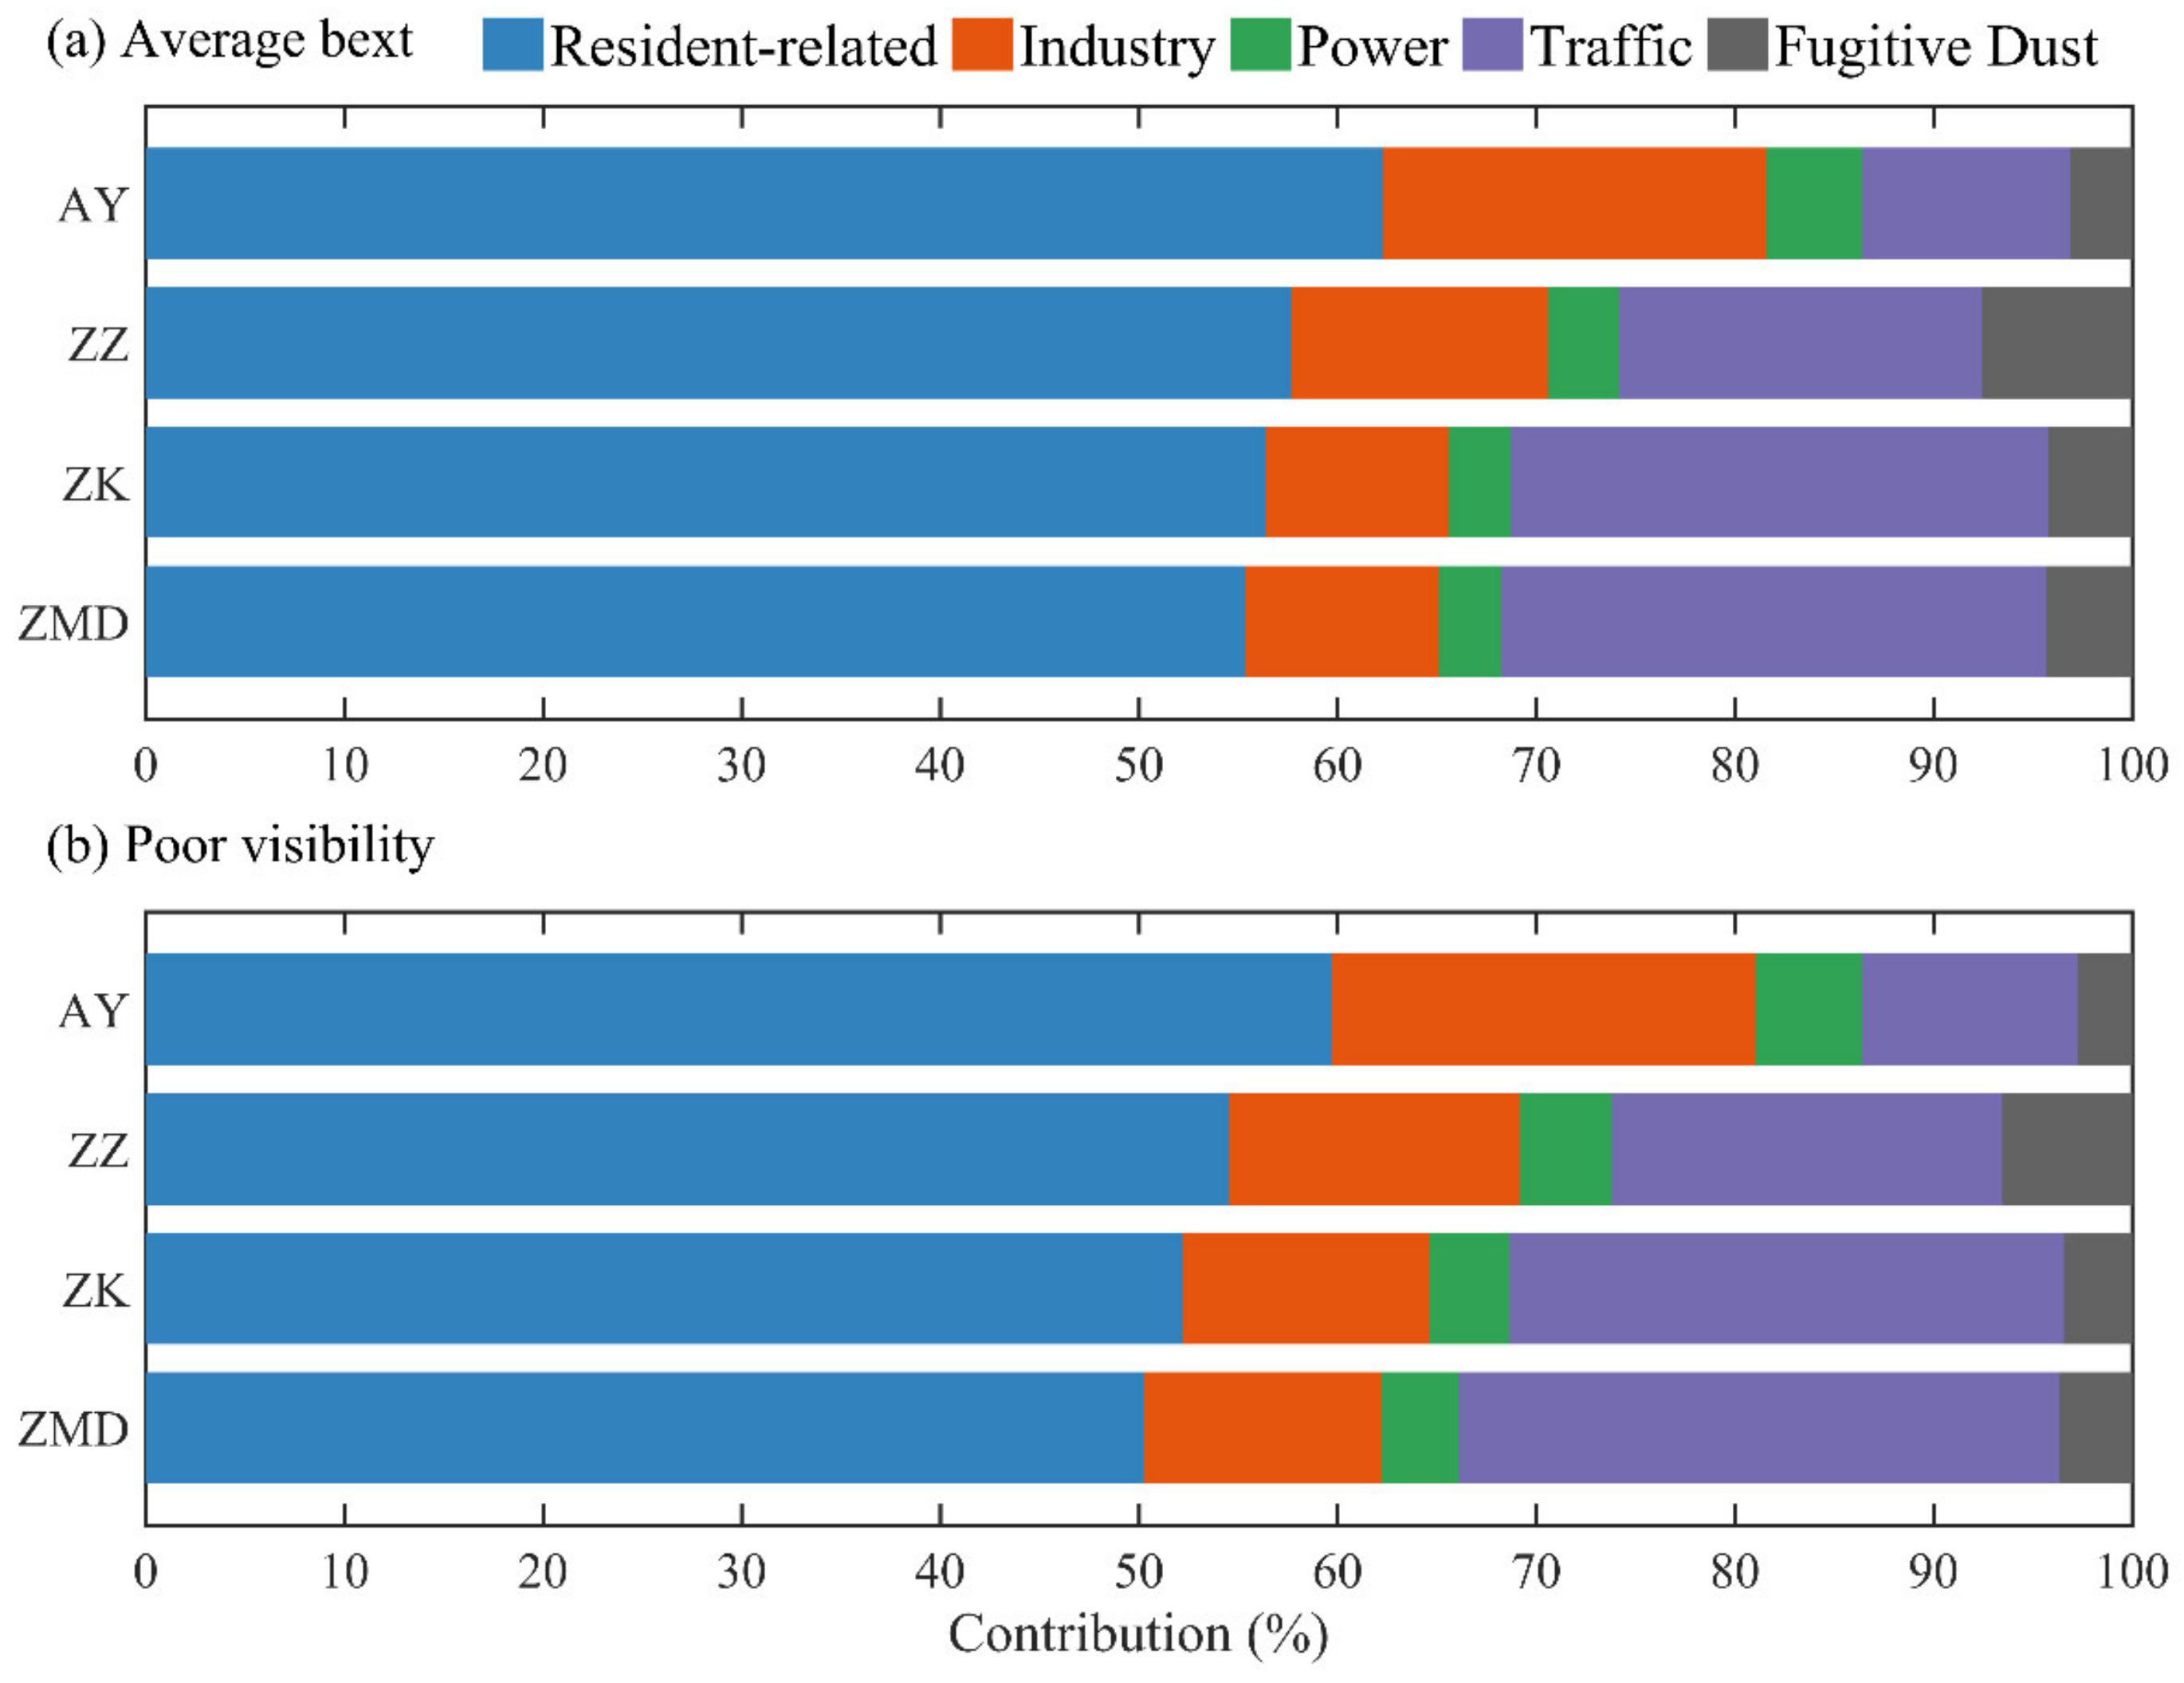
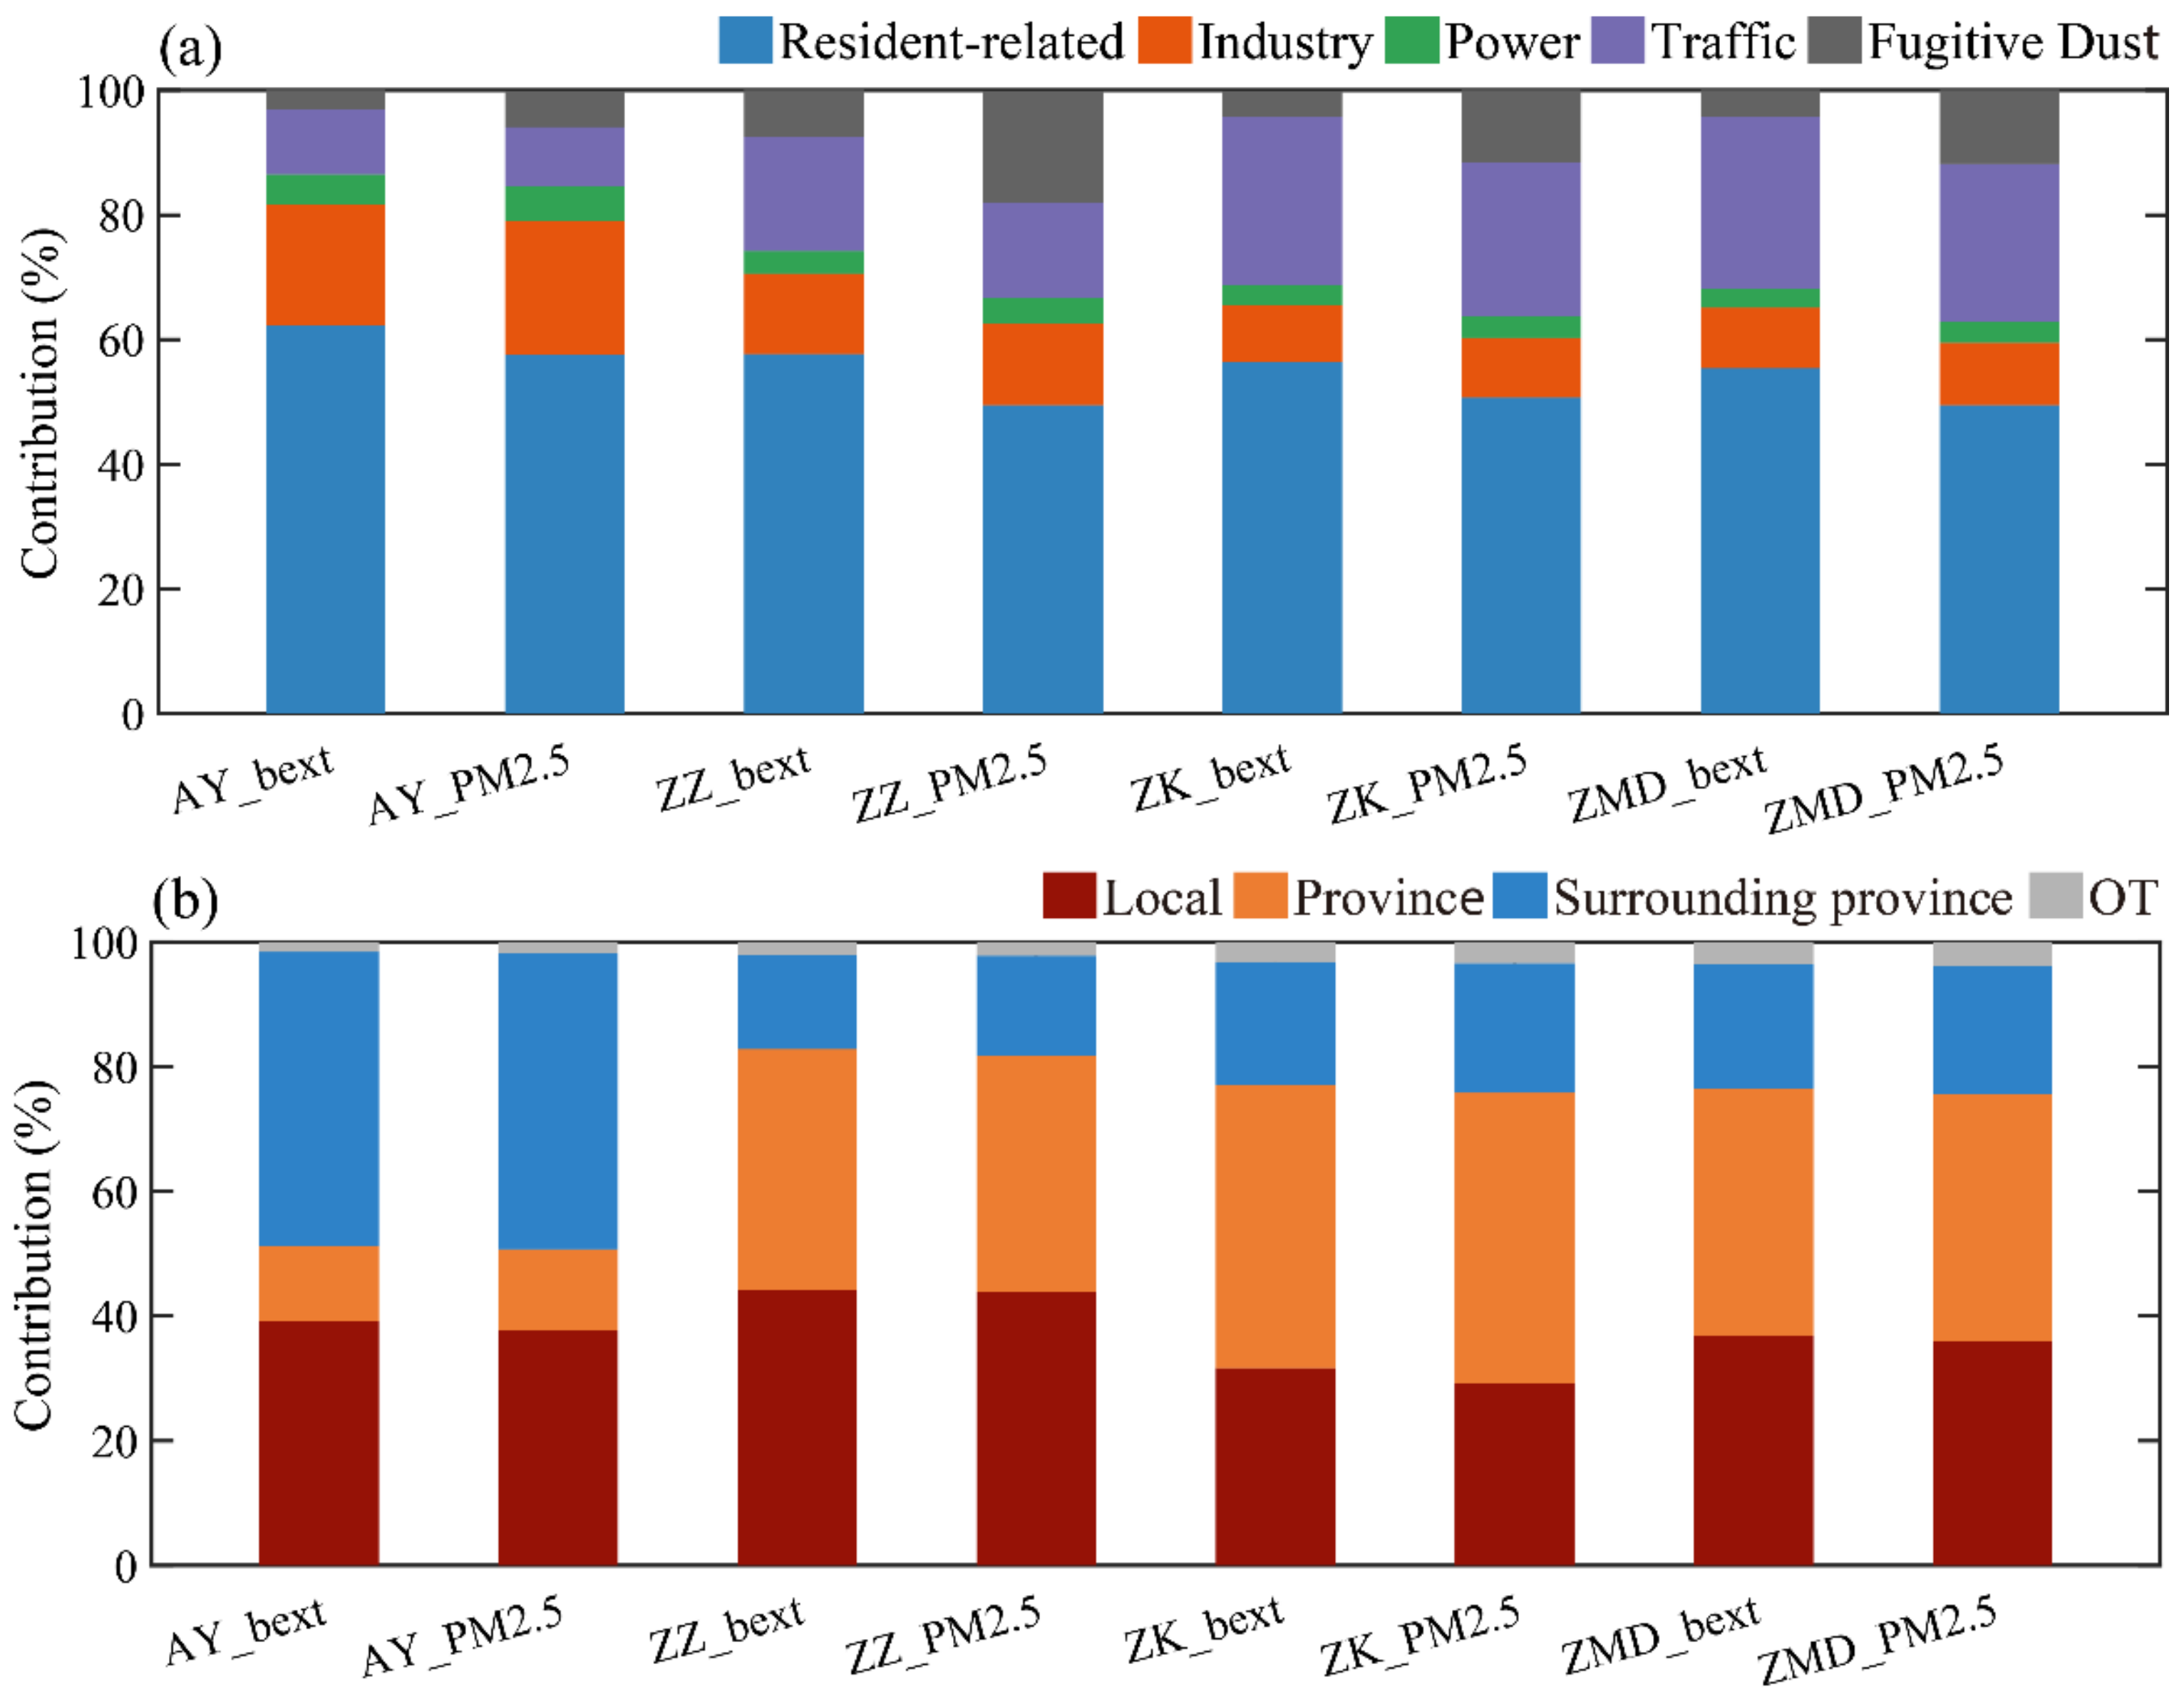
3.2. Sector Source Contribution to bext

Four cities (Anyang, Zhengzhou, Zhoukou, and Zhumadian) were selected as representatives to investigate the major source of bext in the CPER. The monthly average sector sources of light extinction over the CPER are shown in Figure 3. The resident-related sector was the dominant source, contributing 55~62% to bext. The traffic and industry sources were also important, contributing 10~28% and 9~19%, respectively, to total light extinction. Power and fugitive dust emission only accounted for 3~8% of the total light extinction. However, the contribution from source sectors varied significantly between different cities. The contribution of industry sector emissions is highest in Anyang, accounting for 19%, and this is related to the industrial structure. For Zhengzhou, resident-related emissions (58%), traffic (18%), and industry (13%) were the three main sector sources of bext. The result was similar to Du et al. [19] in that resident-related emissions (49%), fugitive dust (19%), traffic (15%) and industry (13%) emissions were the main sources of PM2.5 in Zhengzhou. The sector sources of bext and PM2.5 were different. The contribution of resident-related emissions and traffic to light extinction was larger than their contribution to PM2.5. However, the contribution of fugitive dust to bext was much smaller than its contribution to PM2.5 mass concentration (Figure A2a). This is because resident-related emissions and traffic are the main sources of precursors (NH3 and NO2) of NH4NO3, which is an important source of aerosol light extinction. Furthermore, different compositions of secondary inorganic aerosols having different hypsographic growth factors is another reason. Fine dust and OC particles emitted by the fugitive sector are hydrophobic. During poor visibility periods (when visibility is less than 5 km, namely bext larger than 0.6 km−1), the contribution of resident-related sources to bext over CPER decreased while the contribution of traffic and industry sector increased compared to average condition. Take Zhengzhou for example, the contribution of resident-related source decreased from 58% to 55% while the contribution of traffic and industry sector increased from 18% and 13% to 20% and 15%, respectively, from average conditions to poor visibility conditions.

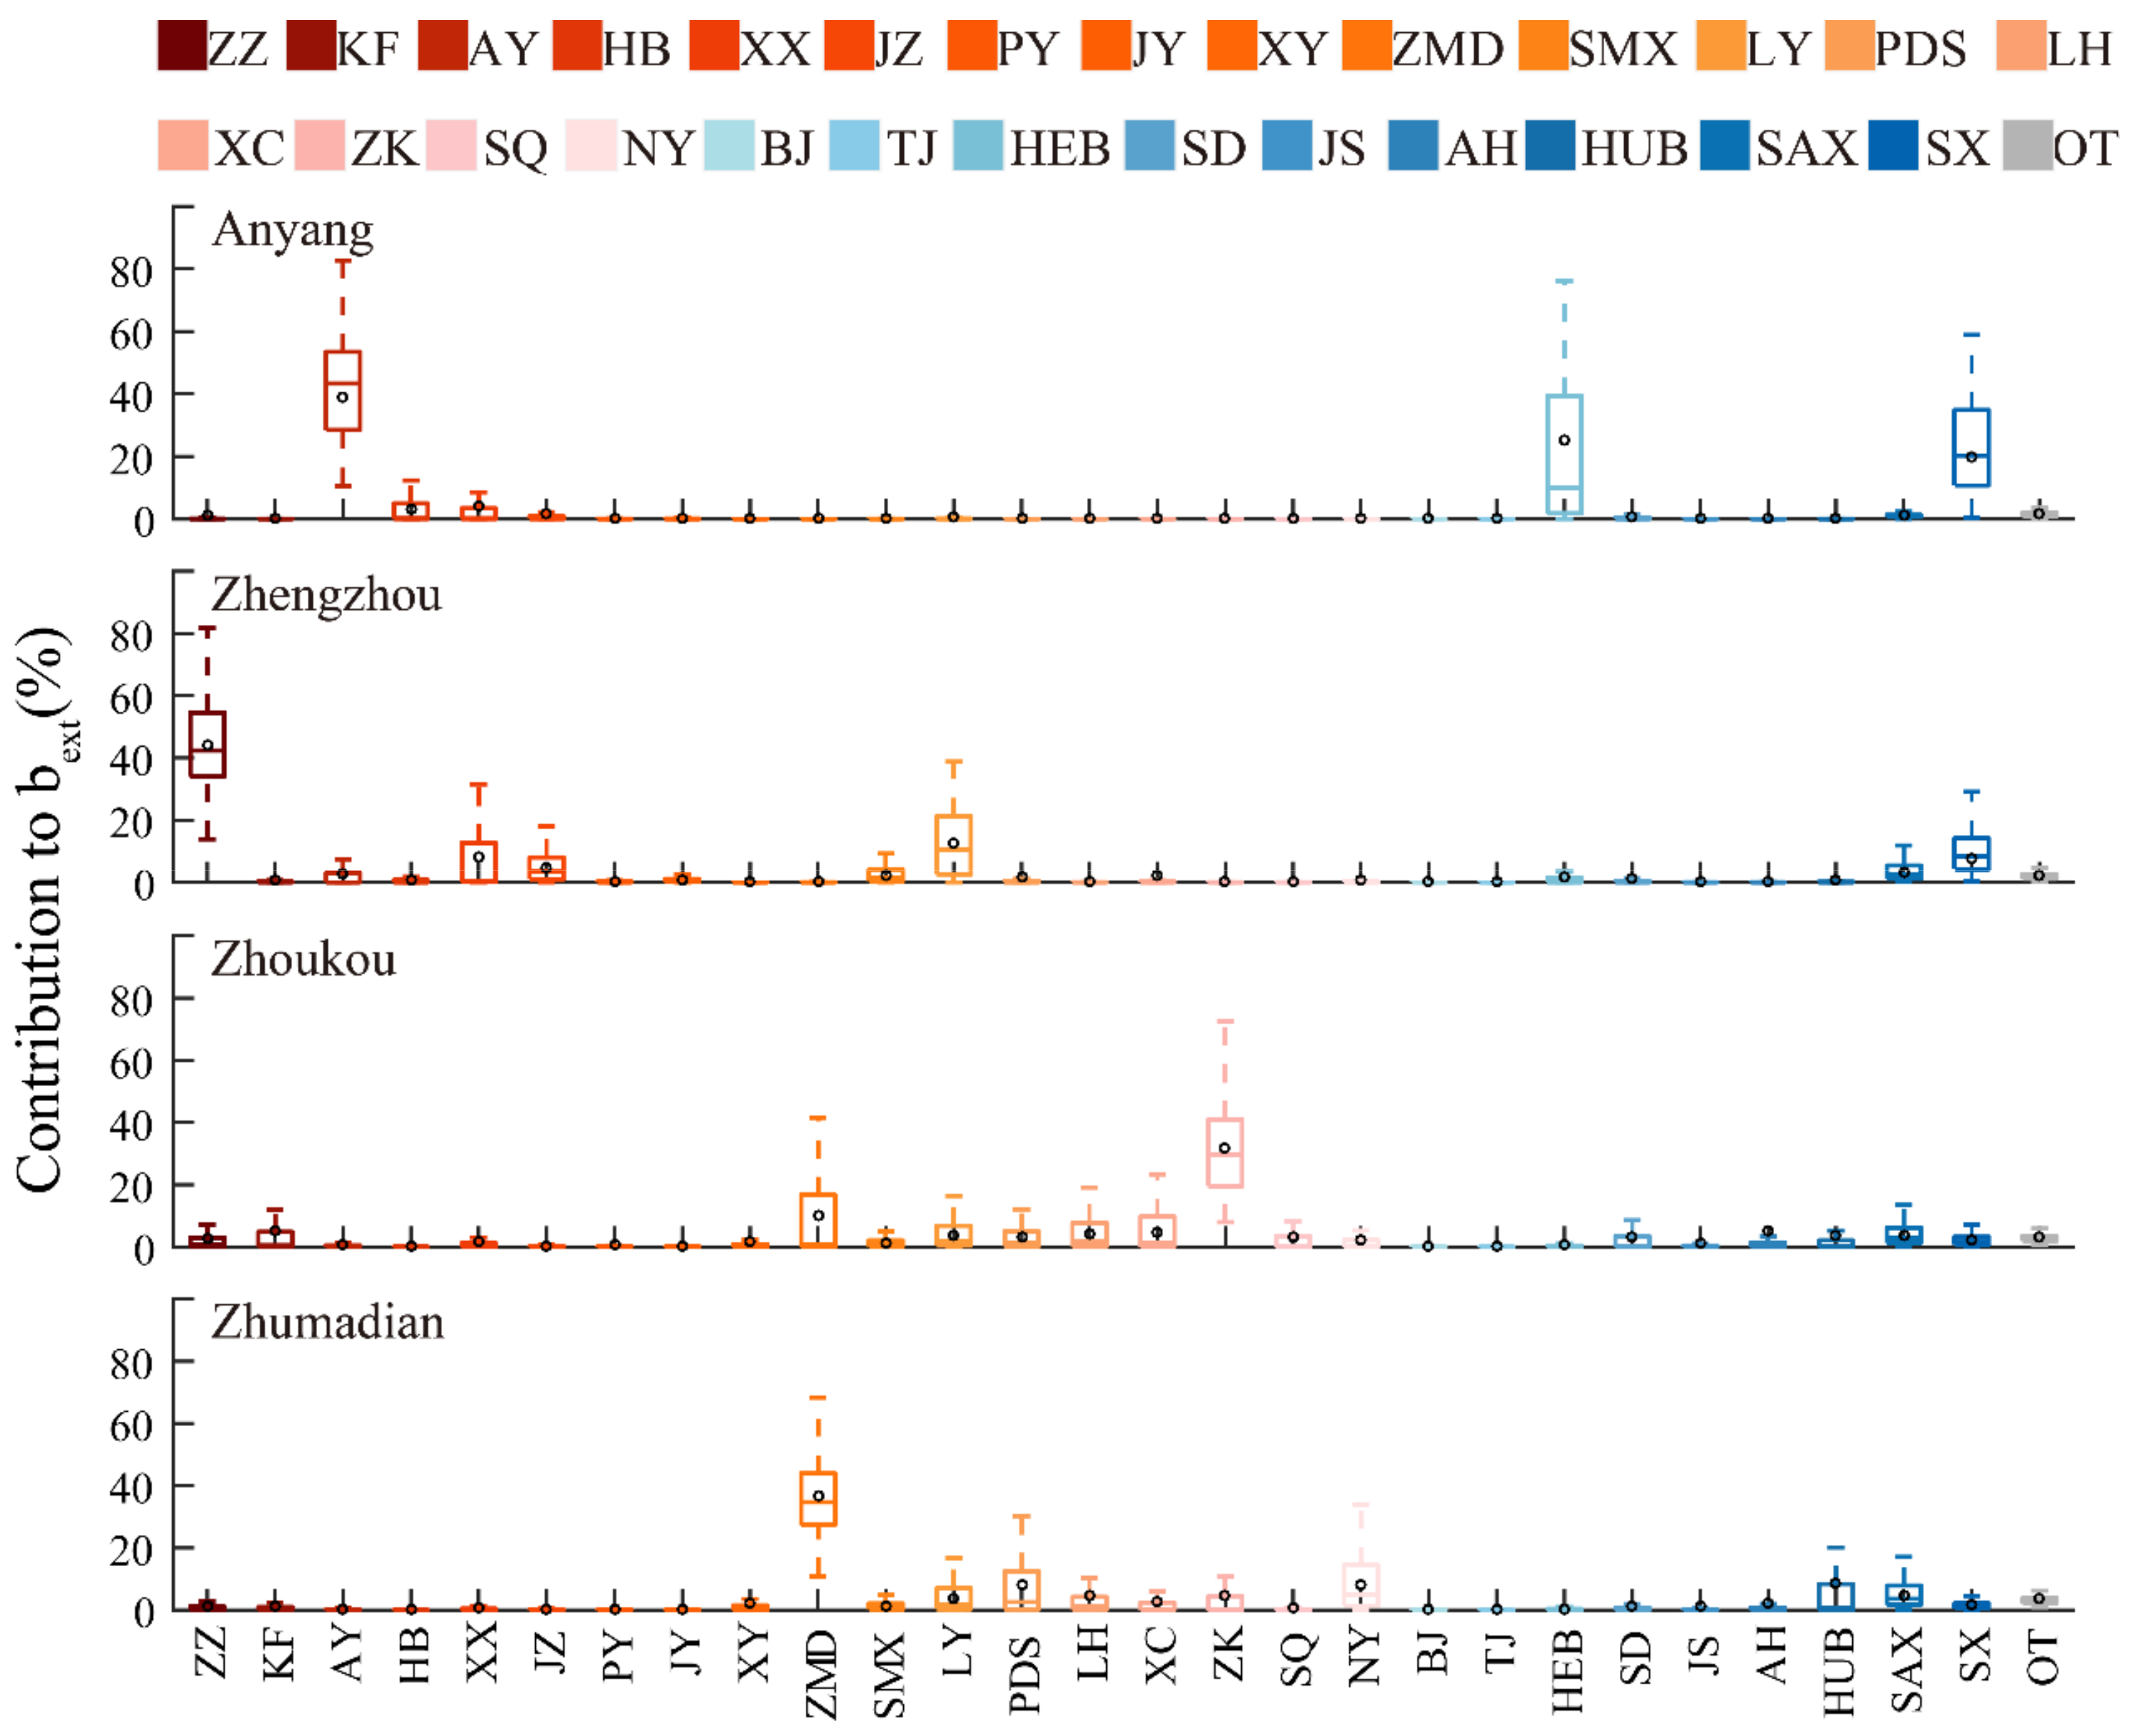
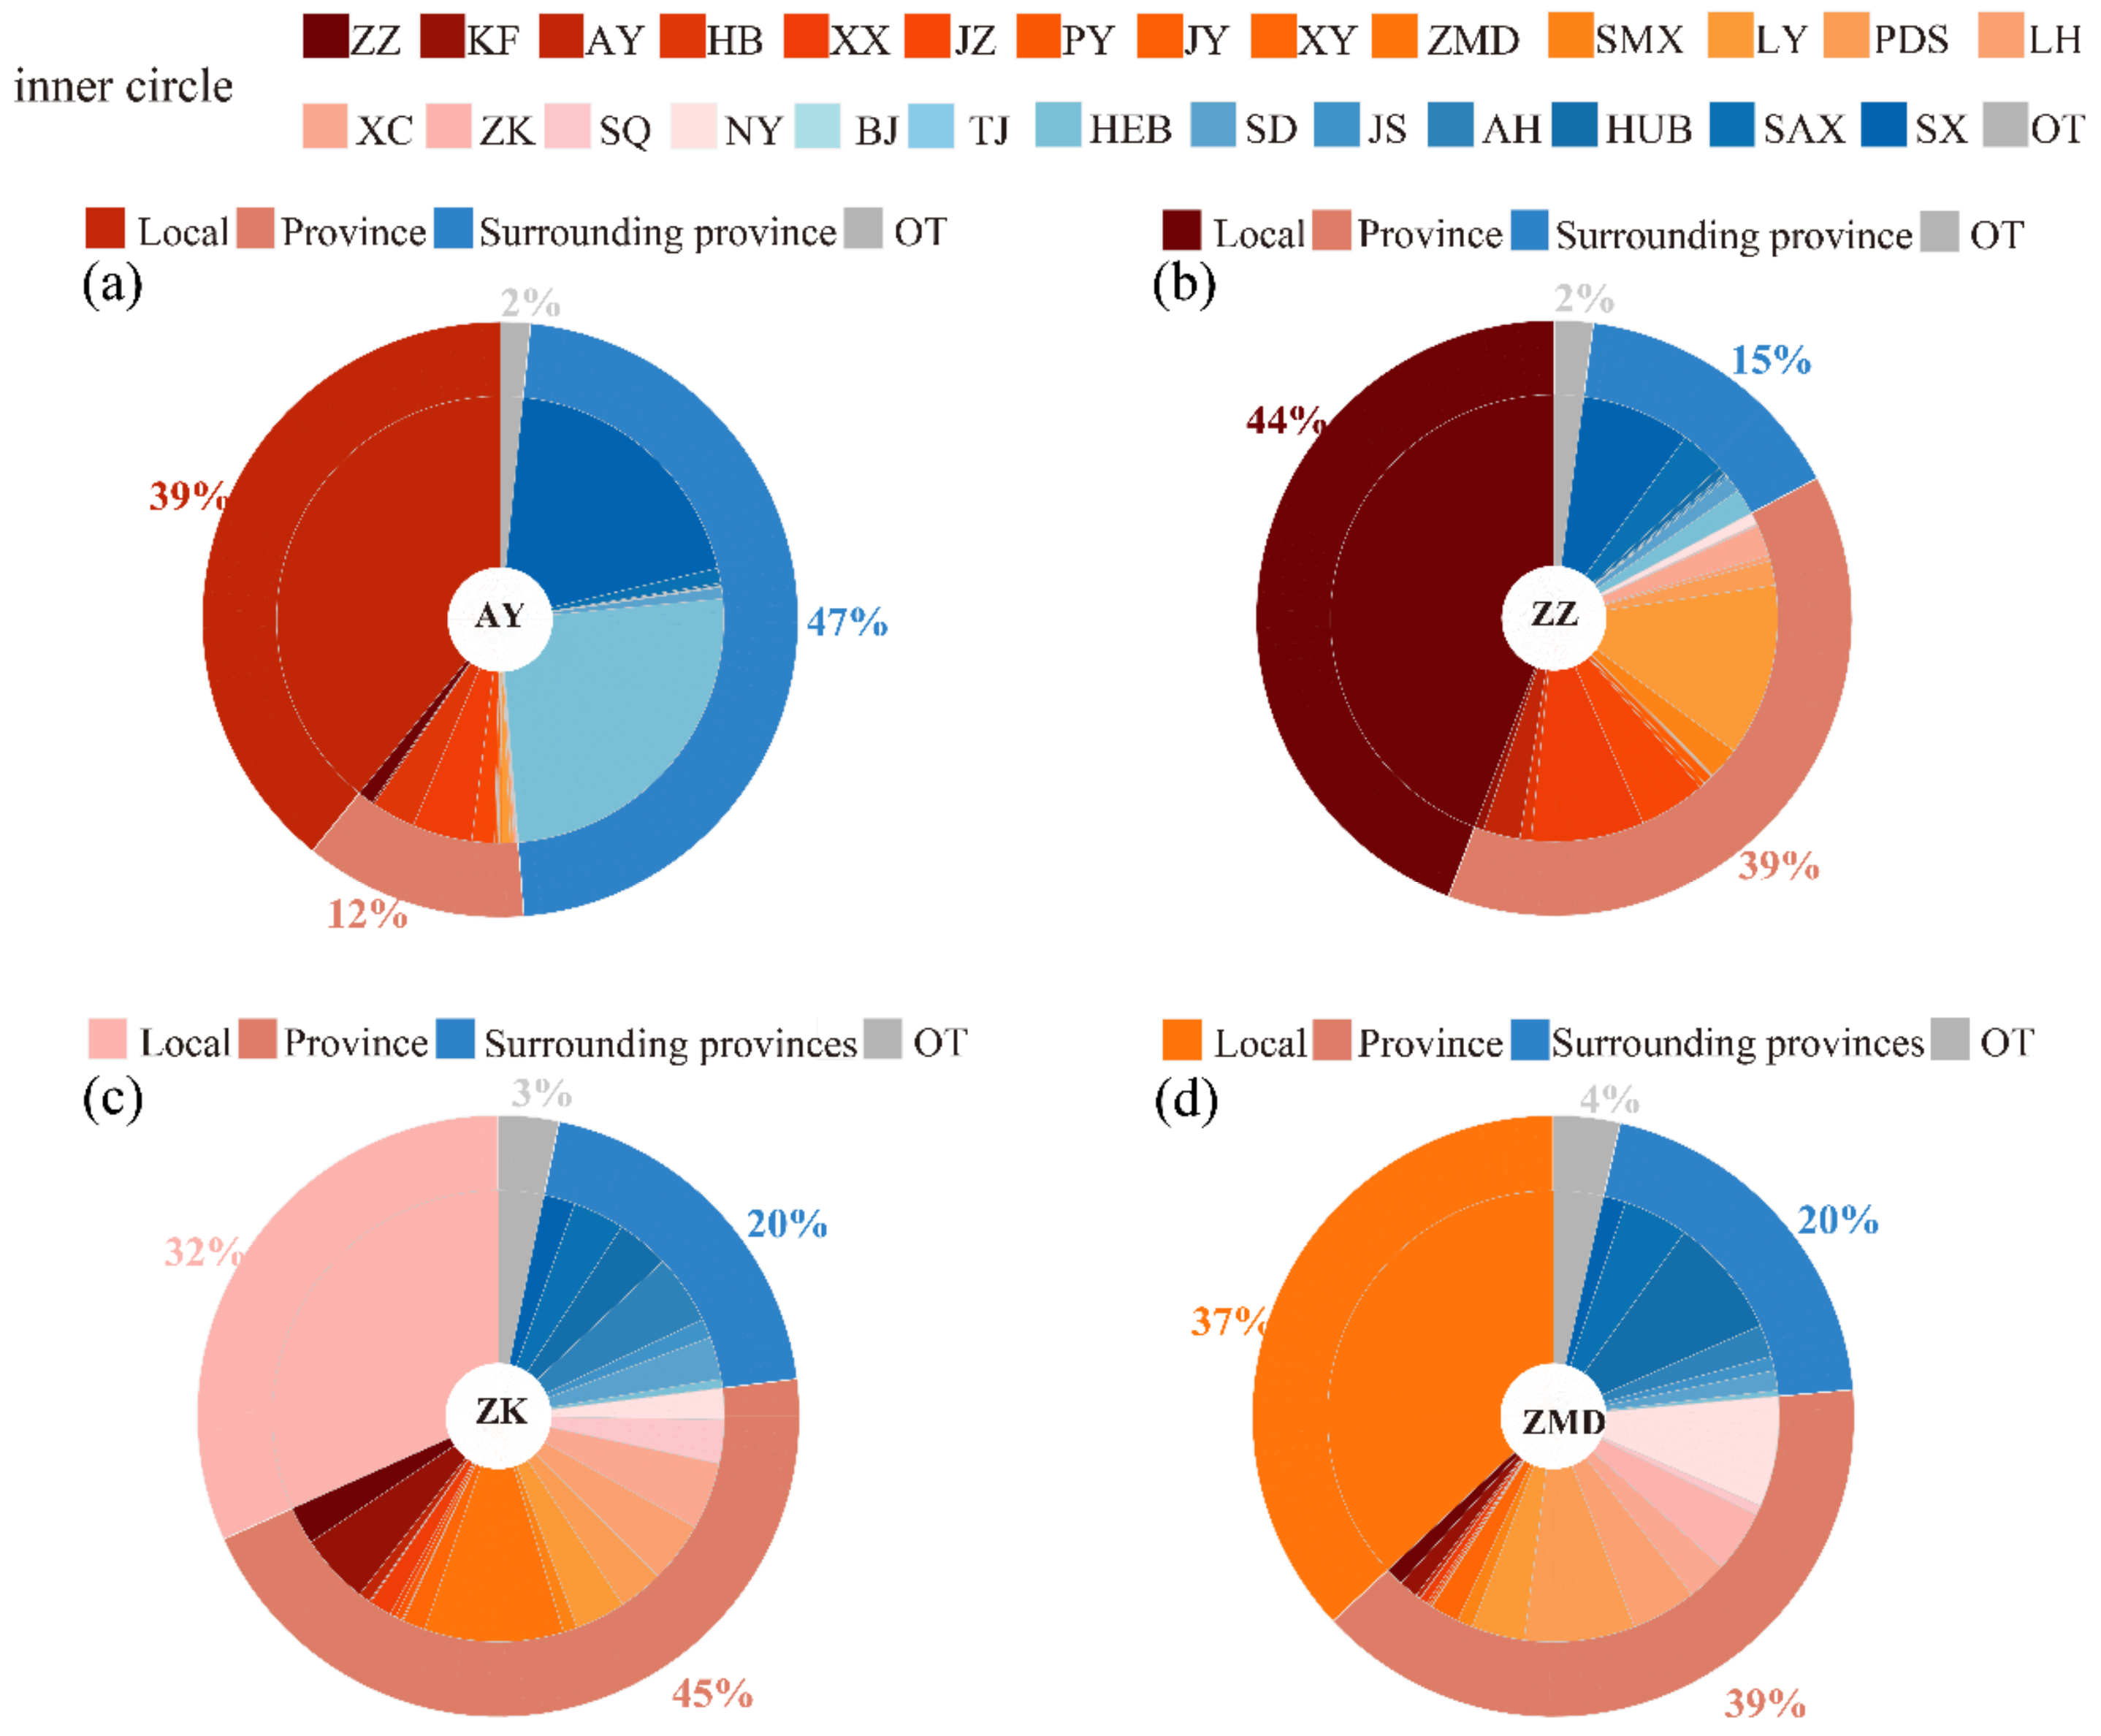
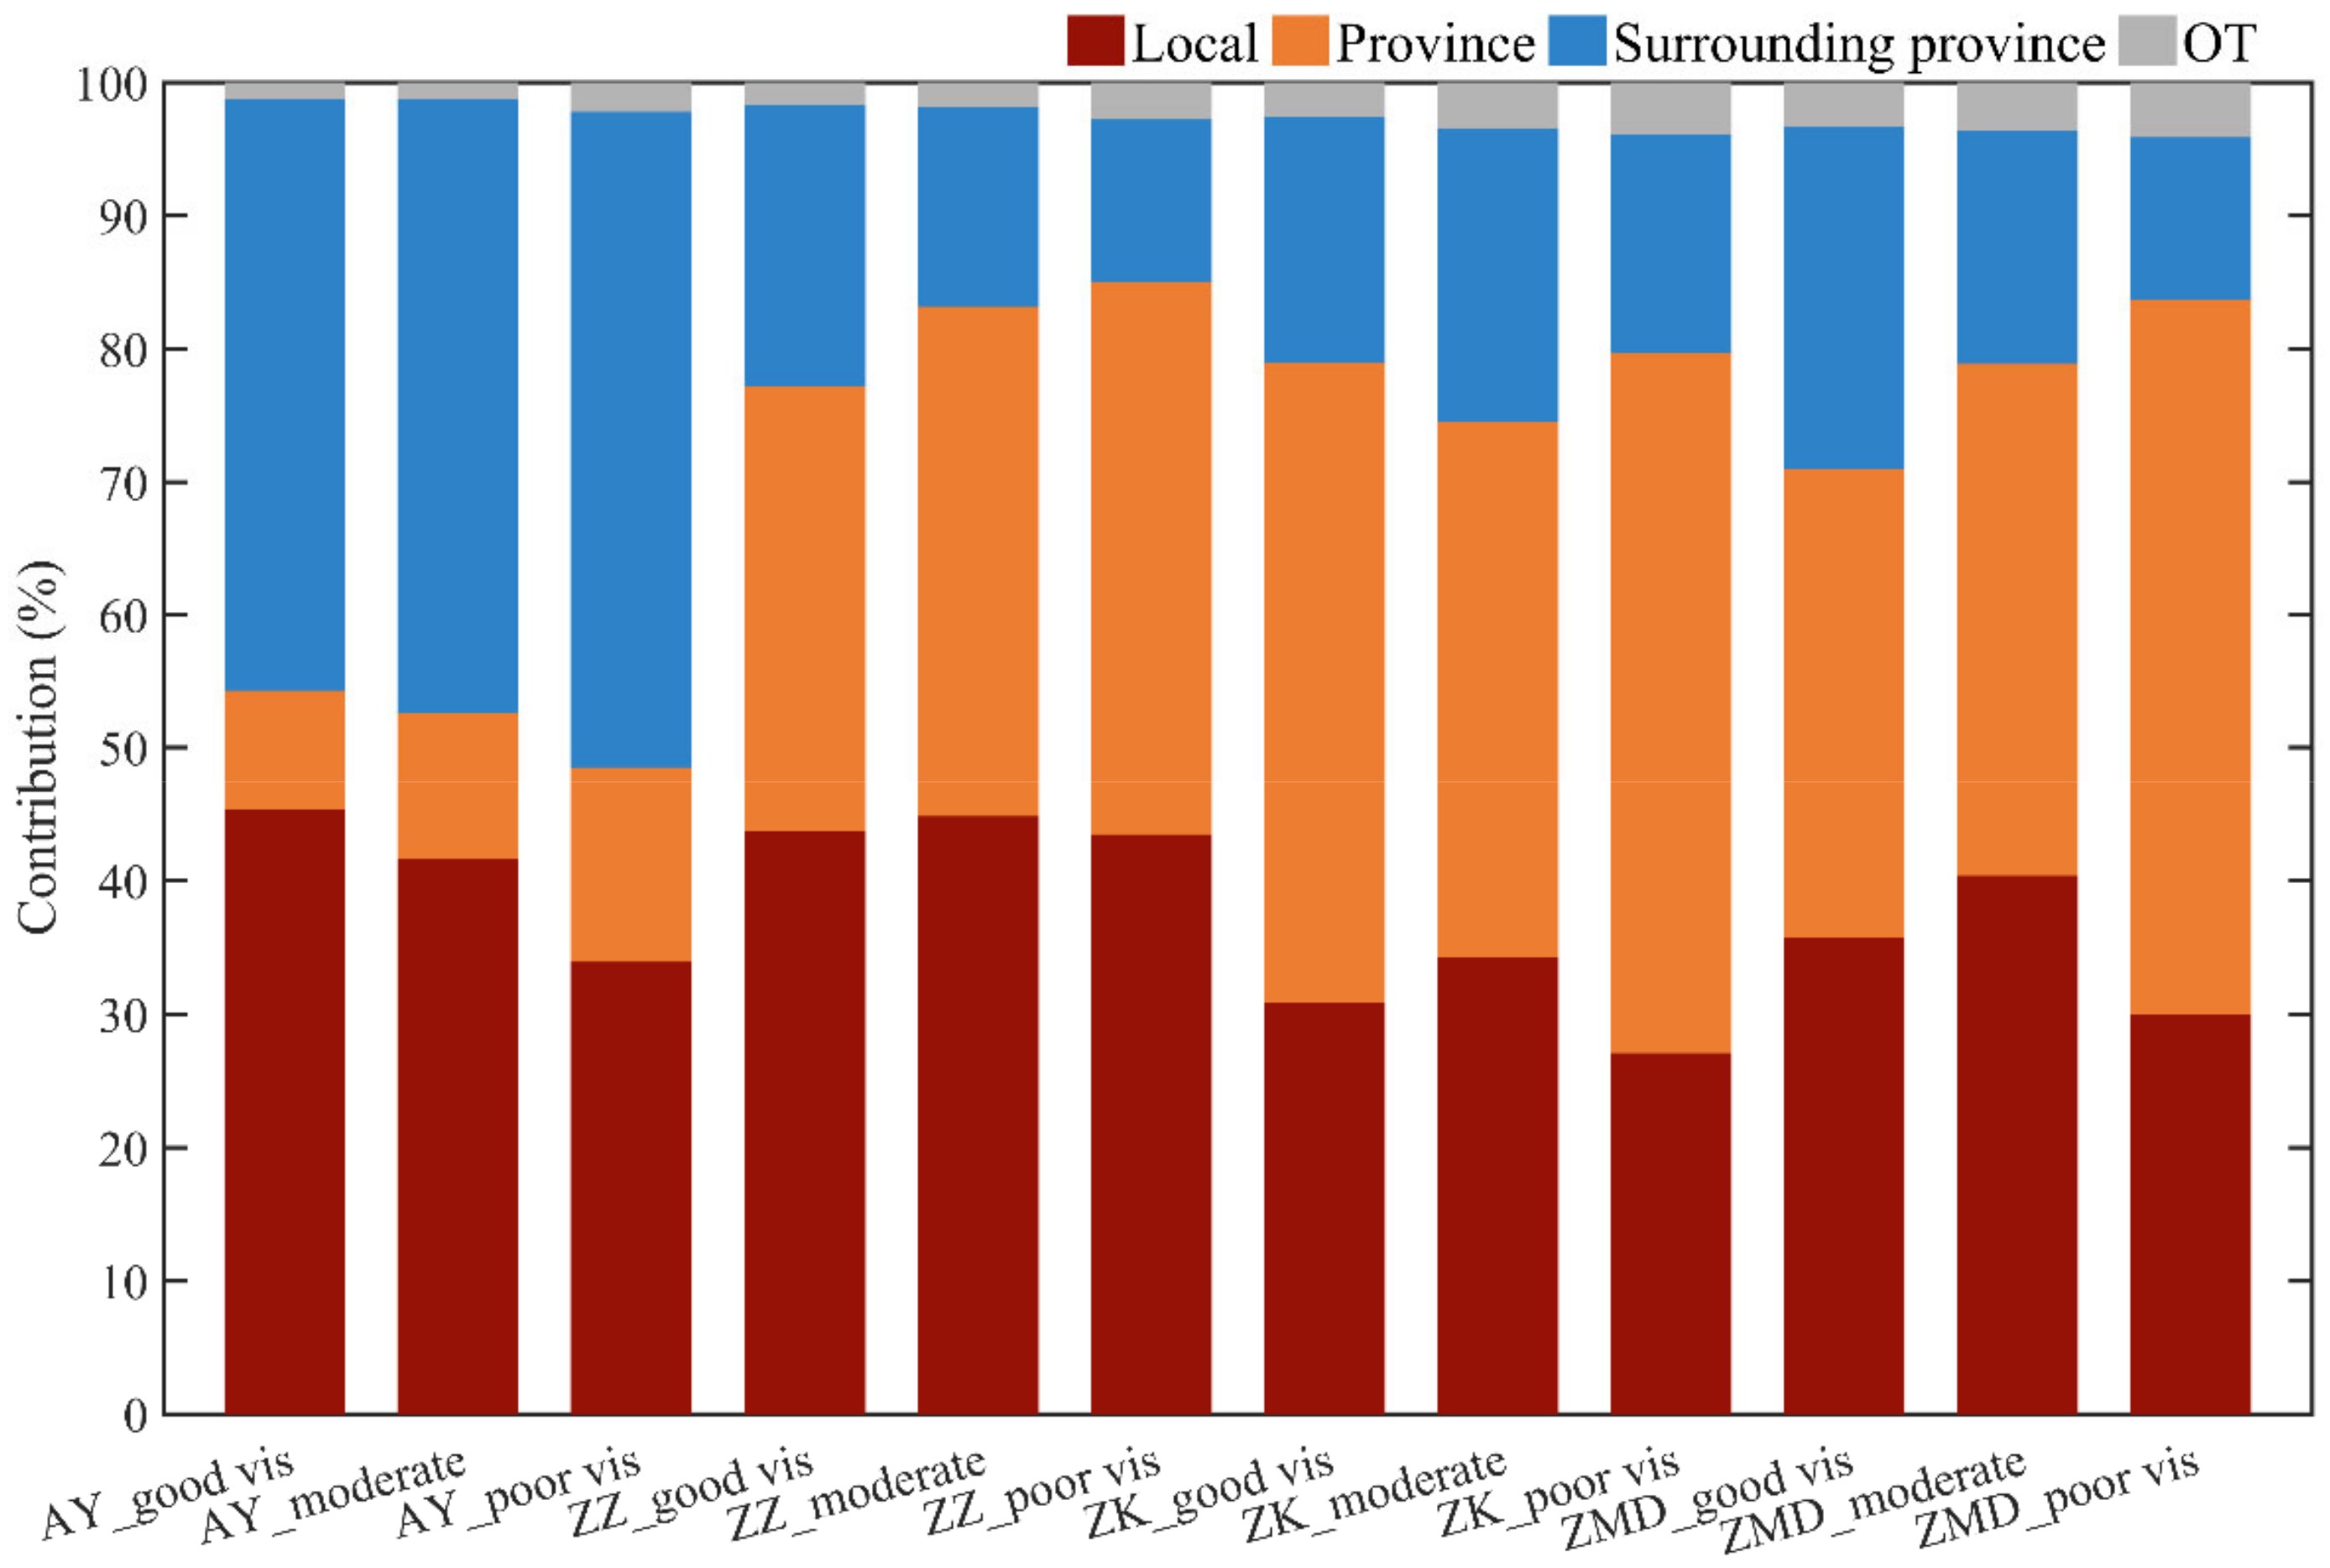
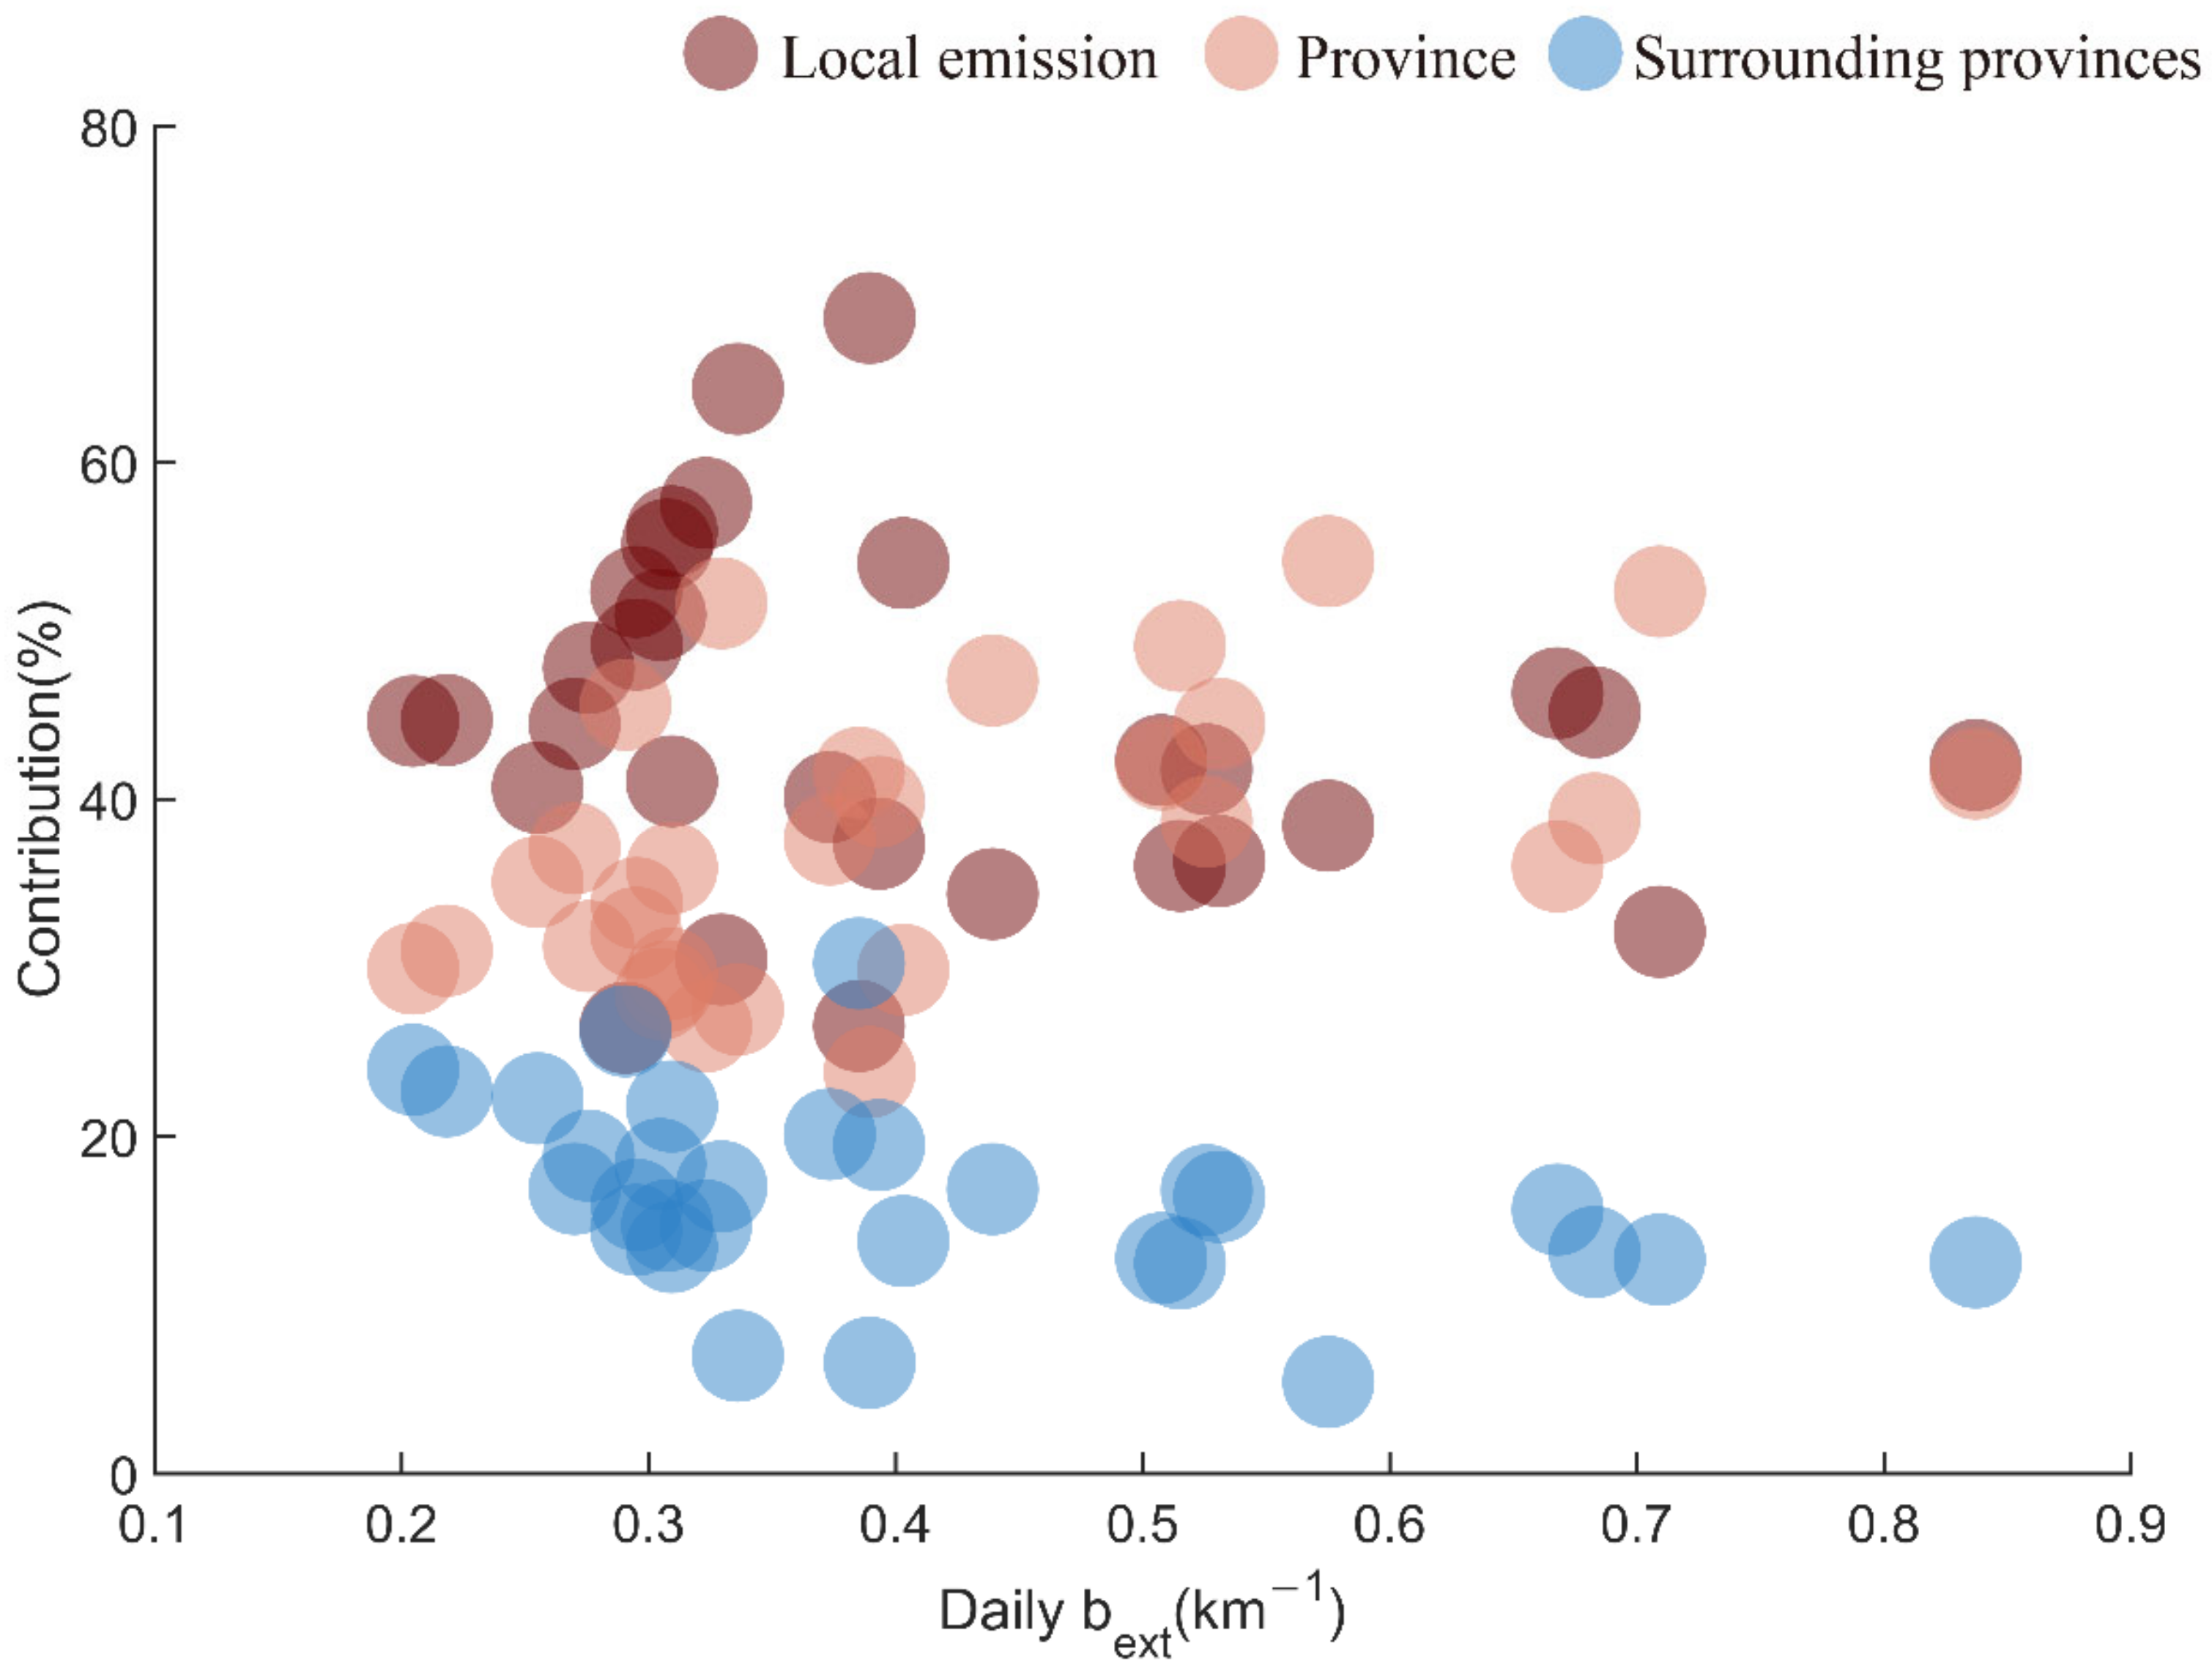
3.3. Regional Source Contribution to bext

As shown in Figure 1b, the modeling domain was divided into twenty-eight source regions to investigate the contribution of local emissions and regional transport. The contribution from different source regions to bext in four selected cities during November 2017 is shown in Figure 4. Local emission (contribution of emissions from the receptor city to receptor city) was the main source of bext. For Anyang, local emissions contributed a large part (28~53%) to bext, and the transport from Hebei (2~39%) and Shanxi province (11~35%) was also important. For Zhengzhou, the contribution of local emissions was mainly in the range of 34%~55%, and transport from the surrounding cities in Henan, like Xinxiang (1~13%), Jiaozuo (1~8%), and Luoyang (3~21%), was also important, and contribution from Shanxi province (4~14%) was non-negligible. For Zhoukou, the contribution of local emissions was mainly within the range of 20~41%, and transport from surrounding cities in Henan, like Zhumadian (0~17%), Luoyang (1~7%), and Xuchang (0~10%), was important. For Zhumadian, the contribution of local emissions was mainly within the range of 27~44%, and transport from surrounding cities in Henan, like Luoyang (0~7%), Pingdingshan (0~12%) and Nanyang (1~15%), cannot be ignored. Additionally, regional transport from Hubei and Shaanxi provinces accounted for 1~8%.
The average contribution of different source regions to light extinction in four cities was shown in Figure 5. The twenty-eight tagged regions were further divided into four categories: local emission, province (cities of Henan province, except receptor city), surrounding provinces (including Beijing, Tianjin, Hebei, Shandong, Jiangsu, Anhui, Hubei, Shanxi, and Shaanxi province), and other regions. Regional source analysis demonstrated that regional transport dominated the light extinction over CPER during the study period, contributing 56~68%. Transport within Henan province was an important source of bext (12~45%), except local emissions (32~44%). For Anyang, the northernmost city in Henan, regional transport from emissions outside Henan, especially Hebei (20%) and Shanxi (25%), was crucial, and it was more important than the transport within Henan province from other cities outside Anyang. For Zhengzhou, the contribution of local emissions, emissions from cities in Henan, except Zhengzhou, and emissions outside the Henan province contributed 44%, 39%, and 17% to the bext, respectively. Contribution from the cities in Henan province including Luoyang (13%), Xinxiang (8%), and Jiaozuo (5%) cannot be ignored. There is little difference between the region sources of bext and PM2.5. Regional transport dominated both bext and PM2.5. Local emissions and transport from surrounding cities and provinces were important sources of bext and PM2.5 (Figure A2b). Liu et al. [17] found that close-range transport was one of the dominant factors on polluted days in Zhengzhou using trajectory clustering analysis. Yang et al. [20] also found that the contribution of local emissions and transport from nearby regions (<200 km) dominated the PM2.5 in CPER.
The contribution of different source regions to daily light extinction in Zhengzhou is shown in Figure A3 in Appendix A. The contribution of surrounding provinces decreased while the contribution of emissions within Henan province increased with the increase of light extinction. Hourly data was classified into three categories according to the data of visibility: “good visibility” (visibility greater than 10 km, namely bext less than 0.3), “moderate condition” (5 km ≤ visibility ≤ 10 km), and “poor visibility” (visibility less than 5 km). For four cities, the contribution of regional transport was more than 50% under different levels, and the contribution of regional transport was the largest under poor visibility (Figure 6). For Zhengzhou, Zhoukou, and Zhumadian, the contribution of transport within Henan province was significant, and the contribution was largest under poor visibility. From good visibility to poor visibility, the contribution of transport within Henan province to bext in Zhengzhou increased from 33% to 41%, while the contribution of surrounding provinces decreased from 21% to 12%. However, for Anyang, the contribution of surrounding provinces was always larger than transport within Henan province under different visibility conditions. In summary, transport from surrounding regions is an important source of light extinction over CPER regardless of the city and visibility conditions.

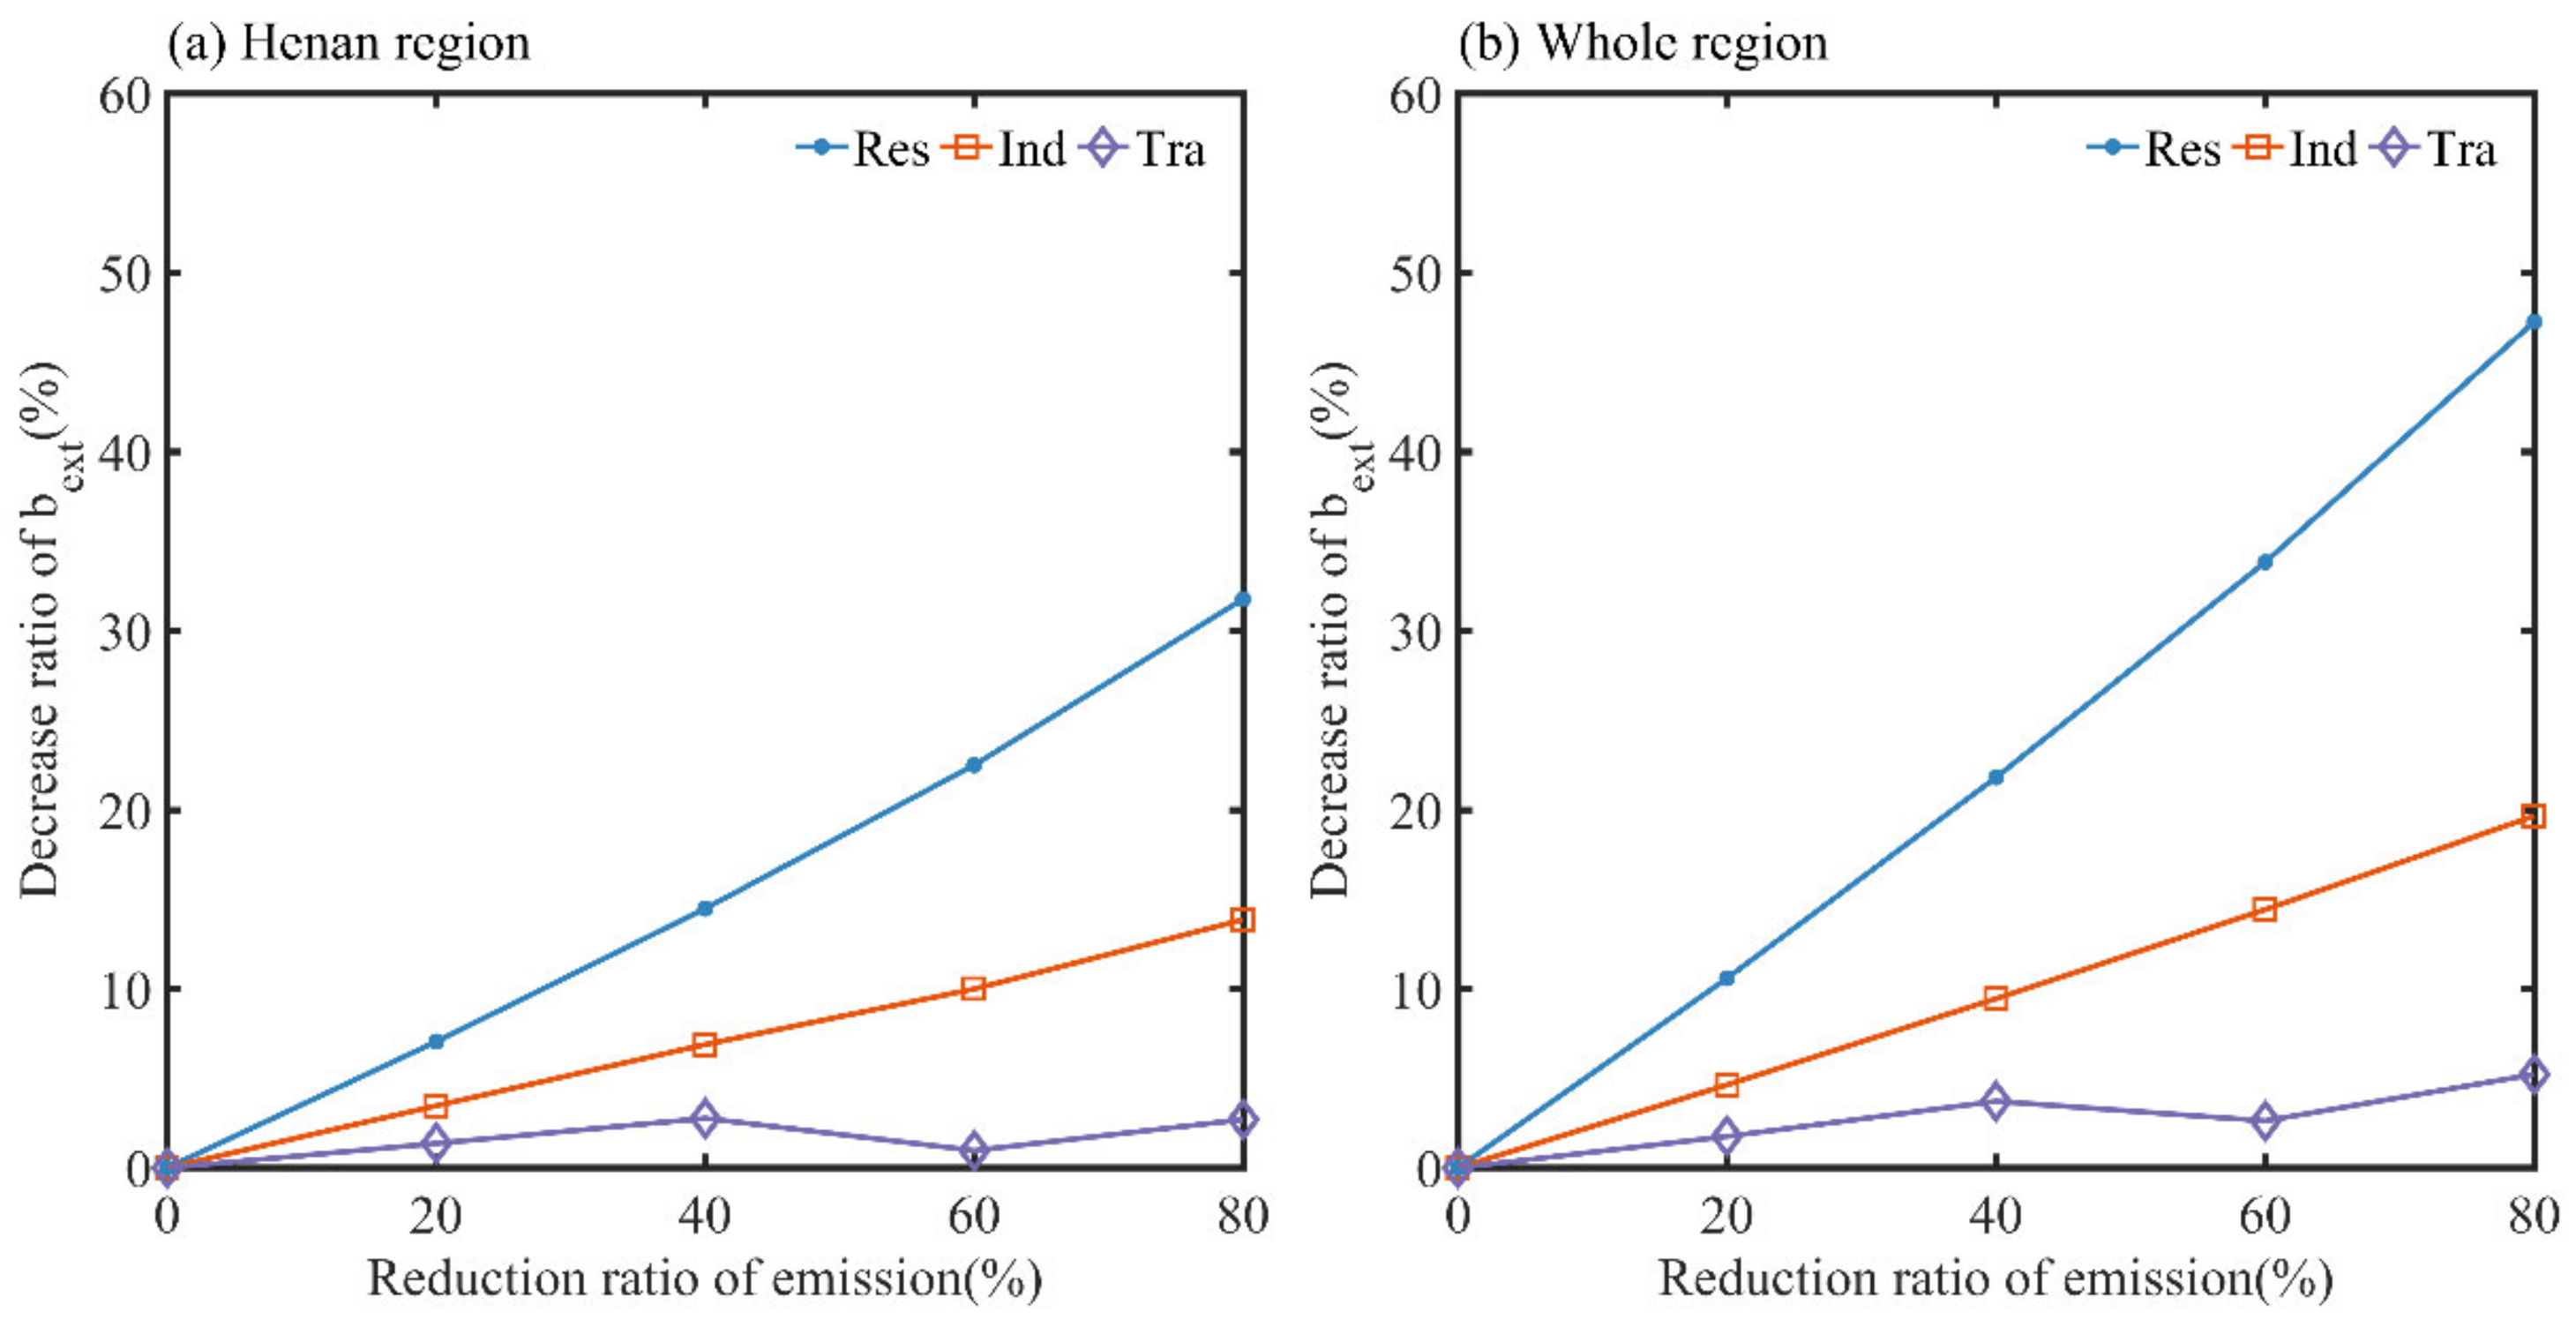
3.4. Impact of Emission Reduction on bext

The analysis above showed that resident-related emission, traffic, and industry sector are the three main sectors of bext over CPER. Local emissions and transport from surrounding regions dominated bext over CPER. To reach the goal of good visibility (bext lower than 0.3), feasible emission reduction strategies were investigated. Sensitivity tests were designed by emissions reduction of each sector between 20% and 100% at 20% intervals. Emission-based tests which examined one sector at a time were conducted. This method has been widely used [19,46].
The change of light extinction in Zhengzhou under different sector emission reductions over Henan and the whole region was shown in Figure 7. Emission reduction of resident-related sector and industry led to extinction reduction. Additionally, the reduction in emissions of the resident-related sector was more effective than a reduction in the emissions of the industry sector (Figure 7a), as a 40% reduction in resident-related sector emissions over Henan resulted in a bext decrease of 15% (0.065 km−1, from 0.45 to 0.385 km−1), while the same reduction in the industry sector over Henan led to a decrease of bext by only 7%. The visibility improvement effect caused by traffic source emission reduction over Henan was very small, which was less than 3%, although traffic contributed 18% to the light extinction. Compared to PM2.5, the decreased rate of extinction (15%) was higher than that of PM2.5 (13%)[19] at a reduction of 40% in the resident-related sector, indicating the improvement effect of reduction in the resident-related sector on bext. A reduction of 60% in resident-related, industry, and traffic emissions over Henan region, resulting in a 33% reduction of bext, approximately 0.3 km−1, the goal of good visibility can be satisfied. When enlarging the reduction region to the whole simulation region, the reduction of 40% in resident-related, industry, and traffic emissions, resulting in a 35% reduction of bext, approximately 0.293 km−1, the goal of good visibility can be achieved, indicating the importance of regional joint control strategy.

4. Conclusions

The source of light extinction and visibility degradation in the CPER is still unclear. In this study, the NAQPMS coupled with an online tracer-tagging module was used to quantify the contribution of sector and region sources to visibility degradation during December 2017. The light extinction coefficient was calculated by IMPROVE method using predicted pollutant concentration. Additionally, the light extinction coefficients over CPER were well reproduced by NAQPMS. Anyang, Zhengzhou, Zhoukou, and Zhumadian were selected as four representatives to investigate the major source of bext in the CPER.
The results showed resident-related emissions, traffic, and industry sectors were the main sources of visibility degradation over CPER, contributing 55~62%, 10~28% and 9~19%, respectively. The sector sources of bext and PM2.5 were quite different: the contribution of resident-related emissions and traffic to light extinction was larger than their contribution to PM2.5, while the contribution of fugitive dust to bext was much smaller than its contribution to PM2.5. During poor visibility conditions (visibility less than 5 km), the contribution of resident-related sources to bext in Zhengzhou decreased while the contribution of traffic and industry sector increased compared to the average conditions.
Local emissions played an important role in bext, contributing 32~44%. Regional transport dominated the light extinction (56~68%), of which transport within Henan province contributes significantly (12~45%). For Anyang, the northernmost city in Henan, regional transport from surrounding provinces especially Hebei (20%) and Shanxi (25%) was crucial. Additionally, for other cities, the contribution from other cities in Henan province was important. Therefore, bext over CPER was mainly from local emissions and transport from surrounding cities and provinces. There is little difference between the region sources of bext and PM2.5. The contribution of regional transport was more than 50% under different visibility levels, and the contribution of regional transport was the largest under poor visibility conditions. For Zhengzhou, Zhoukou, and Zhumadian (Anyang), the contribution of transport within Henan province (from surrounding provinces) was significant and the contribution was largest under poor visibility conditions. In sum, transport from surrounding regions was an important source of visibility degradation over CPER regardless of the city and visibility level.
Sensitivity tests were designed to investigate the feasible emission reduction strategies to mitigate visibility degradation. Sensitivity tests showed that the reduction in the resident-related sector was more effective than a reduction in the industry or traffic sector. With the reduction of 60% in the resident-related sector, industry, and traffic emissions over the Henan region, the goal of good visibility can be achieved. However, emission control of 40% in resident-related, industry, and traffic sectors over the whole region can reach the goal in Zhengzhou. The result indicates the necessity of multi-sector and regional joint reduction. This study will provide a useful reference for the strategies development of visibility degradation mitigation over CPER.

Author Contributions

Conceptualization, H.D. and X.C.; methodology, H.D. and J.L.; software, Z.W. (Zifa Wang), J.L. and X.C.; validation, H.D.; formal analysis, H.D. and W.Y.; investigation, H.D.; resources, J.L.; data curation, H.D.; writing—original draft preparation, H.D.; writing—review and editing, W.Y., X.C. and Z.W. (Zhe Wang); visualization, H.D.; supervision, J.L.; project administration, H.D.; funding acquisition, H.D. All authors have read and agreed to the published version of the manuscript.

Funding

This work was supported by National Research Program for Key Issues in Air Pollution Control (Grant DQGG2021301), and the National Key Research and Development Program of China (Grants 2019YFC0214204).

Institutional Review Board Statement

Not applicable.

Informed Consent Statement

Not applicable.

Acknowledgments

Thanks to the editors and anonymous reviewers for their positive comments and helpful advice on this manuscript.

Conflicts of Interest

The authors declare no conflict of interest.

Appendix A

Table A1. Statistical parameters used in this study.
Statistical ParameterCalculation Formula
R (correlation coefficient) R = i = 1 N M i M P O i M O i = 1 N M i M P 2 O i M O 2 1 2
NMB (normalized mean bias) N M B = i = 1 N M i O i / i = 1 N O i
MFB (mean fractional bias) M F B = 1 N   i = 1 N M i O i M i + O i / 2
MFE (mean fractional error) M F E = 1 N   i = 1 N M i O i M i + O i / 2
FAC2
(fraction of data that satisfy 0.5 C p C O 2 )
FAC2 = NV/N
Figure A1. Simulated (red) and observed (black) PM2.5 concentration in the CPER and surrounding areas from 1 December to 31 December 2017.
Atmosphere 13 02075 g0a1
Figure A2. (a) Contribution of different sectors to light extinction coefficient and PM2.5; (b) Contribution of different source regions to light extinction coefficient and PM2.5.
Atmosphere 13 02075 g0a2
Figure A3. Contribution of different source regions to daily light extinction coefficient in Zhengzhou under different pollution levels.
Atmosphere 13 02075 g0a3

References

  1. Wang, X.Y.; Zhang, R.H.; Yu, W. The Effects of PM2.5 Concentrations and Relative Humidity on Atmospheric Visibility in Beijing. J. Geophys. Res. Atmos. 2019, 124, 2235–2259. [Google Scholar] [CrossRef]
  2. Chen, X.; Li, X.; Yuan, X.; Zeng, G.; Liang, J.; Li, X.; Xu, W.; Luo, Y.; Chen, G. Effects of human activities and climate change on the reduction of visibility in Beijing over the past 36 years. Environ. Int. 2018, 116, 92–100. [Google Scholar] [CrossRef] [PubMed]
  3. Hyslop, N.P. Impaired visibility: The air pollution people see. Atmos. Environ. 2009, 43, 182–195. [Google Scholar] [CrossRef]
  4. Lin, Z.; Wang, Y.; Zheng, F.; Zhou, Y.; Guo, Y.; Feng, Z.; Li, C.; Zhang, Y.; Hakala, S.; Chan, T.; et al. Rapid mass growth and enhanced light extinction of atmospheric aerosols during the heating season haze episodes in Beijing revealed by aerosol–chemistry–radiation–boundary layer interaction. Atmos. Chem. Phys. 2021, 21, 12173–12187. [Google Scholar] [CrossRef]
  5. Hu, S.; Zhao, G.; Tan, T.; Li, C.; Zong, T.; Xu, N.; Zhu, W.; Hu, M. Current challenges of improving visibility due to increasing nitrate fraction in PM2.5 during the haze days in Beijing, China. Environ. Pollut. 2021, 290, 118032. [Google Scholar] [CrossRef] [PubMed]
  6. Zhang, X.; Zhang, Z.; Xiao, Z.; Tang, G.; Li, H.; Gao, R.; Dao, X.; Wang, Y.; Wang, W. Heavy haze pollution during the COVID-19 lockdown in the Beijing-Tianjin-Hebei region, China. J. Environ. Sci. 2021, 114, 170–178. [Google Scholar] [CrossRef] [PubMed]
  7. Fu, H.; Chen, J. Formation, features and controlling strategies of severe haze-fog pollutions in China. Sci. Total Environ. 2017, 578, 121–138. [Google Scholar] [CrossRef] [PubMed]
  8. Zhou, W.; Lei, L.; Du, A.; Zhang, Z.; Li, Y.; Yang, Y.; Chen, C.; Xu, W.; Sun, J.; Li, Z.; et al. Unexpected Increases of Severe Haze Pollution During the Post COVID-19 Period: Effects of Emissions, Meteorology, and Secondary Production. J. Geophys. Res. Atmos. 2022, 127, e2021JD035710. [Google Scholar] [CrossRef]
  9. Li, J.; Du, H.; Wang, Z.; Sun, Y.; Yang, W.; Li, J.; Tang, X.; Fu, P. Rapid formation of a severe regional winter haze episode over a megacity cluster on the North China Plain. Environ. Pollut. 2017, 223, 605–615. [Google Scholar] [CrossRef]
  10. Zou, J.; Liu, Z.; Hu, B.; Huang, X.; Wen, T.; Ji, D.; Liu, J.; Yang, Y.; Yao, Q.; Wang, Y. Characteristics of the chemical compositions of aerosols in the North China Plain and their impact on the visibility in Beijing and Tianjin. Atmos. Res. 2017, 201, 235–246. [Google Scholar] [CrossRef]
  11. Wang, Q.Q.; Sun, Y.L.; Jiang, Q.; Du, W.; Sun, C.Z.; Fu, P.Q.; Wang, Z.F. Chemical composition of aerosol particles and light extinction apportionment before and during the heating season in Beijing, China. J. Geophys. Res. Atmos. 2015, 120, 12708–12722. [Google Scholar] [CrossRef]
  12. Tao, J.; Zhang, L.; Gao, J.; Wang, H.; Chai, F.; Wang, S. Aerosol chemical composition and light scattering during a winter season in Beijing. Atmos. Environ. 2015, 110, 36–44. [Google Scholar] [CrossRef]
  13. Yao, L.; Kong, S.; Zheng, H.; Chen, N.; Zhu, B.; Xu, K.; Cao, W.; Zhang, Y.; Zheng, M.; Cheng, Y.; et al. Co-benefits of reducing PM2.5 and improving visibility by COVID-19 lockdown in Wuhan. npj Clim. Atmos. Sci. 2021, 4, 40. [Google Scholar] [CrossRef]
  14. Li, X.; Huang, L.; Li, J.; Shi, Z.; Wang, Y.; Zhang, H.; Ying, Q.; Yu, X.; Liao, H.; Hu, J. Source contributions to poor atmospheric visibility in China. Resour. Conserv. Recycl. 2019, 143, 167–177. [Google Scholar] [CrossRef]
  15. Brewer, P.; Moore, T. Source Contributions to Visibility Impairment in the Southeastern and Western United States. J. Air Waste Manag. Assoc. 2009, 59, 1070–1081. [Google Scholar] [CrossRef]
  16. Wang, S.B.; He, B.; Yuan, M.H.; Su, F.C.; Yin, S.S.; Yan, Q.S.; Jiang, N.; Zhang, R.Q.; Tang, X.Y. Characterization of individual particles and meteorological conditions during the cold season in Zhengzhou using a single particle aerosol mass spectrometer. Atmos. Res. 2019, 219, 13–23. [Google Scholar] [CrossRef]
  17. Liu, X.; Jiang, N.; Zhang, R.; Yu, X.; Li, S.; Miao, Q. Composition analysis of PM2.5 at multiple sites in Zhengzhou, China: Implications for characterization and source apportionment at different pollution levels. Environ. Sci. Pollut. Res. 2021, 28, 59329–59344. [Google Scholar] [CrossRef]
  18. Shenbo, W.; Wang, L.; Fan, X.; Wang, N.; Ma, S.; Zhang, R. Formation pathway of secondary inorganic aerosol and its influencing factors in Northern China: Comparison between urban and rural sites. Sci. Total Environ. 2022, 840, 156404. [Google Scholar] [CrossRef]
  19. Du, H.; Li, J.; Wang, Z.; Yang, W.; Chen, X.; Wei, Y. Sources of PM2.5 and its responses to emission reduction strategies in the Central Plains Economic Region in China: Implications for the impacts of COVID-19. Environ. Pollut. 2021, 288, 117783. [Google Scholar] [CrossRef]
  20. Yang, W.; Li, J.; Wang, Z.; Wang, L.; Dao, X.; Zhu, L.; Pan, X.; Li, Y.; Sun, Y.; Ma, S.; et al. Source apportionment of PM2.5 in the most polluted Central Plains Economic Region in China: Implications for joint prevention and control of atmospheric pollution. J. Clean. Prod. 2020, 283, 124557. [Google Scholar] [CrossRef]
  21. Shi, H.; Zhang, J.; Zhao, B.; Xia, X.; Hu, B.; Chen, H.; Wei, J.; Liu, M.; Bian, Y.; Fu, D.; et al. Surface brightening in eastern and central China since the implementation of the Clean Air Action in 2013: Causes and implications. Geophys. Res. Lett. 2020, 48, e2020GL09110. [Google Scholar] [CrossRef]
  22. Zhang, Q.; Zheng, Y.; Tong, D.; Shao, M.; Wang, S.; Zhang, Y.; Xu, X.; Wang, J.; He, H.; Liu, W.; et al. Drivers of improved PM 2.5 air quality in China from 2013 to 2017. Proc. Natl. Acad. Sci. USA 2019, 116, 24463–24469. [Google Scholar] [CrossRef] [Green Version]
  23. Li, Z.; Sun, Y.; Wang, Q.; Xin, J.; Sun, J.; Lei, L.; Li, J.; Fu, P.; Wang, Z. Nitrate and secondary organic aerosol dominated particle light extinction in Beijing due to clean air action. Atmos. Environ. 2021, 269, 118833. [Google Scholar] [CrossRef]
  24. Li, J.; Li, C.; Zhao, C.; Su, T. Changes in surface aerosol extinction trends over China during 1980–2013 inferred from quality-controlled visibility data: Change of Aerosol Trends in China. Geophys. Res. Lett. 2016, 43, 8713–8719. [Google Scholar] [CrossRef] [Green Version]
  25. Griffing, G.W. Relations between the prevailing visibility, nephelometer scattering coefficient and sunphotometer turbidity coefficient. Atmos. Environ. 1980, 14, 577–584. [Google Scholar] [CrossRef]
  26. WMO. Aerodrome Reports and Forecasts: A User’s Handbook to the Codes, 5th ed.; ld Meteorological Organization: Geneva, Switzerland, 2008. [Google Scholar]
  27. Wang, Z.F.; Maeda, T.; Hayashi, M.; Hsiao, L.F.; Liu, K.Y. A nested air quality prediction modeling system for urban and regional scales: Application for high-ozone episode in Taiwan. Water Air Soil Pollut. 2001, 130, 391–396. [Google Scholar] [CrossRef]
  28. Li, J.; Yang, W.Y.; Wang, Z.F.; Chen, H.S.; Hu, B.; Li, J.J.; Sun, Y.L.; Huang, Y. A modeling study of source-receptor relationships in atmospheric particulate matter over Northeast Asia. Atmos. Environ. 2014, 91, 40–51. [Google Scholar] [CrossRef]
  29. Wu, J.B.; Wang, Z.; Wang, Q.; Li, J.; Xu, J.; Chen, H.; Ge, B.; Zhou, G.; Chang, L. Development of an on-line source-tagged model for sulfate, nitrate and ammonium: A modeling study for highly polluted periods in Shanghai, China. Environ. Pollut. 2017, 221, 168–179. [Google Scholar] [CrossRef]
  30. Zaveri, R.A.; Peters, L.K. A new lumped structure photochemical mechanism for large-scale applications. J. Geophys. Res. Atmos. 1999, 104, 30387–30415. [Google Scholar] [CrossRef]
  31. Nenes, A. ISORROPIA: A New Thermodynamic Equilibrium Model for Multiphase Multicomponent Inorganic Aerosols. Aquat. Geochem. 1998, 4, 123–152. [Google Scholar] [CrossRef]
  32. Odum, J.; Hoffmann, T.; Bowman, F.; Collins, D.; Flagan, R.; Seinfeld, J. Gas/Particle Partitioning and Secondary Organic Aerosol Yields. Environ. Sci. Technol. 1996, 30, 2580–2585. [Google Scholar] [CrossRef]
  33. Li, J.; Chen, X.; Wang, Z.; Du, H.; Yang, W.; Sun, Y.; Hu, B.; Li, J.; Wang, W.; Wang, T.; et al. Radiative and heterogeneous chemical effects of aerosols on ozone and inorganic aerosols over East Asia. Sci. Total Environ. 2018, 622, 1327–1342. [Google Scholar] [CrossRef] [PubMed]
  34. Du, H.; Li, J.; Wang, Z.; Dao, X.; Guo, S.; Wang, L.; Ma, S.; Wu, J.; Yang, W.; Chen, X.; et al. Effects of Regional Transport on Haze in the North China Plain: Transport of Precursors or Secondary Inorganic Aerosols. Geophys. Res. Lett. 2020, 47, e2020GL087461. [Google Scholar] [CrossRef]
  35. Chen, X.; Yu, F.; Yang, W.; Sun, Y.; Chen, H.; Du, W.; Zhao, J.; Wei, Y.; Wei, L.; Du, H.; et al. Global–regional nested simulation of particle number concentration by combing microphysical processes with an evolving organic aerosol module. Atmos. Chem. Phys. 2021, 21, 9343–9366. [Google Scholar] [CrossRef]
  36. Hong, S.Y.; Noh, Y.; Dudhia, J. A new vertical diffusion package with an explicit treatment of entrainment processes. Mon. Weather Rev. 2006, 134, 2318–2341. [Google Scholar] [CrossRef] [Green Version]
  37. Chen, F.; Dudhia, J. Coupling an advanced land surface-hydrology model with the Penn State-NCAR MM5 modeling system. Part I: Model implementation and sensitivity. Mon. Weather Rev. 2001, 129, 569–585. [Google Scholar] [CrossRef]
  38. Chou, M.D.; Suarez, M.J. An Efficient Thermal Infrared Radiation Parameterization for Use in General Circulation Models; NASA/Goddard Space Flight Center: Greenbelt, MD, USA, 1994; p. 85. [Google Scholar]
  39. Mlawer, E.J.; Taubman, S.J.; Brown, P.D.; Iacono, M.J.; Clough, S.A. Radiative transfer for inhomogeneous atmospheres: RRTM, a validated correlated-k model for the longwave. J. Geophys. Res. Atmos. 1997, 102, 16663–16682. [Google Scholar] [CrossRef] [Green Version]
  40. Lin, Y.L.; Farley, R.D.; Orville, H.D. Bulk Parameterization of the Snow Field in a Cloud Model. J. Clim. Appl. Meteorol. 1983, 22, 1065–1092. [Google Scholar] [CrossRef]
  41. Bai, L.; Lu, X.; Yin, S.; Zhang, H.; Ma, S.; Wang, C.; Li, Y.; Zhang, R. A recent emission inventory of multiple air pollutant, PM2.5 chemical species and its spatial-temporal characteristics in central China. J. Clean. Prod. 2020, 269, 122114. [Google Scholar] [CrossRef]
  42. Seinfeld, J.; Pandis, S. From Air Pollution to Climate Change. Atmos. Chem. Phys. 1998, 51, 1326. [Google Scholar]
  43. Malm, W.C. Spatial and Seasonal Patterns and Temporal Variability of Haze and Its Constituents in the United States: Report III (Chapter 3); Cooperative Institute for Research in the Atmosphere, Colorado State University: Fort Collins, CO, USA, 2000; pp. 1–38. [Google Scholar]
  44. Pan, X.L.; Yan, P.; Tang, J.; Ma, J.Z. Observational study of aerosol hygroscopic growth factors over rural area near Beijing mega-city. Atmos. Chem. Phys. Discuss. 2009, 9, 5087–5118. [Google Scholar]
  45. Boylan, J.W.; Russell, A.G. PM and light extinction model performance metrics, goals, and criteria for three-dimensional air quality models. Atmos. Environ. 2006, 40, 4946–4959. [Google Scholar] [CrossRef]
  46. Thunis, P.; Clappier, A.; Tarrason, L.; Cuvelier, C.; Monteiro, A.; Pisoni, E.; Wesseling, J.; Belisa, C.A.; Pirovano, G.; Janssen, S.; et al. Source apportionment to support air quality planning: Strengths and weaknesses of existing approaches. Environ. Int. 2019, 130, 104832. [Google Scholar] [CrossRef] [PubMed]
Figure 1. (a) Model domain configuration for NAQPMS (solid black spots represent the locations of the observation NCDC sites); (b) twenty-eight tagged emission regions. ZZ is Zhengzhou, AY is Anyang, KF is Kaifeng, HB is Hebi, XX is Xinxiang, JZ is Jiaozuo, PY is Puyang, JY is Jiyuan, XY is Xinyang, ZMD is Zhumadian, SMX is Sanmenxia, LY is Luoyang, PDS is Pingdingshan, LH is Luohe, XC is Xuchang, ZK is Zhoukou, SQ is Shangqiu, NY is Nanyang, BJ is Beijing, TJ is Tianjin, HEB is Hebei province, SD is Shandong province, JS is Jiangsu province, AH is Anhui province, HUB is Hubei province, SX is Shanxi province, SAX is Shaanxi province, and OT is other regions.
Atmosphere 13 02075 g001
Figure 2. Simulated (red) and observed (black) light extinction coefficient in the CPER and surrounding areas from 1 December to 31 December 2017.
Atmosphere 13 02075 g002
Figure 3. The average contribution of different sectors to light extinction coefficient in cities over CPER (a) under average conditions and (b) poor visibility periods.
Atmosphere 13 02075 g003
Figure 4. Contribution of different regions to hourly light extinction coefficient over the CPER. The black circles on each box represent the mean values.
Atmosphere 13 02075 g004
Figure 5. The average contribution of different source regions to light extinction coefficient in (a) Anyang (AY), (b) Zhengzhou (ZZ), (c) Zhoukou (ZK), and (d) Zhumadian (ZMD) throughout the study period. The inner circle represents the contribution of twenty-eight regions tagged in this study. The outer circle indicates the contribution from local emissions (receptor city), other cities in Henan province, surrounding provinces, and other regions.
Atmosphere 13 02075 g005
Figure 6. Contribution of different source regions to light extinction coefficient in Anyang (AY), Zhengzhou (ZZ), Zhoukou (ZK), and Zhumadian (ZMD) under good, moderate, and poor visibility conditions.
Atmosphere 13 02075 g006
Figure 7. Change of light extinction coefficient in Zhengzhou under different sector emission reduction over (a) Henan region and (b) the whole region.
Atmosphere 13 02075 g007
Table 1. Statistic parameters of comparison between simulated and observed light extinction coefficient in major cities in the CPER and surrounding regions.
CityMOMPRNMBMFBMFEFAC2
Zhumadian0.350.300.44−0.15−0.140.330.88
Anyang0.380.370.54−0.020.010.360.86
Zhengzhou0.420.420.71−0.020.200.440.77
Zhoukou0.280.330.750.200.200.360.88
Beijing0.290.200.69−0.31−0.260.450.77
Xingtai0.310.380.580.210.430.580.57
Publisher’s Note: MDPI stays neutral with regard to jurisdictional claims in published maps and institutional affiliations.

