Article

Air Pollution and Tear Lactoferrin among Dry Eye Disease Modifications by Stress and Allergy: A Case–Control Study of Taxi Drivers

1
School of Clinical Medicine, He University, Shenyang 110163, China
2
Center of Physical Examination, First Affiliated Hospital of Dalian Medical University, Dalian 116041, China
3
School of Public Health, He University, Shenyang 113123, China
4
Dalian Taxi Association, Dalian 116000, China
5
School of Public Health, China Medical University, Shenyang 110122, China
6
Shenyang Center for Disease Control and Prevention, Shenyang 110031, China
7
School of Ophthalmology, He University, Shenyang 113123, China
*
Author to whom correspondence should be addressed.
These authors contributed equally to this work.
Atmosphere 2022, 13(12), 2003; https://doi.org/10.3390/atmos13122003
Submission received: 4 July 2022 / Revised: 8 September 2022 / Accepted: 21 November 2022 / Published: 29 November 2022
(This article belongs to the Special Issue Air Pollution in China (2nd Edition))

Abstract

:
Few studies have explored the possible associations between air pollution and tear lactoferrin (Lf) levels, a non-invasive biological marker of ocular surface diseases, among taxi drivers, while none have explored the modifications by stress and allergic tendencies in the relationship. We recruited 1905 taxi drivers with dry eye disease (DED) and 3803 non-DED controls in Liaoning, China, in 2012–2014. After physical examination and questionnaires were recorded, ocular surface was measured and tear Lf was determined by electrophoresis. Air pollutants and humidity were estimated by measured concentrations from monitoring stations. Conditional logistic regression models were employed to examine the associations of air pollutants and humidity with tear Lf levels. Among taxi drivers with stress or allergic tendencies, an IQR (26 μg/m3, 10 μg/m3) increase in PM10 and NO2 levels elevated the adjusted odds ratio by 1.89 (95% CI, 1.19 to 3.08) or 1.77 (95% CI, 1.06 to 2.90); and 2.87 (95% CI, 1.60 to 3.58) or 2.93 (95% CI, 1.64 to 3.83), respectively. In contrast, humidity was inversely associated for taxi drivers with stress [0.51 (95% CI, 0.38 to 0.64)] or allergic tendencies [0.49 (95% CI, 0.11 to 0.84)]; and for taxi drivers without stress [0.33 (95% CI: 0.17, 0.39)] or without allergic tendencies [0.39 (95% CI, 0.19 to 0.59)]. Tear Lf was negatively associated with each quartile of PM10 or NO2 exposure, and low humidity. PM10, NO2, and low humidity were inversely associated with Lf levels, especially for DED taxi drivers with stress and allergic tendencies.

1. Introduction

As a major global public health problem, climate change and pollution impact human health and mortality [1]. Recently, the Chinese government has implemented increasingly specific policies to reduce air pollution [2,3], and affected people have established self-help to prevent respiratory illnesses and cardiovascular ailments [4]. Unfortunately, fewer protection measures are provided regarding ocular surface health, despite ocular surface being continuously exposed to climate change and pollution [4].
As the most common ocular surface disease, dry eye disease (DED) causes ocular discomfort due to the abnormal amount or quality of tear fluid involving oxidative stress and inflammation mechanisms [5]. Although DED is not cause life-threatening, it seriously interferes with vision-related quality of life [5]. Particularly in China, the prevalence of DED continues to increase and was as high as 17–21% (from 2008 to 2010) [6]. However, studies on the association of air pollution with DED face two main challenges: (1) There is no uniform diagnostic standard for DED [7]: The questionnaires for symptoms can induce under-reporting due to homeostatic mechanisms of the ocular surface, or over-reporting due to individual sensitivity [8]. The clinical tests are not specific for one subtype [9]; and (2) Most are cross-sectional studies which do not establish the dose-response relationship between DED and exposure, and the modification of potential factors between air pollution and DED is not evaluated [10].
Thus, this study selected a specific occupation (taxi drivers) experiencing long-term outdoors exposure; collected air pollution data two years before diagnosis; and matched age and sex through a case-controled study, to explore whether covariates (especially stress and allergic tendencies) can conduct the modifications in the relationship between air pollution and DED (i.e., aggravating DED risk). Next, we wanted to further analyze whether lactoferrin (Lf) was a non-invasive biological marker of chronic exposure to specific pollution and ocular surface disease risk [11], stratified by covariates.

2. Materials and Methods

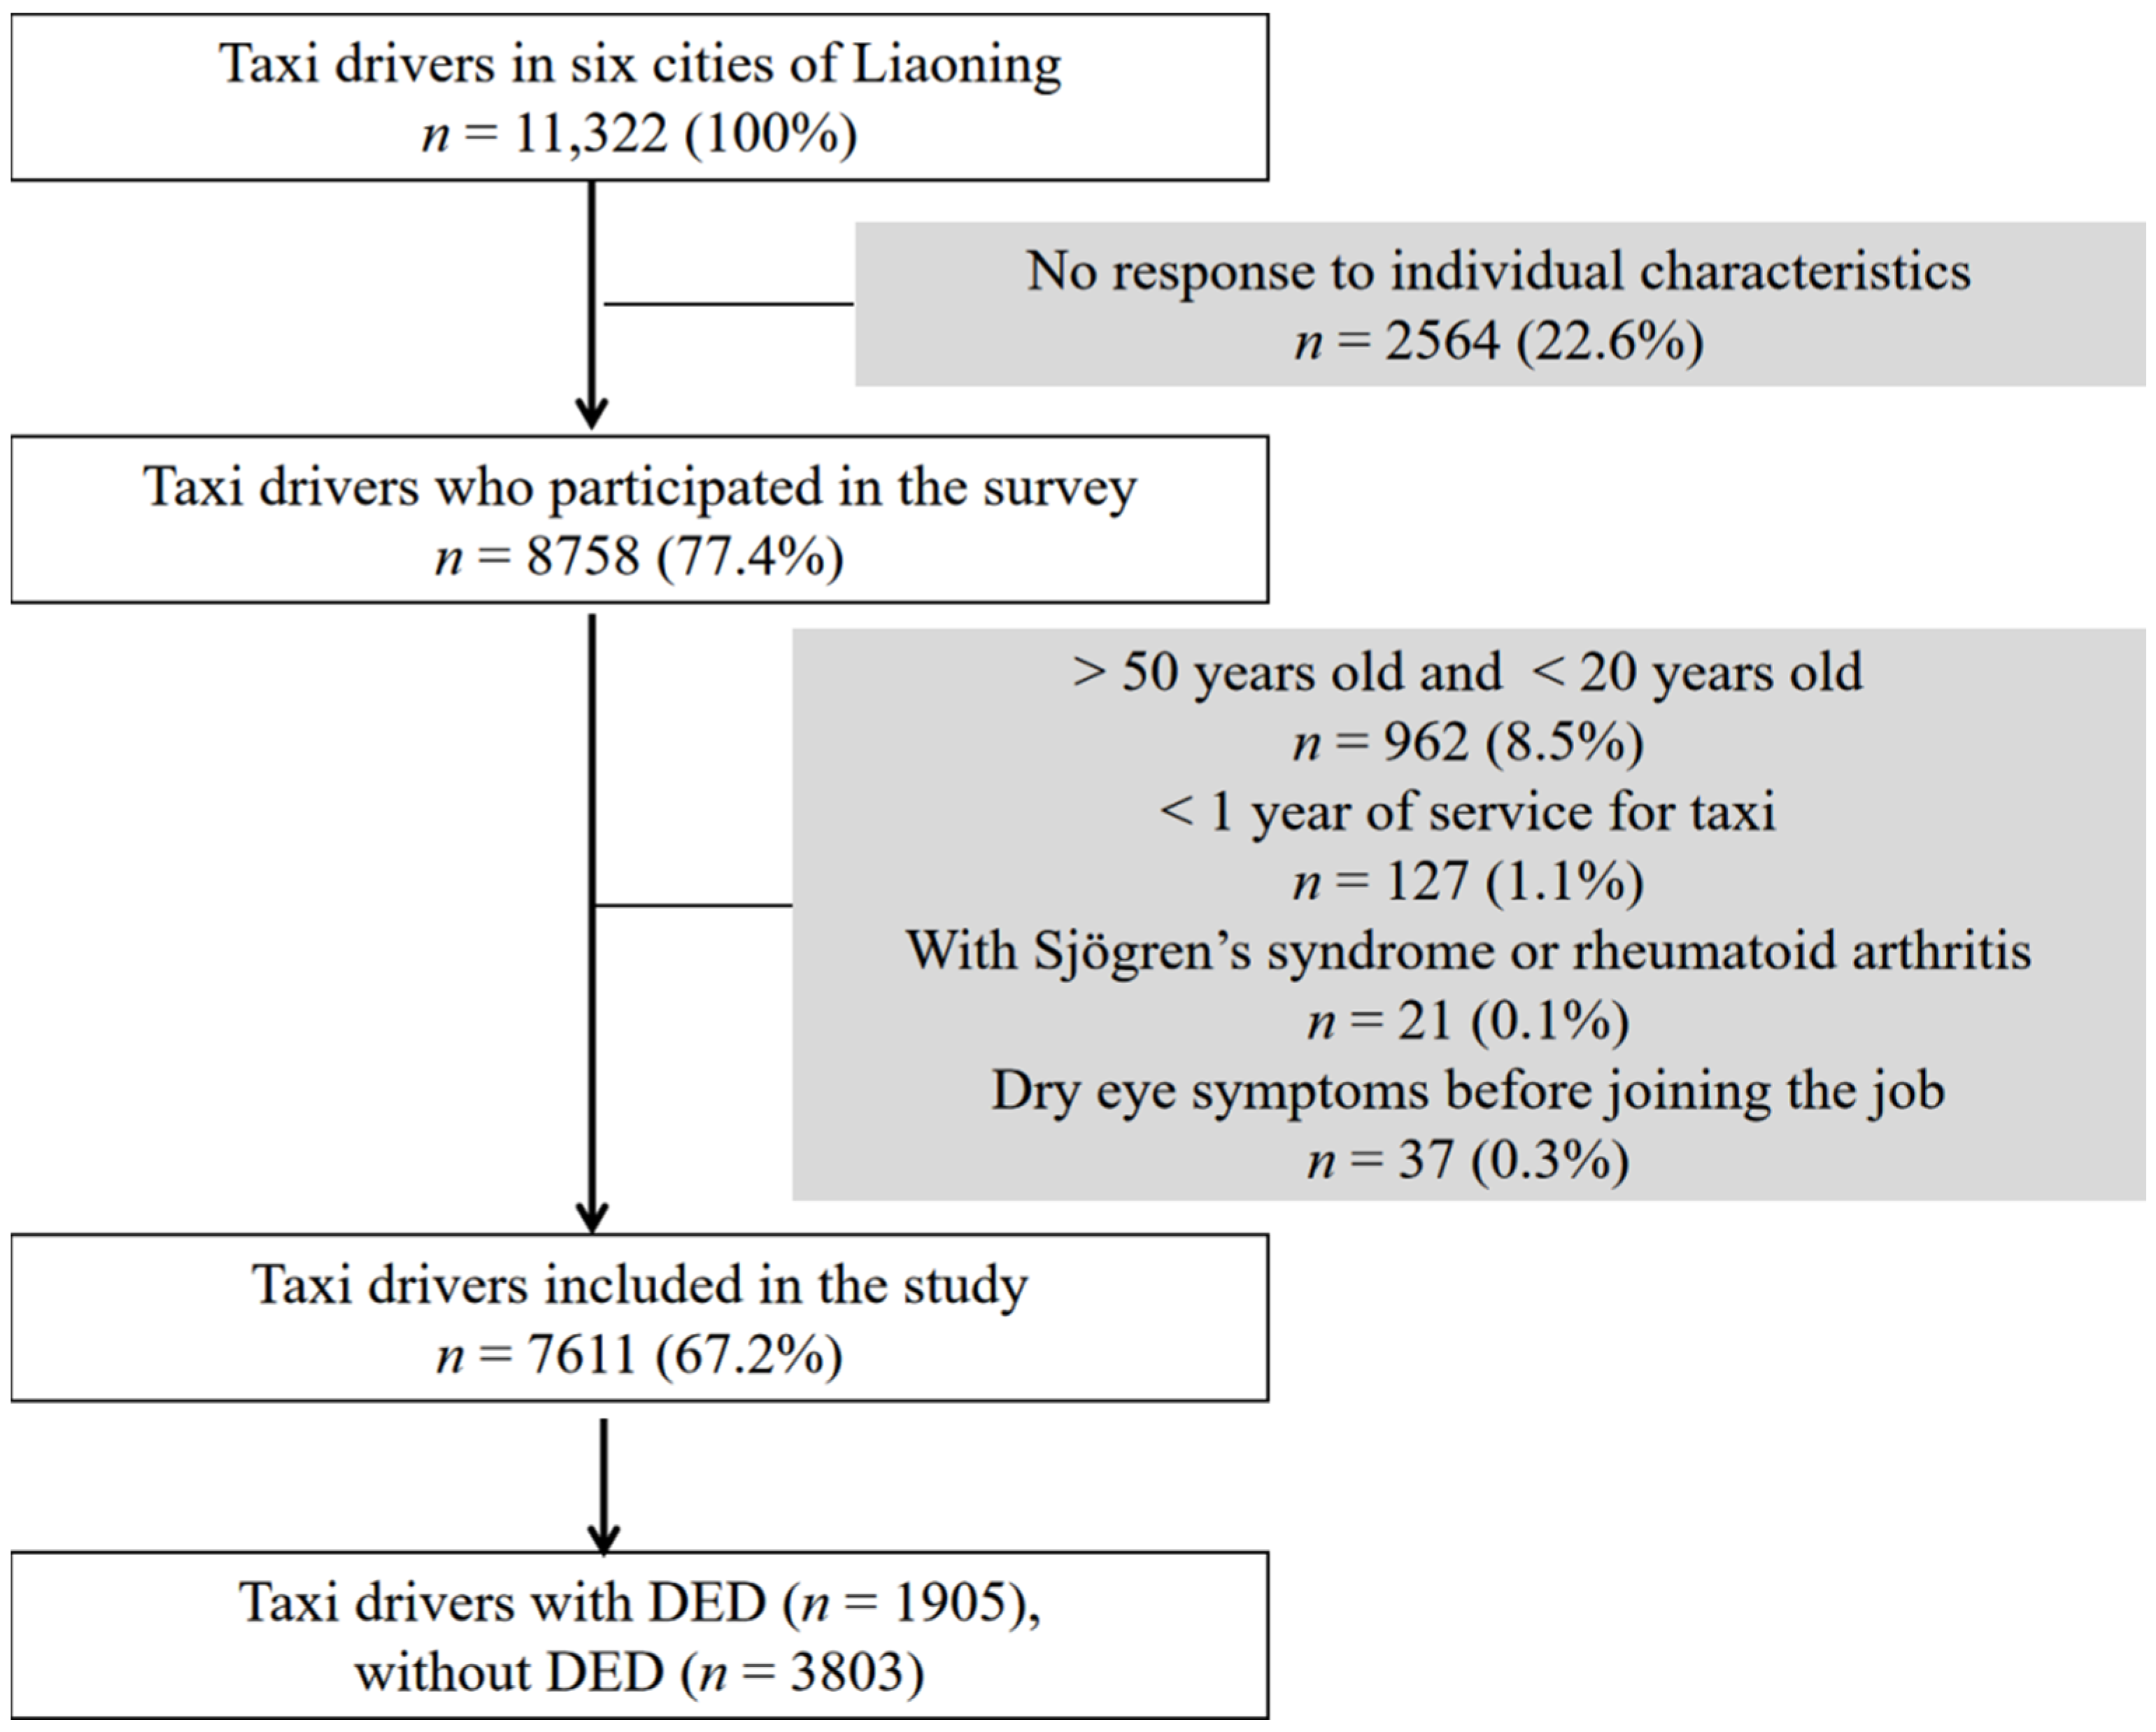
2.1. Study Participants

First, based on the 2012–2014 total gross domestic product (GDP) of each city provided by the Liaoning Provincial Bureau of Statistics, we divided all the 14 cities into three socio-economic zones: low (a total annual GDP of less than RMB 100 billion), medium (a total annual GDP of RMB 100 billion to RMB 600 billion), and high (a total annual GDP of more than RMB 600 billion). There are eight cities (Benxi, Chaoyang, Liaoyang, Fushun, Dandong, Huludao Tieling, and Fuxin) in Liaoning that belong to the low socio-economic zones, four cities (Anshan, Yingkou, Panjin, and Jinzhou) that belong to the middle socio-economic zones, and two cities (Shenyang and Dalian) that belong to the high socio-economic zones. To maximize the inter-city gradients of interest, and to minimize the correlation between pollutants, we selected 6 cities from these three socio-economic regions as sample selection regions based on 2012–2014 air pollution measurements.
Second, between 1 January and 31 December 2014, 8758 individuals from six cities provided information related to their physical examination, socioeconomic status, and behavioral habits, and were classified according to the Ocular Surface Disease Index (OSDI). According to the inclusion criteria, 7611 drivers entered the next step of examination or treatment. Cases had to have at least two of the following three signs in at least one eye: (a) corneal fluorescein staining (CFS) [12]; (b) tear break-up time (TBUT) [13]; and (c) Schirmer’s test [14] with anesthesia. Controls were selected from enrolled taxi drivers without DED, and were matched to cases by age and sex.
We recruited a final total of 1905 participants with DED (case group) and 3803 participants without DED (control group) from the 7611 taxi drivers (Figure 1 Flow chart). After measurements of visual acuity and slit lamp examinations were taken, we collected unstimulated tears of these taxi drivers using a capillary tube, and quantified their Lf levels by electrophoresis [15]. Tear Lf levels were detected using a Human lactoferrin ELISA kit from Biovision Chemicals, Inc. (San Francisco, CA, USA). We put 10 μL of saline into the conjunctival sac with a micropipette ring cap. Tear fluid samples were stored at −80 °C until analysis. The Lf detection limit of this test is 4 ng/mL. The concentration of Lf was measured twice, and the average value of the two measurements was used as the concentration of Lf protein. All study procedures and protocols were approved by the medical ethics committee of China Medical University [Approval number: SCXK_LN CMU 2013-0222].

2.2. Air Pollution Exposure Assessment

The average ambient concentrations of PM2.5, PM10, O3, SO2, CO and NO2 were obtained as previously described [16]. For CO and O3 exposure, we calculated the average 8-h concentration, and calculated the average 24-hour concentration for other pollutants. We obtained the average daily concentrations of these pollutants for 2012 to 2014 from the Liaoning Provincial Meteorological Bureau database using AirData (http://www.zhb.gov.cn/ (accessed on 21 September 2017)). In the selected 6 cities, each district of each city had a municipal air monitoring station, which was used to record the concentration of daily ambient air pollutants and relative humidity. All data was collected by the hour. Since taxi drivers work outdoors all year round, we used the air pollutant concentration in each district to estimate the daily average concentration of air pollutants in the city where participants were located, then added these data together to calculate the monthly average concentration of aggregate exposure for each taxi driver.

2.3. Covariates

We collected the characteristics of taxi drivers (gender, age, BMI, chronic diseases, allergies, smoking, drinking, eye surface status), as well as details of their socioeconomic status (education, income, business style, work intensity, and family pressure). Chronic stress was obtained through the Occupational Stress Scale [17] and Life Stress Interview [18].

2.4. Statistical Analysis

We used Q–Q plots to test data for normality, and used Bartlett’s test for unequal variances to detect data for homogeneity. For continuous variables with normal distribution, we calculated the mean ± standard deviation (SD) by t-test; for non-normal distribution variables, we calculated the median and interquartile range (IQR) by the Wilcoxon rank–sum test. For categorical variables, we used contingency tables and the Chi-square test to describe the differences in distribution. Because tear Lf levels belonged to a skewed distribution, a logarithmic transformation on tear Lf was performed. We then calculated the geometric means and their 95% confidence intervals (CI) for the ln-transformed Lf (Ln-Lf). In our data, PM2.5 was highly correlated with PM10 (r = 0.825), which increased some potential variance inflation and deviation in the statistical model. In the multivariable models, logistic regression was used to evaluate whether selected covariates interfered with the association between air pollution and DED risk. If the covariate is significantly related to the effect (p < 0.05); or if the adjusted odds ratio (aOR)—calculated by increasing an IQR of each air pollutant concentration—has changed by more than 10%, then the covariate is included into the model analysis. In the conditional logistic regression model, the likelihood ratio test is used to compare the effects of including and excluding the moderating variables in order to analyze whether there is a potential moderating effect. If the p-value of the difference level in the likelihood ratio test is less than 0.1, then this latent variable can be considered to have a moderating effect. In this study, only stress and allergies were found to meet this standard, so only these two adjustment variables were used for stratification and OR (95% CI) calculations. We used exposure (pollutants or humidity) levels below the 25th percentile as the reference category (baseline level), and used logistic regression to estimate associations with Lf in exposure quartiles, adjusting for covariates. Data were analyzed by SPSS 20.0 (IBM SPSS, Inc., Chicago, IL, USA).

3. Results

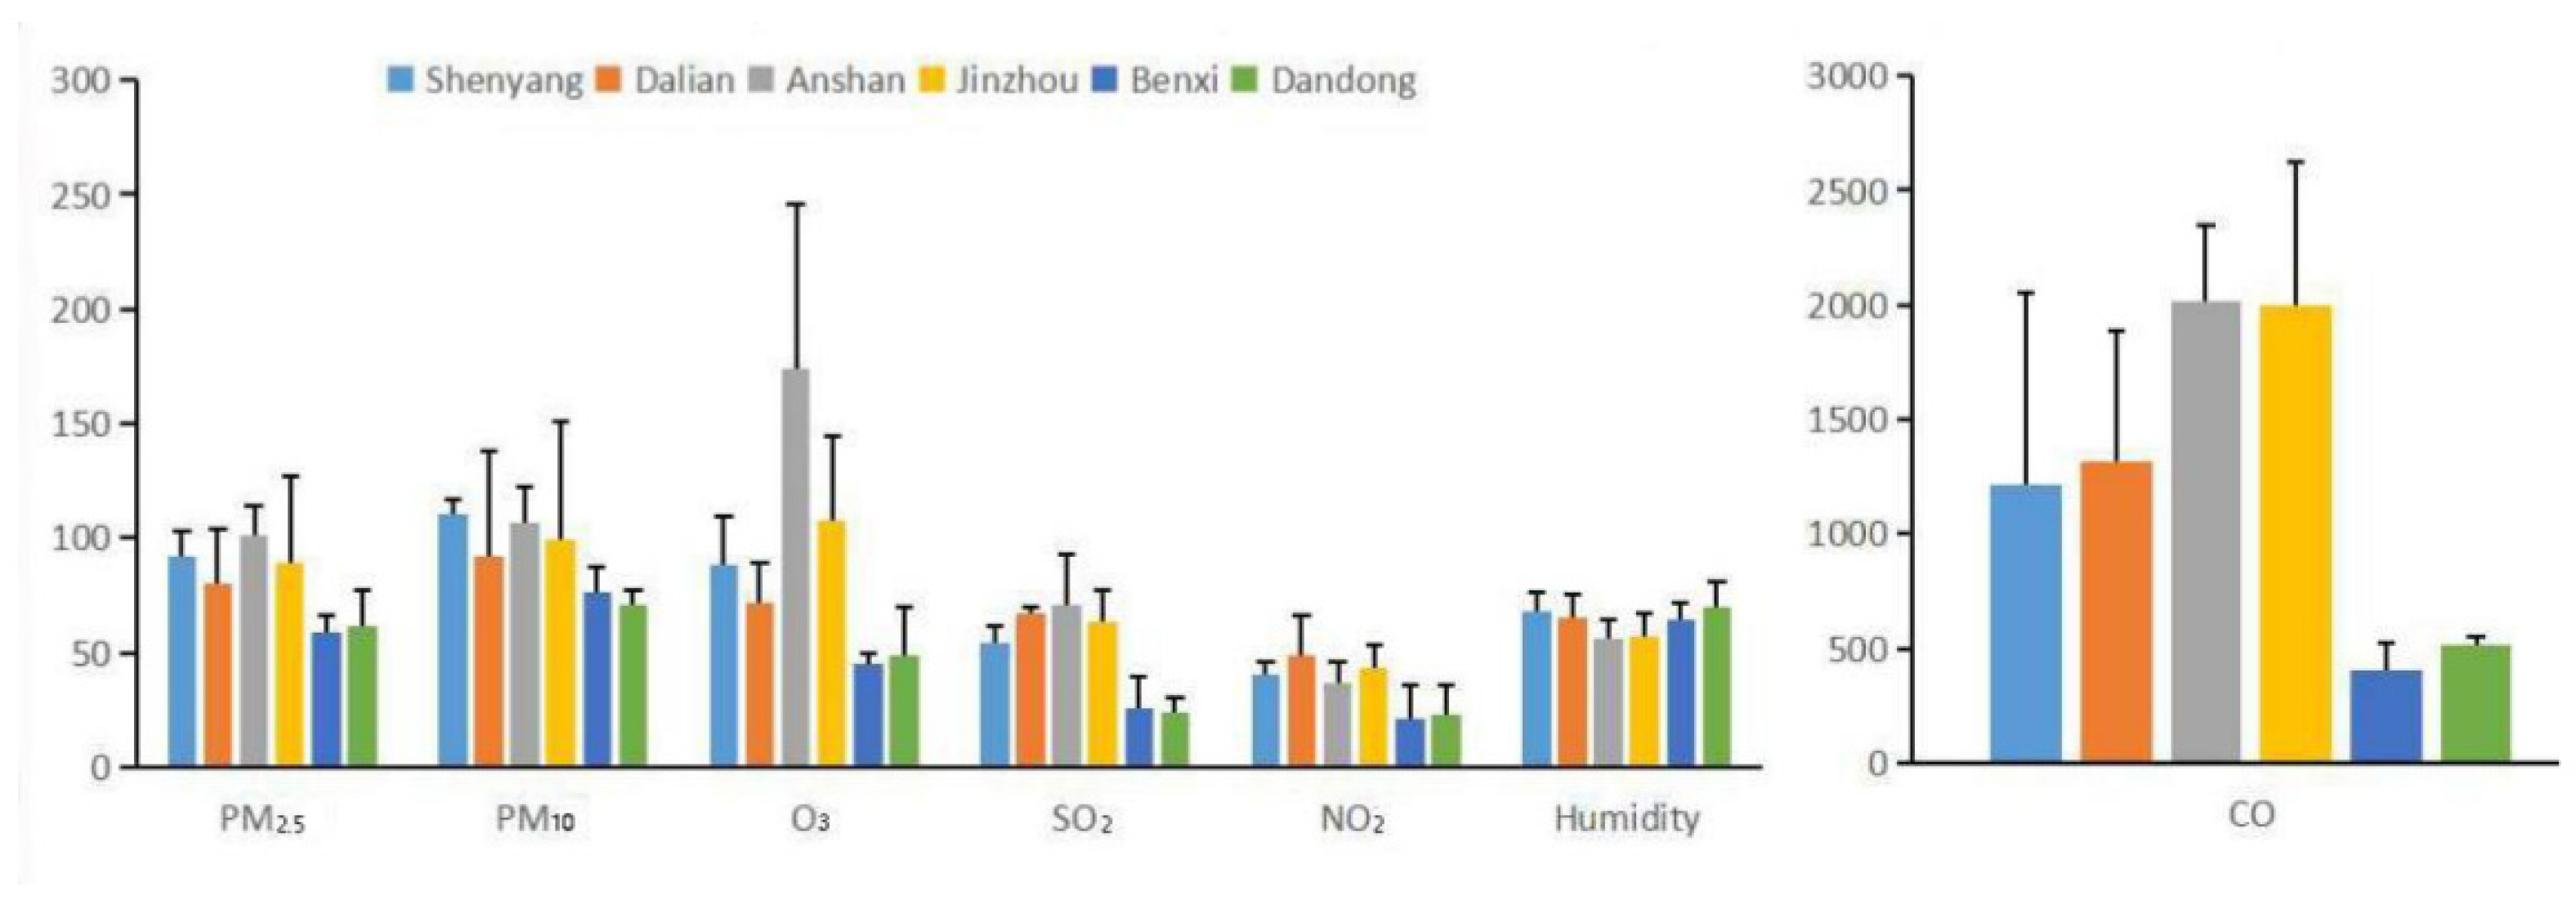
3.1. Characteristics of the Subjects Exposed to Air Pollution

Table 1 showed the physical examination and basic work statuses of 8758 taxi drivers who agreed to participate in this study. However, considering the influence of working age and participant age on the incidence of DED, we deleted 13% (1147) of taxi drivers. Compared with the included 7611 taxi drivers, there was no statistical difference in demographic variables. Figure 1 was a flow chart of case and control selection.
Figure 2 shows the distribution of the annual mean pollutant concentration in the included taxi drivers before DED diagnosis date from the 6 cities of Liaoning. The concentration range of these pollutants varied widely between district gradients for PM2.5 (34–119 μg/m3), PM10 (25–155 μg/m3), O3 (29–256 μg/m3), SO2 (5–70 μg/m3), CO (512–2433 μg/m3) and NO2 (12–61 μg/m3). Compared with Chinese National Ambient Air Quality Standards or WHO standards, PM levels exceeded WHO guidelines in all districts of these 6 cities. Other pollutants, such as O3, SO2 and NO2 levels also exceeded WHO guidelines at 43.1%, 76.1% and 52.5%, respectively. The variation range of relative humidity was from 45% to 90% (Supplementary Table S1).
Supplemental Table S2 shows Spearman’s correlation air-pollutant averages. The correlation coefficients showed only moderate correlations observed between air pollutants. The strongest correlation among coefficients was seen for PM2.5 and PM10 (r = 0.825).
Table 2 shows the distributions of sociodemographics, socioeconomic characteristics, habits and clinical examination of taxi drivers with DED compared to controls. The 25.0% (1905/7611) among enrolled taxi drivers with DED was diagnosed by clinicians. The 1905 DED were matched 1:2 to 3803 controls by age and gender. Among the variables, the distributions of shift drivers (day-time) (59% vs. 49%), allergies (43% vs. 32%), non-self-employment (96% vs. 91%), and occupational and family stresses (90% vs. 77%) were higher in taxi drivers with DED than those in taxi drivers without DED. There were statistical differences in other categorical variables between cases and controls. In addition, tear Lf levels (0.69, 95% CI: 0.67–0.71) in taxi drivers with DED were significantly higher than those (0.41, 95% CI: 0.39–0.43) in taxi drivers without DED. The TBUT values (2.65 ± 1.94 s) in cases were significantly lower than those (4.51 ± 2.36 s) in controls; moreover, the mean values of both groups were below 7 s in both eyes. There was no statistically significant difference in mean (SD) values of OSDI score, CFS and Schirmer’s test between cases and controls.

3.2. The Relationship between PM10, NO2, Humidity and DED

Table 3 shows the aORs and 95% CI for associations between air pollutants, humidity (an increase in IQR), and the occurrence of DED in the single-factor and multi-factor models. In the single-factor model, PM10 (1.32, 95% CI: 1.15, 1.70) and NO2 (2.61, 95% CI: 1.67, 3.56) were positively correlated with DED after adjusting for other covariates. Humidity (0.44, 95% CI: 0.54, 0.34) was inversely correlated with DED. The multi-factor model also showed the same related trend as in the single-factor model, although the CI range was increased. Therefore, there was a strong association between pollutants (PM10 or NO2), humidity, and DED, apart from affecting the changes in the effect estimation.
Figure 3 show the relationship between PM10, NO2, humidity and DED after adjusting for other variables; these were stratified by the four factors of stress, allergies, self-employment or shift work, on the basis of each IQR increase in conditional logistic regression. The stratifications were based on the variables in Table 2 that had statistically different distributions between DED and non-DED. Among taxi drivers with stressful events, or with allergic tendencies, each IQR (26 μg/m3) increase in PM10 was positively statistically associated with the risk of DED, with an aOR of 1.89 (95% CI, 1.19 to 3.08) or 1.77 (95% CI, 1.06 to 2.90). Similarly, each IQR (10 μg/m3) increase in NO2 was positively associated with DED with an aOR of 2.87 (95% CI, 1.60 to 3.58) or 2.93 (95% CI, 1.64 to 3.83). In contrast, an inverse association of DED with an IQR (15%) increase in humidity was shown in taxi drivers without stress, or without allergies, with aORs of 0.33 (95% CI, 0.17 to 0.39) or 0.39 (95% CI, 0.19 to 0.59), respectively.
Adjustment for all the potential covariates in Table 2 included characteristics of taxi drivers except for the stratification variables.
Table 4 and Table 5 show the possible associations between PM10, NO2, or humidity and tear Lf levels, a prominent biomarker of DED.

3.3. Associations between Tear Lf and PM10, NO2, Humidity

Among non-DED taxi drivers without stress, tear Lf was significantly negatively associated with the 75th percentile (vs. the lowest) of NO2 exposure (adjusted β = −0.525 mg/mL, 95% CI: −0.997, −0.049). In contrast, Lf was significantly positively associated with the 75th percentile of humidity (adjusted β = 1.897 mg/mL, 95% CI: 0.494, 3.020).
Among non-DED taxi drivers with stress, tear Lf was significantly negatively associated with the 75th percentile of PM10 exposure (adjusted β = −0.586 mg/mL, 95% CI: −0.888, −0.300), and NO2 exposure (adjusted β = −0.329 mg/mL, 95% CI: −0.613, −0.039). In contrast, Lf was significantly positively associated with the 75th percentile of humidity (adjusted β = 1.734%, 95% CI: 0.872, 2.659).
Among DED taxi drivers with stress, tear Lf was significantly negatively associated with the 25th to 50th percentile (adjusted β = −0.512 mg/mL, 95% CI: −1.065, −0.041), the 75th percentile of PM10 exposure (adjusted β = −0.912 mg/mL, 95% CI: −1.374, −0.413), and each quartile of NO2 exposure (adjusted β = −0.445 mg/mL, 95% CI: −0.744, −0.151), (adjusted β = −0.495 mg/mL, 95% CI: −1.089, −0.094), (adjusted β = −0.668 mg/mL, 95% CI: −1.141, −0.199). In contrast, Lf was significantly positively associated with the 25th to 50th percentile (adjusted β = 1.309%, 95% CI: 0.095, 2.507), and the 75th percentile of humidity (adjusted β = 1.994%, 95% CI: 1.572, 2.303). There were inverse dose–response relationships between PM10 or NO2 and DED odds, and a positive dose–response relationship between humidity and DED odds. Similar associations were observed among taxi drivers with allergic tendencies.

4. Discussion

The main strengths of this study include the demonstration of: (1) A positive association of PM10 or NO2 with DED, and an inverse association of lower humidity with DED; (2) Positive correlation of potential factors including day-time, allergies, non-self-employment, and stress with DED. Moreover, stress or allergic tendencies increased DED risk from PM10, NO2 exposure, or from lower humidity; and (3) An inverse relationship between PM10, NO2, low humidity and tear Lf levels. The above associations between ambient factors on tear Lf levels were more pronounced among taxi drivers with stress or allergic tendencies than taxi drivers without stress or allergic tendencies.

4.1. Model Performance

Although epidemiological studies prove that acute and chronic exposures to air pollution have a negative impact on ocular surface health, there are statistical differences in the association of each pollutant on DED due to the different sources, intensity, exposure time, and dose calculation methods of air pollutants from different regions as well as study participants’ characteristics [8,19,20]. This study only included taxi drivers with long-term exposure to outdoor pollution, who are low-income, high-stress, and disadvantaged groups in China, so the partial demographic bias could be avoided during the statistical analysis. Of course, this also limits the generalization of our results to the public, but at least further proves that air pollution is partly to blame for the increasing DED.
We used a single-pollutant model to show that long-term PM10 and NO2 exposure increased DED risk by 32% and 161%, respectively, while high humidity decreased DED risk by 56%. Although the results of the single-pollutant models were similar with the multi-pollutant models, we chose single-pollutant models to avoid multicollinearity due to high or moderate correlations between air pollutants, which may induce potential variance inflation and bias. Although the complex composition of pollution exposure can lead to PM2.5 and PM10 being non-specific pollutants and weaken the correlation between them, the present study showed a high correlation between PMs, because automobile exhaust is currently the main source of air pollution in China [21]. Moreover, the enhanced correlations (PM10, NO2 and humidity) from the multi-pollution models compared to those from the single-pollution models, and other reduced correlations (O3, SO2 and CO) were noted. These ranges of confidence interval were wider, which also proved that the multi-pollution models were not appropriate in this study.

4.2. PM10 or NO2 and Lower Humidity Were Risk Factors for DED

Increasing levels of tear film osmolarity is an indicator of DED. In one study of taxi drivers from Sao Paulo (Brazil), a negative association was found between PM2.5 or NO2 levels and tear film osmolarity levels within normal limits (316 mOsm/L) [22], which indicated the existence of an adaptive response when the ocular surface in individuals was exposed to air pollution. It should be noted that the average PM2.5 levels (40 μg/m3) in Sao Paulo is higher than the WHO levels (10 μg/m3), but the value is lower than the Chinese standard (50 μg/m3). In Liaoning, the average PM2.5 levels is 80 μg/m3.
If individuals initially are exposed to high levels of PM2.5, tear osmolarity will increase and be prone to DED [10]. However, we did not find such a relationship between PM2.5 exposure and DED in this study. This may be because PM2.5 is unlikely to directly affect tear secretion and epithelial barrier function compared with PM10 [22], which may be due to the fact that heavy metals not only adsorb on the surface of PM, but also penetrate into the structure of PM [23,24]. In China, PM10 contains more heavy metal elements (S, Zn, Cu and Pb) than PM2.5 (S and Pb) [25]. Therefore, these can exacerbate allergic reactions of PM as allergen carriers [26]. In addition, under long-term exposure to high concentrations, tear film osmotic pressure may be normalized to a certain extent [8].
The data for PM10 were not available in the study from Brazil. However, we demonstrated that PM10 was associated with DED, which was inconsistent with the results of a South Korean study. Although reflex tear may flush PM from the ocular surface, the annual PM10 level (84 μg/m3) in China was higher than that in Korea (40 μg/m3). Such high PM10 levels may be enough to induce DED [8].
In China, CO and NO2 mainly come from automobile exhaust emissions due to incomplete combustion inside motor engines. Among Chinese taxi drivers, higher CO and NO2 levels were positively associated with DED, but there was no statistically significant association between CO and DED. This problem may be related to CO assessment, because ambient CO concentrations have considerable spatial variability [27]. In contrast to the change of symptoms after NO2 exposure, inhalation of CO can increase the diameter of arteries and veins, retinal blood flow velocity and fundus pulsation amplitude [28]. The indirect symptoms of ocular surface present in a delayed fashion [29]. For NO2, this pollutant can acidify tears and reduce tear break-up time [30,31]. In this study, a negative correlation was found between exposure levels and DED. However, in the Brazilian taxi driver survey, there was no statistically significant difference. A possible explanation is the difference in NO2 exposure levels between the two places (Brazil: 175 μg/m3, China: 31 μg/m3). The sensory receptor reactivity might adapt to high levels of air pollution and be reduced [32]. When NO2 levels (less than 40 mg/m3 in a hospital in São Paulo) were similar to our values, the results of significantly negative correlation were consistent with this study [31].
We also found a negative correlation between O3 and DED, but with no statistical difference. However, in a Korean study, increased O3 levels were associated with DED [8]. This inconsistent result was due to different O3 background levels (Korea: 250 μg/m3, China: 92 μg/m3), participants’ characteristics (Korea: population, China: taxi drivers), and different diagnostic criteria for DED (Korea: symptoms or diagnosis, China: OSDI, TBUT, CFS, Schirmer’s test and Lf levels). Another possible explanation was that O3 and NO2 in the environment are coupled by chemical bonds, and the formation of O3 needs to deplete nitrogen with the help of sunlight [33]. Thus, when exposed to high levels of NO2, individuals typically experience lower O3 exposure, especially in areas with heavy traffic [34].
There also are many controversies about the relationship between SO2 and DED. Some studies reported positive association, [7,20] the others reported null association [8,35]. Our study also showed null association, which was related to the decreasing SO2 levels due to the worldwide use of fuel with low sulfur content [36].

4.3. Stress or Allergies Increased the Risks of PM10, NO2 Exposure or Low Humidity on DED

The covariates listed (stress, allergies, driving during the day, and non-self-employment) may be potential risk factors for DED in taxi drivers. By taking each stratum with a single potential factor [37], and matching age and gender, we minimized the influence of confounding factors. However, the risks of PM10, NO2 exposure or low humidity on DED might be exacerbated in taxi drivers with stress or allergies.
Similar to other countries [38,39], in China today, taxi drivers are assigned as disadvantaged groups. Due to their low income (less than 5000 RMB/month) and high work intensity (more than 10 h/day), they feel stressed and irritable (e.g., due to traffic congestion), which increases traffic risks and the occurrence of various chronic diseases (anemia, hypertension, hypercholesterolemia, hypertriglyceridemia, high blood sugar), according on our study. Even if these taxi drivers pay attention to health protection, they are unavoidably exposed to air pollution for a long time due to their occupational characteristics [22].
As for identification of susceptible individuals [10], we collected information through questionnaires about whether participants had experienced asthma, allergic rhinitis, eczema and food allergy before working as taxi drivers. Although there was a certain recall bias here, we partially proved that underlying allergic tendencies increased DED risk in taxi drivers with chronic exposure to PM10, NO2, and low humidity.

4.4. Tear Lf Has Inverse Associations with PM10, NO2, and Low Humidity

Another major contribution of this study is the identification of the inverse associations between ambient factors (PM10, NO2, and low humidity) and tear Lf, especially for taxi drivers with stress or allergies. There were negative dose–response relationships between these ambient factors and Lf. To date, there are few studies on the relationship between air pollution and Lf. Regardless of animal experiments and epidemiological studies [40,41,42], the existing literature shows that air pollution transiently elevates Lf levels in the lung and nasal airways of healthy subjects, who face acute inflammatory reactions caused by short-term exposure. While our data is inconsistent with theirs, we found that more chronic exposure to airborne particulates and low humidity may be associated with decreased Lf levels in tears. To the best of our knowledge, there is no report similar to ours. Because healthy subjects will escape from the polluted environment after acute exposure, the body’s compensation mechanism can restore Lf to normal [41,42]. Here, these taxi drivers had to be exposed outdoors for more than 10 h on average every day for their livelihood, and they rarely took breaks unless they were ill or had major issues at home.
A possible explanation is that iron and inflammatory homeostasis may cause changes in tear Lf, a natural glycoprotein, in acute and chronic exposures [11]. In the process of infection or inflammation caused by acute exposure eventually leading to oxidative damage, Lf levels may, in turn, increase in tears due to a transient recruitment of neutrophils, and increased production of Lf [43]. During irritation/cytotoxicity caused by chronic exposure, Lf may decrease due to low production of epithelial cells. Once the self-adjusting adaptive mechanism fails as a result of chronic exposure, it may induce tear hyperosmolarity and loss of goblet cells, and cause dry eyes to occur [22]. Another reason may be that the average Hb levels of taxi drivers (male: 118 g/L; female: 108 g/L) in this study was slightly lower than the standard levels of Chinese (male: 151 g/L; female: 129 g/L) [44].
Our results also show that the DED status modified the effect of air pollution exposure on the Lf biomarker; an iron-bound multifunctional cationic glycoprotein in different human fluids and secretions that exerts antibacterial, antioxidant, anti-inflammatory and immunomodulatory activities [11]. The difference of mean tear Ln-Lf levels between DED (0.41 mg/mL) and non-DED (0.69 mg/mL) taxi drivers may reflect the activity of DED after air pollution exposure. However, among other symptoms and clinical tests in this study, the results of the OSDI score, CFS and Schirmer’s test were similar between DED and non-DED taxi drivers, with the exception of TBUT. This may be related to subjects adapting to long-term air pollution exposure, and subjects may have functional adaptations when air pollution worsens [22]. This again reflected these taxi drivers’ insensitivity to dry eye symptoms and the specificity of Lf as a non-traumatic biomarker of DED in this study, but tear Lf is not a specific biomarker of DED. Moreover, Lf level may be modified in other ocular surface diseases due to infection [45] or airborne carbon black exposure [46].
When the examination was stratified by the potential role of stressful or allergic status, effect estimates for the ambient factors (per IQR increase in PM10, NO2, and low humidity)–tear Lf associations were stronger for taxi drivers with stressful or allergic status, which suggested that the dose-response relationship may be more intense in stressful or allergic conditions. Through further stratification, we found that DED may amplify the effect of ambient factors on Lf levels, but similar relationships were not found for non-DED subjects; this suggests that DED taxi drivers with stressful or allergic status may be more sensitive to Lf level changes after exposure to ambient factors.

4.5. Limitations

Our study had the following limitations. First, because of the lack of multiple time points, we could not claim to obtain the causal relationship between ambient factors and the results of concern. Nonetheless, robust associations of ambient factors with ocular surface injury indicate that there may be causal relationship. Second, the results of this study were limited to taxi drivers, and different results may be obtained from other professionals. Thus, the conclusions cannot be extended to the general population. Third, due to different driving ventilation habits (driver habitually could open their windows and others could close them when using air conditioning), the taxi drivers could have had different levels of exposure at the same level of air pollution. Fourth, each driver’s individualized exposure was not recorded, thus, the exposure measurement may lead to exposure bias. Fifth, we could not investigate the etiology of DED (hyposecretion or hyper evaporation).

5. Conclusions

This case-control study supports the hypothesis that stress and allergic tendencies may increase the susceptibility of DED caused by long-term exposure to PM10, NO2, and low humidity in taxi drivers. Moreover, the aggravation caused by PM10, NO2, and low humidity may decrease tear Lf levels, especially for DED taxi drivers with stress and allergic tendencies.

Supplementary Materials

The following supporting information can be downloaded at: https://www.mdpi.com/article/10.3390/atmos13122003/s1. Table S1: Descriptive Statistic of air pollution concentrations (μg/m3) and humidity (%) in the six cities of Liaoning, China, from 2012 to 2014; Table S2: Spearman correlation coefficients* between air pollutants; Table S3: Association of PM10, NO2 or humidity (per IQR increase a) and DED, stratified by significant covariates.

Author Contributions

F.Y., W.H. and F.K. wrote the main manuscript text. W.S. and L.Z. collected the data. Z.R. and X.X. analyzed the data. J.L. and F.K. prepared clinical tests. All authors have read and agreed to the published version of the manuscript.

Funding

The work was supported by “Liaoning BaiQianWan Talents Program” (Grant number: 2020-C122) and “Scientific Research Funding Project of the Education Department of Liaoning Province” (Grant number: LJKZ1390). The funding source did not have control of the design or analysis of the study publication.

Institutional Review Board Statement

The study was conducted in accordance with the Declaration of Helsinki, and approved by the Ethics Committee of China Medical University (Approval number: SCXK_LN CMU 2013-0222 and 13 May 2012).

Informed Consent Statement

Informed consent was obtained from all subjects involved in the study.

Data Availability Statement

The datasets used and/or analysed during the current study available from the corresponding author on reasonable request.

Acknowledgments

We would like to thank all members for their sincere cooperation in this long-term investigation, and thank the local taxi trade unions and environmental health staff for their strong support. Special thanks to the taxi drivers and their families. We are moved by their attitude of working hard under difficult circumstances. In fact, besides DED, we should pay more attention to the risk of air pollution for their other chronic diseases (hearing loss, anemia, hyperlipidemia, hypertension, diabetes, ventilation and respiratory diseases, etc.).

Conflicts of Interest

The authors declare no competing interest.

References

  1. Holgate, S.T.; Samet, J.M.; Koren, H.S.; Maynard, R.L. (Eds.) Air Pollution and Health; Academic Press: London, UK, 1999. [Google Scholar]
  2. Pu, S.; Shao, Z.; Fang, M.; Yang, L.; Liu, R.; Bi, J.; Ma, Z. Spatial distribution of the public’s risk perception for air pollution: A nationwide study in China. Sci. Total Environ. 2018, 655, 454–462. [Google Scholar] [CrossRef] [PubMed]
  3. Zhao, B.; Zheng, H.; Wang, S.; Smith, K.R.; Lu, X.; Aunan, K.; Gu, Y.; Wang, Y.; Ding, D.; Xing, J.; et al. Change in household fuels dominates the decrease in PM2.5 exposure and premature mortality in China in 2005–2015. Proc. Natl. Acad. Sci. USA 2018, 115, 12401–12406. [Google Scholar] [CrossRef] [PubMed] [Green Version]
  4. Liu, L.; Guan, P.; Cheng, C. Paying more attention on keeping eye health in dust-haze weather in China. Environ. Pollut. 2017, 231, 1211. [Google Scholar] [CrossRef] [PubMed]
  5. Hessen, M.; Akpek, E.K. Dry eye: An inflammatory ocular disease. J. Ophthalmic Vis. Res. 2014, 9, 240–250. [Google Scholar] [PubMed]
  6. Liu, N.N.; Liu, L.; Li, J.; Sun, Y.Z. Prevalence of and risk factors for dry eye symptom in mainland China: A systematic review and meta-analysis. J. Ophthalmol. 2014, 2014, 748654. [Google Scholar] [CrossRef] [Green Version]
  7. Ye, X.F.; Hong, J.X.; Mu, Z.; Peng, L.; Zhou, J.; Yang, D.D.; Xu, J.M. Acute effects of meteorological environmental factors on dry eyes. In Proceedings of the 31th Annual Meeting of China Meteorological Society, Beijing, China, 3 November 2014. [Google Scholar]
  8. Hwang, S.H.; Choi, Y.H.; Paik, H.J.; Wee, W.R.; Kim, M.K.; Kim, D.H. Potential importance of ozone in the association between outdoor air pollution and dry eye disease in South Korea. JAMA Ophthalmol. 2016, 134, 503–510. [Google Scholar] [CrossRef] [Green Version]
  9. Caffery, B.E.; Josephson, J.E. Corneal staining after sequential instillations of fluorescein over 30 days. Optom. Vis. Sci. 1991, 68, 467–469. [Google Scholar] [CrossRef]
  10. Jung, S.J.; Mehta, J.S.; Tong, L. Effects of environment pollution on the ocular surface. Ocul. Surf. 2018, 16, 198–205. [Google Scholar] [CrossRef]
  11. Ponzin, E.; Scotti, L.; Grandori, R.; Tavazzi, S.; Zambon, A. Lactoferrin concentration in human tears and ocular diseases: A meta-analysis. Investig. Ophthalmol. Vis. Sci. 2020, 61, 9. [Google Scholar] [CrossRef]
  12. Lemp, M.A. Report of the national eye institute/industry workshop on clinical trials in dry eyes. CLAO J. 1995, 21, 221–232. [Google Scholar]
  13. Kangari, H.; Eftekhari, M.H.; Sardari, S.; Hashemi, H.; Salamzadeh, J.; Ghassemi-Broumand, M.; Khabazkhoob, M. Short-term consumption of oral omega-3 and dry eye syndrome. Ophthalmology 2013, 120, 2191–2196. [Google Scholar] [CrossRef]
  14. Bhargava, R.; Kumar, P.; Phogat, H.; Kaur, A.; Kumar, M. Oral omega-3 fatty acids treatment in computer vision syndrome related dry eye. Cont. Lens Anterior Eye 2015, 38, 206–210. [Google Scholar] [CrossRef]
  15. Hetherington, S.V.; Spitznagel, J.K.; Quie, P.G. An enzyme-linked immunoassay (ELISA) for measurement of lactoferrin. J. Immunol. Methods 1983, 65, 183–190. [Google Scholar] [CrossRef]
  16. Dong, G.H.; Wang, J.; Zeng, X.W.; Chen, L.; Qin, X.D.; Zhou, Y.; Li, M.; Yang, M.; Zhao, Y.; Ren, W.H.; et al. Interactions between air pollution and obesity on blood pressure and hypertension in Chinese children. Epidemiology 2015, 26, 740–747. [Google Scholar] [CrossRef]
  17. Cho, J.J.; Kim, J.Y.; Chang, S.J.; Fiedler, N.; Koh, S.B.; Crabtree, B.F.; Kang, D.M.; Kim, Y.K.; Choi, Y.H. Occupational stress and depression in Korean employees. Int. Arch. Occup. Environ. Health 2008, 82, 47–57. [Google Scholar] [CrossRef]
  18. Hammen, C. Generation of stress in the course of unipolar depression. J. Abnorm. Psychol. 1991, 100, 555–561. [Google Scholar] [CrossRef]
  19. Malerbi, F.K.; Martins, L.C.; Saldiva, P.H.; Braga, A.L. Ambient levels of air pollution induce clinical worsening of blepharitis. Environ. Res. 2012, 112, 199–203. [Google Scholar] [CrossRef]
  20. Mo, Z.; Fu, Q.; Lyu, D.; Zhang, L.; Qin, Z.; Tang, Q.; Yin, H.; Xu, P.; Wu, L.; Wang, X.; et al. Impacts of air pollution on dry eye disease among residents in Hangzhou, China: A case-crossover study. Environ. Pollut. 2019, 246, 183–189. [Google Scholar] [CrossRef]
  21. Song, C.; Wu, L.; Xie, Y.; He, J.; Chen, X.; Wang, T.; Lin, Y.; Jin, T.; Wang, A.; Liu, Y.; et al. Air pollution in China: Status and spatiotemporal variations. Environ. Pollut. 2017, 227, 334–347. [Google Scholar] [CrossRef]
  22. Torricelli, A.A.; Novaes, P.; Matsuda, M.; Braga, A.; Saldiva, P.H.; Alves, M.R.; Monteiro, M.L. Correlation between signs and symptoms of ocular surface dysfunction and tear osmolarity with ambient levels of air pollution in a large metropolitan area. Cornea 2013, 32, e11–e15. [Google Scholar] [CrossRef]
  23. Deng, X.; Zhang, F.; Rui, W.; Long, F.; Wang, L.; Feng, Z.; Chen, D.; Ding, W. PM2.5-induced oxidative stress triggers autophagy in human lung epithelial A549 cells. Toxicol. In Vitro 2013, 27, 1762–1770. [Google Scholar] [CrossRef] [PubMed]
  24. Leung, P.Y.; Wan, H.T.; Billah, M.B.; Cao, J.J.; Ho, K.F.; Wong, C.K.C. Chemical and biological characterization of air particulate matter 2.5, collected from five cities in China. Environ. Pollut. 2014, 194, 188–195. [Google Scholar] [CrossRef] [PubMed]
  25. Xue, H.; Liu, G.; Zhang, H.; Hu, R.; Wang, X. Similarities and differences in PM10 and PM2.5 concentrations, chemical compositions and sources in Hefei City, China. Chemosphere 2019, 220, 760–765. [Google Scholar] [CrossRef] [PubMed]
  26. Burki, T. WHO introduces ambitious new air quality guidelines. Lancet 2021, 398, 1117. [Google Scholar] [CrossRef] [PubMed]
  27. US EPA. Final Assessment: Integrated Science Assessment for Carbon Monoxide. US Patent EPA/600/R-09/019F, 29 January 2010. [Google Scholar]
  28. Resch, H.; Zawinka, C.; Weigert, G.; Schmetterer, L.; Garhöfer, G. Inhaled carbon monoxide increases retinal and choroidal blood flow in healthy humans. Investig. Ophthalmol. Vis. Sci. 2005, 46, 4275–4280. [Google Scholar] [CrossRef]
  29. Berg, E.J.; Ying, G.S.; Maguire, M.G.; Sheffield, P.E.; Szczotka-Flynn, L.B.; Asbell, P.A.; Shen, J.F.; DREAM, Study Research Group. Climatic and environmental correlates of dry eye disease severity: A report from the dry eye assessment and management (DREAM) study. Transl. Vis. Sci. Technol. 2020, 9, 25. [Google Scholar] [CrossRef]
  30. Leonardi, A.; Lanier, B. Urban eye allergy syndrome: A new clinical entity? Curr. Med. Res. Opin. 2008, 24, 2295–2302. [Google Scholar] [CrossRef]
  31. Novaes, P.; Saldiva, P.H.; Matsuda, M.; Macchione, M.; Rangel, M.P.; Kara-José, N.; Berra, A. The effects of chronic exposure to traffic derived air pollution on the ocular surface. Environ. Res. 2010, 110, 372–374. [Google Scholar] [CrossRef]
  32. Smith, D.W.; Gamble, K.R.; Heil, T.A. A novel psychophysical method for estimating the time course of olfactory rapid adaptation in humans. Chem. Senses 2010, 35, 717–725. [Google Scholar] [CrossRef] [Green Version]
  33. Clapp, L.J.; Jenkin, M.E. Analysis of the relationship between ambient levels of O3, NO2 and NO as a function of NOx in the UK. Atmos. Environ. 2001, 35, 6391–6405. [Google Scholar] [CrossRef]
  34. Jerrett, M.; Arain, A.; Kanaroglou, P.; Beckerman, B.; Potoglou, D.; Sahsuvaroglu, T.; Morrison, J.; Giovis, C. A review and evaluation of intraurban air pollution exposure models. J. Expo. Anal. Environ. Epidemiol. 2005, 15, 185–204. [Google Scholar] [CrossRef]
  35. Zhong, J.Y.; Lee, Y.C.; Hsieh, C.J.; Tseng, C.C.; Yiin, L.M. Association between dry eye disease, air pollution and weather changes in Taiwan. Int. J. Environ. Res. Public Health 2018, 15, 2269. [Google Scholar] [CrossRef] [Green Version]
  36. World Health Organization. Air Quality Guidelines: Global Update 2005: Particulate Matter, Ozone, Nitrogen Dioxide and Sulfur Dioxide; World Health Organization: Geneva, Switzerland, 2006.
  37. Knol, M.J.; VanderWeele, T.J. Recommendations for presenting analyses of effect modification and interaction. Int. J. Epidemiol. 2012, 41, 514–520. [Google Scholar] [CrossRef] [Green Version]
  38. Mirpuri, S.; Ocampo, A.; Narang, B.; Roberts, N.; Gany, F. Discrimination as a social determinant of stress and health among New York City taxi drivers. J. Health Psychol. 2020, 25, 1384–1395. [Google Scholar] [CrossRef]
  39. Shahrukh, M.; Pervaiz, M.; Khatoon, N. Stress-inducing factors among occupational drivers in Karachi, Pakistan. East. Mediterr. Health J. 2020, 26, 1233–1241. [Google Scholar] [CrossRef]
  40. Desrosiers, M.; Baroody, F.M.; Proud, D.; Lichtenstein, L.M.; Kagey-Sobotka, A.; Naclerio, R.M. Treatment with hot, humid air reduces the nasal response to allergen challenge. J. Allergy Clin. Immunol. 1997, 99, 77–86. [Google Scholar] [CrossRef]
  41. Ghio, A.J.; Richards, J.H.; Dittrich, K.L.; Samet, J.M. Metal storage and transport proteins increase after exposure of the rat lung to an air pollution particle. Toxicol. Pathol. 1998, 26, 388–394. [Google Scholar] [CrossRef]
  42. Janssen, N.A.; Strak, M.; Yang, A. Associations between three specific a-cellular measures of the oxidative potential of particulate matter and markers of acute airway and nasal inflammation in healthy volunteers. Occup. Environ. Med. 2015, 72, 49–56. [Google Scholar] [CrossRef]
  43. Seen, S.; Tong, L. Dry eye disease and oxidative stress. Acta Ophthalmol. 2018, 96, e412–e420. [Google Scholar] [CrossRef] [Green Version]
  44. Cong, Y.L.; Jin, D.M.; Wang, H.L.; Okada, T.; Peng, Z.H. Coordination Group for Reference Range of Venous Blood Examination in Chinese Adults. Establishing the reference range of venous blood measured by automated haematology analyzer in Chinese adults. Zhonghua Yi Xue Za Zhi 2003, 3, 1201–1205. [Google Scholar]
  45. Vagge, A.; Senni, C.; Bernabei, F.; Pellegrini, M.; Scorcia, V.; Traverso, C.E.; Giannaccare, G. Therapeutic Effects of Lactoferrin in Ocular Diseases: From Dry Eye Disease to Infections. Int. J. Mol. Sci. 2020, 21, 6668. [Google Scholar] [CrossRef] [PubMed]
  46. Li, X.; Kang, B.; Eom, Y.; Lee, H.K.; Kim, H.M.; Song, J.S. The Protective Effect of an Eye Wash Solution on the Ocular Surface Damage Induced by Airborne Carbon Black Exposure. Cornea 2020, 39, 1040–1047. [Google Scholar] [CrossRef] [PubMed]
Figure 1. The flow chart of cases and controls selection.
Atmosphere 13 02003 g001
Figure 2. Air pollution concentrations (μg/m3) and humidity (%) in the six cities of Liaoning, China, from 2012 to 2014.
Atmosphere 13 02003 g002
Figure 3. The forest diagram of adjusted odds ratio of PM10 (26 μg/m3 increase), NO2 (10 μg/m3 increase) or humidity (15% increase) on dry eye disease, stratified by significant covariates.
Atmosphere 13 02003 g003
Table 1. Baseline characteristics of taxi drivers included (n = 7611) and not included (n = 1147).
Baseline CharacteristicsIncluded n (%)Not Included n (%)p-Value
Male sex7276 (95.6)1092 (95.2)0.92
Day-time drivers4156 (54.6)617 (53.8)0.78
<CNY 5000/month5480 (72.0)848 (73.9)0.80
≧10 h/day4353 (57.2)630 (54.9)0.53
Smoking6667 (87.6)1015 (88.5)0.98
Alcohol4818 (63.3)760 (66.3)0.83
Allergic tendencies *2658 (35.1)413 (37.6)0.89
Obesity4346 (57.1)650 (56.7)0.59
Iron deficiency anemia2679 (35.2)414 (36.1)0.77
Hypertension3889 (51.1)571 (49.8)0.65
Hypercholesterolemia2839 (37.3)472 (41.2)0.70
Hypertriglyceridemia3311 (43.5)535 (46.6)0.72
High blood sugar1659 (21.8)221 (19.3)0.42
Self-employed571 (7.5)83 (7.2)0.97
Education (college)175 (2.3)7 (0.6)0.50
Stress (occupation and family) *6439 (84.6)1000 (87.2)0.90
* Total numbers were not equal to 7611 and 1147 for these characteristics due to missing data.
Table 2. Characteristics of taxi drivers with or without DED (n = 5708).
CharacteristicsCases (n = 1905),
n (%) or Mean ± SD
Controls (n = 3803),
n (%) or Mean ± SD
p-Value
Sex 0.940
Males
Females
1822 (95.6)
83 (4.4)
3636 (95.6)
167 (4.4)
Age 0.948
21–30446 (23.4)887 (23.3)
31–40882 (46.3)1740 (45.8)
41–50577 (30.3)1176 (30.9)
BMI 0.213
<18.5130 (6.8)422 (11.1)
18.5~23.9689 (36.2)1213 (31.9)
24~1086 (57.0)2168 (56.9)
Shift drivers 0.033
Day-time1128 (59.2)1871 (49.2)
Night-time777 (40.8)1932 (50.8)
Myopia 0.904
No1775 (93.2)3567 (93.8)
Yes130 (6.8)236 (6.2)
CNY/month 0.500
<50001393 (73.1)2722 (71.6)
5000~8000396 (20.8)757 (19.9)
8000~116 (6.1)324 (8.5)
Working h/day
8~10853 (45.8)1468 (38.6)0.206
≥101052 (55.2)2335 (61.4)
Smoking
Never236 (12.8)354 (9.3)0.236
Former1667 (23.7)3449 (26.3)
Current1667 (63.5)3449 (64.4)
Alcohol 0.320
No607 (31.9)1373 (36.1)
Yes1296 (68.1)2430 (63.9)
Allergic tendencies 0.011
No1090 (57.3)2578 (67.8)
Yes813 (42.7)1225 (32.2)
Hypertension 0.514
No942 (49.5)1784 (46.9)
Yes961 (50.5)2019 (53.1)
Hypercholesterolemia 0.143
No1106 (58.1)2426 (63.8)
Yes798 (41.9)1377 (36.2)
Hypertriglyceridemia 0.069
No961 (50.5)2232 (58.7)
Yes942 (49.5)1571 (41.3)
High blood sugar 0.276
No
Yes
1448 (76.1)
455 (23.9)
3039 (79.9)
764 (20.1)
Self-employed 0.026
No
Yes
1821 (95.7)
82 (4.3)
3442 (90.5)
361 (9.5)
Education 0.151
≤High school1869 (98.2)3712 (97.6)
College34 (1.8)91 (2.4)
Stress events (occupation and family)
during the 2 years a
0.000
No183 (9.6)870 (22.9)
Yes1720 (90.4)2932 (77.1)
Ln-Lf (mg/mL)b0.41 (0.39–0.43)0.69 (0.67–0.71)0.000
OSDI score9.11 ± 8.058.40 ± 12.110.206
CFS1.06 ± 0.980.98 ± 0.420.152
TBUT (sec)2.65 ± 1.944.51 ± 2.360.021
Schirmer’s test (mm/5 min)12.10 ± 7.6610.85 ± 7.090.089
Hb (g/L)
Male116 ± 12119 ± 130.081
Female105 ± 11110 ± 120.069
a Includes decrease in income, severe traffic penalties, separation/divorce, offspring, loss of school or job, serious health problems, or death of family member or close relative. b Values are presented as median (Q1–Q3). OSDI = Ocular Surface Disease Index, CFS = corneal fluorescein staining, TBUT = tear break-up time.
Table 3. Adjusted ORs (95% CI) for DED associated with an IQR increase of air pollutants and humidity.
Single aMulti b
PM2.51.01 (0.98, 1.02)---
PM101.32 (1.15, 1.70) *1.33 (1.07, 1.90) *
O30.98 (0.78, 1.19)0.95 (0.76, 1.21)
SO21.10 (0.63, 1.81)1.08 (0.54, 1.72)
NO22.61 (1.67, 3.56) *2.64 (1.30, 4.37) *
CO1.08 (0.78, 1.82)1.04 (0.62, 2.16)
Humidity0.44 (0.54, 0.34) *0.40 (0.83, 0.27) *
OR (95% CI) was estimated for an IQR increase in PM2.5, PM10, O3, SO2, NO2, CO and humidity. * p < 0.05. a Single-pollutant model: adjustment for all the potential covariates in Table 4. b Multi-pollutant model: PM10 + O3 + SO2 + NO2 + CO + humidity. Further adjustment for the effects of the other air pollutants on the base of single-pollutant model.
Table 4. Association (adjusted β and 95% CI) between ln (Lf) (mg/mL) and PM10, NO2 or humidity for stress (no/yes).
QuartileNOStress
With DED (n = 183)Without DED (n = 870)With DED (n = 1720)Without DED (n = 2932)
β (95% CI)R2β (95% CI)R2β (95% CI)R2β (95% CI)R2
PM101ReferenceReferenceReferenceReference
20.113 (−0.398, 0.571)0.11−0.174 (−0.371, 0.123)0.20−0.512 (−1.065, −0.041)0.31−0.365 (−0.779, 0.051)0.27
3−0.255 (−0.248, 0.770)0.19−0.300 (−0.693, 0.013)0.23−0.531 (−0.978, 0.086)0.41−0.538 (−1.163, 0.128)0.48
4−0.315 (−0.642, −0.140)0.14−0.329 (−0.756, 0.105)0.09−0.912 (−1.374, −0.413)0.590.586 (−0.888, −0.300)0.33
NO21ReferenceReferenceReferenceReference
20.020 (−0.654, 0.693)0.02−0.030 (−0.800, 0.737)0.02−0.445 (−0.744, −0.151)0.29−0.086 (−0.400, 0.261)0.06
3−0.049 (−0.673, 0.579)0.09−0.301 (−0.802, 0.198)0.14−0.495 (−1.089, −0.094)0.30−0.131 (−0.994, 0.720)0.12
4−0.451 (−0.920, 0.020)0.30−0.525 (−0.997, −0.049)0.39−0.668 (−1.141, −0.199)0.49−0.329 (−0.613, −0.039)0.15
Humidity1ReferenceReferenceReferenceReference
20.288 (−0.419, 0.994)0.120.616 (−0.344, 1.561)0.481.309 (0.095, 2.507)0.620.139 (−0.142, 0.416)0.11
30.777 (−0.207, 1.772)0.520.971 (0.507, 1.430)0.421.373 (−0.036, 2.626)0.800.616 (−0.432, 1.724)0.49
41.070 (−0.148, 2.159)0.761.897 (0.494, 3.020)0.841.994 (1.572, 2.303)0.921.734 (0.872, 2.659)0.82
Values with p < 0.05 are indicated in bold, underlined text. R2: Coefficients of determination; adjusted for all the potential covariates in Table 4 including BMI, chronic diseases, allergies, smoking, drinking, eye surface status, education, income, business style, work intensity, and family pressure. Contrast with taxi drivers exposed to level 1 (PM10, NO2 or humidity) to level 2, 3 or 4 (2 vs. 1; 3 vs. 1; 4 vs. 1). 1 = below the 25th percentile; 2 = between the 25th and 50th percentiles; 3 = between the 50th and 75th percentiles; 4 = above the 75th percentile.
Table 5. Association (adjusted β and 95% CI) between ln (Lf) (mg/mL) and PM10, NO2 or humidity for allergies (no/yes).
QuartileNoAllergic tendencies
With DED (n = 1090)Without DED (n = 2578)With DED (n = 813)Without DED (n = 1225)
β (95% CI)R2β (95% CI)R2β (95% CI)R2β (95% CI)R2
PM101ReferenceReferenceReferenceReference
20.010 (−0.277, 0.288)0.05−0.083 (−0.580, 0.412)0.09−0.240 (−0.457, 0.028)0.17−0.223 (−0.562, 0.117)0.17
3−0.068 (−0.327, 0.252)0.10−0.117 (−0.377, 0.236)0.11−0.489 (−0.761, −0.244)0.31−0.588 (−0.613, −0.072)0.16
4−0.148 (−0.316, 0.032)0.16−0.140 (−0.355, 0.024)0.16−0.751 (−1.597, 0.094)0.46−0.615 (−1.075, 0.157)0.37
NO21ReferenceReferenceReferenceReference
2−0.174 (−0.448, 0.109)0.03−0.207 (−0.441, 0.058)0.10−0.336 (−0.616, −0.040)0.20−0.199 (−0.654, 0.288)0.19
3−0.432 (−0.551, 0.015)0.06−0.382 (−0.863, −0.164)0.29−0.582 (−0.856, −0.230)0.34−0.446 (−0.715, −0.204)0.29
4−0.454 (−0.978, 0.049)0.09−0.551 (−0.984, 0.012)0.33−0.658 (−1.243, 0.046)0.42−0.507 (−1.102, 0.062)0.39
Humidity1ReferenceReferenceReferenceReference
20.486 (−0.157, 0.921)0.320.583 (−0.096, 1.055)0.491.054 (0.157, 1.956)0.590.751 (−0.020, 1.375)0.50
30.755 (−0.045, 1.533)0.510.721 (−0.065, 1.420)0.531.404 (−0.217, 2.977)0.721.073 (−0.193, 2.212)0.66
40.994 (−0.051, 1.926)0.611.204 (0.020, 2.408)0.711.470 (0.247, 2.619)0.741.109 (0.329, 1.859)0.62
Values with p < 0.05 are indicated in bold, underlined text. R2: Coefficients of determination; adjusted for all the potential covariates in Table 4 including BMI, chronic diseases, allergies, smoking, drinking, eye surface status, education, income, business style, work intensity, and family pressure. Contrast with taxi drivers exposed to level 1 (PM10, NO2 or humidity) to level 2, 3 or 4 (2 vs. 1; 3 vs. 1; 4 vs. 1). 1 = below the 25th percentile; 2 = between the 25th and 50th percentiles; 3 = between the 50th and 75th percentiles; 4 = above the 75th percentile.
Publisher’s Note: MDPI stays neutral with regard to jurisdictional claims in published maps and institutional affiliations.

