Article

Outdoor Microplastic Analysis Using Inlet Filters from an NOx Regulatory Air Quality Monitoring Device

1
Hull York Medical School, University of Hull, Kingston upon Hull HU6 7RX, UK
2
School of Natural Sciences, University of Hull, Kingston upon Hull HU6 7RX, UK
3
School of Computer Sciences, University of Hull, Kingston upon Hull HU6 7RX, UK
4
Hull City Council, Air Quality Officer, Environmental Regulation, 33, Witham, Kingston upon Hull HU9 1DB, UK
*
Author to whom correspondence should be addressed.
Atmosphere 2022, 13(12), 2017; https://doi.org/10.3390/atmos13122017
Submission received: 27 October 2022 / Revised: 24 November 2022 / Accepted: 28 November 2022 / Published: 30 November 2022

Abstract

:
Atmospheric microplastics (MPs) are a ubiquitous environmental contaminant of emerging concern. Sampling methods provide information relating to surface area concentration and MP characteristics, without direct comparison with routinely measured standard air quality parameters. This study analysed 6 active air samples generated by a local authority as part of their routine air quality monitoring activities. Continuous sampling totalled 10 months, within the city centre of Kingston-upon-Hull. By using μFTIR analysis, levels of total particles detected using the NOx inlet filters ranged from 5139 ± 2843 particles m−2 day−1, comprising 1029 ± 594 MPs m−2 day−1. The controls displayed a mean level of 2.00 ± 3.49 MPs. The polymers nylon (32%) and polypropylene, PP (22%) were the most abundant. Small fragments of 47.42 ± 48.57 μm (length) and 21.75 ± 13.62 μm (width) were most common. An increase in MP levels during April 2020 coincided with an increase in PM10 levels. This study used robust procedures to measure MPs in the air by exploiting existing air quality monitoring equipment. Knowing the levels, types, and characteristics of MPs can inform toxicity studies to provide more environmentally relevant exposures, which is urgent now that MPs have been reported in human lung tissue.

1. Introduction

Microplastics (MPs) are small synthetic plastic particles <5 mm in size [1]. They have been observed within all environmental compartments: aquatic [2], terrestrial [3] and atmospheric [4]. MPs have also been identified within homes [5,6,7,8,9], drinking water [10] and the human food chain [11,12]. MPs are either primary (or “virgin”) sources direct from manufacturers or secondary sources, having been weathered in the environment or within organisms into partially degraded plastic products [1]. With the identification of MPs within clinical human samples, including lungs, blood, colon and liver [13,14,15,16], concern surrounding human MP exposure is rising. The presence of fine particulate matter (PM) levels in the atmosphere, specifically PM2.5 and PM10, have been associated with poor human health outcomes such as cardiovascular disease in studies worldwide [17,18,19]. Understanding the mechanistic causes is undermined by the lack of knowledge on the composition of such fine particulate matter. The likely mechanistic pathways of damage are proposed as inflammation, oxidative stress and metabolic dysfunction [18]. Relevantly, MPs represent one component of the particulate matter and are known to trigger oxidative stress and inflammation pathways in human cell and tissue studies [20].
Investigations into the prevalence of MPs within the air have started to provide knowledge regarding the prevalence and type of MP within different environments, but knowledge gaps still exist. It is apparent that indoor MP concentrations (1000–1500 MP m−2 day−1) [7,8] exceed that of outdoors as follows. Urbanised outdoor locations display high MP levels that range from 10–712 MP m−2 day−1 [21,22,23,24,25,26,27] compared with suburban and rural outdoor levels which range from 53–132 MP m−2 day−1 [23,28]. With the population spending up to 90% of their time indoors, this represents a significant and unavoidable route of exposure for MPs via inhalation [29,30]. While MPs have been widely reported as a constituent of atmospheric fallout and particulate matter, there is still limited knowledge regarding their concentration, polymer type, particle size and shape. There are no universally accepted methods for characterizing MPs or how they are monitored in the atmosphere [1]. There is an emerging guideline on how best to report MP datasets [31]. Studies to date use varied methodological approaches from passive to active sampling and reporting in different units that cannot be cross compared [9,21,22,23,24,25,26,27] and do not relate to breathable volume units used in statutory air quality monitoring. The measurement of MP levels involves equipment and procedures that are discrete and separate from standard air quality measurements.
Additional concerns related to MPs include vectored absorbed pollutants and pathogens plus additive leaching that these atmospheric MPs may contain [32]. Such information is crucial since the levels, size and shape of MPs have been linked to toxicity outcomes in human cell/tissue exposure experiments [20] and selected additives have been linked to endocrine disrupting impacts [33].
There are several techniques that are approved by Defra UK and the EU for measuring particulate matter in a manner that is appropriate for comparison to the Air Quality Objectives (AQO) [34,35]. In Hull, the technique applied is described as a Tapered Element Oscillating Microbalance (TEOM). The TEOM uses a hollow glass tube as a microbalance. Incoming particles are deposited on a filter at the tip of the tube, and the added mass causes a change in its oscillation frequency which is detected electronically [36]. The element is periodically cycled to return it to its natural frequency. The inlet to the device only allows particles of the desired size range to enter. TEOM devices operate continuously and do not need filter changes as frequently as high-volume air samplers. Due to the complex and non-homogenous nature of particulates, the AQO relates to the size fraction of the particles rather than speciation, which means that a direct comparison to MPs is problematic. Chemiluminescence is the preferred measurement technique for nitrogen dioxide, where in a controlled chamber, nitric oxides react with ozone to give nitrogen dioxide in a reaction that generates light. The intensity of light emitted is proportional to the mass flowrate of nitric oxide (NO) into the reaction chamber and can be measured with high sensitivity using a photomultiplier tube. This represents the basis for a sensitive, quantitative analysis of gaseous NO, with nitrogen dioxide (NO2) being derived by subtracting the NO from the total NOx. Relevantly, within this equipment there is also a filter at the entrance of the inlet value. These filters are replaced as part of the routine maintenance and, as such, represent a novel opportunity as a surface to collect particulates present at the same time as standard air quality standards being routinely measured.
This study aims to identify and characterise MP particles present on inlet filters taken from NOx analysers, while also accounting for procedural and laboratory blank contamination. Any particles isolated from inlet filters have been chemically characterised using μFTIR spectroscopy. The approach determines whether a comparison with standard air quality measurements, taken at the same time, can be employed.

2. Material and Methods

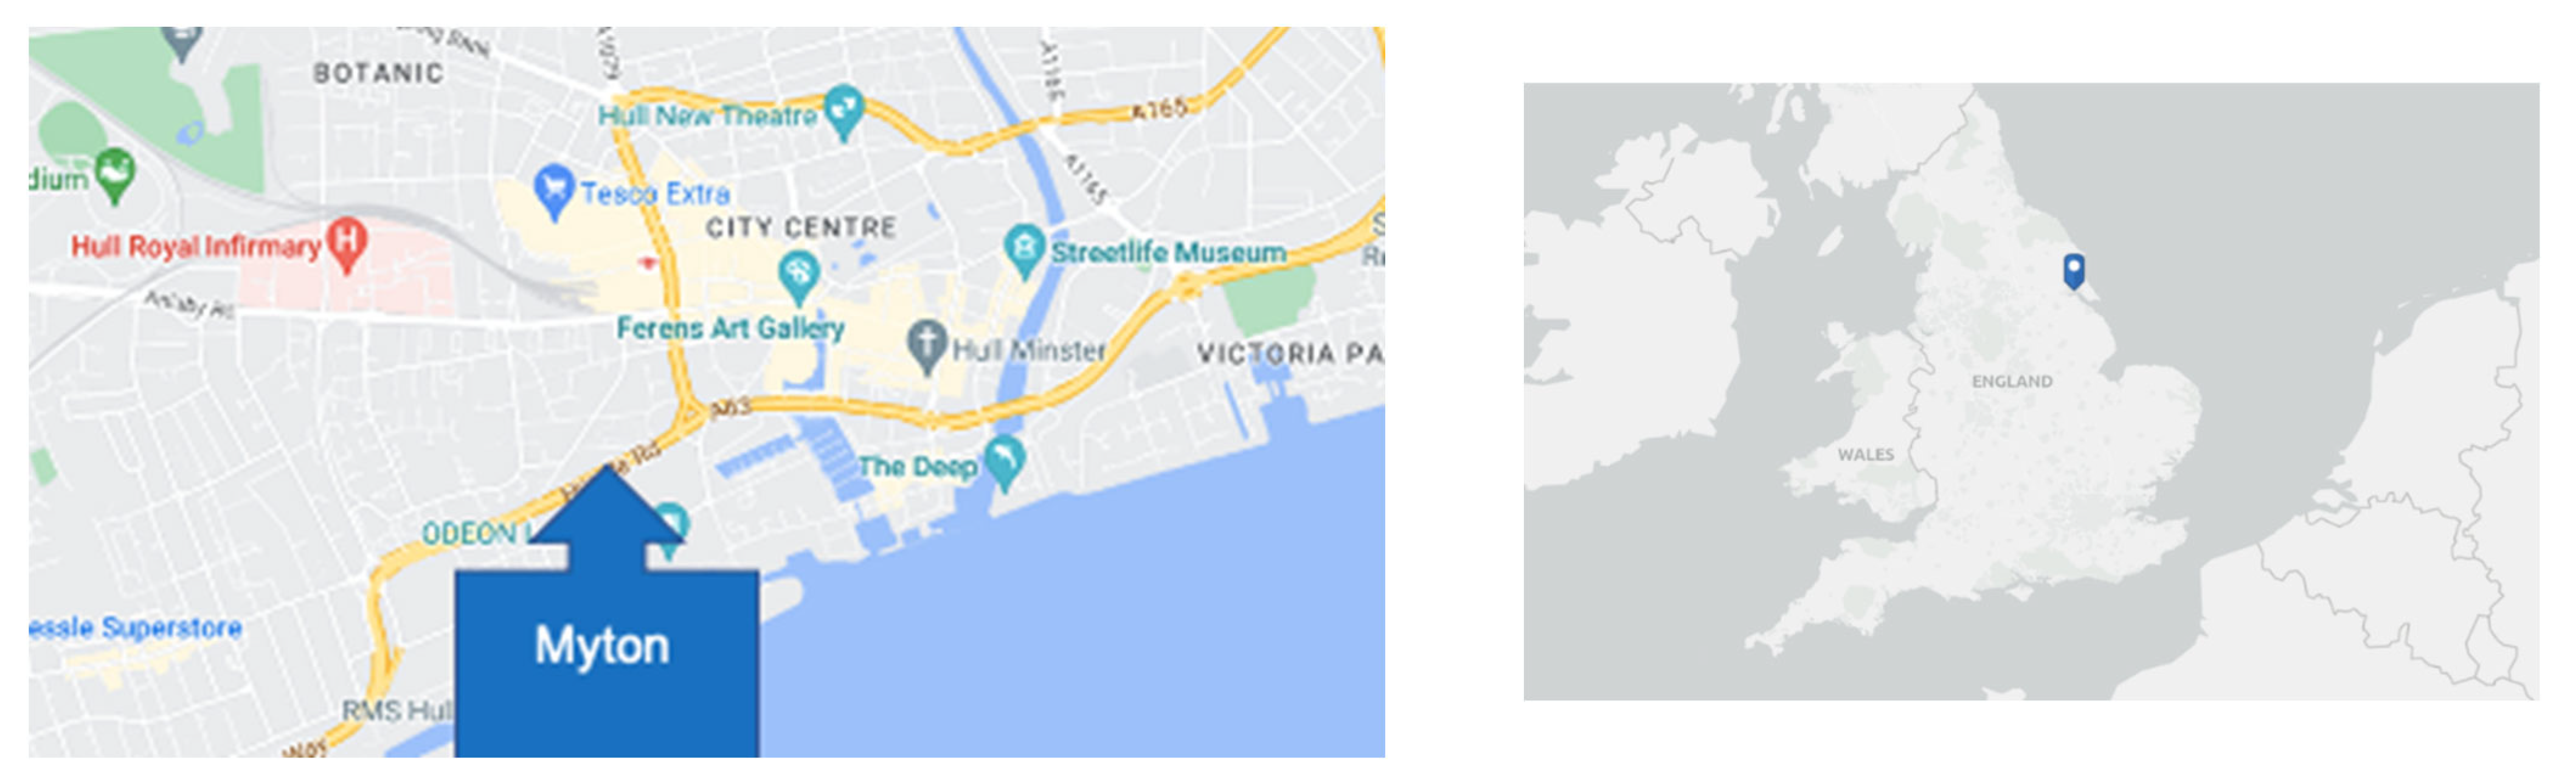
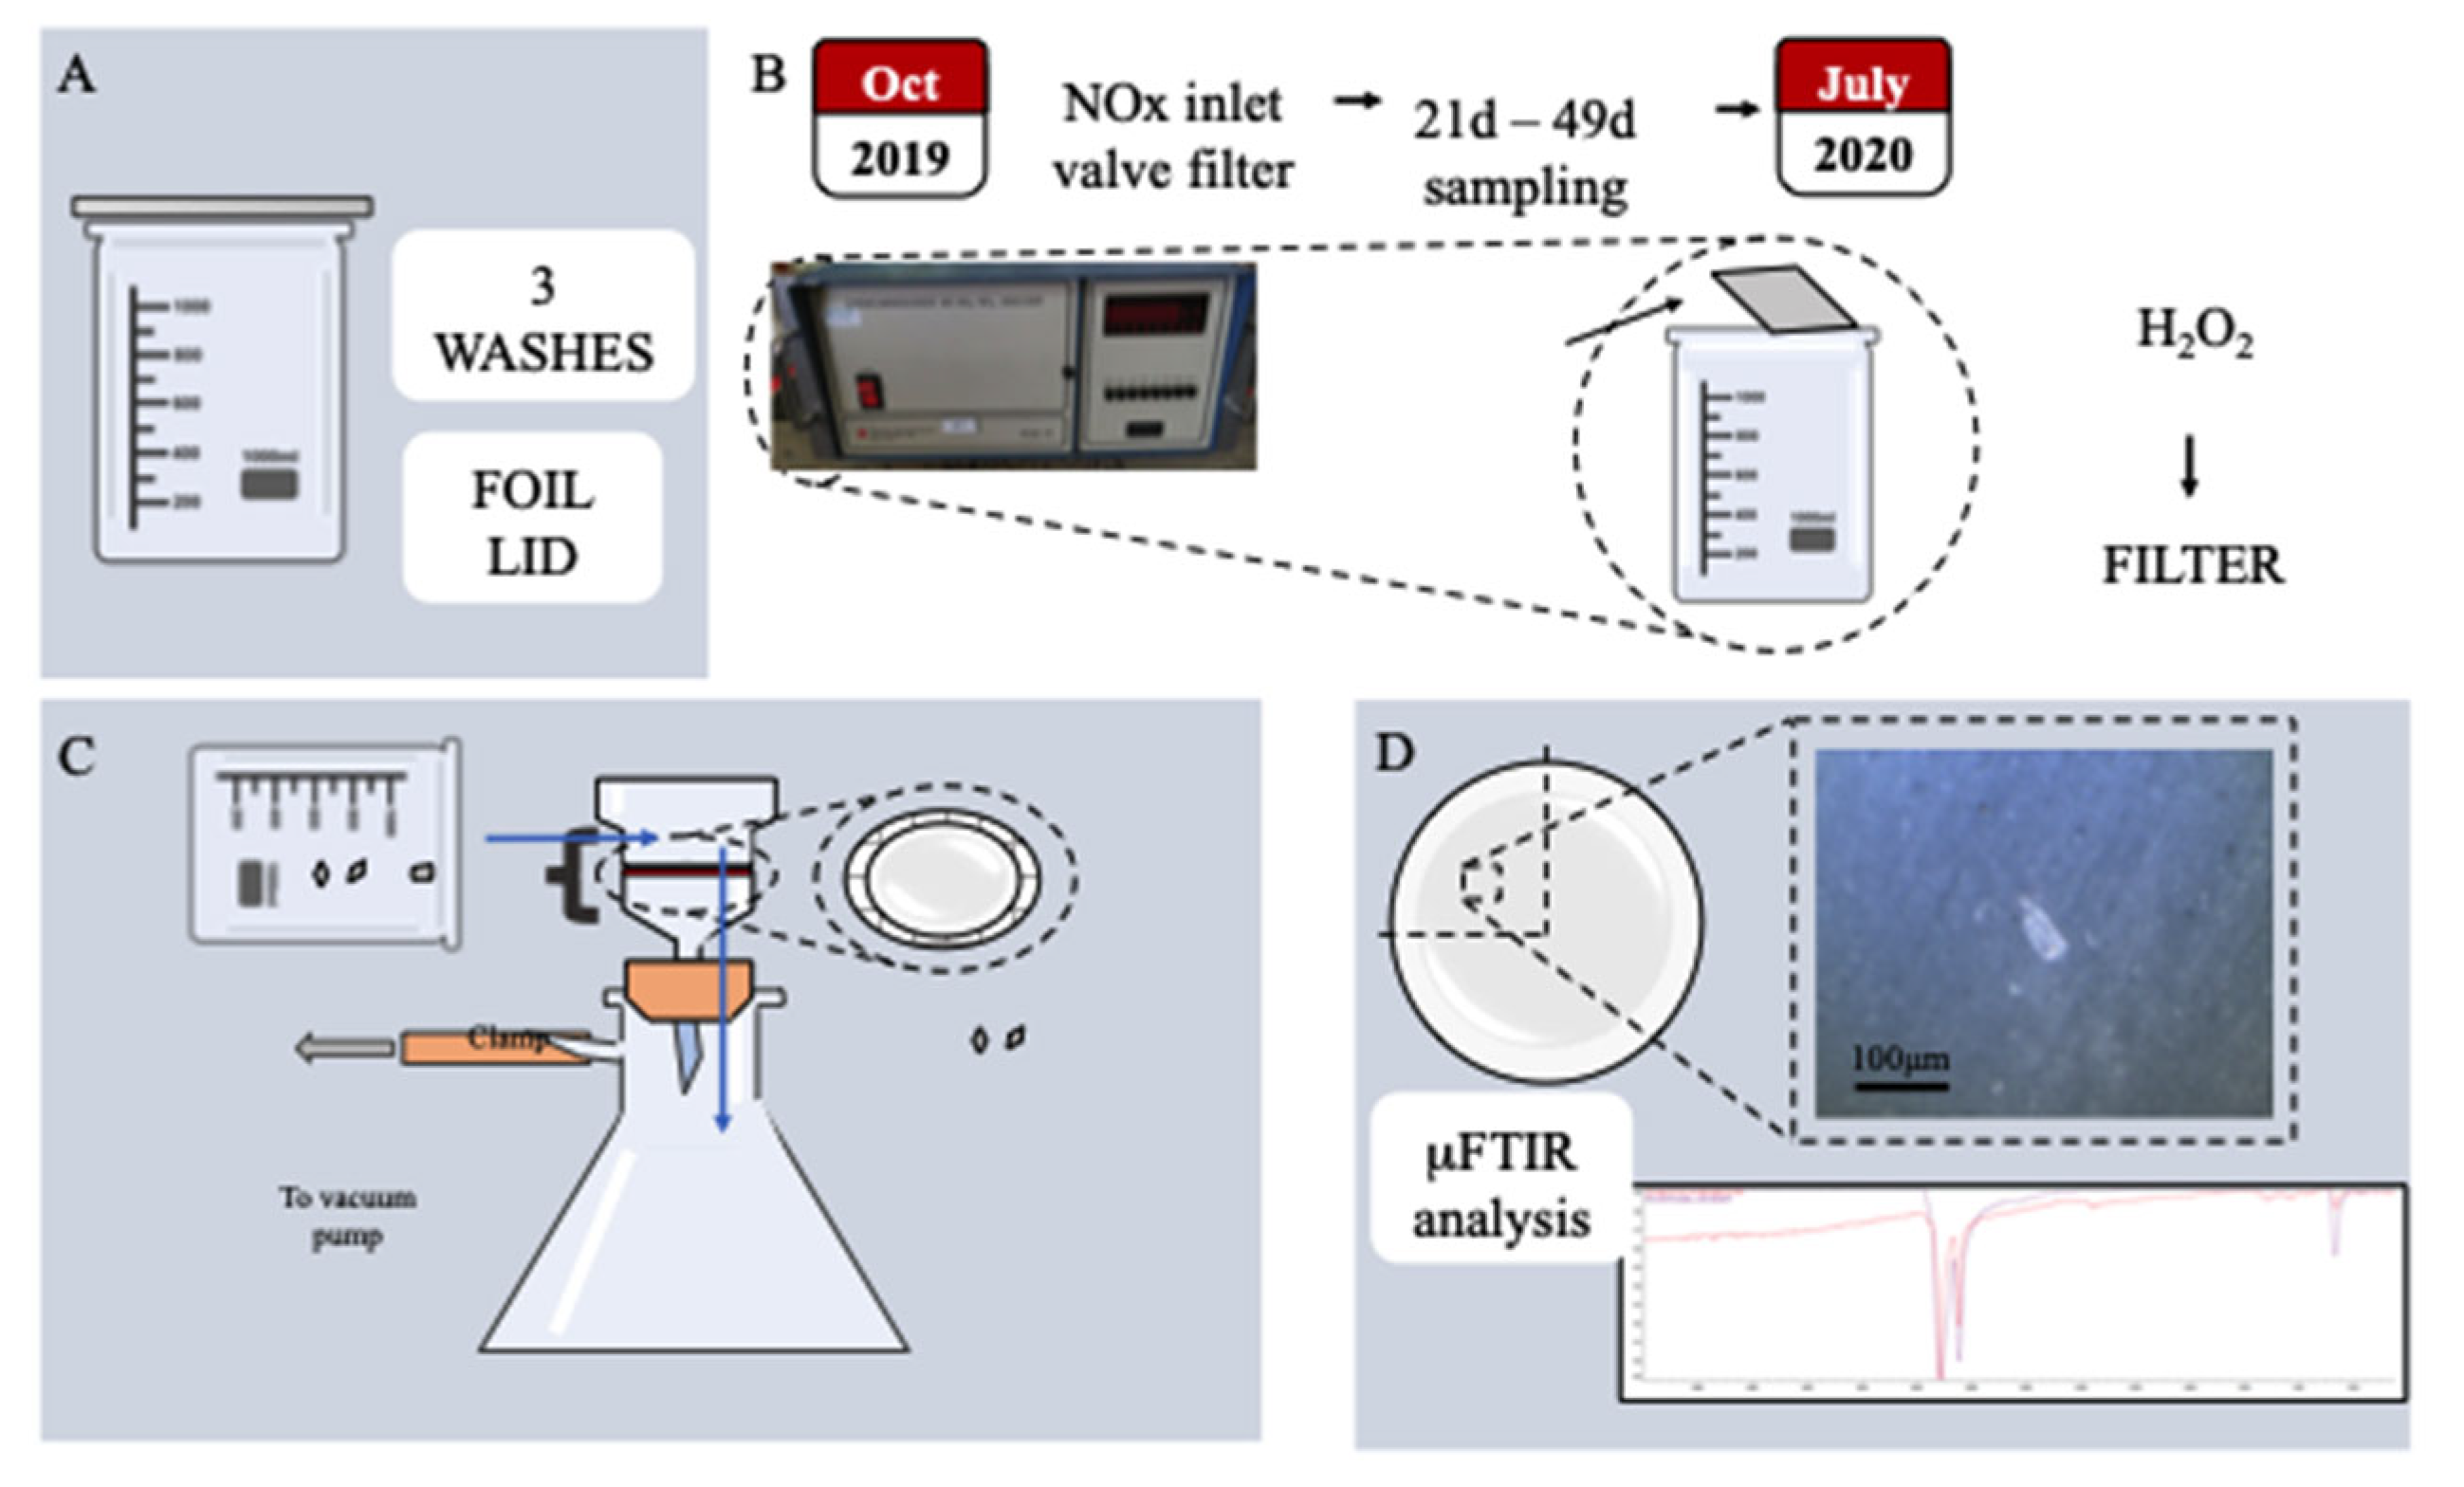
2.1. Active Air Sampling

Inlet particulate filters (paper, 47 mm diameter, 5 μm size cut off), removed from a NOx Chemiluminescence Analyzer (Model ML9841B, Monitor Labs Inc., Engelwood, CO, USA), were provided by Hull City Council (HCC). The sampling unit, alongside a TEOM device, was used to continuously sample the air within the city of Kingston-upon-Hull (OS ref 509068 428270) (Figure 1) as part of the local authority’s statutory regulation monitoring activities for nitrogen oxides (NO, NO2 and NOx) and inhalable particulate matter (PM2.5 and PM10). The monitoring station is within a self-contained, air-conditioned housing located on the southern edge of a car park, which is situated on the south-western edge of the city centre. The nearest urban road is approximately 30 m south of the monitoring station and has a 12-h traffic flow of approximately 30,000 vehicles. Immediately to the south is a grassed area, to the north is a car park, with office buildings to the west. The manifold is approximately 3 m above ground level. Air flows from an inlet (at approx. 1 m height) in which particulate matter deposits onto a filter (supplied by Enviro Technology Service Ltd. Kingfisher Business Park, London Road, Stroud, UK). Each filter represented a continuous sample for approximately one month (21–49 days) at an air flow rate of 0.64 standard litres per minute (slpm) (Figure 2). Sampling was conducted from October 2019 to July 2020, a total of 10 months (Table 1). After each sampling period, the sample filter was placed into a petri dish by the air quality monitoring officer and transported to the laboratory. Two field blanks were conducted to quantify any MP contamination during the filter replacement process.

2.2. Quality Assurance and Control Measures

Monitoring for contamination during air sampling, sample preparation and analysis was carried out using field (n = 2), procedural (n = 6) and laboratory blanks (n = 6). A blank Anodisc filter was opened for the same duration as the sample filter being removed from the air monitoring unit and placed within a petri dish. This was conducted on two separate months, ensuring each field blank represented the environment within the sampling unit in which the air quality monitoring officer was the only one present. Procedural blanks mimicked the entire sample preparation steps in which a blank filter was placed into a clean conical flask, along with 200 mL of H2O2 and digested within a shaking incubator under identical conditions, before vacuum filtration. Laboratory blank filters were exposed to the same environment as the filter under μFTIR analysis, by opening the petri dish for the same time as the sample. All field, procedural and laboratory blank results were combined in order to achieve a level of background contamination that could then be used to adjust final sample MP concentration levels using either a subtraction or LOD/LOQ approach.
All reagents used were filtered before use using a glass vacuum filtration kit and glass fibre (GF6) filters (GE Healthcare Life Sciences, Marlborough, MA, USA). All equipment and glassware were hand washed, cleaned in a dishwasher using distilled water, and a final triple rinse using the triple filtered H2O. Plastic equipment was avoided, cotton laboratory coats used, and a fume cupboard turned ‘off’ to reduce air flow. Aluminium foil lids were placed around glassware openings and a small opening used to pour. In order to avoid sample particle loss, each vessel was triple rinsed during the transfer of samples, washing the sides of the glassware. In addition, the cut sample filters were observed under an Olympus SZX10 Stereo Microscope (Olympus Corporation, Tokyo, Japan) to confirm that no particles were visible. In order to ensure no particles were being introduced from the commercial Anodisc filters used, 3 random Anodisc filters were observed under the μFTIR in which no particles were identified. All sample preparations and analyses were conducted by a single researcher to ensure standardisation. Laboratory preparation and μFTIR analysis were conducted at times of low activity with no room ventilation or windows. Finally, samples were analysed ‘blind’ by labelling each filter with an anonymous code.

2.3. Sample-Preparation

Each sample filter taken from the NOx inlet valve (n = 6) was stored in the dark at room temperature until analysis. Procedural blanks (n = 6) and field blanks (n = 2) were run alongside sample preparation, mimicking every processing step. Sample inlet valve filters were sectioned and cut in half using clean stainless-steel scissors. Each half was placed inside a clean conical flask with an aluminium foil lid. 200 mL of pre-filtered 30% hydrogen peroxide (H2O2) was added to each flask and re-sealed with a foil lid. The digest approach has been optimised [27] to promote removal of organic particles while maintaining the integrity of plastic particles [37]. Flasks were placed in a shaking incubator for 10 days (55 °C, 65 rpm). Flasks containing the digestion solution and cut filters were removed from the shaking incubator and filtered using an all-glass vacuum filtration kit. The cut inlet valve filters were removed from the digestion solution and rinsed with water to ensure adhered particles were within the digestion solution. The digestion solution was then filtered onto a second filter comprised of aluminium oxide (called Anodisc), with 47 mm diameter and 0.2 μm pore size (MERCK, Gillingham, UK). The Anodisc filter has a specific use in μFTIR spectroscopy. These Anodisc filters were stored and dried in sealed petri dishes, in the dark at room temperature.

2.4. μFTIR Analysis

Each Anodisc filter was placed on the μFTIR spectroscopy platform for particle characterisation. A laboratory blank filter (n = 6) was opened alongside every sample filter. The entirety of the surface areas of the filters were analysed. The length (largest value) and width (second largest value) was recorded for every particle using the aperture height, width and angle size selection tool, a visual imaging tool available within the ThermoScientific Omnic Picta Nicolet iN10 microscopy software. The particle size selection tool maximum dimension was 300 μm and therefore particle dimensions greater than this were recorded as >300 μm. Particles with a length to width ratio >3 were categorised as fibres. After each particle characterisation, polymer chemical composition analysis was immediately conducted. μFTIR analysis was conducted in transmission mode without any additional accessories or crystals (Nicolet iN10, ThermoFisher, Waltham, MA, USA), with a liquid nitrogen cooling system. The cooled MCT detector allowed for analysis of particles accurately to 5 μm in size. The Nicolet iN10 microscope used has a 15 × 0.7 N.A. high efficiency objective and condenser, and a colour CCD digital video camera with an independent reflection and transmission illuminations mounted, for capturing images of particles. This model has a standardised 123× magnification for the aperture settings employed. No observational criteria were applied in selecting particles for analysis in order to prevent bias. Using the aperture size selection tool, any particles on the sample filter >5 μm were included in the analysis process.
For this study, the whole filter, containing the total digested tissue sample from one half NOx inlet filter, was analysed. A background reference spectrum was taken before immediate analysis of every particle. A scan number of 64 and a spectral range of 4000–1250 cm−1 was applied. Spectra were obtained and then compared with a spectral polymer library database (Omnic Picta, Omnic Polymer Libraries). A match index of ≥70% was chosen as a quality threshold to identify the MP polymers. Particles below this match threshold were not included in results.

2.5. Statistical Analysis

It was assumed that an even particle distribution occurred during the filtration process, and that the analysed portion of the filter represented the whole filter, after extrapolation (multiplied by 2). To convert the number of MPs per filter into meter squared, rather that surface area of the NOx inlet filter (47 mm diameter), a correction factor (1/0.001735) was used (Supplementary Materials S1):
MP m−2 day−1 = (MP on whole filter × 576)
Data are presented as mean ± standard deviation. Tests for homogeneity and significance were performed on unadjusted MP values using SPSS. All data were determined not normally distributed with a Shapiro-Wilk test and a Kruskal-Wallis test applied. There are currently no standardised methods for calculating MP concentrations available, herein three are used: unadjusted, mean of the procedural blank values, regardless of polymer type, subtracted, and an LOD/LOQ method [38]. The background contamination detected during the field, procedural and laboratory blanks were combined to give an overall value of likely contamination for each polymer type. It was not possible to test for a relationship between rainfall and particle fallout, or with traditional air quality measures because the NOx inlet filters spanned several, variable, week timepoints. A significance of p = 0.05 was applied and extreme significance of p = 0.005.

3. Results

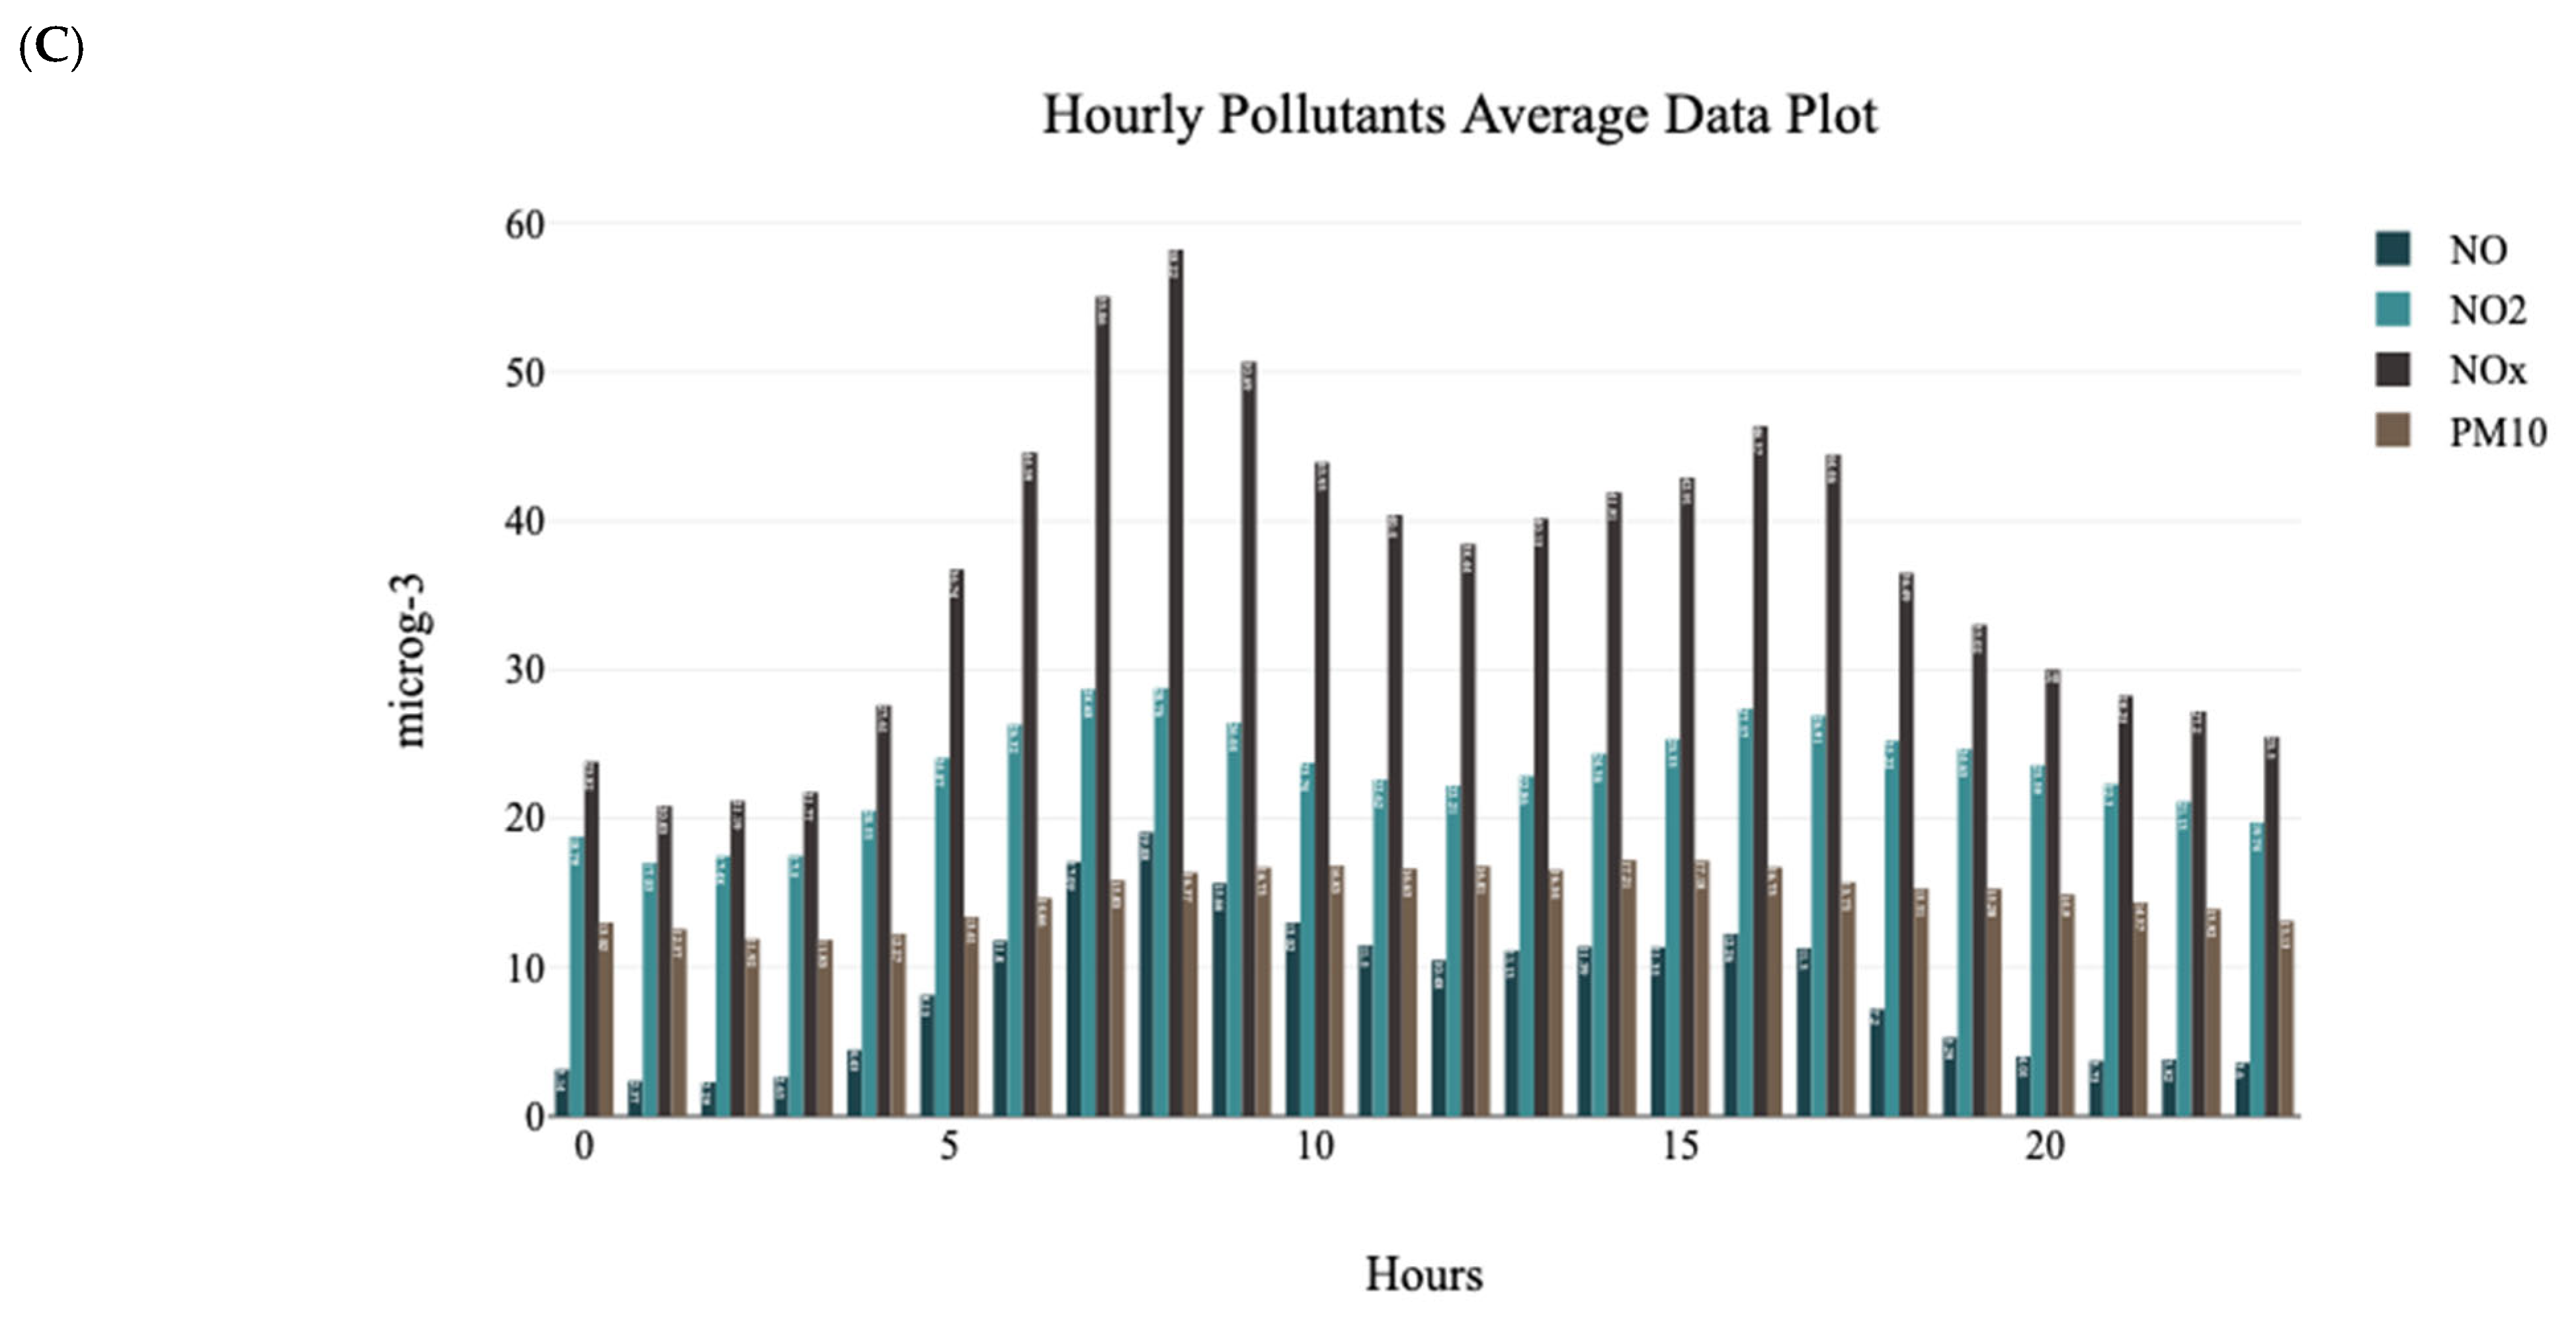
3.1. Temporal Variation in the Atmospheric MP Levels at the Roadside ‘A63’ Sampling Site

A total of 844 particles (with a match >70%) on 6 NOx inlet (half) filters, of which 216 (26%) were identified as MPs. MPs were identified within all samples from the sampling site (A63) (n = 6 samples spanning 22 October 2019 to 29 July 2020) (Table 1; Figure 3). The mean levels of all particles on the NOx inlet filters were 5139 ± 2843 particles m−2 day−1 (ranging from 2995–10,203), comprising 1029 ± 594 MPs m−2 day−1 (ranging from 306–1975). For comparison, the combined controls, comprised of 6 procedural blanks, 2 field blanks and 6 laboratory blanks (n = 14 blank samples in total) displayed a mean level of 2.00 ± 3.49 MPs per sample.

3.2. Background MP Contamination Adjustments

Using adjustments, to account for the blank contamination levels detected, decreases the level of MPs identified within NOx inlet filter samples depending on the approach used (Table 1). After blank subtraction adjustments, the total MPs identified within NOx filter samples have a mean of 1027 ± 591 MP m−2 day−1. After using the LOD/ LOQ adjustment method of calculation (Supplementary Materials S2), the average deposition rate of MPs was reduced to 715 ± 672 MP m−2 day−1 (Table 1; Supplementary Materials Table S1). Two NOx inlet filter samples fit the criteria for using a LOD and LOQ calculation, showing 7.3–57.3 MP m−2 day−1 for nylon (samples 4 and 6), 4–78 MP m−2 day−1 for PP (samples 1 and 4), and 1.9 MP m−2 day−1 for alkyd resin (samples 1 and 4). Three filters fit the criteria for using a LOD and LOQ calculation, showing 11.6–29.6 MP m−2 day−1 for PE (samples 1, 2 and 4). Four filters fit the criteria for using a LOD and LOQ calculation, showing 4–10 MP m−2 day−1 for PS (samples 1, 2, 3 and 4). PVS levels for one filter (sample 2) met the LOD/LOQ thresholds with 2 MP m−2 day−1. PTFE, hydrocarbon resin, PET, PCS, PB, PA, PC and PES levels were above the threshold level of detection in a limited number of filter samples (Supplementary Materials Table S1) but did not meet the threshold for quantification.

3.3. MP Particle Characterisation from NOx Inlet Filters

With respect to MP size ranges, the mean (and SD) values for MP length were 47.42 ± 48.57 μm and width 21.75 ± 13.62 μm which were similar to the combined control mean length 42.96 ± 21.45 μm and width values 24.5 ± 9.59 μm. The most prevalent MP length and width category was 5–100 μm (92% and 100%, respectively). The remaining lengthwise categories of 100–300 μm and >300 μm were 6% and 2%, respectively, whereas 95% of MPs had a width of <50 μm. The overall MP polymer composition of samples detected across the 10-month study at the (A63 roadside site) samples was predominantly nylon (32%) and polypropylene PP (22%), with 14 different polymer types identified (Figure 4A). The predominant MP polymer types in the controls varied from the inlet filter samples with PVAE > nylon > PE > hydrocarbon resin > the remaining polymer types (Figure 4B).

3.4. Relationship with Standard Air Quality Measures

The monthly standard regulatory air quality measures highlight a similar trend between MPs with PM10 and NOx measurements but not for PM2.5, NO or NO2 levels (Figure 5A). For comparison, the monthly and hourly (for one day) standard air quality measures covering the same 13-month sampling period are provided (Figure 5B,C).
The monthly average air pollution (NO, NO2, NOx and PM10) data from October 2019 to July 2020 highlights air quality concentrations decrease from March 2020 (Figure 5B) in comparison to earlier sampling months, coinciding with the COVID-19 lockdown imposed by the UK government. The hourly data (Figure 5C) show that the air quality concentrations start increasing from 5 am morning time and 2 pm afternoon time. There has been a peak in pollution levels at 8 am and 4 pm (Figure 5C).

4. Discussion

Using NOx inlet filters as a MP sampling approach, a total of 844 particles were identified, of which 216 (26%) were identified as MPs. Furthermore, MPs were identified within all samples from the sampling site (a city centre main trunk road location, the ‘A63’) which consisted of n = 6 samples spanning 22 October 2019 to 29 July 2020) (Table 1; Figure 3). The mean levels of all particles on the NOx inlet filters were 5139 ± 2843 particles m−2 day−1 (ranging from 2995–10,203), comprising 1029 ± 594 MPs m−2 day−1 (ranging from 306–1975). For comparison, the combined controls, comprised of 6 procedural blanks, 2 field blanks and 6 laboratory blanks (n = 14 blank samples in total) displayed a mean level of 2.00 ± 3.49 MPs per sample. In previously published work [27], using a passive rain sampler technique at the same sampling site, spanning the same dates, MPs were also identified within all samples collected, with an average deposition rate for all particles was significantly higher at 11,278 ± 15,025 particles m−2 day−1 (and with a greater range from 1429–57,471). After LOD/ LOQ adjustments, the average deposition rate of MPs was 715 ± 672 MP m−2 day−1 using the NOx inlet filter approach, compared with 3055 ± 5072 MP m−2 day−1 using the rain sampler approach [27]. The two different approaches to measuring MPs therefore result in different MP values in terms of levels, indicating that method of sampling affects the data and conclusions obtained. What causes these differences in levels using these two approaches, and what factors influence each, requires further investigation. Using the LOD/LOQ approach removes the MP polymer data for which there are either similar polymer types detected in the control samples or where very few of a certain polymer type are detected, increasing the robustness, though also potentially losing information, of any conclusions drawn.
While the MP levels differ between the passive rain sampling and NOx inlet filter approaches, the latter has the advantage that the data can be directly related to the NOx and PM values at the same site and sampling times (Figure 4A). The NOx inlet filters were collected during routine maintenance visits (and under the challenges of the COVID-19 pandemic) rather than at regular dates, preventing a statistical analysis to establish any correlation relationships in this instance. Future sampling using the approach would ideally involve a regular change and collection of the NOx filters prior to analysis. Despite the irregular sampling durations, the data do highlight a similar trend between the MP, PM2.5 and PM10 levels adding credibility to the utility of this approach to sampling. One disadvantage to the standardised PM measurements is that they do not include a compositional characterisation of all the chemicals present and potentially many (such as black carbon) are hazardous to health. Based on the evidence presented herein, specific size range MP particles clearly also represent a fraction of the PM. No other study has, to date, attempted to sample MPs alongside standard air quality measures using the same equipment, despite the recent findings that MPs are known to toxic, in terms of inflammation and oxidative stress responses, in human cell toxicity studies reviewed in [20].
The difference in MP levels observed using the NOx inlet filter and passive rain samplers is also observed as parallel differences in the MP characteristics (size, shape, polymer type) as follows. For MP size ranges, the mean (and SD) values for MP length were 47.42 ± 48.57 μm and width 21.75 ± 13.62 μm representing fragments rather than fibre shapes. Using the passive rain sampling method [27] similarly sized smaller particles (5–250 μm) were most abundant, yet fibrous particles were by far the most abundant (90%). Other studies variously report more fibres (with a range from 67–90% [7,22,26,38,39], while others report more fragments [6,23,40,41]. Determining the size characteristics are important in terms of identifying, and then utilising in toxicity studies, particle representative types most likely to enter the human body and cause physiological harm.
Nylon and PP were the most abundant MP polymer types detected on the NOx inlet filters, accounting for more than half those detected. This differs from the passive rain sampling method where PE was the most abundant polymer type [27] and to other atmospheric studies whereby PE is most frequently observed polymer [22,23,28]. The most abundant MP detected may relate to their different densities and the method of sampling. Nylon and PP have densities of 1.14 and ~0.90 g/m3, PE has a density of ~1.00 g/m3. Such density characteristics are therefore not likely influencing MP capture with different sampling approaches. A total of 16 polymer types have been identified using the NOx inlet filters which is significantly more diversity of polymer type, as well as different predominant polymer type, relative to previous reports in other European outdoor studies: an urban London sampling site reported a high abundance of polyacrylonitrile, PAN, fibres (712 ± 162 MP m−2 day−1) [24], an Irish study reported predominantly PET fibres of 100 MP fibres m−2 day−1 [42], yet the NOx filter sampling method detected no PAN and a small number of PET particles (Figure 4A). Nylon possible sources are degraded textiles, and the polymer has already been highlighted as hazardous for inhalation at industrial levels of exposure [30]. The second most abundant polymer type PP is likely from a wider variety of sources such as packaging, textiles, medical equipment, housewares. Interestingly, PP was also the predominant polymer identified in human lung tissues [13,43].
There are several practical and policy implications of this study that can be discussed. At present, in conjunction with a TEOM analyser measuring particulate matter, the chemiluminescent analyser is used to measure atmospheric concentrations of the oxides of nitrogen for compliance reporting under the Air Quality Standards Regulations 2010 and comparison with the UK National Air Quality Objectives (AQO). These relate to non-occupational, outdoor locations where members of the public are liable to spend a period of time relevant to the AQO in question, i.e., hourly or annual. This perspective is often carried out on modelled concentrations [44]. This has the potential for some inconsistencies when comparing the results as presented relative to the AQO’s to data relating to the numbers of people presenting at medical centres with symptoms for ailments that are attributable to poor air quality. Locally, it has been determined that relative to the AQO’s, Hull has good air quality, but health data show that Hull has a higher-than-average number of people presenting with air quality related symptoms. Variations could be a consequence of indoor or occupational exposure, exposure to chemicals not monitored or some other, as yet undetermined confounding factors. MPs could represent one such chemical group, the are designed to be robust, trigger inflammation responses in laboratory investigations [20]) and, most recently, have been found in human lungs [13,43].
An investigation into indoor air quality, and an assessment of other potential (ambient outdoor) atmospheric causes could help inform future policies and decisions that are aimed at protecting health. This is being carried out in parallel with investigations by the Local Council into other potential reasons, such as deprivation, which could also have relevance to this study. MPs also vector and leach known toxic chemicals, which in an indoor environment, could result in further exposures and/or impacts [6,7,8,9,33].
Collectively, this work outlines the challenges in the current research in that health outcomes do not necessarily correlate with current air quality standard measures. It suggests that future work involve characterisation of the particulate matter composition, especially the particulate components that are known toxic chemicals, such as MPs. Appropriate policy changes should address the lack of ‘cause and effect’ relationship between current air quality standard measurements and the inexplicable health outcomes where such measures are classed as good, with a discussion around the addition of MPs as a potential cause.

5. Conclusions

This MP dataset is novel in the way in which it has been obtained. The routine removal and replacement of NOx inlet filters provided an opportunity to capture and characterise the MPs present, while being able to make direct comparison with the standard air quality data at the same location. The values obtained differed from those obtained using a passive rain sampler approach (at the same location over the same time period) with respect to the MP levels, the most prevalent polymer types and the various shapes detected. MPs can also be suggested to be a component of the PM10 fraction, as evidenced by their levels following a similar temporal trend. MPs are now known to penetrate human lungs, are known to trigger inflammation and oxidative stress in human cell studies, so the argument to add them to regular, routine air quality monitoring plans, using existing equipment, is now compelling.

Supplementary Materials

The following supporting information can be downloaded at: https://www.mdpi.com/article/10.3390/atmos13122017/s1, Method S1: Calculation for NOx filter surface area to meter squared; Method S2: Calculation of LOD/LOQ for each polymer; Table S1: Showing all identified polymers within NOx inlet filter samples and accounting for the same polymer if identified in controls.

Author Contributions

Conceptualization, L.C.J., D.W. and J.M.R.; Methodology, L.C.J.; Formal analysis, L.C.J., R.R.K., D.W. and E.C.; Investigation, D.W. and L.R.S.; Resources, D.W., L.R.S. and J.M.R.; Data curation, R.R.K. and E.C.; Writing—original draft, L.C.J., R.R.K., E.C. and J.M.R.; Writing—review & editing, D.W., L.R.S. and J.M.R.; Supervision, L.R.S. and J.M.R.; Project administration, L.R.S.; Funding acquisition, L.R.S. and J.M.R. All authors have read and agreed to the published version of the manuscript.

Funding

This research received no external funding.

Institutional Review Board Statement

Not applicable.

Informed Consent Statement

Not applicable.

Data Availability Statement

Not applicable.

Acknowledgments

This research did not receive any external funding and was funded by an internal funded PhD scholarship in the “Human Health and Emerging Environmental Contaminants” cluster by the University of Hull.

Conflicts of Interest

The authors declare no conflict of interest.

References

  1. Hartmann, N.B.; Huffer, T.; Thompson, R.C.; Hassellöv, M.; Verschoor, A.; Daugaard, A.E.; Rist, S.; Karlsson, T.; Brennholt, N.; Cole, M.; et al. Are we speaking the same language? Recommendations for a definition and categorization framework for plastic debris. Environ. Sci. Technol. 2019, 53, 1039–1047. [Google Scholar] [CrossRef] [PubMed] [Green Version]
  2. Hale, R.C.; Seeley, M.E.; La Guardia, M.J.; Mai, L.; Zeng, E.Y. A global perspective on microplastics. J. Geophys. Res. Oceans 2020, 125, 1–40. [Google Scholar] [CrossRef]
  3. Kim, Y.-N.; Yoon, J.-H.; Kim, K.-Y. Microplastic contamination in soil environment—A review. Soil Sci. Ann. 2020, 71, 300–308. [Google Scholar] [CrossRef]
  4. Chen, G.; Feng, Q.; Wang, J. Mini-review of microplastics in the atmosphere and their risks to humans. Sci. Total Environ. 2020, 703, 135504. [Google Scholar] [CrossRef] [PubMed]
  5. Dris, R.; Gasperi, J.; Mirande, C.; Mandin, C.; Guerrouache, M.; Langlois, V.; Tassin, B. A first overview of textile fibers, including microplastics, in indoor and outdoor environments. Environ. Pollut. 2017, 221, 453–458. [Google Scholar] [CrossRef] [Green Version]
  6. Vianello, A.; Jensen, R.L.; Liu, L.; Vollertsen, J. Simulating human exposure to indoor airborne microplastics using a Breathing Thermal Manikin. Sci. Rep. 2019, 9, 8670. [Google Scholar] [CrossRef] [Green Version]
  7. Zhang, Q.; Zhao, Y.; Du, F.; Cai, H.; Wang, G.; Shi, H. Microplastic fallout in different indoor environments. Environ. Sci. Technol. 2020, 54, 6530–6539. [Google Scholar] [CrossRef]
  8. Jenner, L.C.; Sadofsky, L.R.; Danopoulos, E.; Rotchell, J.M. Household indoor microplastics within the Humber region (United Kingdom): Quantification and chemical characterisation of particles present. Atmos. Environ. 2021, 259, 118512. [Google Scholar] [CrossRef]
  9. Soltani, N.S.; Taylor, M.P.; Wilson, S.P. Quantification and exposure assessment of microplastics in Australian indoor house dust. Environ. Pollut. 2021, 283, 117064. [Google Scholar] [CrossRef]
  10. Danopoulos, E.; Twiddy, M.; Rotchell, J.M. Microplastic contamination of drinking water: A systematic review. PLoS ONE 2020, 15, e0236838. [Google Scholar] [CrossRef]
  11. Danopoulos, E.; Jenner, L.C.; Twiddy, M.; Rotchell, J.M. Microplastic contamination of seafood intended for human consumption: A systematic review and meta-analysis. Environ. Health Perspect. 2020, 128, 126002. [Google Scholar] [CrossRef]
  12. Nor, N.H.M.; Kooi, M.; Diepens, N.J.; Koelmans, A.A. Lifetime accumulation of microplastic in children and adults. Environ. Sci. Technol. 2021, 55, 5084–5096. [Google Scholar] [CrossRef]
  13. Jenner, L.C.; Rotchell, J.M.; Bennett, R.T.; Cowen, M.; Tentzeris, V.; Sadofsky, L.R. Detection of microplastics in human lung tissue using μFTIR spectroscopy. Sci. Total Environ. 2022, 831, 154907. [Google Scholar] [CrossRef]
  14. Leslie, H.A.; van Velzen, M.J.M.; Brandsma, S.H.; Vethaak, A.D.; Garcia-Vallejo, J.J.; Lamoree, M.H. Discovery and quantification of plastic particle pollution in human blood. Environ. Int. 2022, 163, 107199. [Google Scholar] [CrossRef]
  15. Alang, T.A.; Ibrahim, Y.S.; Anuar, S.T.; Azmi, A.A.; Khalik, W.M.; Lehata, S.; Hamzah, S.R.; Ismail, D.; Ma, Z.F.; Dzulkarnaen, A.; et al. Detection of microplastics in human colectomy specimens. JGH Open 2021, 5, 116–121. [Google Scholar] [CrossRef]
  16. Horvatits, T.; Tamminga, M.; Liu, B.; Sebode, M.; Carambia, A.; Fischer, L.; Püschel, K.; Huber, S.; Fischer, E.K. Microplastics detected in cirrhotic liver tissue. eBiomedicine 2022, 82, 104147. [Google Scholar] [CrossRef]
  17. Liang, F.; Liu, F.; Huang, K.; Yang, X.; Li, J.; Xiao, Q.; Chen, J.; Liu, X.; Cao, J.; Shen, C.; et al. Long-term exposure to fine particulate matter and cardiovascular disease in China. J. Am. Coll. Cardiol. 2020, 75, 707–717. [Google Scholar] [CrossRef]
  18. Aryal, A.; Harmon, A.C.; Dugas, T.R. Particulate matter air pollutants and cardiovascular disease: Strategies for intervention. Pharmacol. Ther. 2021, 223, 107890. [Google Scholar] [CrossRef]
  19. Cai, Y.; Hodgson, S.; Blangiardo, M.; Gulliver, J.; Morley, D.; Fecht, D.; Vienneau, D.; de Hoogh, K.; Key, T.; Hveem, K.; et al. Road traffic noise, air pollution and incident cardiovascular disease: A joint analysis of the HUNT, EPIC-Oxford and UK Biobank cohorts. Environ. Int. 2018, 114, 191–201. [Google Scholar] [CrossRef]
  20. Danopoulos, E.; Twiddy, M.; West, R.; Rotchell, J.M. A rapid review and meta-regression analyses of the toxicological impacts of microplastic exposure in human cells. J. Hazard. Mat. 2021, 427, 127861. [Google Scholar] [CrossRef]
  21. Dris, R.; Gasperi, J.; Saad, M.; Mirande, C.; Tassin, B. Synthetic fibers in atmospheric fallout: A source of microplastics in the environment? Mar. Pollut. Bull. 2016, 104, 290–293. [Google Scholar] [CrossRef] [PubMed]
  22. Cai, L.; Wang, J.; Peng, J.; Tan, Z.; Zhan, Z.; Tan, X.; Chen, Q. Characteristic of microplastics in the atmospheric fallout from Dongguan city, China: Preliminary research and first evidence. Environ. Sci. Pollut. Res. 2017, 24, 24928–24935. [Google Scholar] [CrossRef] [PubMed]
  23. Klein, M.; Fischer, E.K. Microplastic abundance in atmospheric deposition within the Metropolitan area of Hamburg, Germany. Sci. Total Environ. 2019, 685, 96–103. [Google Scholar] [CrossRef] [PubMed]
  24. Wright, S.L.; Ulke, J.; Font, A.; Chan, K.L.A.; Kelly, F.J. Atmospheric microplastic deposition in an urban environment and an evaluation of transport. Environ. Int. 2020, 136, 105411. [Google Scholar] [CrossRef] [PubMed]
  25. Szewc, K.; Graca, B.; Dołęga, A. Atmospheric deposition of microplastics in the coastal zone: Characteristics and relationship with meteorological factors. Sci. Total Environ. 2020, 761, 143272. [Google Scholar] [CrossRef]
  26. Allen, S.; Allen, D.; Phoenix, V.R.; Le Roux, G.; Durántez Jiménez, P.; Simonneau, A.; Binet, S.; Galop, D. Atmospheric transport and deposition of microplastics in a subtropical urban environment. J. Hazard. Mater. 2021, 416, 126168. [Google Scholar] [CrossRef]
  27. Jenner, L.C.; Sadofsky, L.R.; Danopoulos, E.; Chapman, E.; White, D.; Jenkins, R.L.; Rotchell, J.M. Outdoor atmospheric microplastics within the Humber Region (United Kingdom): Quantification and chemical characterisation of deposited particles present. Atmosphere 2022, 13, 265. [Google Scholar] [CrossRef]
  28. Allen, S.; Allen, D.; Phoenix, V.R.; Le Roux, G.; Durántez Jiménez, P.; Simonneau, A.; Binet, S.; Galop, D. Atmospheric transport and deposition of microplastics in a remote mountain catchment. Nat. Geosci. 2019, 12, 339–344. [Google Scholar] [CrossRef] [Green Version]
  29. Gasperi, J.; Wright, S.L.; Dris, R.; Collard, F.; Mandin, C.; Guerrouache, M.; Langlois, V.; Kelly, F.J.; Tassin, B. Microplastics in air: Are we breathing it in? Curr. Opin. Environ. Sci. Health. 2018, 1, 1–5. [Google Scholar] [CrossRef] [Green Version]
  30. Prata, J.C. Airborne microplastics: Consequences to human health? Environ. Pollut. 2018, 234, 115–126. [Google Scholar] [CrossRef]
  31. Cowger, W.; Booth, A.M.; Hamilton, B.M.; Thaysen, C.; Primpke, S.; Munno, K.; Lusher, A.L.; Dehaut, A.; Vaz, V.P.; Liboiron, M.; et al. Reporting guidelines to increase reproducibility and comparability of research on microplastics. Appl. Spectrosc. 2020, 74, 1066–1077. [Google Scholar] [CrossRef]
  32. Wright, S.L.; Kelly, F.J. Plastic and human health: A micro issue? Environ. Sci. Technol. 2017, 51, 6634–6647. [Google Scholar] [CrossRef]
  33. Hahladakis, J.N.; Velis, C.A.; Weber, R.; Iacovidou, E.; Purnell, P. An overview of chemical additives present in plastics: Migration, release, fate and environmental impact during their use, disposal and recycling. J. Hazard. Mater. 2018, 344, 179–199. [Google Scholar] [CrossRef]
  34. Gov.UK. Collection-Air Quality and Emission Statistics. Available online: https://www.gov.uk/government/collections/air-quality-and-emissions-statistics (accessed on 17 October 2022).
  35. Sicard, P.; Agathokleous, E.; De Marco, A.; Paoletti, E.; Calatayud, V. Urban population exposure to air pollution in Europe over the last decades. Environ. Sci. Eur. 2021, 33, 28. [Google Scholar] [CrossRef]
  36. Furuuchi, M.; Fissan, H.; Horodecki, J. Evaporation behaviour of volatile particles on fibrous filter flushed with particle-free dry air. Powder Technol. 2001, 118, 171–179. [Google Scholar] [CrossRef]
  37. Munno, K.; Helm, P.A.; Jackson, D.A.; Rochman, C.; Sims, A. Impacts of temperature and selected chemical digestion methods on microplastic particles. Environ. Toxicol. Chem. 2018, 37, 91–98. [Google Scholar] [CrossRef]
  38. Horton, A.A.; Cross, R.K.; Read, D.S.; Jürgens, M.D.; Ball, H.L.; Svendsen, C.; Vollertsen, J.; Johnson, A.C. Semi-automated analysis of microplastics in complex wastewater samples. Environ. Pollut. 2021, 268, 115841. [Google Scholar] [CrossRef]
  39. Dris, R.; Gasperi, J.; Rocher, V.; Saad, M.; Renault, N.; Tassin, B. Microplastic contamination in an urban area: A case study in Greater Paris. Environ. Chem. 2015, 12, 592. [Google Scholar] [CrossRef]
  40. Liu, K.; Wang, X.; Wei, N.; Song, Z.; Li, D. Accurate quantification and transport estimation of suspended atmospheric microplastics in megacities: Implications for human health. Environ. Int. 2019, 132, e105127. [Google Scholar] [CrossRef]
  41. Gaston, E.; Woo, M.; Steele, C.; Sukumaran, S.; Anderson, S. Microplastics differ between indoor and outdoor air masses: Insights from multiple microscopy methodologies. Appl. Spectrosc. 2020, 74, 1079–1098. [Google Scholar] [CrossRef]
  42. Roblin, B.; Ryan, M.; Vreugdenhil, A.; Aherne, J. Ambient atmospheric deposition of anthropogenic microfibers and microplastics on the Western Periphery of Europe (Ireland). Environ. Sci. Technol. 2020, 54, 11100–11108. [Google Scholar] [CrossRef] [PubMed]
  43. Amato-Lourenço, L.F.; Carvalho-Oliveira, R.; Júnior, G.R.; dos Santos Galvão, L.; Ando, R.A.; Mauad, T. Presence of airborne microplastics in human lung tissue. J. Hazard. Mater. 2021, 416, 126124. [Google Scholar] [CrossRef] [PubMed]
  44. Fecht, D.; Hansell, A.L.; Morely, D.; Dajnak, D.; Vienneau, D.; Beevers, S. Spatial and temporal associations of road traffic noise and air pollution in London: Implications for epidemiological studies. Environ. Int. 2016, 88, 235–242. [Google Scholar] [CrossRef] [PubMed]
Figure 1. Sampling site location in Kingston-upon-Hull, UK. Latitude 53.739415, Longitude -0.34786742.
Atmosphere 13 02017 g001
Figure 2. Schematic overview of the MP sampling procedures: (A) Glassware preparation, (B) NOx inlet valve filter capture of all particulates and digestion, (C) Filtration of remaining particles onto Anodisc filters, (D) μFTIR characterization of particles using a polymer spectra library.
Atmosphere 13 02017 g002
Figure 3. The total number of MPs identified, within the 10-month sampling period, at the roadside sampling site (‘A63’) using both NOx inlet filter (October/November, December/January, February/March, May/June pooled data onto one filter) and previously published rain sampler approaches. The total rainfall during each varied-week sampling period is presented alongside. # Symbol indicates periods in which an official COVID-19 lockdown was issued.
Atmosphere 13 02017 g003
Figure 4. (A) MP polymer types detected at sampling site 1 (A63) throughout the 13-month sampling period, and (B) MP polymer types detected in the combined control samples. Abbreviations: alkyds, mixed alkyd resins; hyd resin, hydrocarbon resins; PA, poly (acetal); PB, poly(butadiene); PC, polycarbonate; PCS, Poly(4-chlorostyrene:styrene); PE, polyethylene; PAS, poly (acrylate:styrene); PES, polyester; PET, polyethylene terephthalate; PP, polypropylene; PS, polystyrene; PTFE, polytetrafluoroethylene, PVAE, poly (vinyl acetate:ethylene).
Atmosphere 13 02017 g004
Figure 5. (A) Standard regulatory air quality measure levels alongside NOx filter derived MP levels. Sampling timepoints were as follows: 1, 22/10/19–12/11/19 (21 days); 2, 02/12/19–27/01/20 (56 days); 3, 27/01/20–16/03/20 (49 days); 4, 01/04/20–29/04/20 (28 days); 5, 29/04/20–03/06/20 (35 days); 6, 01/07/20–29/07/20 (28 days). (B) Monthly standard air quality measured data from same period and sampling location. (C) Hourly snapshot of the mean standard air quality measured data for the same period and sampling location.
Atmosphere 13 02017 g005aAtmosphere 13 02017 g005b
Table 1. MP levels detected at ‘A63’ roadside site, using the NOx inlet filters and * previously published passive rain sampler approaches [23], before and after LOD and LOQ adjustments. October/November, December/January, February/March, May/June pooled data onto one filter.
Sampling MonthNOx Filter MP
m−2 day−1
(No Adjustments)
NOx Filter MP
m−2 day−1
(LOD LOQ Adjusted)
Passive MP
m−2 day−1
(No Adjustments) *
Passive MP
m−2 day−1
(LOD LOQ Adjusted) *
October 2019
November 2019
153669912251164
408316
December 2019
January 2020
15341168367308
14691446
February 2020
March 2020
306118694603
857799
April 20201975178631843086
May 2020
June 2020
987055515494
48574715
July 202090552019,26618,996
Mean ± SD1209 ± 594715 ± 6723788 ± 57493693 ± 5687
Publisher’s Note: MDPI stays neutral with regard to jurisdictional claims in published maps and institutional affiliations.

