Article

Investigation of Two Severe Shamal Dust Storms and the Highest Dust Frequencies in the South and Southwest of Iran

by
Abbas Ranjbar Saadat Abadi
1,
Nasim Hossein Hamzeh
2,*,
Maggie Chel Gee Ooi
3,
Steven Soon-Kai Kong
4 and
Christian Opp
5,*
1
Atmospheric Science & Meteorological Research Center (ASMERC), Tehran 14977-16385, Iran
2
Department Meteorology, Air and Climate Technology Company (ACTC), Tehran 15996-16313, Iran
3
Institute of Climate Change, Universiti Kebangsaan Malaysia (UKM), Bangi 43600, Malaysia
4
Department of Atmospheric Sciences, National Central University, Taoyuan 32001, Taiwan
5
Department of Geography, Philipps-Universität Marburg, 35032 Marburg, Germany
*
Authors to whom correspondence should be addressed.
Atmosphere 2022, 13(12), 1990; https://doi.org/10.3390/atmos13121990
Submission received: 14 October 2022 / Revised: 4 November 2022 / Accepted: 4 November 2022 / Published: 28 November 2022
(This article belongs to the Section Air Pollution Control)

Abstract

:
Dust storms create some of the most critical air quality problems in the world; the Middle East, located in the dust belt, suffers substantially from dust storms. Iran, as a country in the Middle East, is affected by dust storms from multiple internal and external sources that mostly originate from deserts in Iraq and Syria (especially the Mesopotamia region). To determine the highest dust loadings in the south and west of Iran, dust frequencies were investigated in the eight most polluted stations in the west, southwest, and southern Iran for a period of 21 years from 2000 to 2021. During the study’s duration, the dust frequency was much higher from 2008 to 2012, which coincided with severe droughts reported in Iraq and Syria; from which, we investigated two severe dust storms (as well as the dust sources and weather condition effects) that took place on 15–17 September 2008 and 1–3 June 2012; we used secondary data from ground measurement stations, and satellite and modeling products. In both cases, horizontal visibility was reduced to less than 1 km at most weather stations in Iran. The measured P M 10 in the first case reached 834 μg m−3 at Ilam station in west Iran and the Iran–Iraq borders while the measured P M 10 in the second case reached 4947 μg m−3 at Bushehr station in the northern shore of the Persian Gulf. The MODIS true color images and MODIS AOD detected the dust mass over Iraq, southern Iran, and Saudi Arabia in both cases; the AOD value reached 4 in the first case and 1.8 in the second case over the Persian Gulf. During these two severe dust storms, low-level jets were observed at 930 hPa atmospheric levels in north Iraq (2008 case) and south Iraq (2012 case). The output of the NAPPS model and CALIPSO satellite images show that the dust rose to higher than 5 km in these dust storm cases, confirming the influence of Shamal wind on the dust storm occurrences.

1. Introduction

Dust storms are natural hazards that affect many lives across the world. They cause health problems for human beings. The dust particles can induce respiratory and cardiovascular diseases [1,2,3], causing respiratory problems, heartbeat irregularities, heart attacks, severe headaches, and even allergies and skin diseases [4,5,6]. They also affect many other aspects of people’s livelihood, e.g., they could cause travel restrictions on air and road transportation due to visibility impairment [7], reduce crop productivity (by inhibiting photosynthetic activity and as a result of seedling burial under sand storms) [8,9,10], cause other environmental effects, e.g., changes in radiative forcing [11] and cloud formation [12,13], and accelerate the snow melting rate [14].
Most dust sources are located in the northern hemisphere and are mainly distributed across northern Africa (Sahara), followed by the Middle East, central Asia, east Asia, North America, Australia, and South America [15,16,17,18,19,20,21]. The Middle East, being the second largest dust source in the world [22,23], makes up 12% of world dust storm events [24]. These dust storms mainly originate in the deserts of Iraq and Syria, especially the Tigris–Euphrates basin in the Mesopotamian area during the dry months of spring and summer [22,25,26]. Moreover, dust deposition occurs more often in the Persian Gulf than any other water body in the world [27] due to the presence of multiple dust sources surrounding the gulf in Saudi Arabia [28], Kuwait [29], Iraq [30], Emirates [31], Qatar [32], Iran, and even in the islands in the Persian Gulf [33,34].
Under drought conditions, dust storm frequencies rose dramatically in the Middle East area. Almamalachy et al. [35] investigated the means of four spectral drought indices, i.e., the vegetation drought index (VDI), vegetation health index (VHI), temperature vegetation dryness index (TVDI), and visible and shortwave infrared drought index (VSDI), which were derived from the MODIS dataset of the Terra satellite in Iraq from 2003 to 2015. Their study showed that the most severe drought year was 2008; the drought covered 37% of vegetated lands. The droughts in 2009, 2011, and 2012 were mild to moderate and covered approximately 44%, 50%, and 49% of the land, respectively. The drought duration increased the dust storm frequency in Iraq [36] Kuwait [27], and west and southwest Iran [37,38,39].
Dust storms in the Middle East region can be divided into two main categories: Shamal dust storms and frontal dust storms [40]. Shamal dust storms are related to Shamal winds, which mostly occur during warm seasons, while frontal dust storms associated with the frontal system mostly occur in cold seasons [41]. The Shamal wind is a strong north-to-northwesterly wind that is capable of lifting dust mainly from the Tigris–Euphrates basin. The wind system is capable of transporting dust particles to the Persian Gulf, Arabian Peninsula, and west and southwest Iran [42]. Shamal dust storms mainly dominate in the summer and are usually accompanied by low-level jets [42,43,44]. Although the frequencies of frontal dust storms are much lower than Shamal dust storms [45], they mostly occur in the winter and are mainly associated with cold fronts from higher latitudes [41,44,46,47]. Nevertheless, the frequencies of dust storms are higher in warm seasons than in cold seasons [23]; thus, Shamal dust storms will be further studied in this work.
Although previous studies have investigated the long-term variability of dust events in west (W) and southwest (SW) Iran [38,39,48,49,50], in-depth analyses of the severe dust storm cases are still lacking regarding the formation and role of weather. Hence, the current study dives into the causes of dust storms in the SW and W of Iran with a focus on two severe Shamal dust storms in the past 21 years. These two dust storm cases were chosen based on widespread and impaired visibility at most weather stations in the Middle East. The synoptic patterns were studied to investigate the genesis of these dust storms due to Shamal winds and low-level jets. First, the soil conditions of the dust sources in the Middle East area are presented in Section 3.1. In Section 3.2, we present a statistical investigation of dust events, involving eight of the most polluted weather and air quality stations in the west, southwest, and south of Iran covering a period of 21 years (from 2000 to 2020). The spatiotemporal evolution of annual dust days over a 21-year duration is presented in Section 3.3. The reported visibility data from all weather stations in Iran were related to dust codes to show that severe dust storms occurred during those two dust storm cases. MODIS AOD (550 nm) is then examined to show the severity of the two dust storm cases. Moreover, the vertical profiles of dust from the CALIPSO satellite and the NAAPS model were investigated during the two dust events in order to monitor the vertical structures of dust storms in the study region. Finally, the surface dust concentration of the NAAPS model was investigated to study the dust propagation mechanism in the Middle East region.

2. Dataset and Methodology
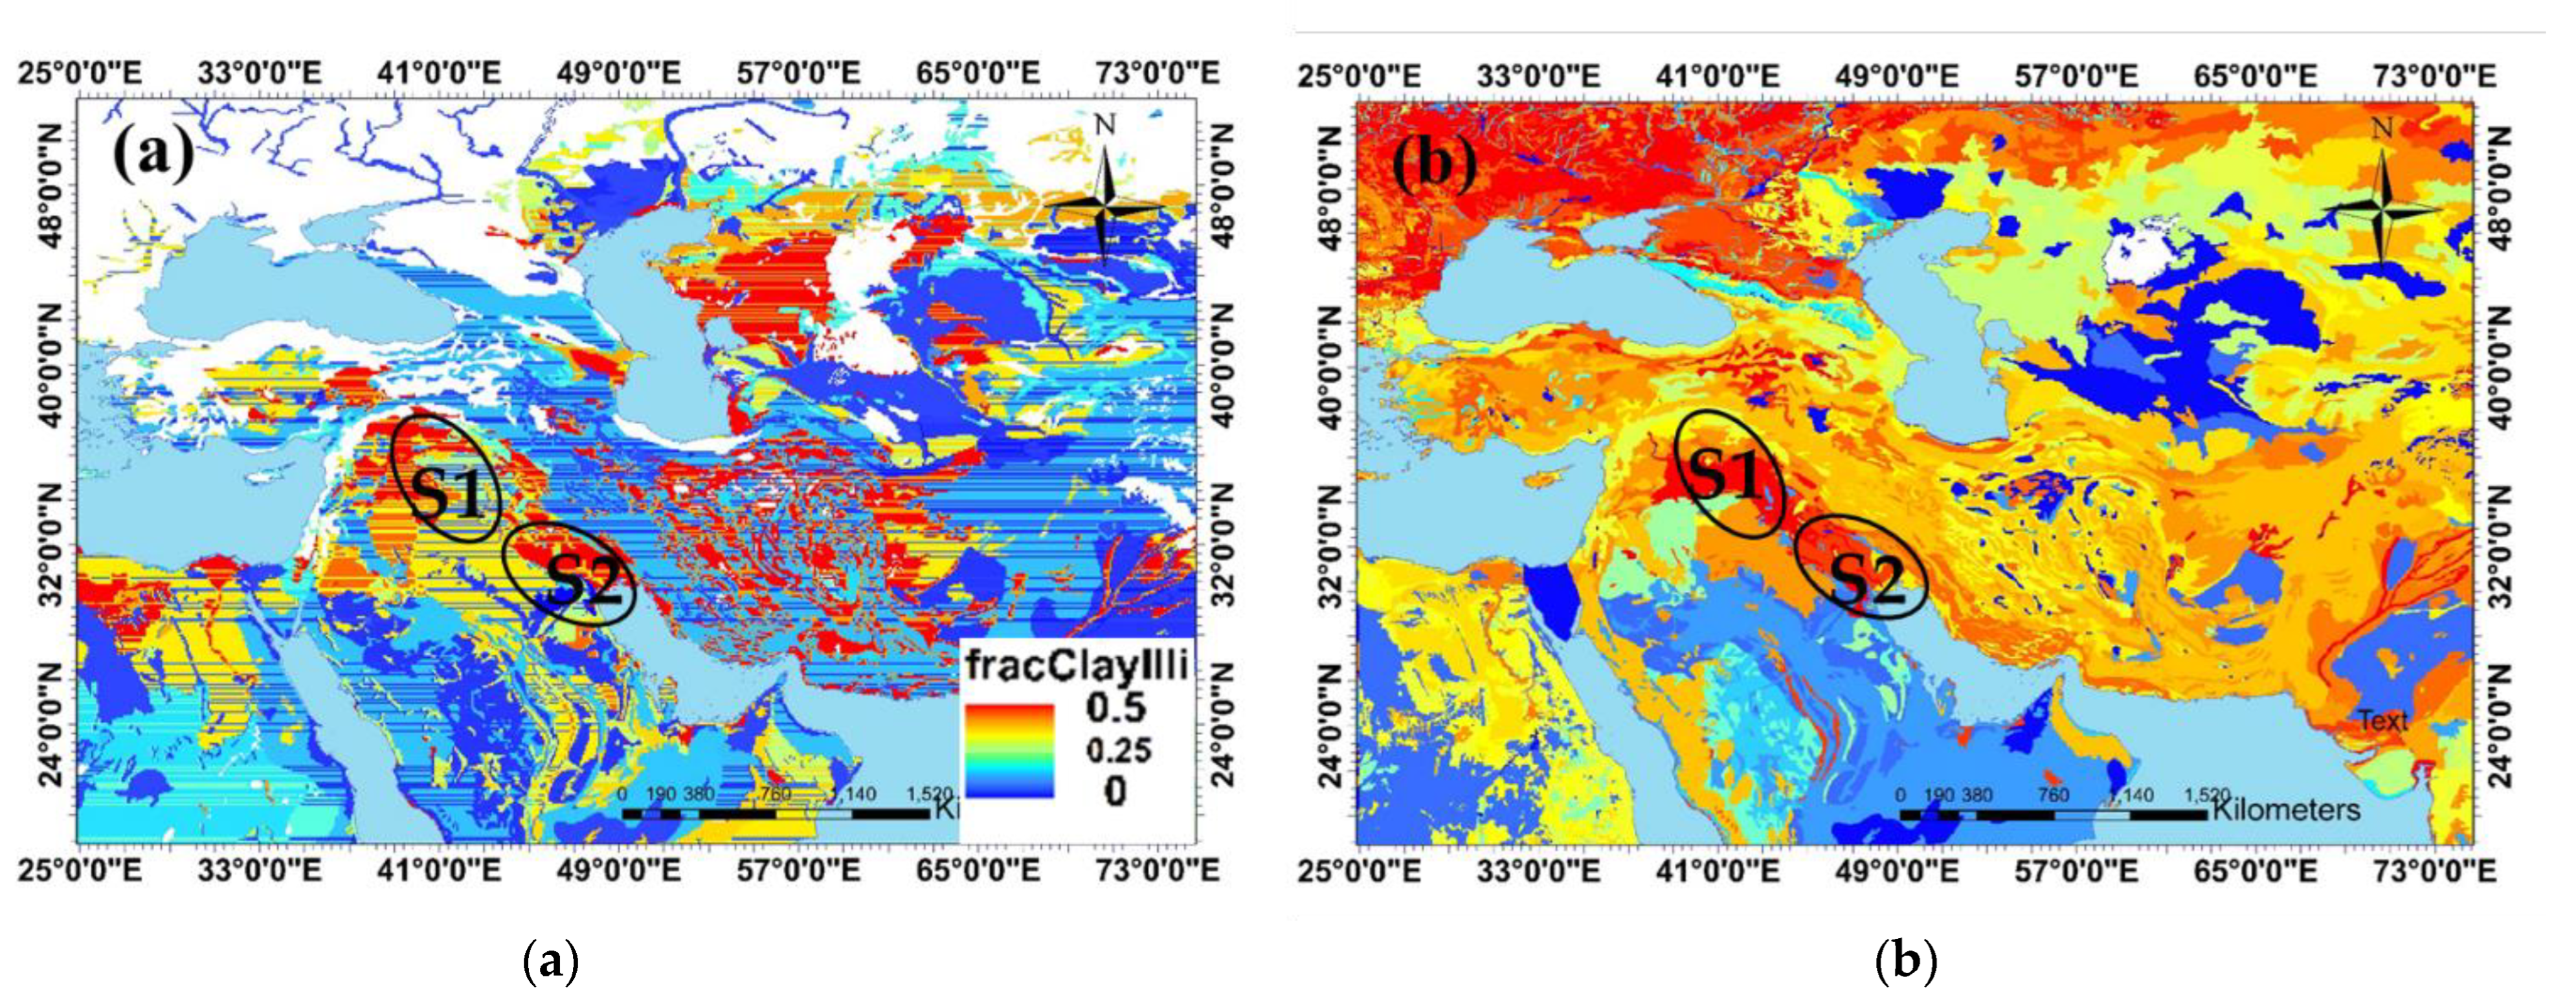
2.1. Study Area

The study area focused on the west, southwest, and south of Iran, which are prone to dust storms. This area encompasses mixed terrain including mountains, the flat Khuzestan Plain in the southwest, and the Persian Gulf. In the past two decades, the weather–air quality station in the plain has been one of the most polluted stations in the world [50]. The Khuzestan Plain is mostly affected by dust originating from Iraq and Syrian deserts, but in recent years the dust from local sources has become more prominent [51].
In this study, the annual frequencies of dust storms were investigated at eight polluted weather stations in the west, southwest, and south of Iran during the period 2000–2020. Table 1 shows the station location (longitude, latitude), elevation, and the mean annual number of dust days recorded at the respective stations. To determine the dust days, three-hour recordings of the synoptic codes related to the dust were used at the meteorological stations during the 20-year period. The dust-related codes (06, 07, 30–35) were derived from meteorological reports with their definitions shown in Table 2. The other dust-related codes (90–99) rarely occurred in these areas.
The visibilities during these two severe dust storms were reported to be under 1 km for most stations in Iran. P M 10 data were taken from the air pollution monitoring network administered by the Department of Environment, Iran.

2.2. Dataset

Daily synoptic maps of mean sea-level pressure (MSLP), geopotential heights at 500 hPa, vertical profiles of wind and vector winds, and geopotential heights at 925 hPa were extracted from the Middle East during the dust storm events by using data from ERA5 at 0.5° × 0.5° with spatial resolution [52]. The TERRA/MODIS aerosol optical depth (AOD550) combined with the Deep Blue and Dark Target algorithms at level 3 with a 1° × 1° resolution were derived from the Giovanni visualization tool [53]. The TERRA/MODIS true color imagery was used to investigate the origin and transport pathways of the dust masses during the dust storms [54]. Furthermore, CALIPSO products of aerosol sub-types [55,56] were used to study the vertical profiles of dust aerosols in the two dust storm cases [57].

2.3. NAAPS Model

The NAAPS model can study and simulate the movements of dust particles, wind directions, changes in the height of the boundary layers, and meteorology front movements [58]. Model predictions are provided for 6 h at each point in the coordinates. The source of the dust in this model was determined by analyzing the TOMS sensor data and the US Geological Survey [55]. The NAAPS model considers 94 types of land use, 8 of which are related to dust-producing areas. The NAAPS has a 1° horizontal grid resolution and 25 sigma coordinate vertical levels [59]. In this study, we investigated the vertical distributions of the NAAPS output dust (μg m−3) at two stations (Basrah and the Persian Gulf).

3. Results and Discussion

3.1. Drought Condition

Figure 1 shows the clay fractions of dust aerosols at emissions for the soil mineral fraction (SMF) method in the Middle East [60]. The data resolution is 5′ longitude by 5′ latitude. Goudie and Middleton (2006) [61] noted that dust storms that reach higher altitudes and transport at longer distances are mainly composed of silt and clay. The silt size falls somewhere between clay and sand and its mineral origin is quartz (made up of SiO4 silicon–oxygen tetrahedra with the SiO2 formula) and feldspar. Silt may occur as a soil texture or as a suspended sediment (also known as a suspended load) in a surface water body. Sometimes it exists as soil deposits at the bottom of the water body. The silt particle radius ranges between 3.9 and 62.5 µm [60]. Clay particles are formed from thin-plate particles held together by electrostatic forces, and there is cohesion. According to the Food and Agriculture Organization (FAO) Soil Texture Classification system, the sand–silt distinctions are made at 0.05 mm particle sizes while the Unified Soil Classification System (USCS) distinguishes them at 0.075 mm particle sizes. Silt and clay are distinguished mechanically by their plasticity [62]. Al-Dousari [27] noted that a high percentage (20%) of loading dust over the Persian Gulf is clay. Al-Hemoud et al. [30] investigated clay and silt fractions in dust hotspots; the highest amounts were in southern Iraq. Baldo et al. [62] showed that the mineral fractions of African and Asian dust ( P M 10 ) were mostly clay. This clay fraction of dust is even higher in Asian dust storms. In Figure 1, a high fraction of soil in Iraq and Syria is clay, so these areas are more vulnerable to dust lifting. The soil around the Persian Gulf, Kuwait, has the highest fraction of clay and silt (Figure 1a,b); this region has one of the highest dust frequencies in the world [63]. Moreover, climate change-induced drought conditions could further increase the silt and clay fractions of soil and subsequently cause higher dust storm frequencies [61]. Therefore, the clay and silt compositions of soil in the study region are known to be the main sources of dust storms.

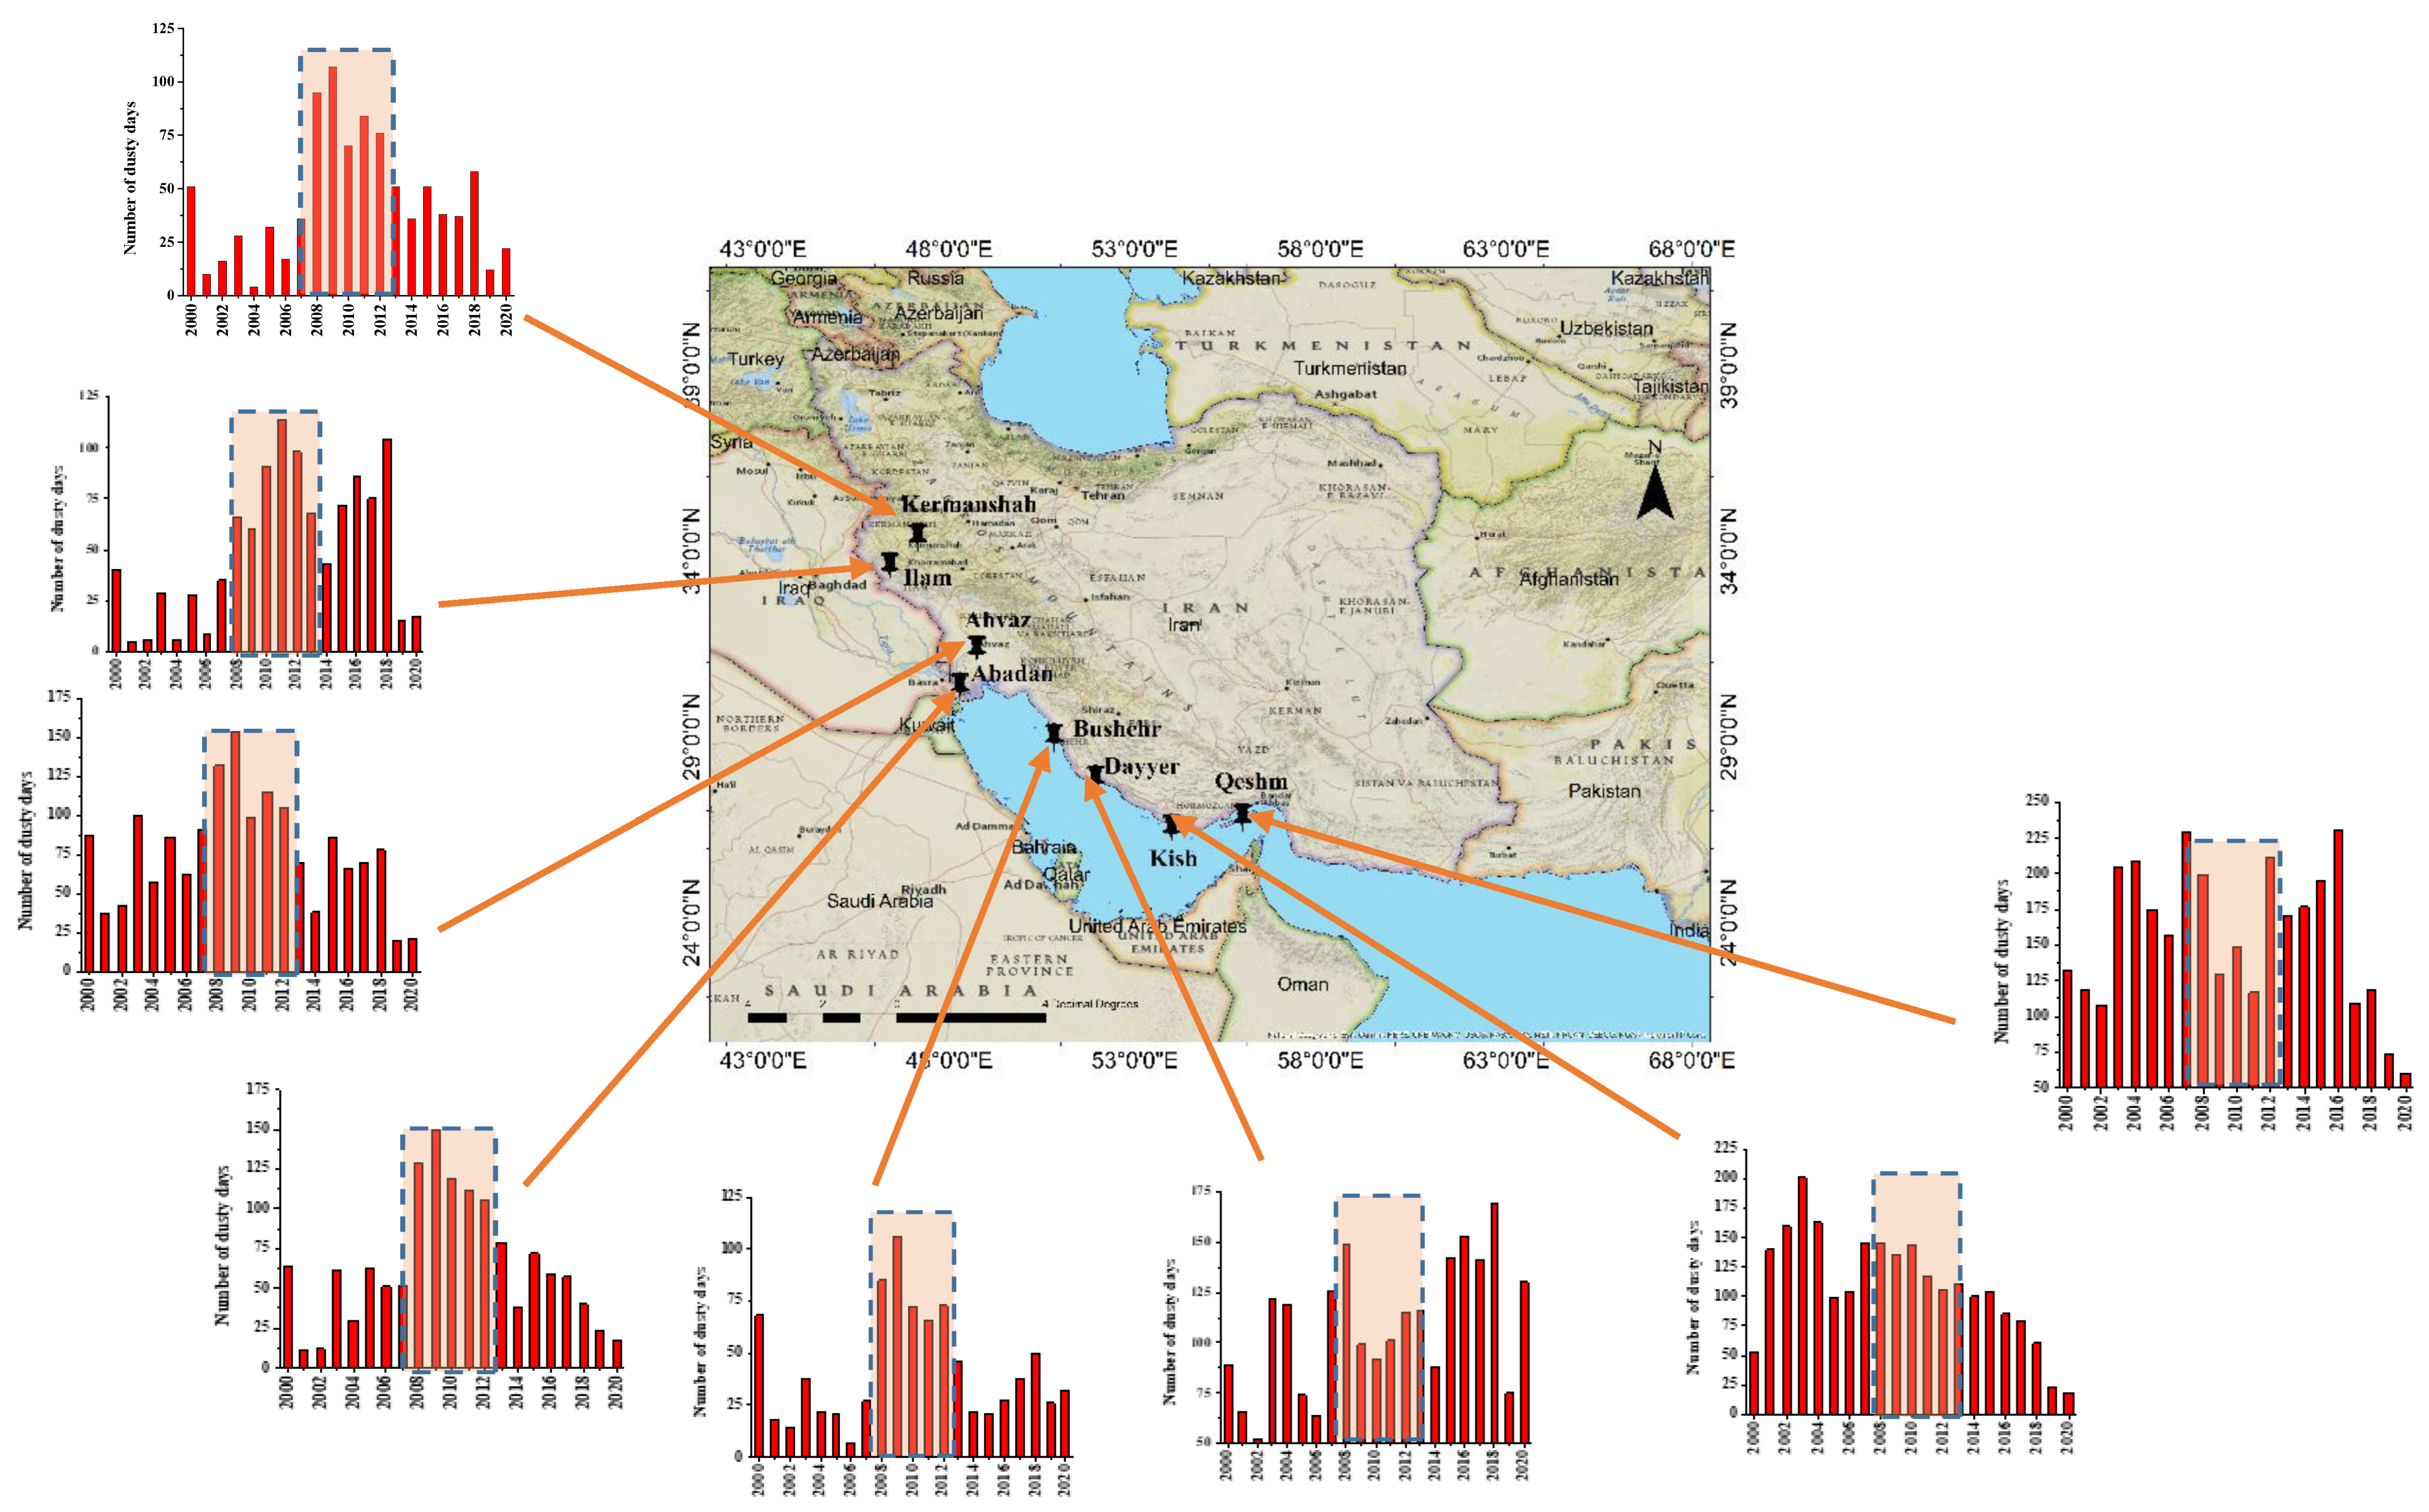
3.2. Temporal Variation in Dusty Days

In this section, the evolution of dust events was analyzed at the eight weather stations in the west, southwest, and south of Iran from 2000 to 2020. There are local dust sources in the Khuzestan Plain; the northern parts of the Persian Gulf and Bushehr station recorded high percentages of reported dust. The weather code (07) is related to dust from the deserts in this area [37]. Some parts of the Qeshm and Kish Islands in the Persian Gulf are desert areas. From 2007 to 2017, it was found that local dust over Kish and Qeshm islands was higher than non-local dust, contributing to 89% and 96% in Kish and Qeshm, respectively [33]. Thus, the dominant dust in Kish and Qeshm Islands was local; however, at Bushehr and Dayyer port stations, local dust made up only 26% of the total dust at the Bushehr weather station [34,37].
Ahvaz is one of the dustiest cities in the world [49] and the average mean measured surface P M 10 is 186–489 μg m−3 from April to September [64]. The city of Ahvaz and the Abadan weather station are located in the Khuzestan Plain. The plain has recently become an active dust source; this area is mostly not affected by local dust sources and suffers from lifted dust particles from the deserts in Iraq and Syria [65]. Kermanshah city is one of the dustiest cities in the world with an average annual P M 10 value of 229 μg m−3 [25], but it is a mountain city and there is no dust source around it. Among the nine studied stations, Abadan, Dayyer, and Bushehr are located in coastal cities, Kish and Qeshm Island are located in the Persian Gulf, while Ilam and Kermanshah are located in mountain cities [48]. Moreover, Ahvaz and Abadan are located in the Khuzestan Plain, so they are more vulnerable to dust storms compared to mountain cities. These two cities are located in open plains without many geographical obstructions, such as mountains [49,66]. Thus, dust storms tend to affect them more easily in comparison with the other cities in the study area. Mountain ranges provide shields against strong winds and serve as dust sinks that provide alternatives for dust deposition.
Hamzeh et al. [37] showed that the highest dust occurrence was from 2008 to 2012 over a 21-year duration (1998 to 2018) in five stations in west and southwest Iran. Moreover, the highest number of dusty days occurred in 2009, especially in July 2009 in west and southwest Iran [18]. Other studies showed that severe droughts occurred in Iraq and that P M 10 increased dramatically in the Middle East region [67,68]. Moreover, many weather stations in Iraq reported low precipitation and severe droughts from 2008 to 2012 [69,70,71]. Figure 2 shows the number of dusty days was high from 2008 to 2012 in nine stations in the west, southwest, and south of Iran (pink parts), but dusty days in Kish, Qeshm islands, and Dayyer port during this period were not high because they were mainly affected by local dust sources. These islands, especially Qeshm, have vast deserts in them, so internal dust sources play important roles in dust storms there [33]. Moreover, south Iran is affected by dust sources in Saudi Arabia more than the west of Iran. Therefore, two severe dust storms were chosen from that duration and were investigated in this study.

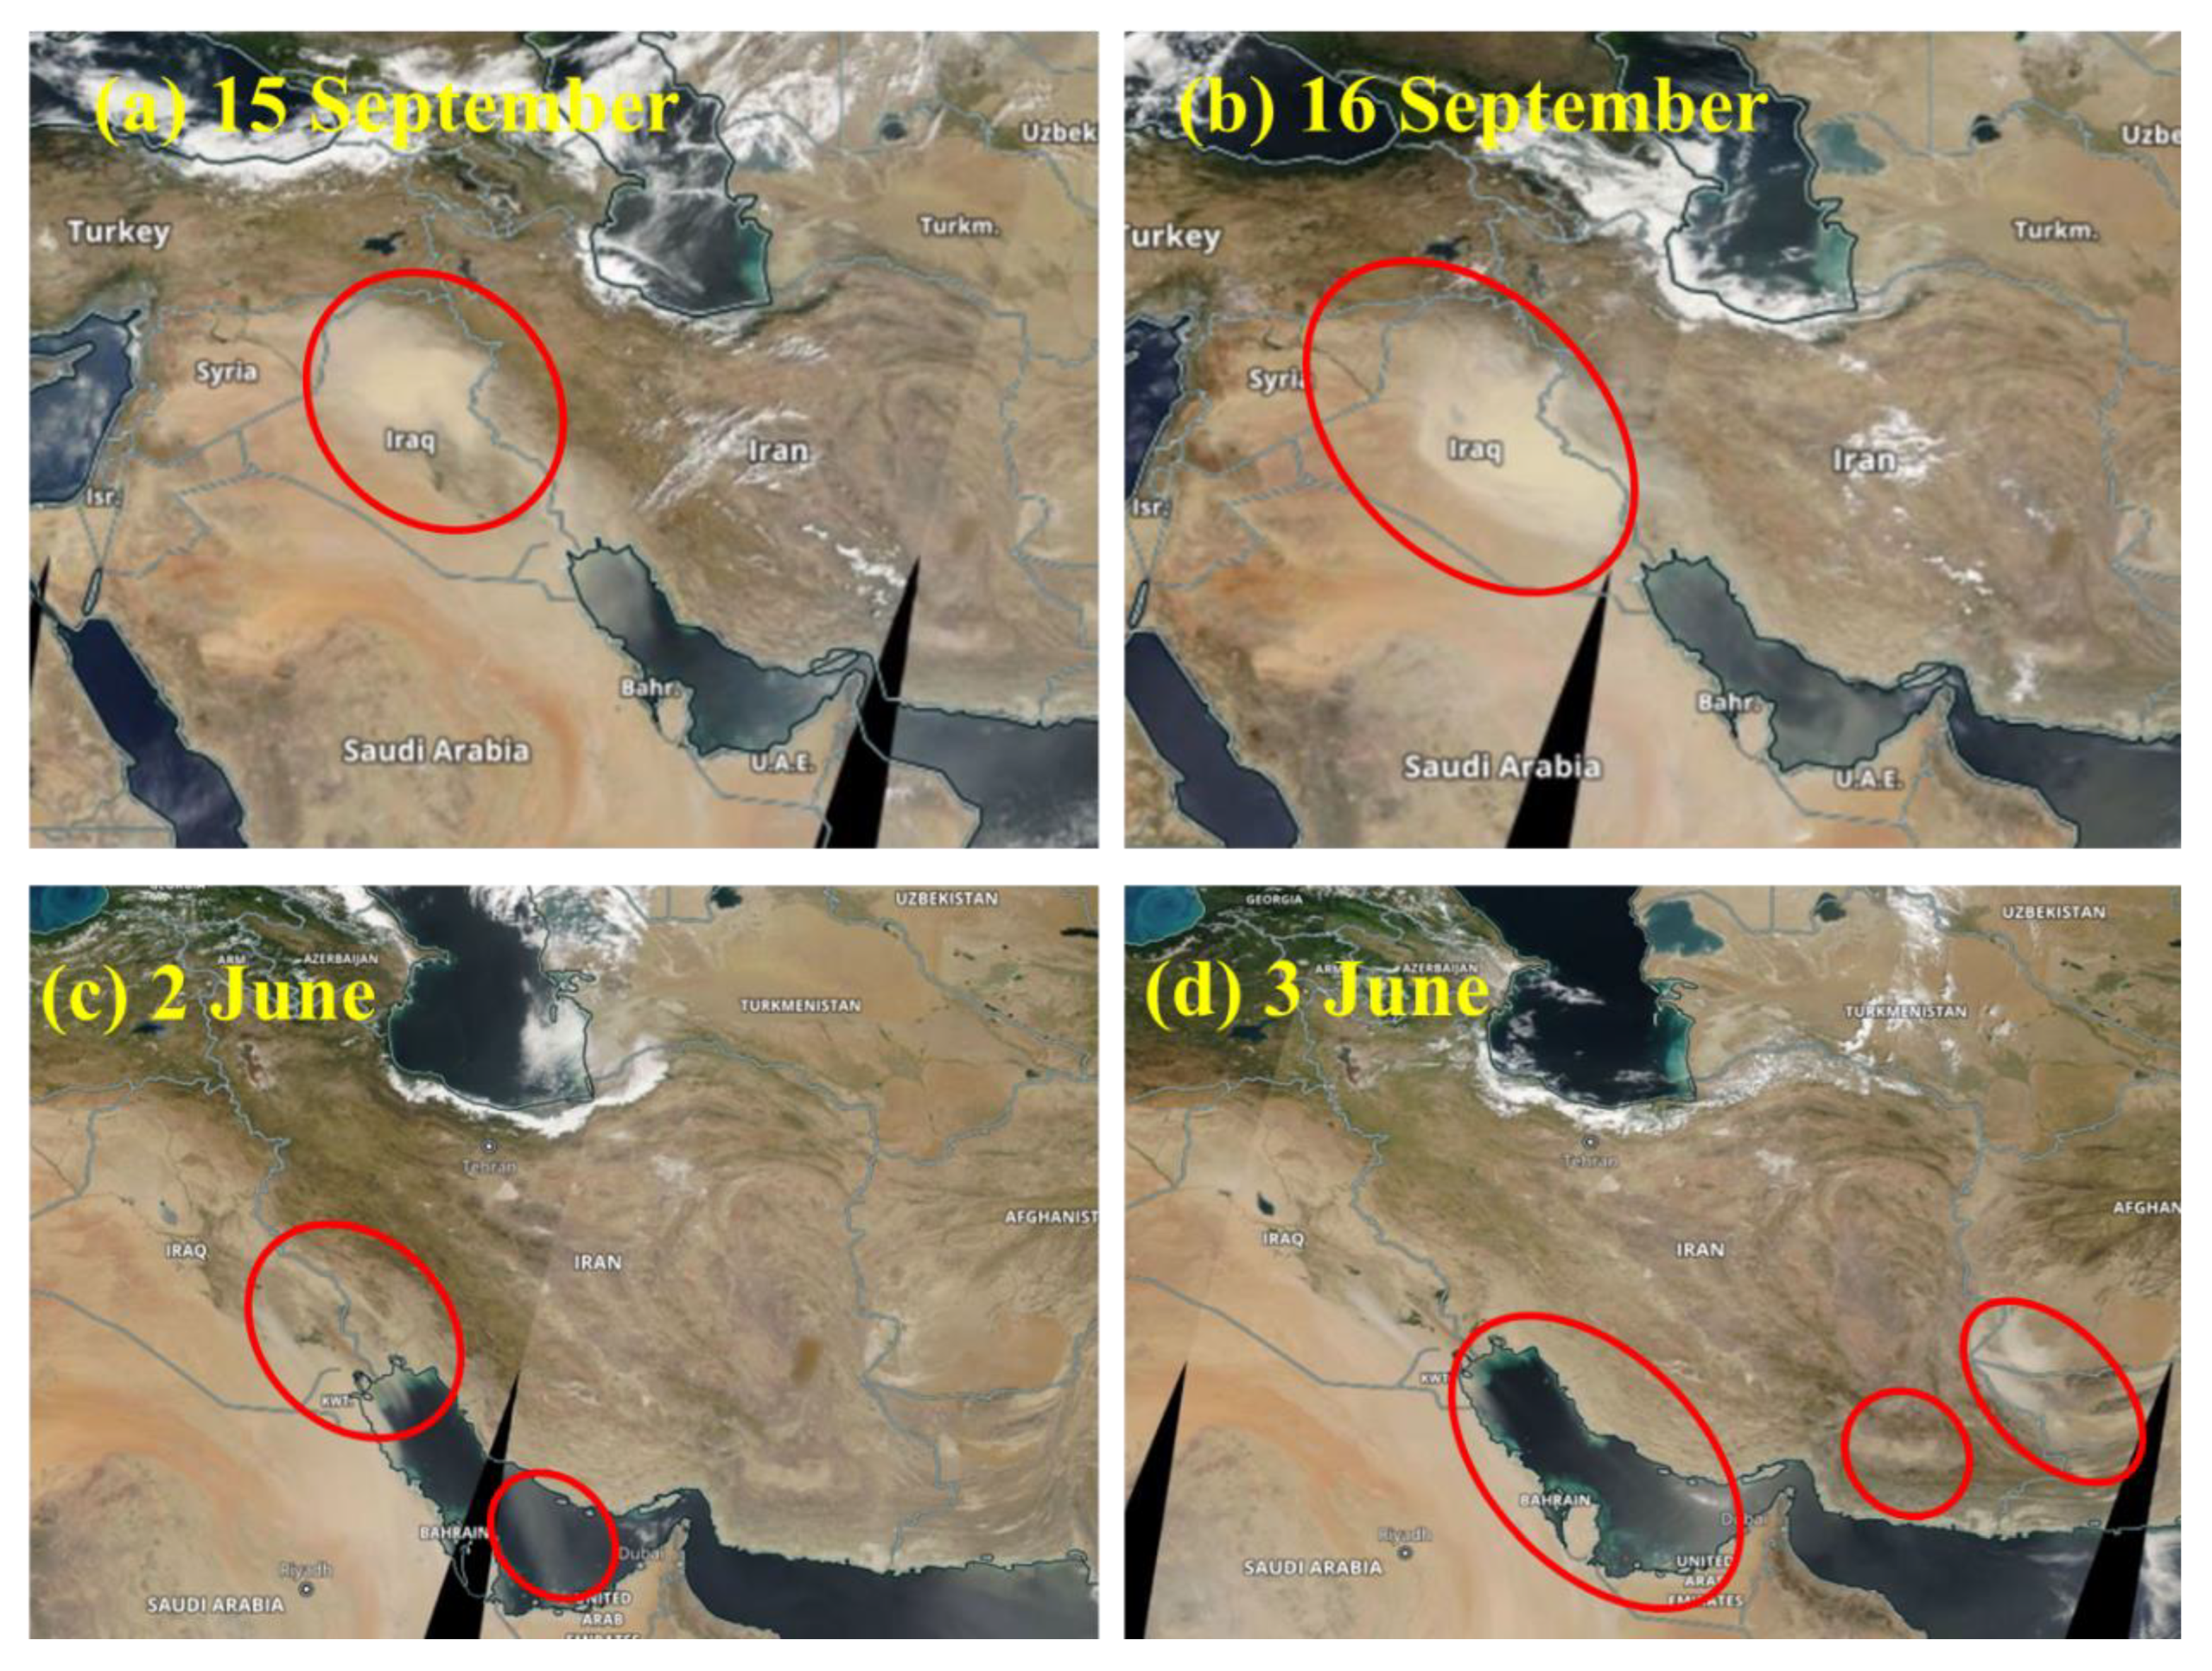
3.3. Investigation of Two Severe Dust Storms

In this study, two severe dust storms were chosen as the dustiest durations in west and southwest Iran. The two cases were selected based on the duration and widespread dust reported at the weather stations in west and SW Iran. Moreover, satellite true color and AOD images showed the same severity and wide propagation of dust storms. The dust storm cases were on 15–17 September 2008 and 1–3 June 2012.

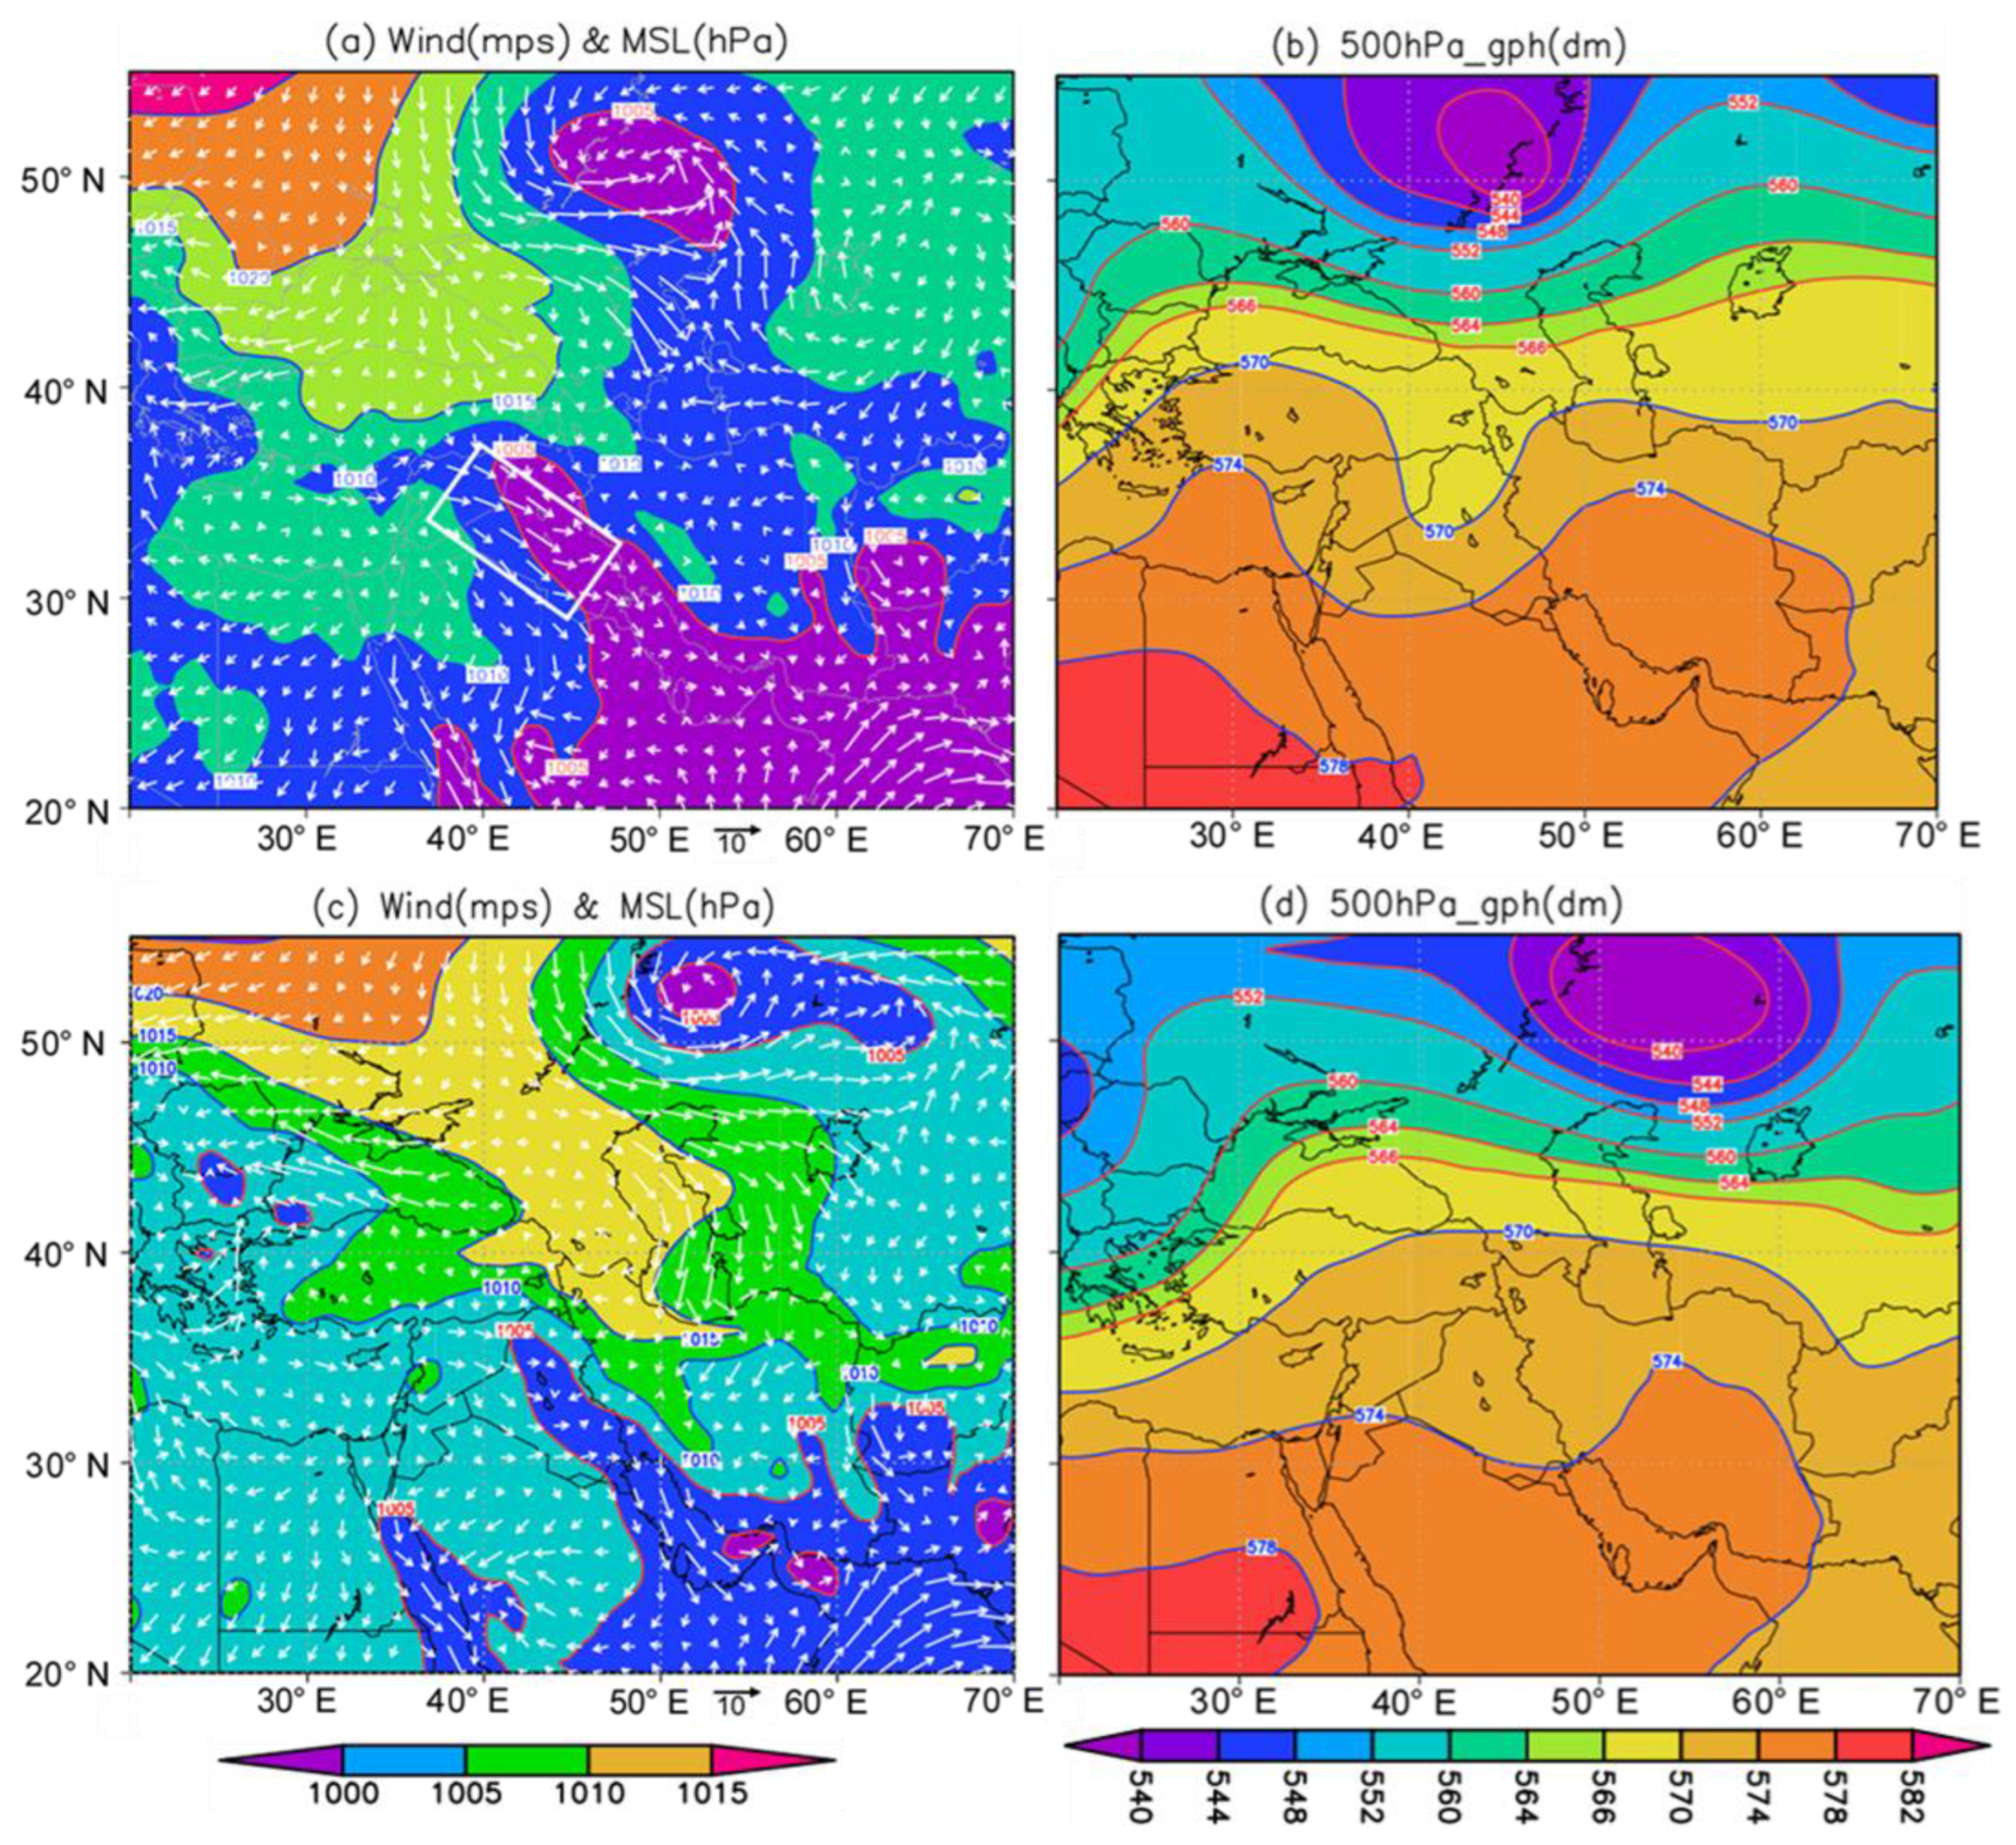
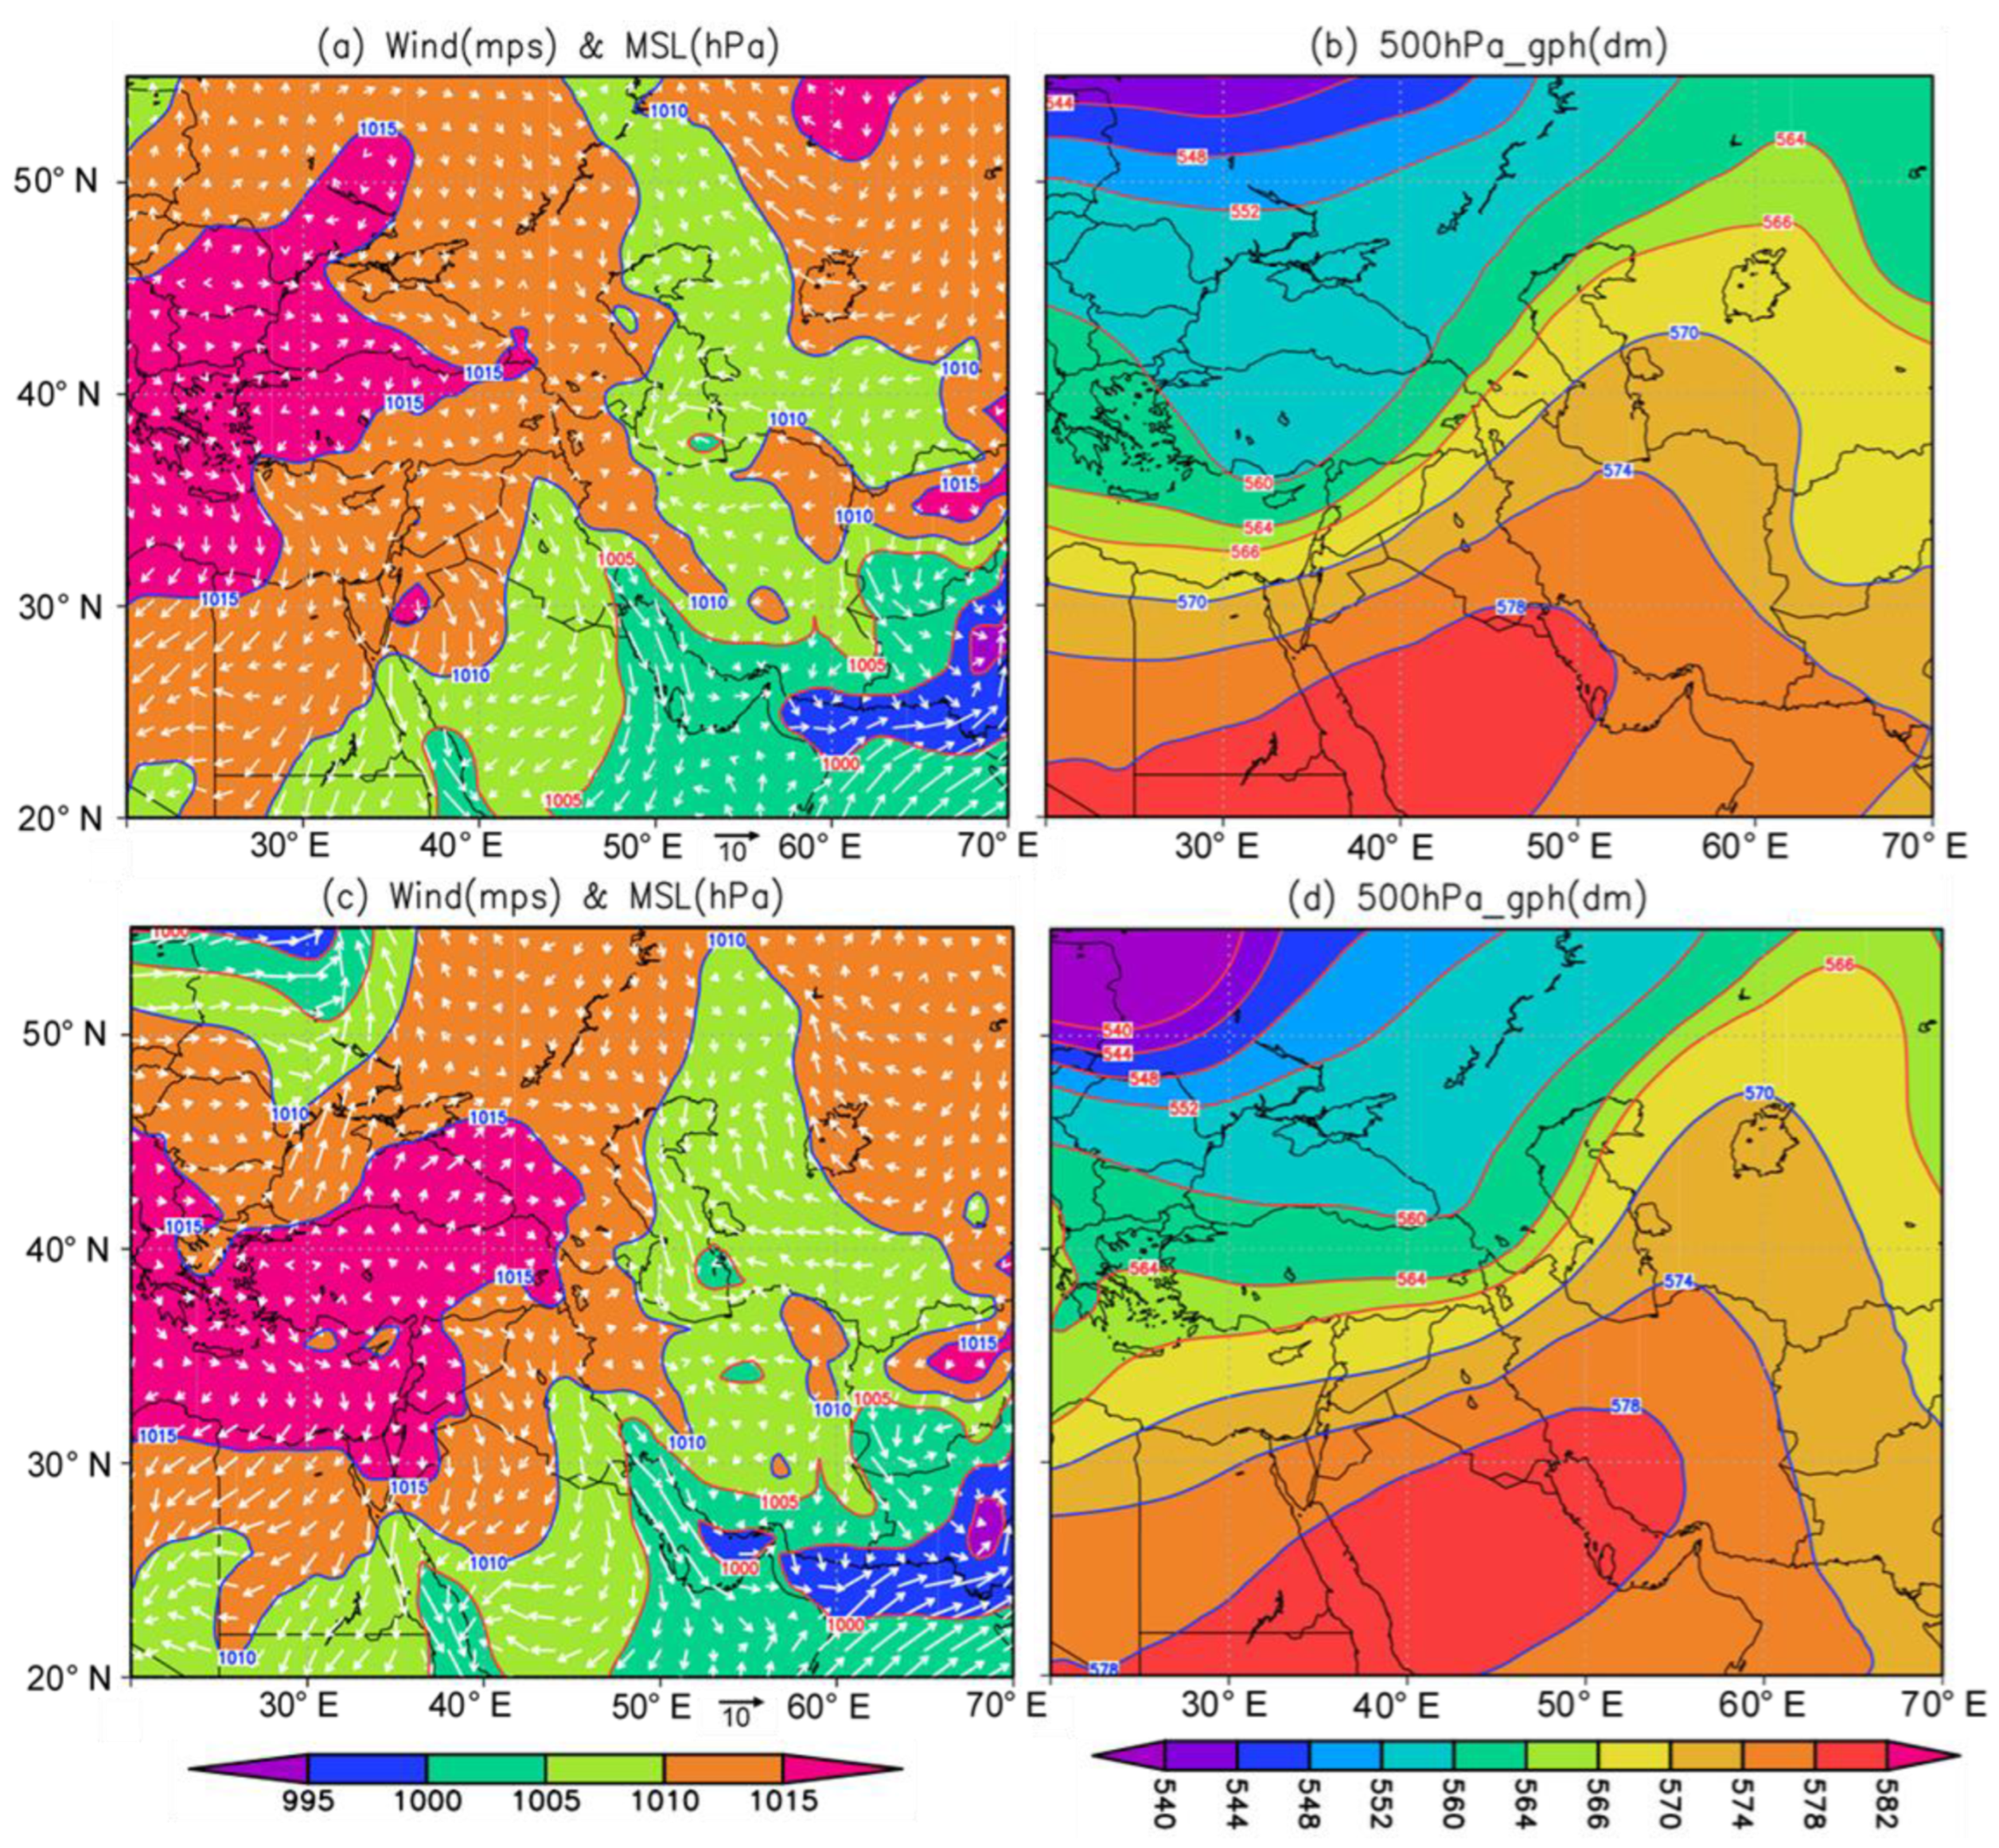
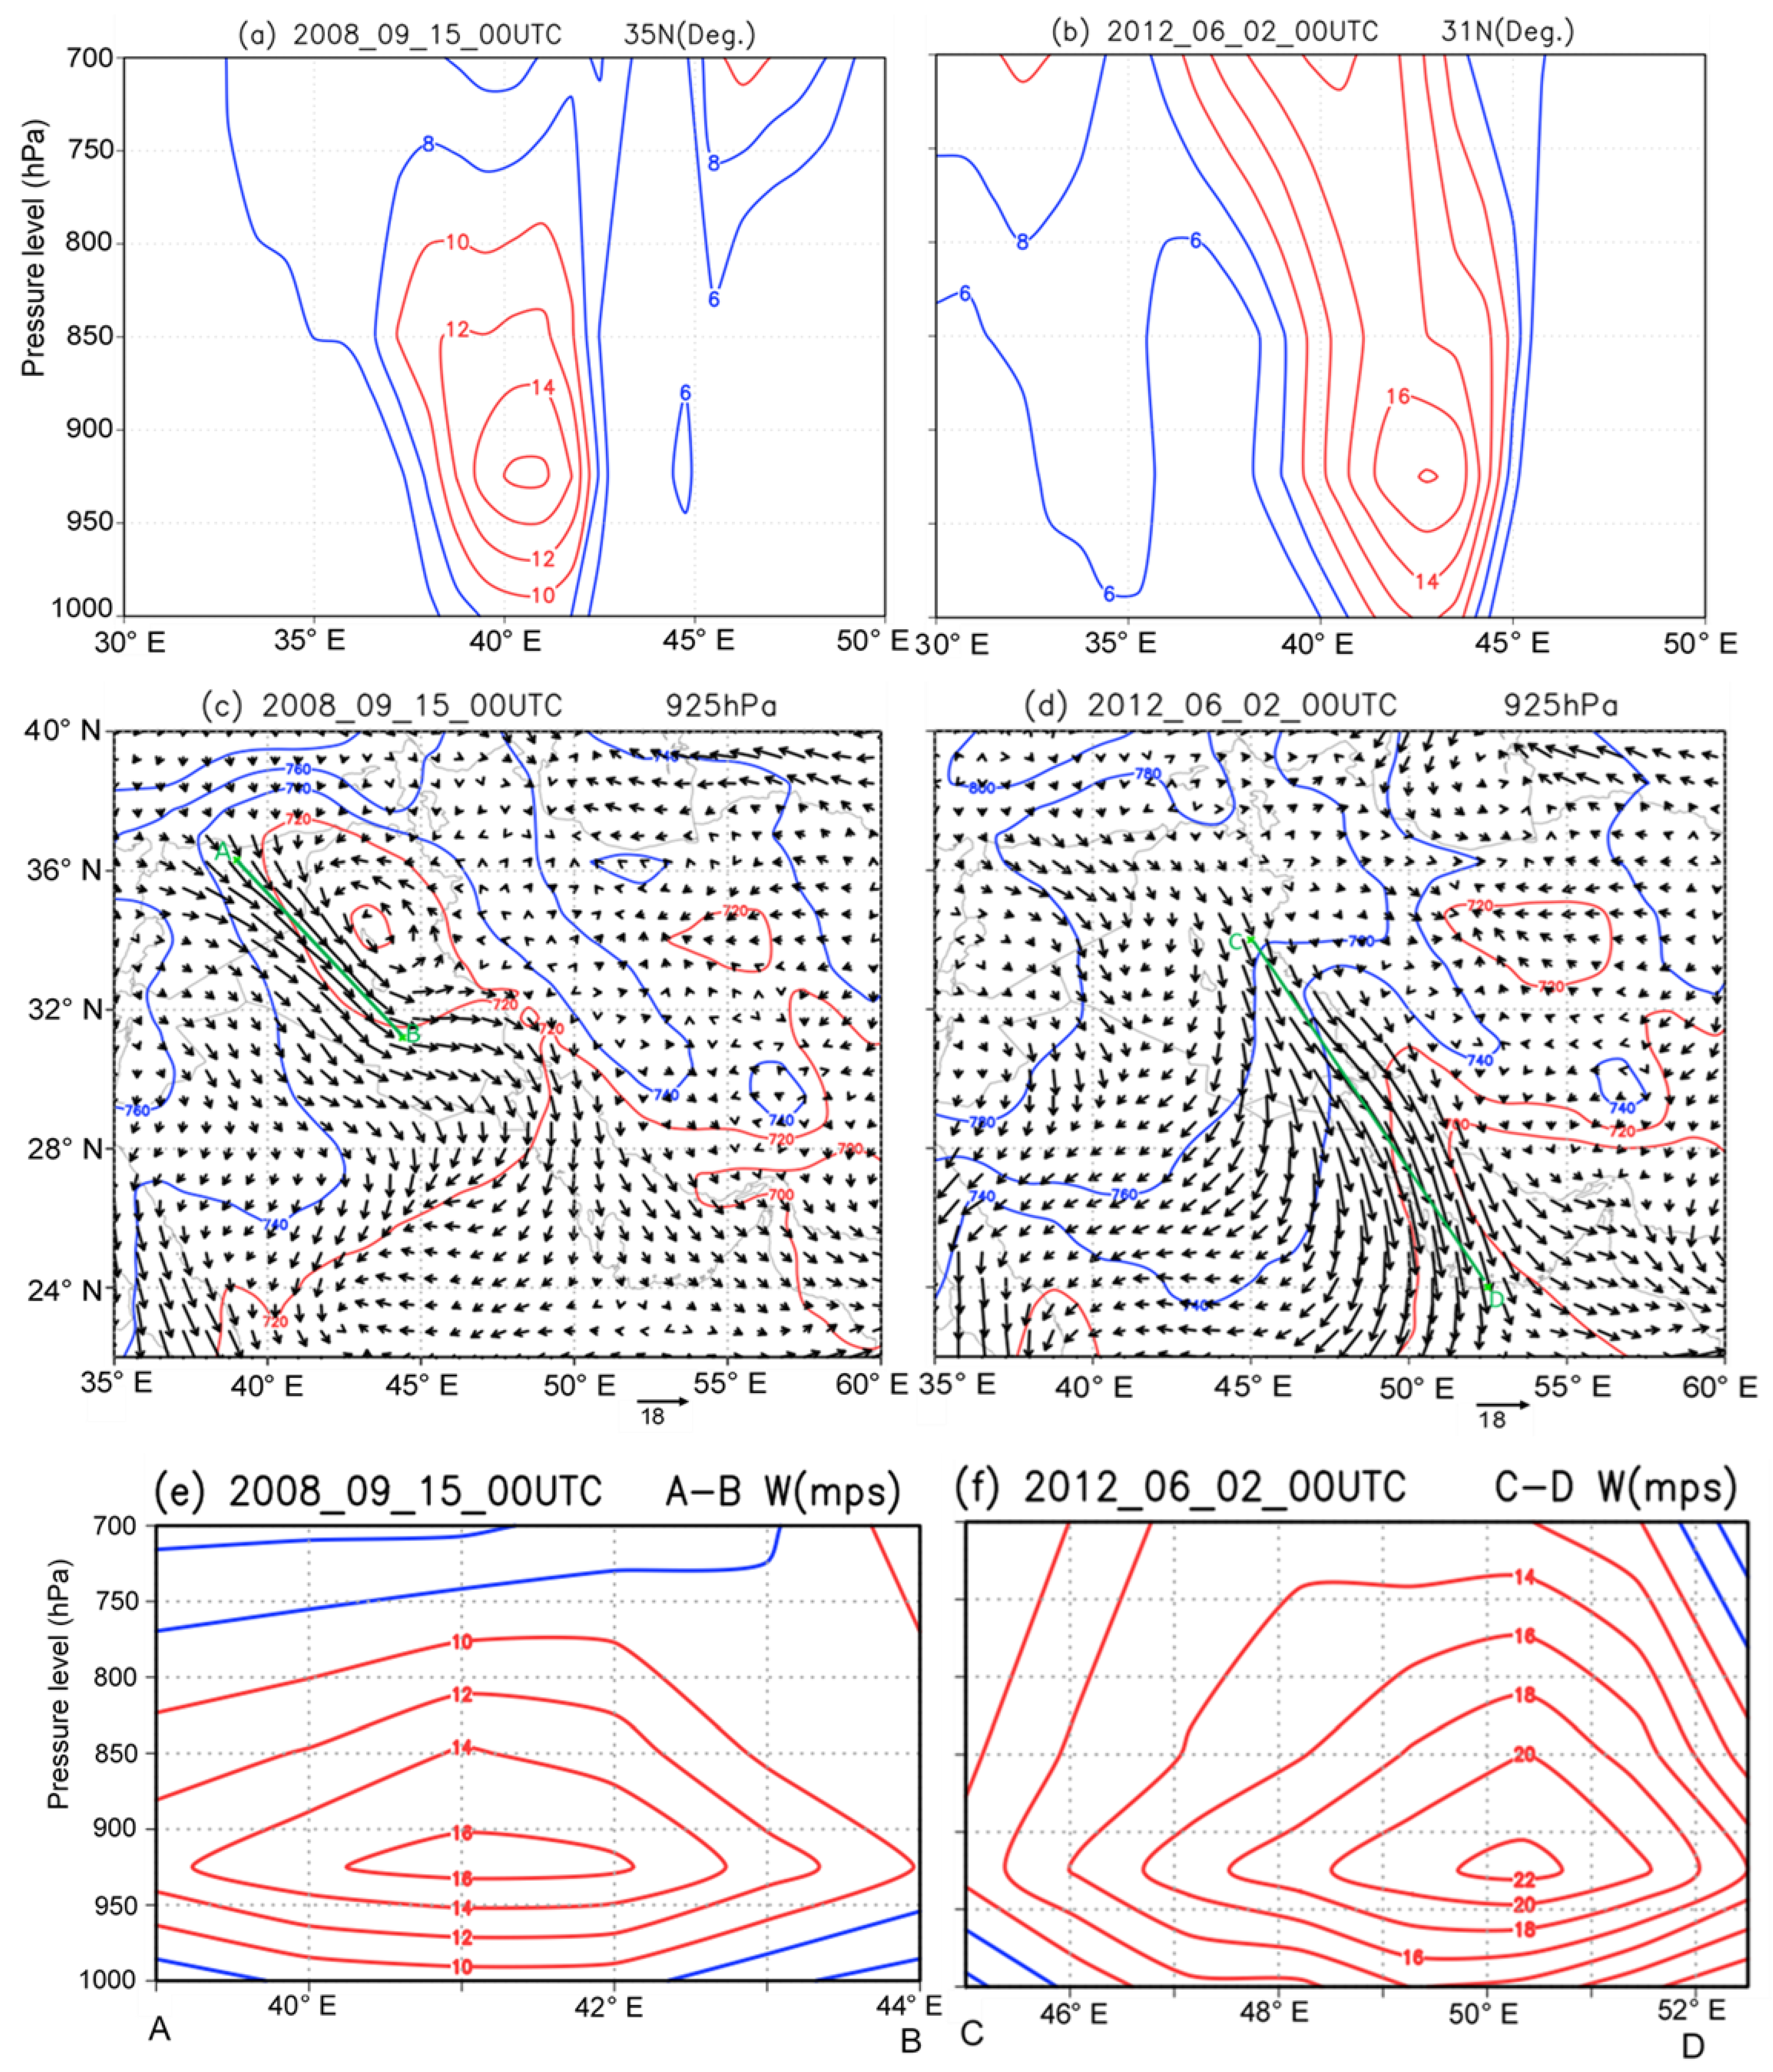
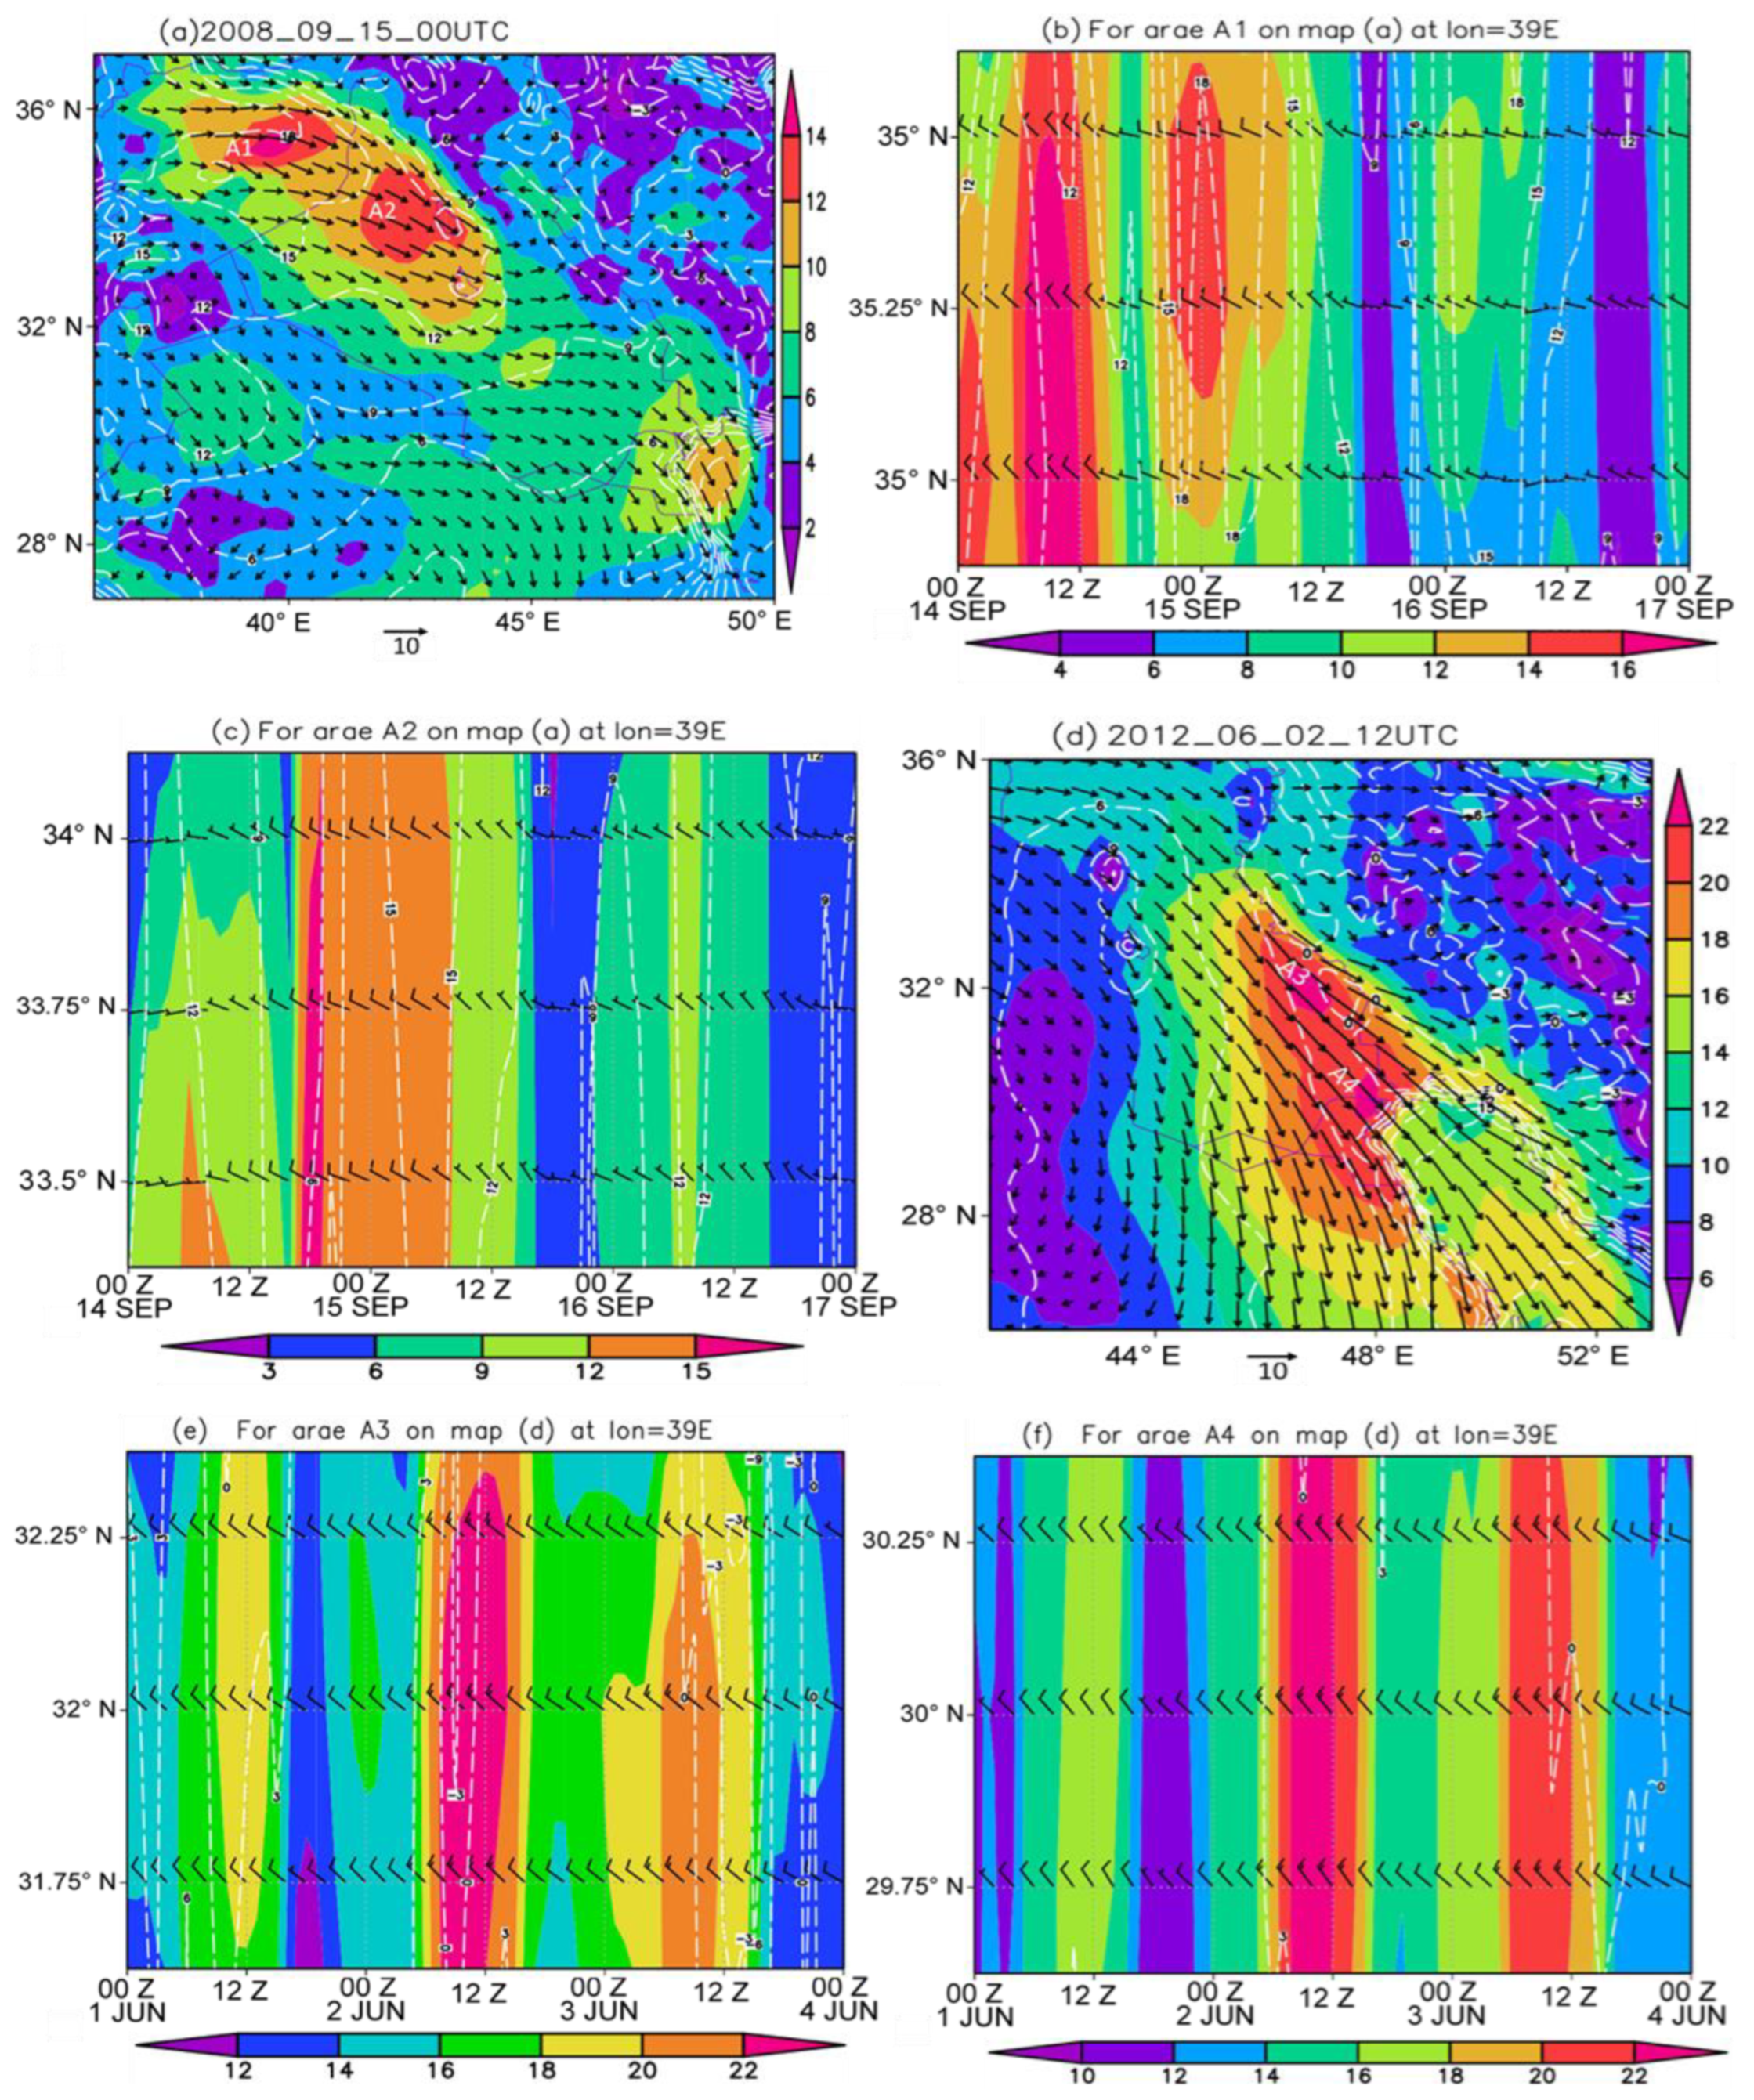
3.3.1. Synoptic Investigation

Figure 3 shows sea level pressure, wind vectors, and the 500-hPa geopotential height at 00UTC on 15 from 16 September 2008. On September 15, a thermal low-pressure system dominated over the southern parts of Iran and the Persian Gulf (PG) with a trough extending to the northwest through the inner continental areas of Iraq and northeast of Syria, hereafter called the PG trough (PGT). The extension of a high-pressure system over the eastern Mediterranean and the Black Sea caused the west–east pressure gradient created in the western parts of the PGT; the topography factors of the region caused strong northwesterly winds (Shamal wind) northwest of Iraq, which accelerated as they move to the central area (Figure 3a). There are cyclonic circulations in northern Iraq, as the winds in the northern and eastern parts are weak due to mountain effects. A deep 500-hPa trough north of Iraq stretches southward to the north of Saudi Arabia (Figure 3b). As the PGT extends to the higher latitudes, it is coupled with the low-pressure system that is associated with the 500-hPa trough and it strengthens this low-pressure system. Therefore, the northern part of the PGT, which is accompanied by a 500-hPa trough, can create stronger vertical motions. Consequently, due to low-level strong winds and dust sources in northern Iraq, large amounts of dust were lifted into the air in this area (Figure 3a). As a result, the dust was lifted in northern Iraq; severe low-level northwesterly, vertical motions, and upper-level westerly winds brought these dust particles into the western borders of Iran.
At 00UTC on September 16, the thermal low-pressure system was strengthened over the PG compared to the previous day and the PGT was still in the area; the west–east pressure gradient and the upper-air disturbances were very weak, as a result, the northwesterly winds weakened (Figure 3c,d). At 500 hPa, the trough located over Iraq weakened and relocated to the east (Figure 3d). Therefore, in the southeast of Iraq and southwest of Iran, there are weak troughs where upward motions in front of the axis have caused dust to rise to higher elevations above ground level.
In this case, most of the dust that rose originated from the dust source located in northern Iraq (S1 in Figure 1). In addition to the role of northwestern currents that transport dust to southwestern Iran, due to the divergence created ahead of the upper trough, the upward motions were strengthened at lower altitudes, which led to the transport of dust to western Iran (Kermanshah and Ilam stations).
Figure 4 shows the sea level pressure, wind vectors, and 500-hPa geopotential height at 00 UTC on 1 and 2 June 2012. On 1 June 2012, a thermal low-pressure system extended from Pakistan to the PG with a limited PGT (Figure 4a). An extensive high-pressure system located over the Mediterranean Sea and Turkey with two ridges extended over the Zagros Mountain and northwest of Saudi Arabia. Such a synoptic circulation pattern supports the downslope northwesterly winds with a west–east pressure gradient as the background force. Therefore, there were strong northwesterly winds in the southeast of Iraq and northwest of the PG (Figure 4a). At a 500-hPa level, a long-wave trough with a strong contour gradient over Syria and Iraq was located over the eastern Mediterranean (Figure 4b).
At 00 UTC on 2 June, the high-pressure system was strengthened and moved to the east, and the PGT was located between the two ridges of this high-pressure system; strong northwesterly winds prevailed in southern Iraq and north of the PG (Figure 4c). The 500-hPa level trough moved rapidly to the east and situated in northwestern Iran (Figure 4d). This upper-air disturbance and the high pressure strengthened over Iraq combined and induced strong northwesterly winds in southern Iraq and north of the PG (Figure 4c). In this case, it appears that S2 (dust source in Figure 1) was more active and only the areas of southwestern Iran and north of the PG were affected by the dust.
The vertical cross-section of the wind speed was assessed for the dust event days. The structure and persistence of low-level jets (LLJs) were investigated at 00 and 12 UTC on 15 and 16 September 2008 at latitudes of 35, 34, and 33° N, and on 1, 2, and 3 June 2012 at latitudes of 35, 33, and 31° N. LLJs occurred on 1–3 June 2012 and 15 and 16 September 2008 (only the figures of two particular times, i.e., 00 UTC on 15 September and 2 June, are shown).
To identify the characteristics of LLJs that play important roles in the emission and transport of dust in the region, we examined a sequence of vertical cross-sections (from 23° N to 37° N) from a long-jet wind speed at 00 UTC on 15 September 2008 and 2 June 12 (Table 3). In the first case study (15 September 2008), the LLJ was about 500 km in length and its core width was between 100 and 200 km, often between 930–900 hPa levels; its maximum speed (16 ms−1) occurred from 35° N to 33° N latitudes.
At 00UTC on 15 September 2008, the jet core and its width were about 16 ms−1 and 100 km, respectively (Figure 5a), locating in the northwestern regions of Iraq and northeastern Syria (at 35° N and 40–41° E); thus, the jet was stronger at higher latitudes (35° N and 34° N) than at lower latitudes (32° N). Therefore, conditions were favorable for the lifting of dust sources located in northwestern Iraq and northeastern Syria. On 1, 2, and 3 June, LLJs form from central Iraq intensified and extended to the lower latitudes (north of the Persian Gulf). For example, at 00 UTC on 2 June, the speed and width were about 8 ms−1 and 200 km, respectively, at 35° N, while at 31° N, the maximum speed reached 18 ms−1 but was narrower in size (Figure 5b). At this time, the jets were contained in the lowest 1000–870 hPa layer and the jet core was located at about 930–900 hPa. The intensity and vertical extension of the jet core, being strong and shallow at 00 UTC, was weak but deep at 12 UTC due to turbulent mixing. In the studied cases at 00 UTC, most of the jet cores were at the 930 to 910 hPa levels; therefore, the wind and geopotential height fields of the 925 hPa level at 00 UTC on 15 September 2008 and on 2 June 2012 were assessed. At 00 UTC, 15 September, a low-level cyclonic system in the lower troposphere, with an axis that was oriented from southeast to northwest (the PGT direction), was located over northern Iraq. Due to the high gradient contour, strong northwesterly winds were created over the southwestern parts of this axis. At 00 UTC on 2 June, a 925 hPa basin-inverted trough north of the PG stretched from the southeast to the northwest over southern Iraq (Figure 5d). Thus, the strong northwest–southeast contour gradient was the main force to produce the LLJ in the north of the PG.
The topography surrounding Mesopotamia and north of the PG plays a major role in the development of LLJs through the interaction of meteorological conditions and mountain forces. To investigate the structure and vertical expansion of the LLJ for the studied cases, the vertical cross-sections of the wind speed along the lines from A to B in Figure 5c and from C to D in Figure 5d at 00 UTC on 15 September 2008 and 2 June 2012 are shown in Figure 5e,f.
Figure 6a,d shows 10 m of wind gust (WG), 10 m of wind vector (WV), and 2 m of dew point temperature (Td) at 00UTC on 15 September 2008 and 12UTC on 2 June 2012, respectively. Strong westerly and northwesterly winds prevailed in northeastern Syria (marked as A1 in Figure 6a) and in northern Iraq (marked as A2 in Figure 6a), where the wind speeds in these two areas reached more than 14 ms−1 (Figure 6a). According to the satellite images, these two areas are sources of dust and many suspended particles have risen to the atmosphere from these areas. The 2 m dew point temperature pattern indicates the extent of high humidity from Syria to Iraq and extends to the north of the Persian Gulf, so humidity decreases from the northwest to southeast along the wind direction (Figure 6a). The time series of WG, WV, and Td variations from 00 UTC on 14 September to 00UTC on 22 September 2008 for the A1 and A2 regions are shown in Figure 6b,c, respectively. During this period, the wind speed of the A1 region reached more than 10 ms−1 from the 14th day to about 12 UTC on the 15th day, and the maximum level of northwesterly winds (more than 16 ms−1) with a decrease in humidity (Td) occurred on June 14 (Figure 6b). In the A2 area, strong northwest winds occurred from the evening of the 14th day to noon on the 15th day (Figure 6c). The maximum amount of wind occurred with a time delay compared to the A1 area at night, which is associated with a decrease in humidity.
In the second case study, (1–3 June 2012), strong northwesterly winds prevailed in southeastern Iraq. During this period, the surface wind speed at 12 UTC on 2 June had the highest value, recording more than 22 ms−1 in A3 and A4 (marked in Figure 6d). Therefore, in this period, the main dust source was from the S2 region as shown in Figure 1; due to the smaller area of this source and other meteorological conditions, the scale of dust lifted, in this case, was smaller compared to the previous case. The time series of WG, WV, and Td variations from 00UTC on June 1 to 00UTC on June 4 for the A3 and A4 regions are shown in Figure 6e,f, respectively. As in the previous case, the speeds of the northwest winds were associated with the low humidity in these areas.

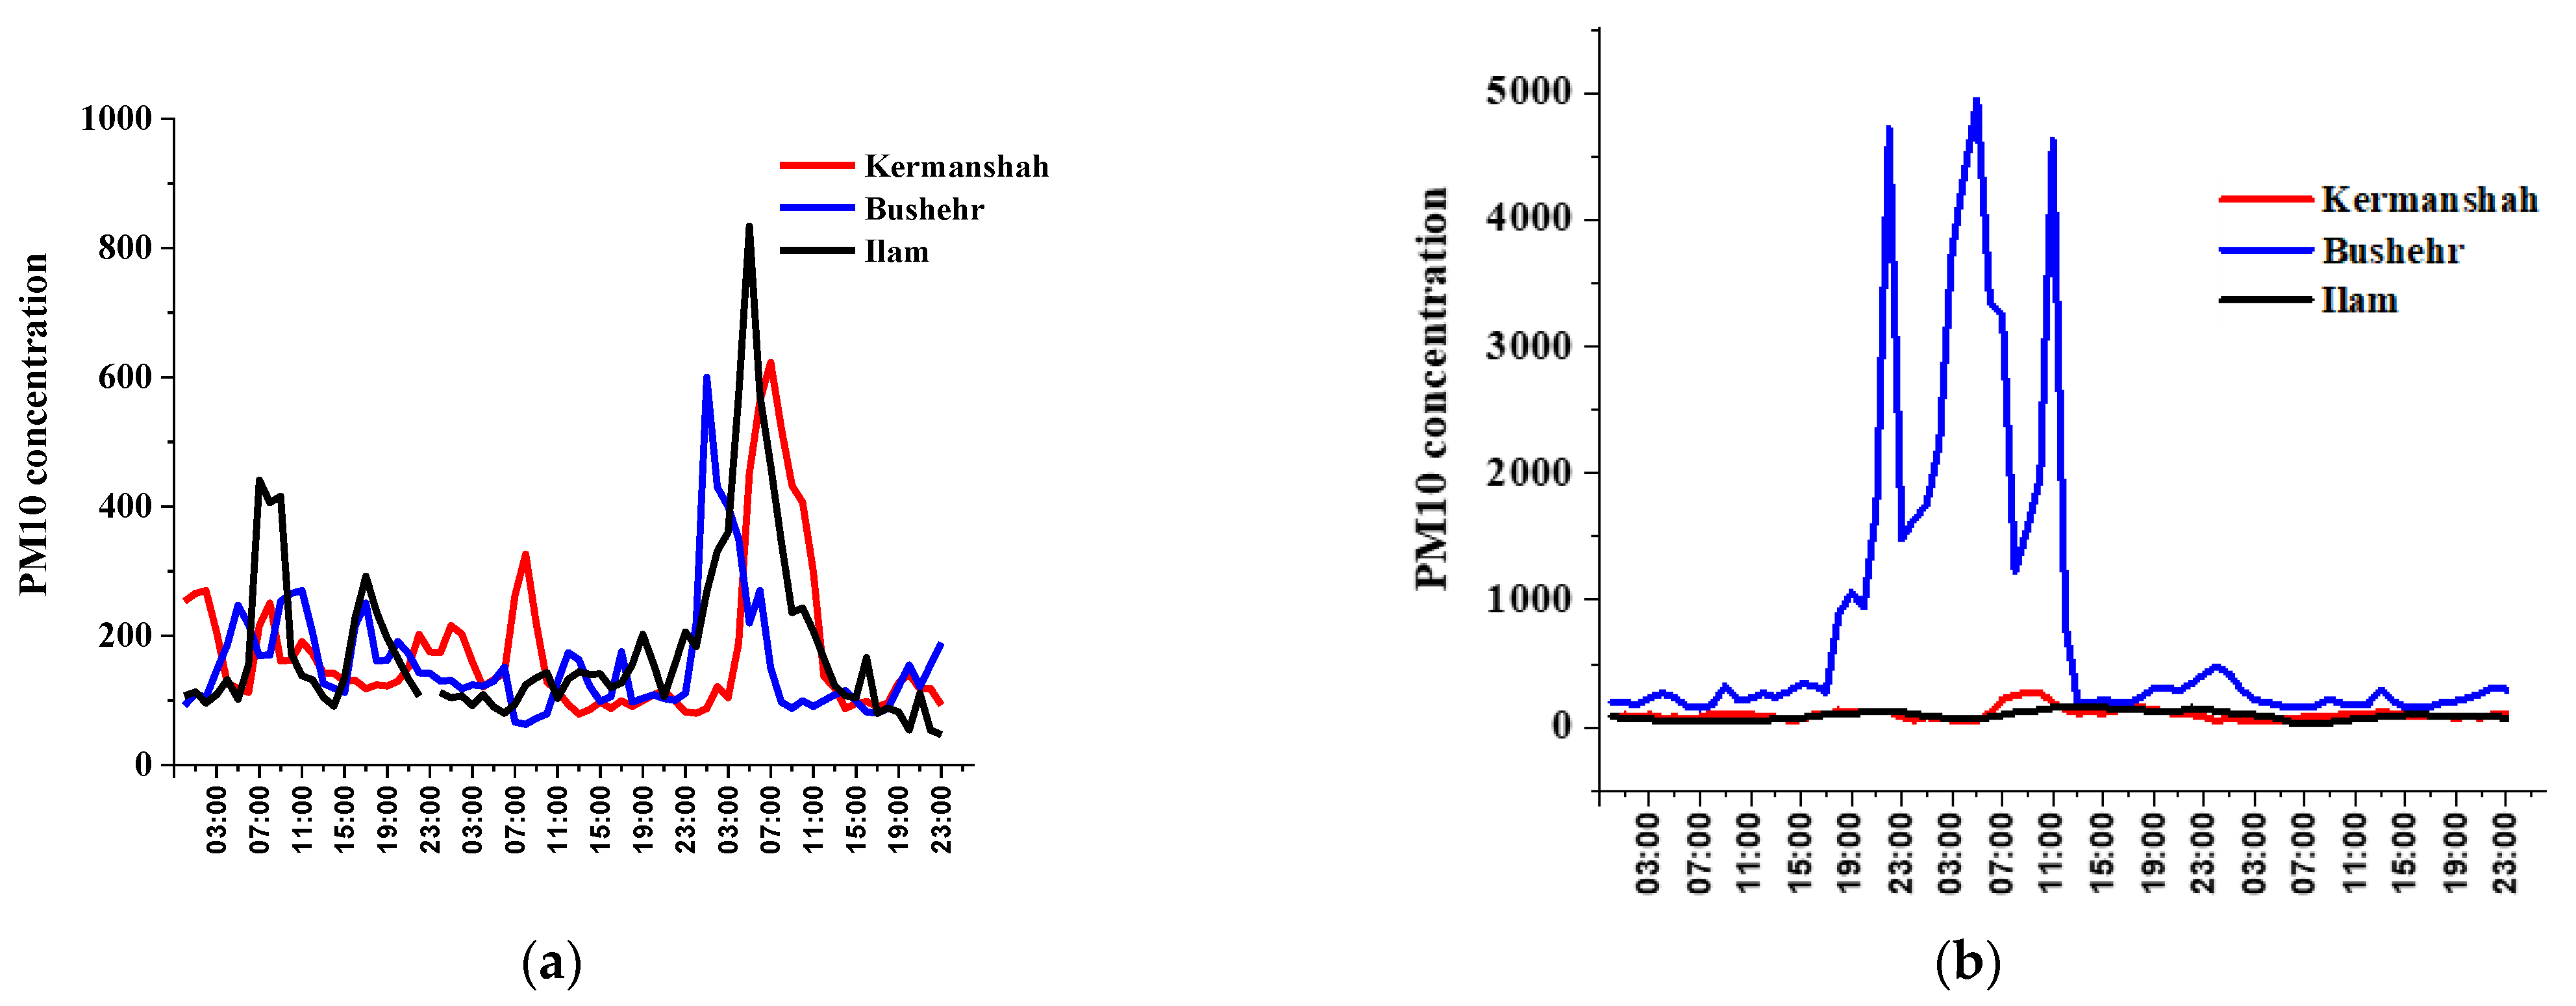
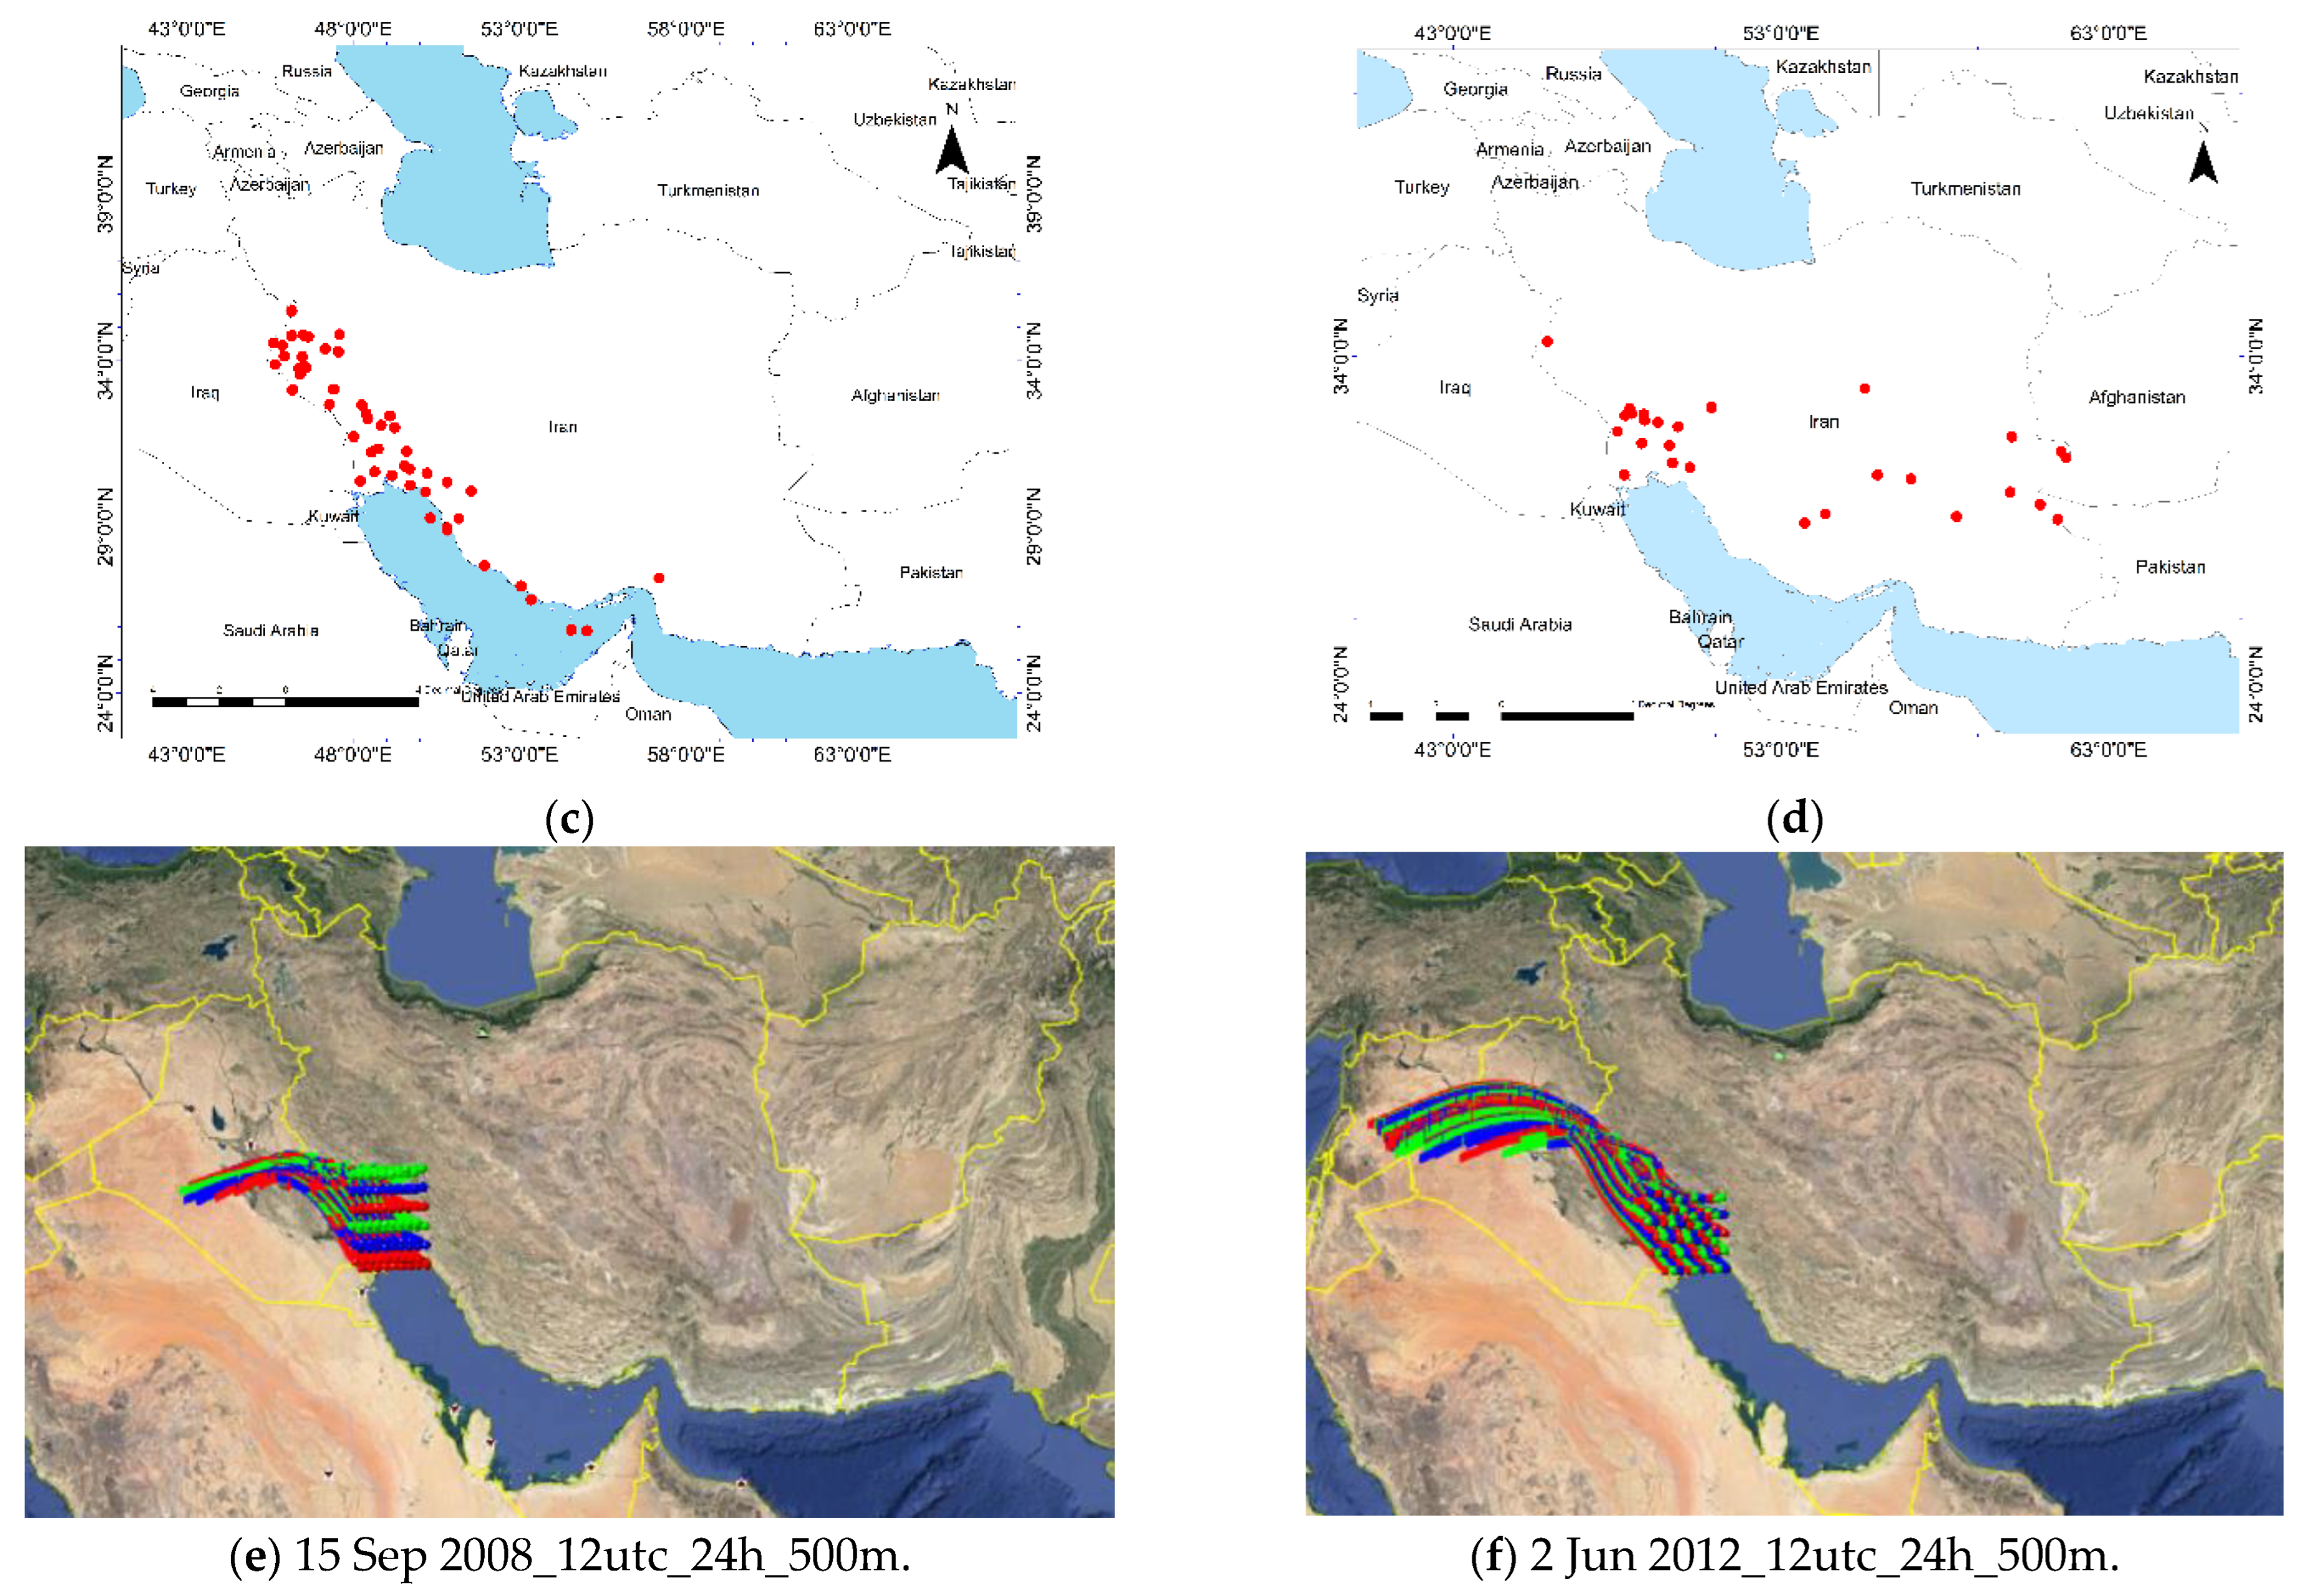
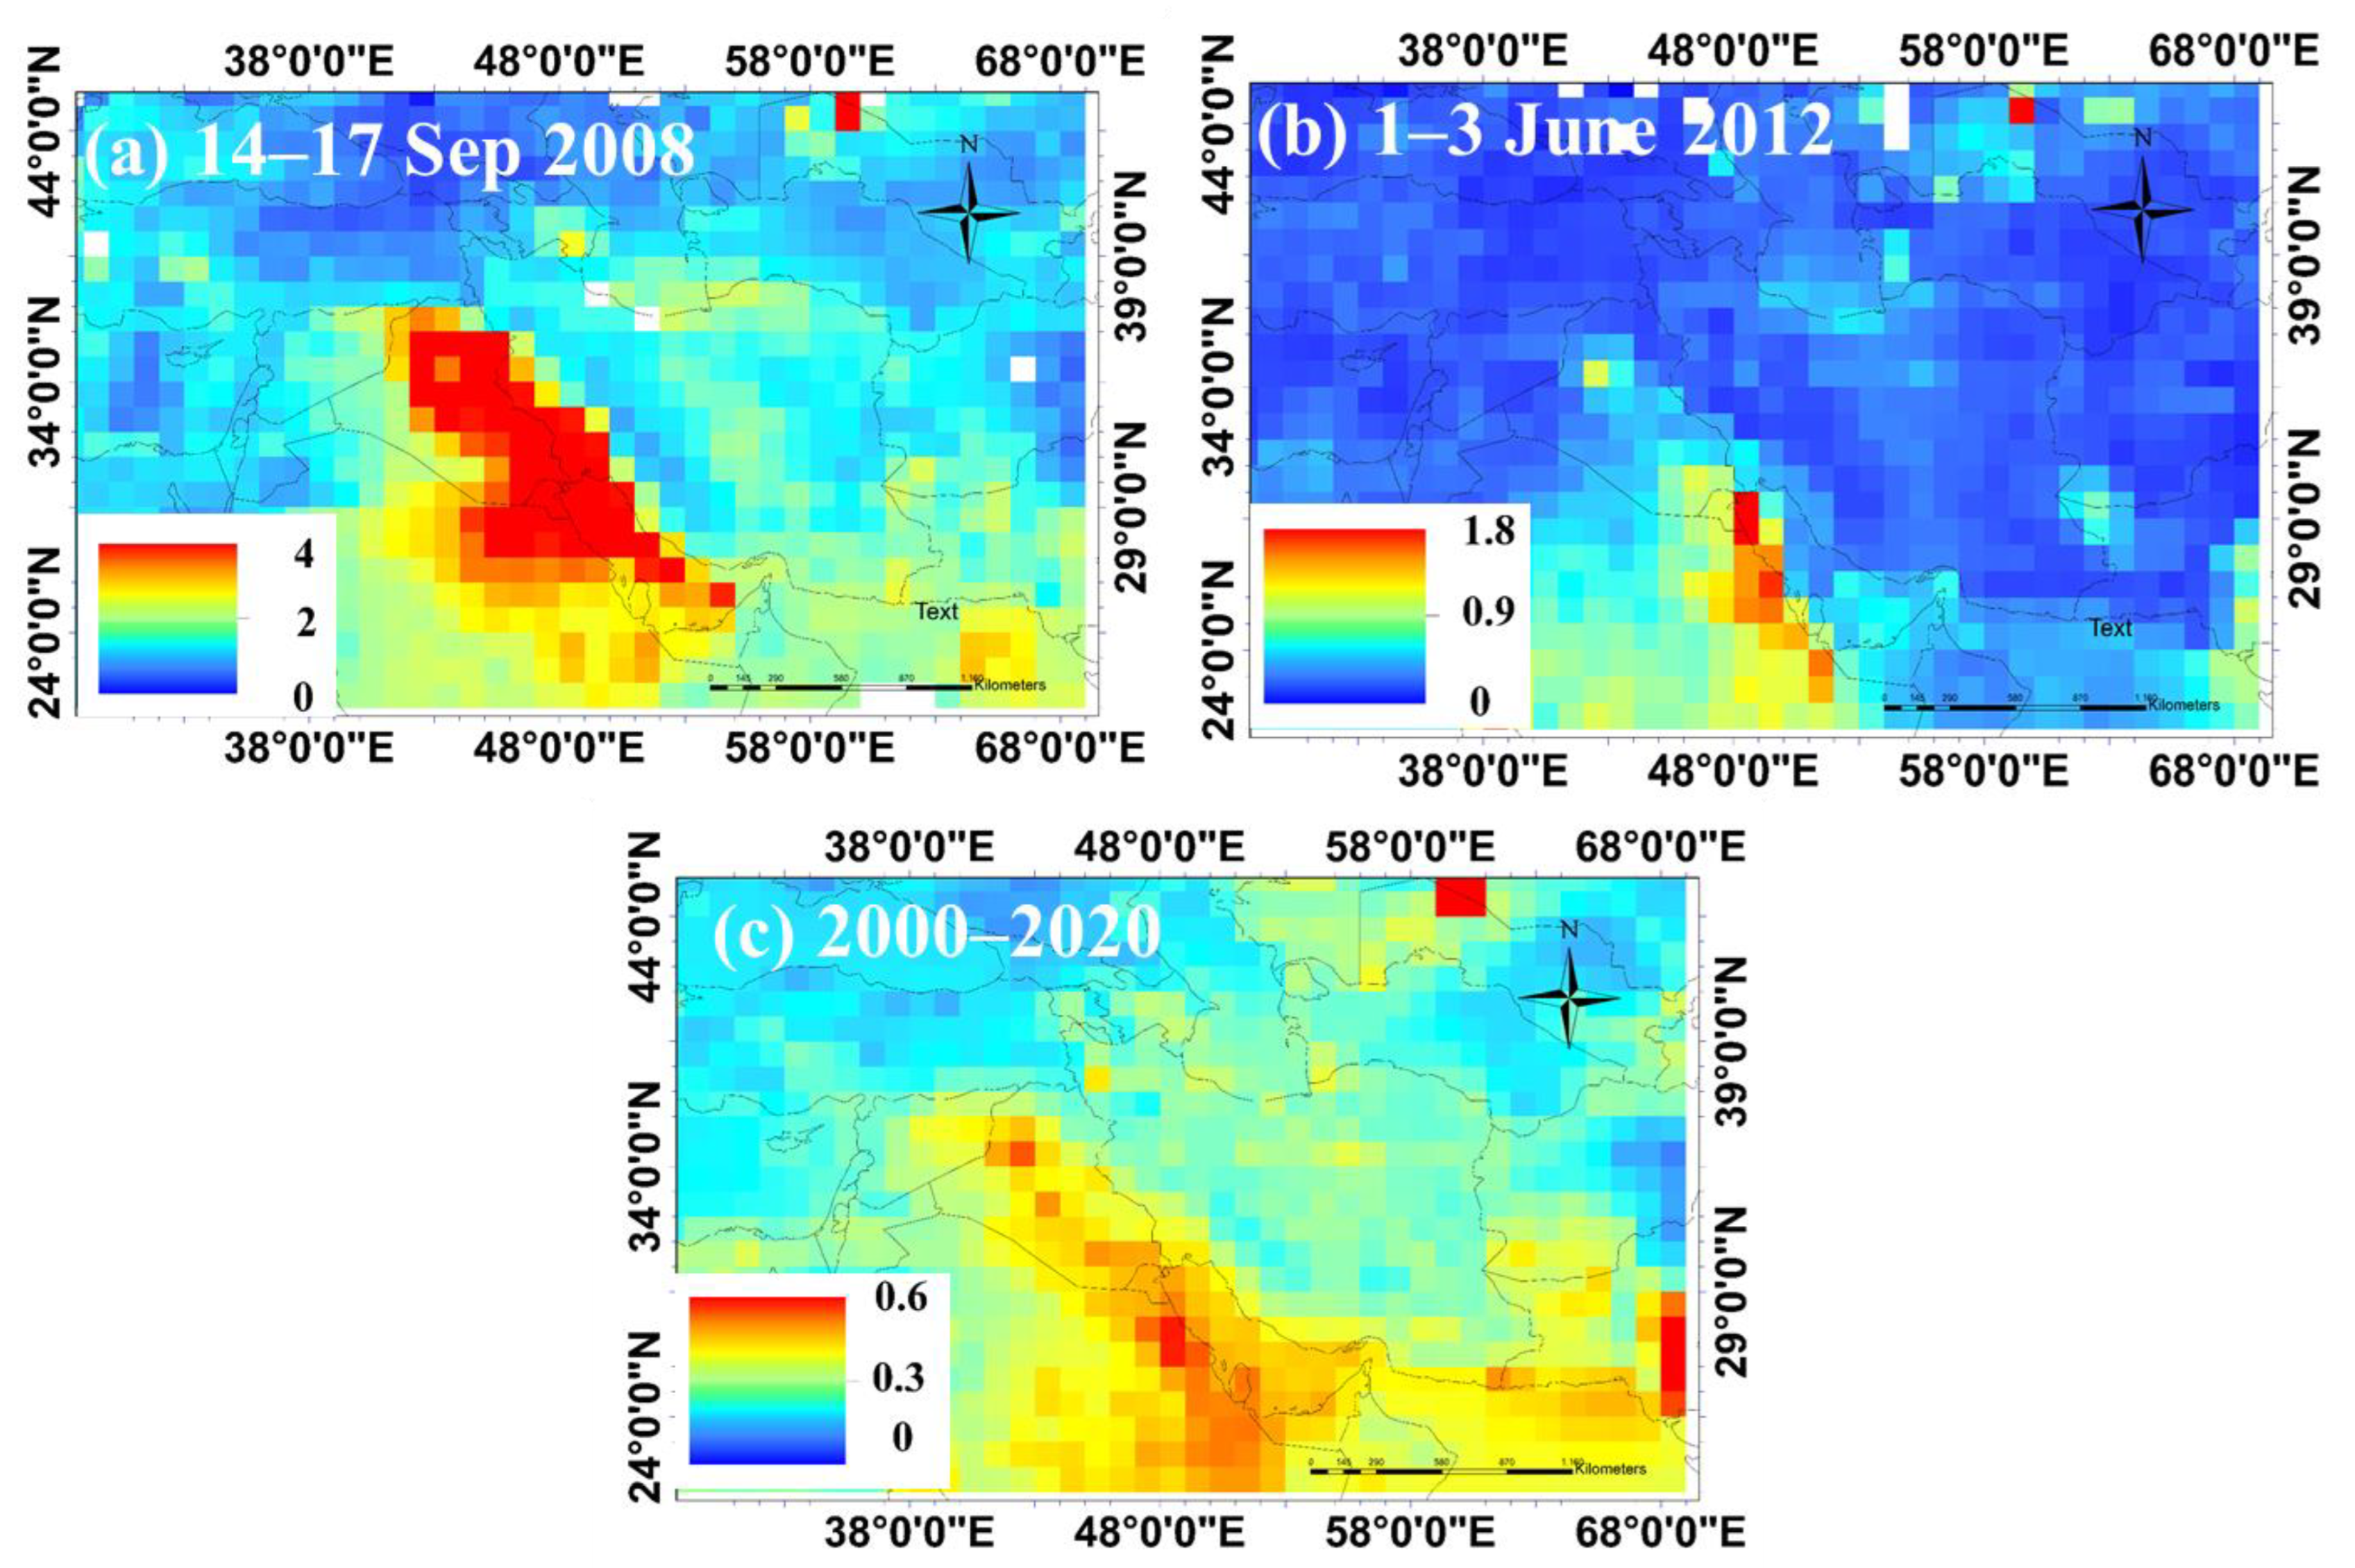
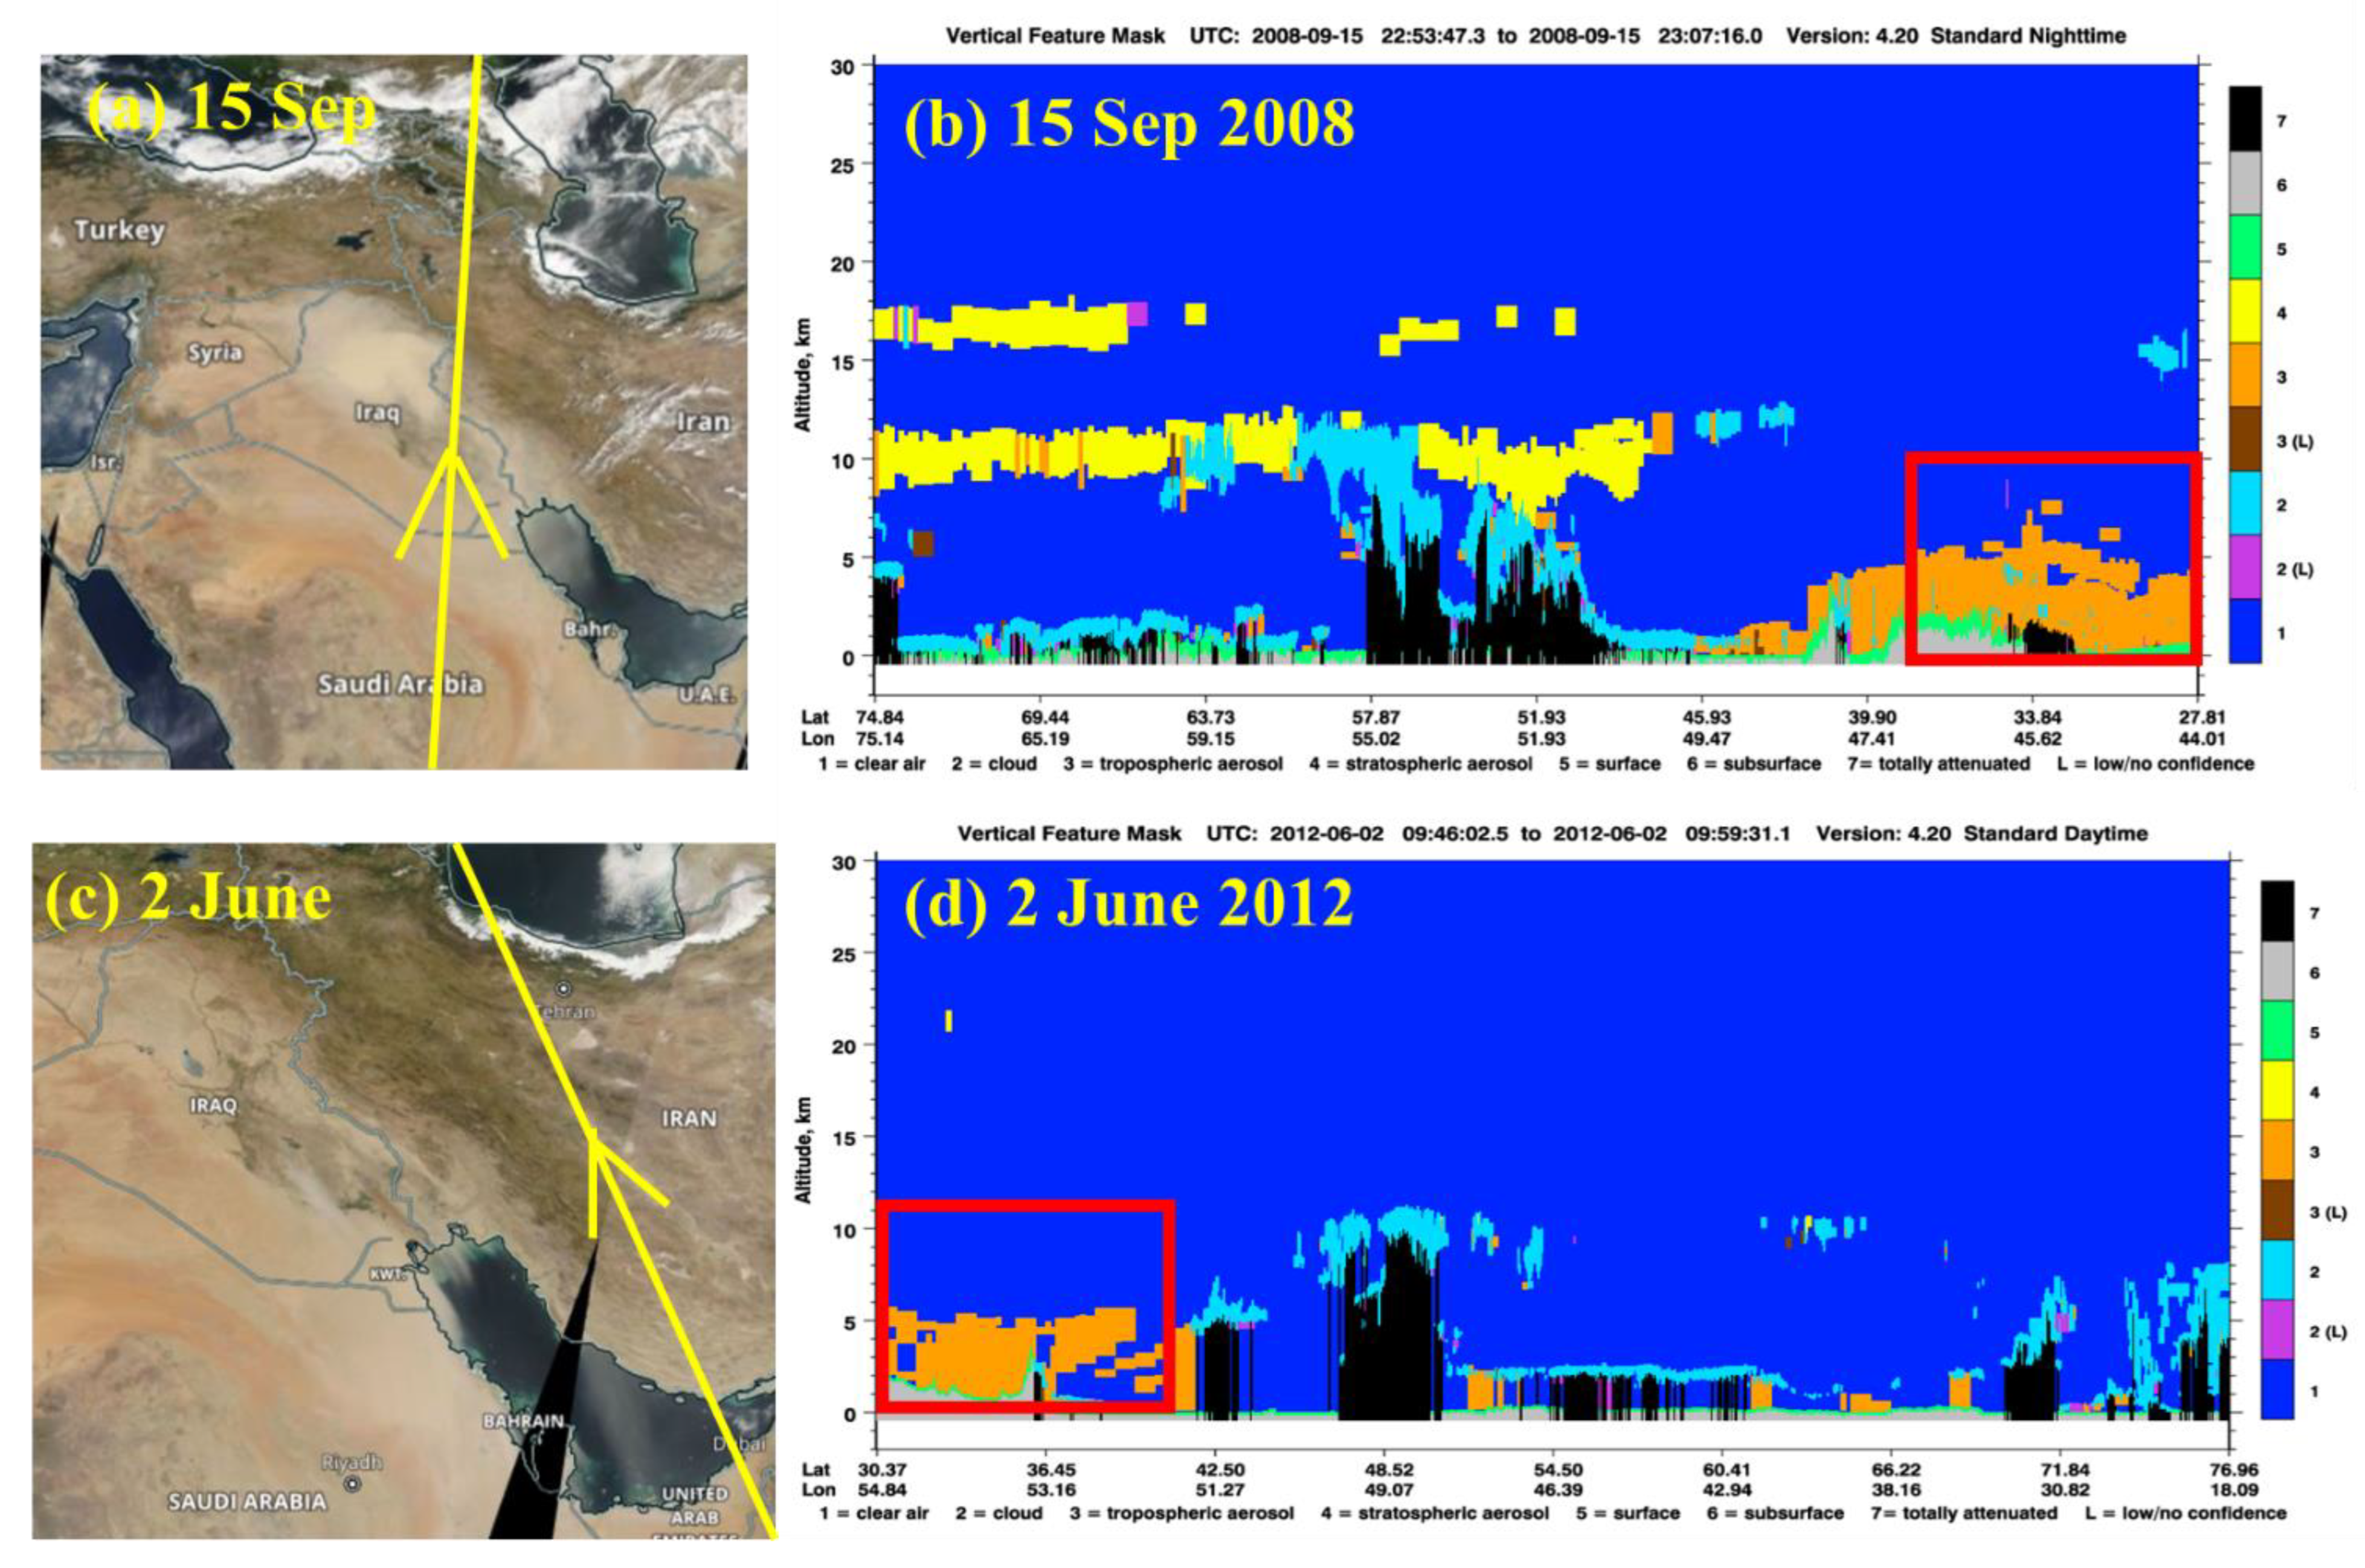
3.3.2. Ground Measurement and Satellite Observation

The measured P M 10 concentrations from two stations in the west of Iran in both cases (Ilam and Kermanshah) and Bushehr on the northern shore of the Persian Gulf are shown in Figure 7a,b from 14 to 17 September 2008 and 1 to 3 June 2012. In the first case, both stations in the west of Iran reported high surface dust concentrations between 03 and 07 UTC on 17 September. Dust concentrations reached 834 μg m−3 at Ilam station, 623 μg m−3 at Kermanshah station, and 612 μg m−3 at Bushehr station in the north of the Persian Gulf. However, surprisingly, in the second case, at Bushehr station on the north shore of the Persian Gulf, the highest measured P M 10 concentrations were 4947, 4626, and 3759 μg m−3 on 2 and 3 July. Moreover, the measured P M 10 concentrations were higher than 3000 μg m−3 in many measured records at the station. These amounts are much higher than the P M 10 concentrations reported at Ilam and Kermanshah in the west of Iran.
The visibility data under 1 km (red dots) of several Iranian meteorological stations that reported dust storms are shown in Figure 7c,d. Visibility was under 1 km in many stations in the west, southwest, and over the Persian Gulf on 14–17 September 2008, while the other stations in Iran did not report visibility under 1 km and severe dust storms. However, from 1 to 3 June 2012, many weather stations in the southwest, central, and southeast of Iran reported visibility below 1 km. In both cases, the weather stations in SW Iran reported dust with visibility below 1 km, with a weather code 06 (related to nonlocal dust).
Hence, the 24 h backward air mass trajectories obtained from the HYSPLIT model at 500 m were used for SW Iran (Figure 7e,f). Since the dust storms covered a wide area in different parts of Iran, we selected the matrix approach in the HYSPLIT runs in order to identify the dust sources. Satellite images show that the dust storms began on 14 September 2008 and 1 June 2012, so the model ran for 24 h. In both dust storms (on 15 September 2008 and 2 June 2012), the prevailing winds were from northern directions, so dust particles affected the west and southwest of Iran. The HYSPLIT model outputs show that, in both dust storm cases, dust particles came from the west of Iraq, and on 1 June 2012, some of the dust particles came from the eastern deserts of Syria.
Figure 8 shows Terra/MODIS true color imagery during the dust storms on 15–16 September 2008 and 2–3 June 2012, respectively. On 15 September 2008, one of the most intense dust storms originated from deserts in the northern half of Iraq and was affected by northwesterly winds. Thus, dust particles entered the west and southwest of Iran. On 16 September, the dust mass entered the west of Iran and spread over the Persian Gulf (the red circles show the dust masses).
In case 2, a dust mass was obvious over Iraq and the Persian Gulf on 2 June 2012. Moreover, other dust masses were obvious over the Jazmorian basin in the southeast of Iran and Hamun Lake at the borders between Iran, Pakistan, and Afghanistan. On 3 June 2012, the western dust mass mostly spread over the Persian Gulf, and the dust masses over the Jazmorian basin and Hamun Lake in SE Iran spread to the larger areas in the southeast of Iran. It seems that the sharp visibility reductions in the center and east of Iran were not created by the dust masses raised from deserts in Iraq. The Jazmorian basin and Hamun Lake are two dried lake beds where the dust storms originated from; they were investigated in many previous studies [72,73,74,75].
Figure 9 shows the mean Terra/MODIS AOD550 spatial distributions over the Middle East in the two dust storm cases from 2000 to 2020, investigating the AOD550 long pattern over the same area. On a long-term basis (21-year duration), higher AODs are observed over the Persian Gulf, Iraq, Kuwait, northeastern parts of Saudi Arabia, and southwest, south, and southeast Iran. Moreover, in other studies, the same high AOD patterns were observed [75,76]. AOD550 was significantly higher from 14 to 17 September 2008 and the mean AOD550 was near 4 over the Persian Gulf, Kuwait, the vast part of Iraq, and the northern part of Saudi Arabia, showing a significant increase in dust aerosol in the atmosphere [77]. Moreover, AOD550 was higher than 1 (and near 1.8) from 1 to 3 June 2012 in Iraq, Kuwait, the Persian Gulf, and northern parts of Saudi Arabia, showing high dust loadings in these areas.
True-color imagery from Aqua/MODIS was used in the two dust storm events over the Middle East area; CALIPSO overpasses over the region are shown with yellow arrows (first column). In Figure 10, an intense dust plume was detected over northern Iraq and western Iran in the first case while the dust plume was detected over southern Iraq, Kuwait, the Persian Gulf, and northern Saudi Arabia in the second case. According to the CALIPSO profiles, this dust plume rose higher in the first case and dust particles rose higher than 7 km over Mesopotamia toward the eastern Arabian Peninsula; the height of the dust plume did not decrease on 15 September 2008. On 2 June 2012, the dust plumes did not ascend as the first case but rose higher than 5 km in a vast area over the Persian Gulf and south of Iran. It seems that the NAAPS model’s vertical profile output agrees with the CALIPSO vertical profile over the Persian Gulf in this case, and dust rose higher than 5 km (500 hPa). This result is not off; the dust rising occurred at different levels of the atmosphere, and many dust particles reached 5 km (or even 6 km) in height [78,79,80].

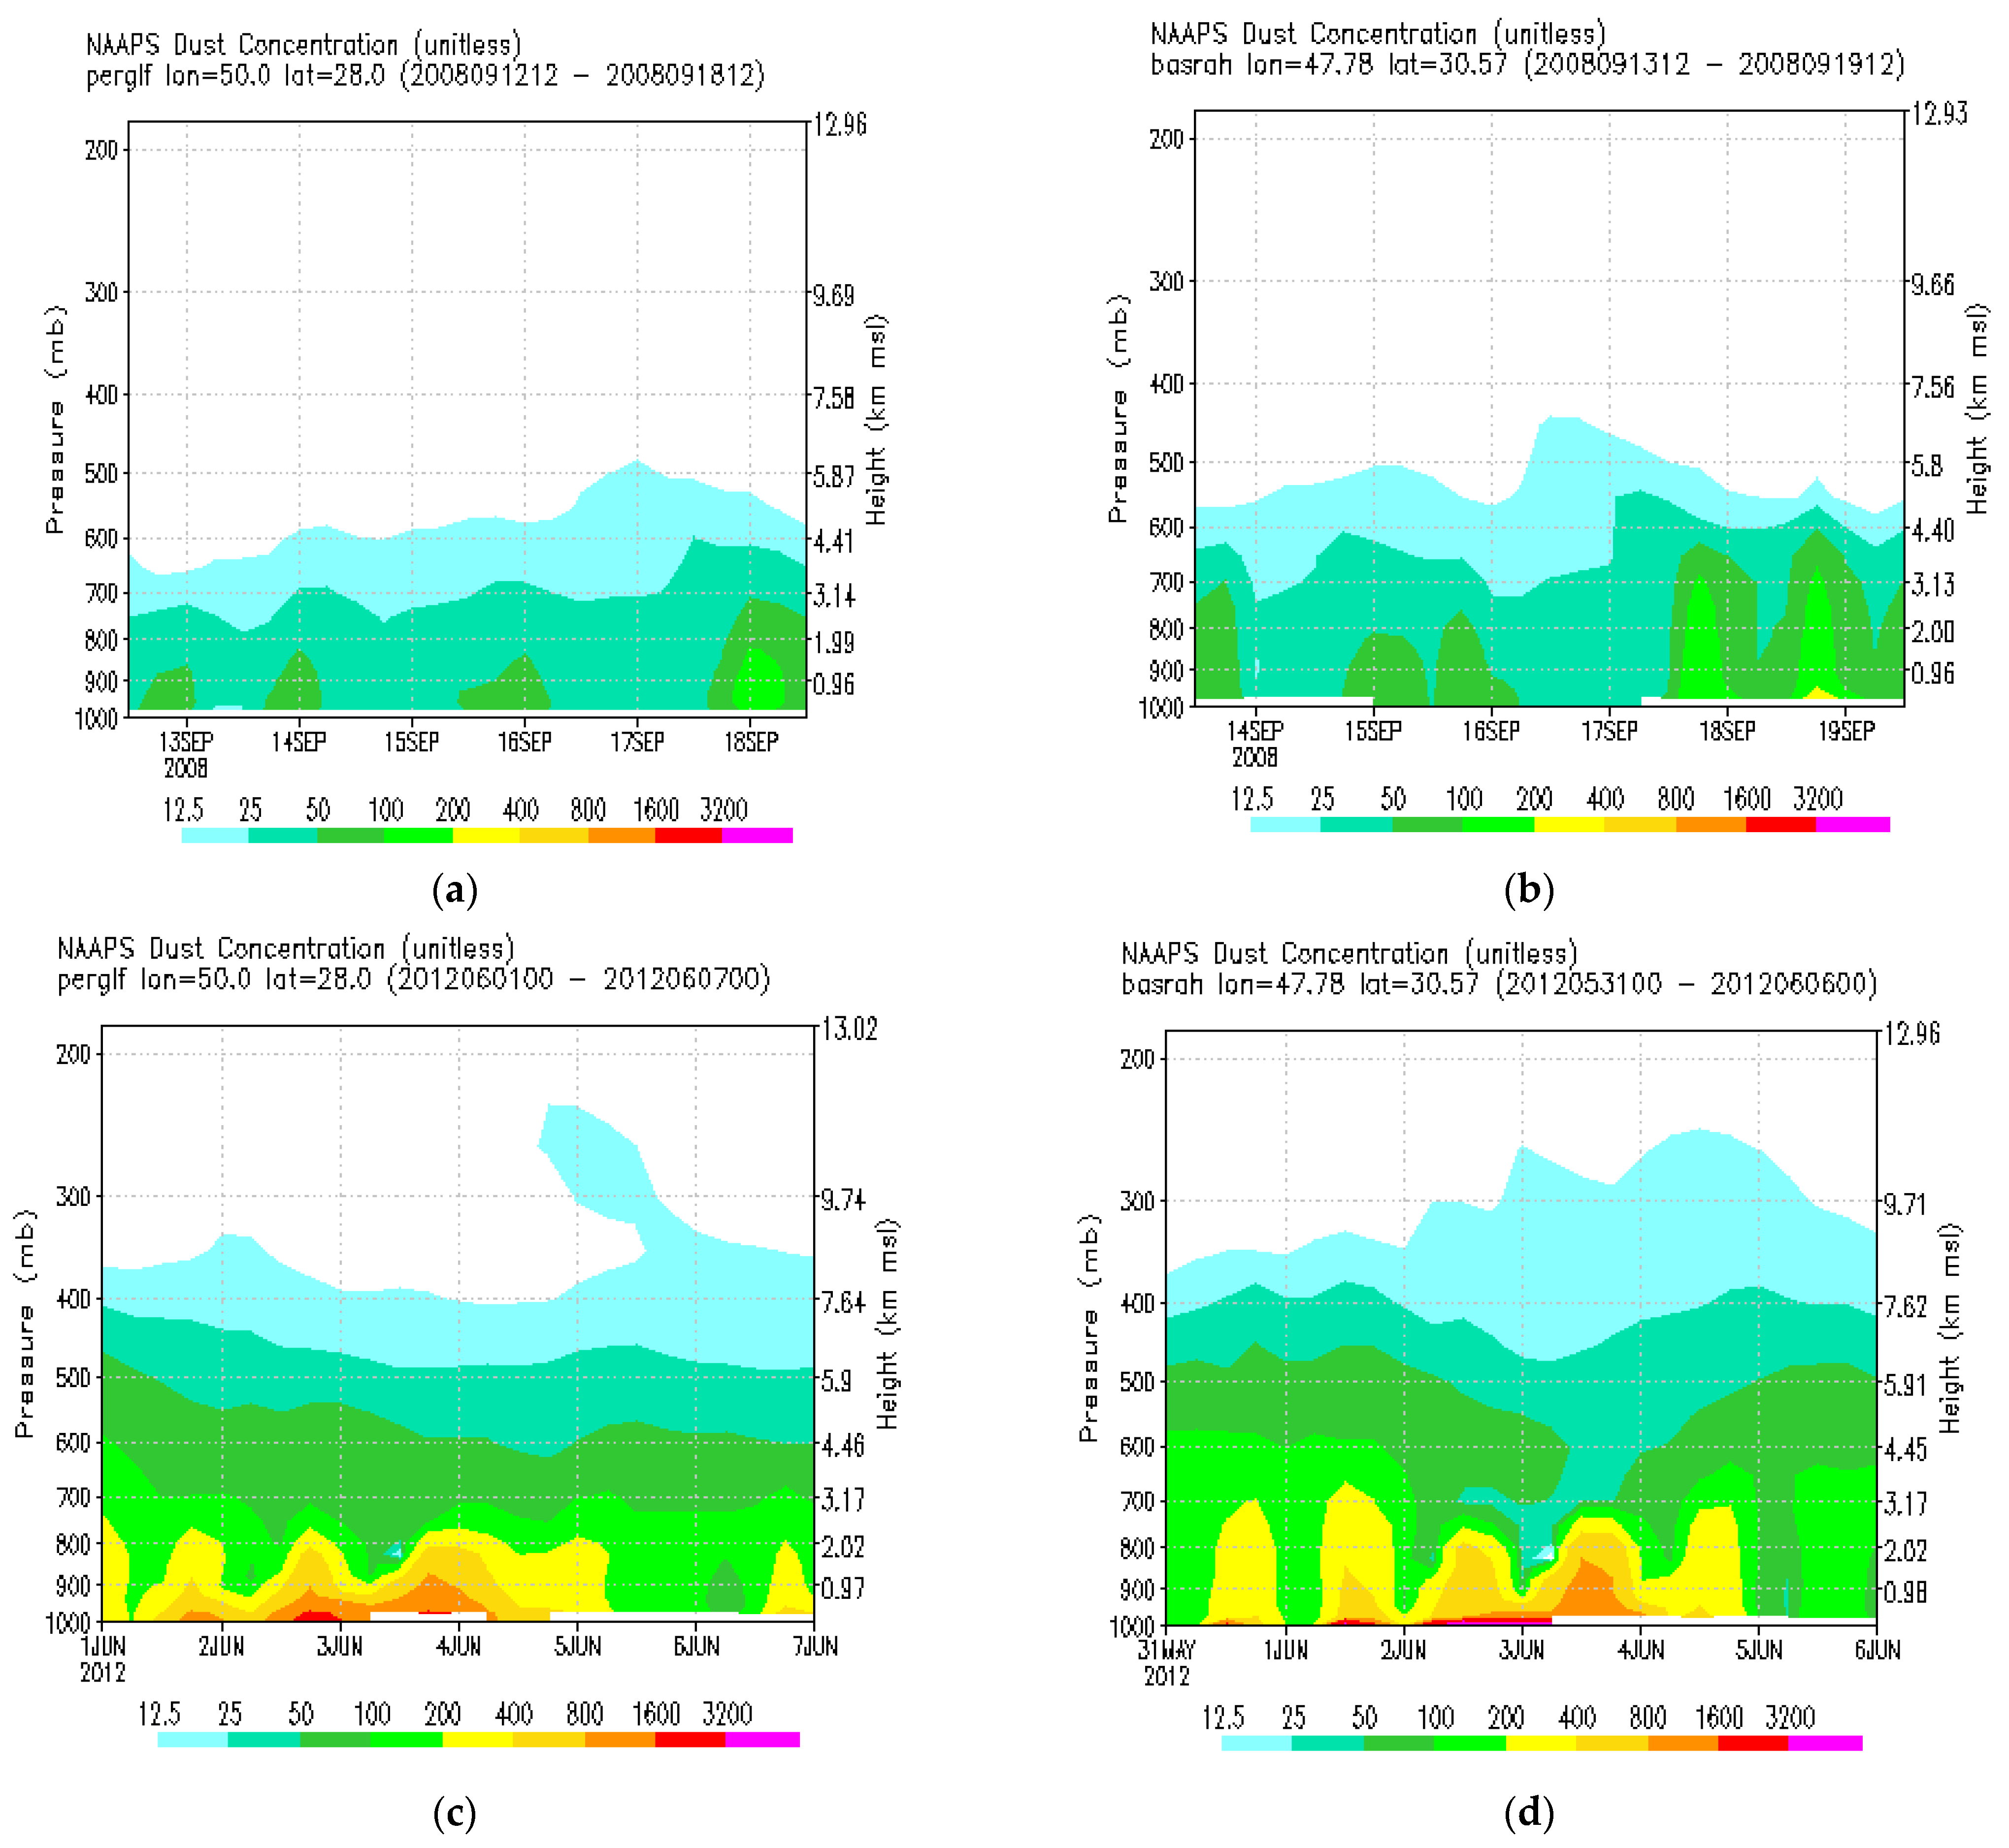
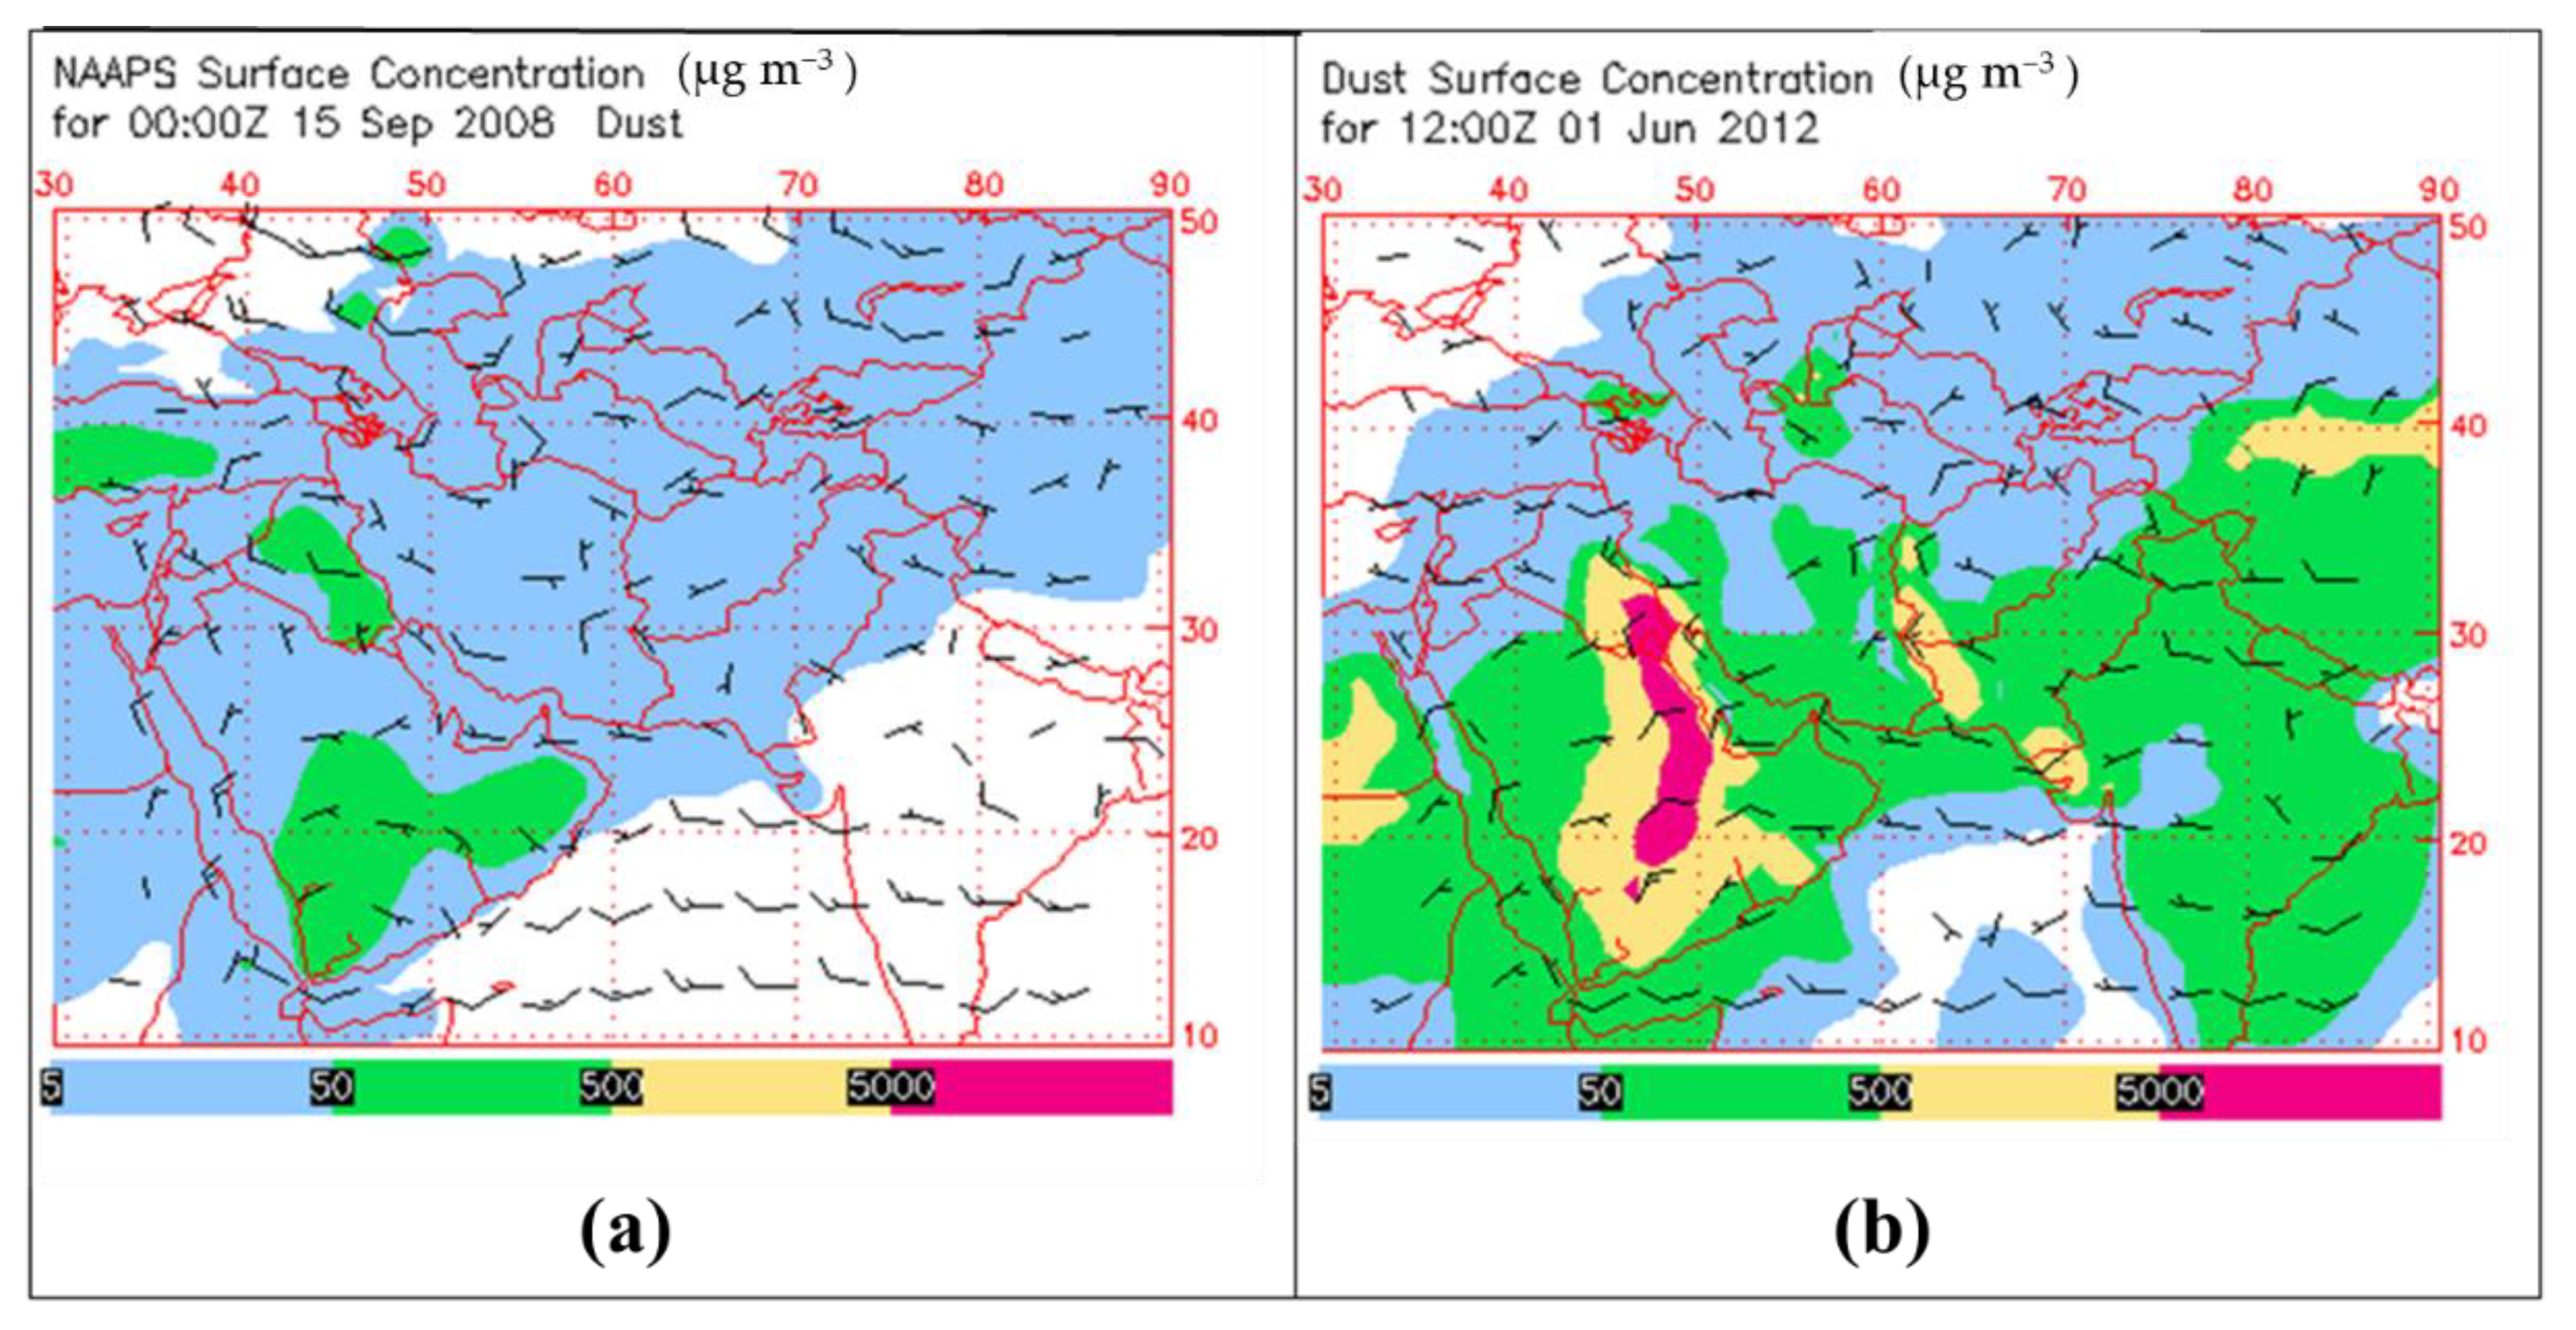
3.4. NAAPS Model Simulation

Figure 11a,b show dust concentration outputs of the NAAPS model at the Basra and Persian Gulf stations from 13 to 18 September 2008. In both stations, the model outputs did not show high dust concentrations on those days, surprisingly, only some days presented surface dust concentrations under 100 μg m−3. Figure 11c,d show dust concentration outputs of the NAAPS model at the Basra and Persian Gulf stations from 1 June to 6 June 2012. The model shows high dust concentrations between 800 and 1600 μg m−3 between 2 and 4 June and, at times, between 1600 to 3200 μg m−3 on 3 June at both stations. In Figure 11d, at Basra station, the dust phenomenon continued until 5 June, but in Figure 11c, the dust storm occurred at the Persian Gulf station until 4 June. At the Persian Gulf station, the P M 10 concentration dropped sharply to between 200 and 400 μg m−3 on 5 June. In both stations, dust particles reached 400 hPa levels.
Figure 12 shows the NAAPS model simulated PM10 concentrations in the Middle East region at 00 UTC on 15 September 2008 (Figure 12a) and at 12 UTC on 1 June 2012 (Figure 12b). The model output on 15 September 2008 shows high surface dust concentrations (between 50 and 500 µg m−3) in vast parts of Iraq and southern parts of Saudi Arabia. In Figure 12b, the model output shows high dust surface concentrations over a vast part of the study area: the southern half of Iraq, Kuwait, Saudi Arabia, the Persian Gulf, and the southern half of Iran. The dust concentrations reached above 500 µg m−3 in Iraq, Kuwait, some parts of the Persian Gulf, and the eastern half of Saudi Arabia; in some areas, concentrations were higher than 5000 µg m−3, indicating severe dust storms in these areas. In both figures, the model outputs show northern and northwestern winds over Iraq and the Persian Gulf. Moreover, the wind direction indicates that dust particles did not transfer from Saudi Arabia to the south/southwest of Iran and the Persian Gulf region despite the high dust concentration over Saudi Arabia in both of the dust storms. The NAAPS model outputs show that the propagation of P M 10 is in agreement with MODIS true color images and MODIS AOD in the Middle East region. Moreover, the model shows that, in both cases, the wind direction was a Shamal wind that was identical to the ERA5 wind direction.

4. Conclusions

In this study, the clay fractions of dust aerosol were investigated in the Middle East region. Clay fractions consist largely of primary minerals in Iraq and Syria, so these areas are very vulnerable to dust rising. Thus, under certain weather conditions, dust particles are prone to lifting (e.g., due to severe surface winds, low humidity, high vertical motion of air, etc.), and these dust particles easily transport from these areas to affect the downstream areas.
Furthermore, temporal variations of the number of dust days were investigated at eight weather stations in the west, southwest, and south of Iran in a 21-year duration from 2000 to 2020. The highest dust frequencies occurred from 2008 to 2012 in the west and southwest of Iran, which were mostly affected by dust storms originating from Iraq and Syria; the durations of the highest dust frequencies were not in south Iran because stations in these areas have some internal dust sources, and local dust was reported to be higher than west Iran stations. Moreover, southern Iran and the Persian Gulf were most affected by dust storms originating from Kuwait, Saudi Arabia, and other dust sources located in the southern parts of the Persian Gulf, mostly in the late winter and early spring.
Two severe dust storms were chosen in 2008 and 2012 based on satellite images and the reported visibility reduction at most weather stations in Iran. MODIS true color images and MODIS AOD showed the thick air mass and high aerosol over Iraq, Kuwait, west and southwest Iran, the Persian Gulf, and Saudi Arabia. Furthermore, measured P M 10 concentrations at Ilam, Kermanshah, and Bushehr stations showed the two severe dust storms. The determinations of the structures and characteristics of the circulations and pressure patterns are crucial to understanding the main meteorological forcings that produce dust emissions and high surface dust concentrations. In this regard, backward trajectories based on meteorological data, including meteorological maps at the standard pressure levels (1000, 925, and 500 hPa), satellite images, and some products of the numerical weather prediction models were investigated in the two dust storm cases. Meteorological maps at 00UTC and 12UTC, satellite images, NAAPS, and HYSPLIT model outputs of dust events were analyzed from 15 to 16 September 2008 (case 1) and 1 to 3 June 2012 (case 2). Furthermore, satellite images were used to compare the spatial patterns of the large-scale dust events and vertical profiles of the two severe dust storms.
Synoptic investigations indicated that extending the thermal low-pressure system from the northern Persian Gulf (PG) to the northwest of Iraq and northeast of Syria, as well as the spread of the high-pressure system over the eastern Mediterranean, the Zagros Mountain, and southeast of Turkey, a strong east–west pressure gradient created between the two pressure systems (and passing waves duo to the upper-air disturbances) had major roles in lifting the dust and blowing the Shamal wind in northern Iraq and northeast Syria on 15 and 16 September and southern Iraq on 1, 2, and 3 June. The topographic role of the Tigris–Euphrates plain accelerated the downslope Shamal wind in this area. Moreover, the Shamal wind transferred the suspended particles over western Iran, the northern PG, and neighboring areas.
In the first case, the dust emitted from dust hotspots in northwestern Iraq; in the second case, the dust emitted from dust hotspots in southeastern Iraq. Due to the important role of northwesterly winds in rising and transferring dust to this region, the structure and persistence of low-level jets at different latitudes have been investigated, showing, in both cases, low-level jets with core levels at 930–910 hPa in the northwestern regions of Iraq and northeastern Syria in the first case and southern Iraq in the second case. Moreover, the HYSPLIT backward trajectory shows that the prevailing wind was northwesterly in both dust storm cases. The vertical profiles of dust from the NAAPS model and the CALIPSO satellite show dust particles reaching more than 5 km in height in the atmosphere.

Author Contributions

Conceptualization, N.H.H. and A.R.S.A.; methodology, N.H.H. and M.C.G.O.; software, N.H.H. and A.R.S.A.; validation, A.R.S.A., S.S.-K.K. and N.H.H.; formal analysis, N.H.H., A.R.S.A., M.C.G.O. and S.S.-K.K.; resources, N.H.H., A.R.S.A. and S.S.-K.K.; data curation, N.H.H.; writing original draft preparation, A.R.S.A. and C.O.; writing review and editing, M.C.G.O., S.S.-K.K. and N.H.H.; visualization, N.H.H., M.C.G.O. and S.S.-K.K.; supervision, M.C.G.O. and C.O. All authors have read and agreed to the published version of the manuscript.

Funding

Publication founding acknowledgments: “Open Access funding provided by the Open Access Publication Fund of Philipps-Universität Marburg with support from the Deutsche Forschungsge-meinschaft (DFG, German Research Foundation)”.

Institutional Review Board Statement

Not applicable.

Informed Consent Statement

Not applicable.

Data Availability Statement

Datasets supporting the reported results are: MODIS Giovanni via https://giovanni.sci.gsfc.nasa.gov/giovanni/ (accessed on 20 December 2021) and ERA-5 via https://www.ecmwf.int/en/forecasts/datasets/reanalysis-datasets/era5 (accessed on 22 December 2021).

Acknowledgments

The ECMWF reanalysis teams are acknowledged for providing the synoptic maps. Moreover, we are thankful to NASA for providing MODIS AOD retrievals and the actual color images. The authors also thank the members of SDS-WAS (SDS-WAS; https://sds-was.aemet.es (accessed on 20 June 2022)) for the visibility images in the Middle East and NW Africa. We are thankful for the reported wind direction and dust-related codes from the Iran Meteorological Organization. Moreover, the Iranian Department of Environment is acknowledged for the PM10 monitoring system.

Conflicts of Interest

The authors declare no conflict of interest.

References

  1. Meng, Z.; Lu, B. Dust events as a risk factor for daily hospitalization for respiratory and cardiovascular diseases in Minqin, China. Atmos. Environ. 2007, 41, 7048–7058. [Google Scholar] [CrossRef]
  2. Ebrahimi, S.J.A.; Ebrahimzadeh, L.; Eslami, A.; Bidarpoor, F. Effects of dust storm events on emergency admissions for cardiovascular and respiratory diseases in Sanandaj, Iran. J. Environ. Health Sci. Engin. 2014, 12, 1–5. [Google Scholar] [CrossRef] [PubMed] [Green Version]
  3. Tam, W.W.; Wong, T.W.; Wong, A.H.; Hui, D.S. Effect of dust storm events on daily emergency admissions for respiratory diseases. Respirology 2012, 17, 143–148. [Google Scholar] [CrossRef] [PubMed]
  4. Naddafi, K.; Atafar, Z.; Faraji, M.; Ghanbarian, M.; Rezaei, S.; Ghozikali, M.G.; Hassanvand, M.S.; Pourpak, Z.; Mesdaghinia, A.; Yunesian, M.; et al. Health effects of airborne particulate matters (PM10) during dust storm and non-dust storm conditions in Tehran. J. Air Pollut. Health 2016, 1, 259–268. [Google Scholar]
  5. Merrifield, A.; Schindeler, S.; Jalaludin, B.; Smith, W. Health effects of the September 2009 dust storm in Sydney, Australia: Did emergency department visits and hospital admissions increase? Environ. Health 2013, 12, 1–7. [Google Scholar] [CrossRef] [PubMed] [Green Version]
  6. Griffin, D.W.; Kellogg, C.A. Dust Storms and Their Impact on Ocean and Human Health: Dust in Earth?s Atmosphere. EcoHealth 2004, 1, 284–295. [Google Scholar] [CrossRef]
  7. Ai, N.; Polenske, K.R. Socioeconomic Impact Analysis of Yellow-dust Storms: An Approach and Case Study for Beijing. Econ. Syst. Res. 2008, 20, 187–203. [Google Scholar] [CrossRef]
  8. Stefanski, R.; Sivakumar, M.V.K. Impacts of sand and dust storms on agriculture and potential agricultural applications of a SDSWS. IOP Conf. Series Earth Environ. Sci. 2009, 7, 012016. [Google Scholar] [CrossRef]
  9. Pahlavanravi, A.; Miri, A.; Ahmadi, H.; Ekhtesasi, M. The Impacts of Different Kinds of Dust Storms in Hot and Dry Climate, A Case Study in Sistan Region. Desert 2012, 17, 15–25. [Google Scholar]
  10. Maleki, T.; Sahraie, M.; Sasani, F.; Shahmoradi, M. Impact of Dust Storm on Agricultural Production in Iran. International Journal of Agricultural Science. Res. Tech. Exten. Edu. Sys. 2017, 7, 19–26. [Google Scholar]
  11. Saeed, T.M.; Al-Dashti, H.; Spyrou, C. Aerosol’s optical and physical characteristics and direct radiative forcing during a shamal dust storm, a case study. Atmos. Chem. Phys. 2014, 14, 3751–3769. [Google Scholar] [CrossRef] [Green Version]
  12. Sassen, K.; DeMott, P.J.; Prospero, J.M.; Poellot, M.R. Saharan dust storms and indirect aerosol effects on clouds: CRYSTAL-FACE results. Geophys. Res. Let. 2003, 30. [Google Scholar] [CrossRef] [Green Version]
  13. Koehler, K.A.; Kreidenweis, S.M.; DeMott, P.J.; Petters, M.D.; Prenni, A.J.; Möhler, O. Laboratory investigations of the impact of mineral dust aerosol on cold cloud formation. Atmos. Chem. Phys. 2010, 10, 11955–11968. [Google Scholar] [CrossRef]
  14. Kayetha, V.K.; Kumar, J.S.; Prasad, A.K.; Cervone, G.; Singh, R.P. Effect of dust storm on ocean color and snow parameters. J. Indian Soc. Remote Sens. 2007, 35, 1–9. [Google Scholar] [CrossRef]
  15. Kok, J.F.; Adebiyi, A.A.; Albani, S.; Balkanski, Y.; Checa-Garcia, R.; Chin, M.; Colarco, P.R.; Hamilton, D.S.; Huang, Y.; Ito, A.; et al. Contribution of the world’s main dust source regions to the global cycle of desert dust. Atmos. Chem. Phys. 2021, 21, 8169–8193. [Google Scholar] [CrossRef]
  16. Kok, J.F.; Adebiyi, A.A.; Albani, S.; Balkanski, Y.; Checa-Garcia, R.; Chin, M.; Colarco, P.R.; Hamilton, D.S.; Huang, Y.; Ito, A.; et al. Improved representation of the global dust cycle using observational constraints on dust properties and abundance. Atmos. Chem. Phys. 2021, 21, 8127–8167. [Google Scholar] [CrossRef]
  17. Lee, H.N.; Igarashi, Y.; Chiba, M.; Aoyama, M.; Hirose, K.; Tanaka, T. Global model simulations of the transport of Asian and Sahara dust: Total deposition of dust mass in Japan. Water Air Soil Pollut. 2006, 169, 137–166. [Google Scholar] [CrossRef]
  18. Hamzeh, N.H.; Karami, S.; Opp, C.; Fattahi, E.; Jean-François, V. Spatial and temporal variability in dust storms in the Middle East, 2002–2018: Three case studies in July 2009. Arab. J. Geosci. 2021, 14, 538. [Google Scholar] [CrossRef]
  19. Koren, I.; Kaufman, Y.J.; Washington, R.; Todd, M.C.; Rudich, Y.; Martins, J.V.; Rosenfeld, D. The Bodélé depression: A single spot in the Sahara that provides most of the mineral dust to the Amazon forest. Environ. Res. Lett. 2006, 1, 014005. [Google Scholar] [CrossRef]
  20. Karanasiou, A.; Moreno, N.; Moreno, T.; Viana, M.; de Leeuw, F.; Querol, X. Health effects from Sahara dust episodes in Europe: Literature review and research gaps. Environ. Int. 2012, 47, 107–114. [Google Scholar] [CrossRef]
  21. Middleton, N. Variability and trends in dust storm frequency on decadal timescales: Climatic drivers and human impacts. Geosciences 2019, 9, 261. [Google Scholar] [CrossRef] [Green Version]
  22. Moridnejad, A.; Karimi, N.; Ariya, P.A. A new inventory for middle east dust source points. Environ. Monit. Assess. 2015, 187, 1–11. [Google Scholar] [CrossRef]
  23. Rezazadeh, M.; Irannejad, P.; Shao, Y. Climatology of the Middle East dust events. Aeo. Res. 2013, 10, 103–109. [Google Scholar] [CrossRef]
  24. Luo, C.; Mahowald, N.M.; Del Corral, J. Surface radiative forcing by soil dust aerosols and the hydrologic cycle. J. Geophys. Res. 2004, 109, 4203. [Google Scholar]
  25. Goudie, A.S. Desert dust and human health disorders. Environ. Int. 2014, 63, 101–113. [Google Scholar] [CrossRef]
  26. Masoumi, A.; Laleh, E.; Bayat, A. Optical and physical properties, time-period, and severity of dust activities as a function of source for the main dust sources of the Middle East. J. Atmospheric Solar-Terrestrial Phys. 2019, 185, 68–79. [Google Scholar] [CrossRef]
  27. Al-Dousari, A. Atlas of Fallen Dust in Kuwait; Springer Nature: Kuwait City, Kuwait, 2021. [Google Scholar]
  28. Notaro, M.; Alkolibi, F.; Fadda, E.; Bakhrjy, F. Trajectory analysis of Saudi Arabian dust storms. J. Geophys. Res. Atmos. 2013, 118, 6028–6043. [Google Scholar] [CrossRef]
  29. Aba, A.; Al-Dousari, A.; Ismaeel, A. Atmospheric deposition fluxes of 137Cs associated with dust fallout in the northeastern Arabian Gulf. J. Environ. Radioact. 2018, 192, 565–572. [Google Scholar] [CrossRef]
  30. Al-Hemoud, A.; Al-Dousari, A.; Al-Dashti, H.; Petrov, P.; Al-Saleh, A.; Al-Khafaji, S.; Behbehani, W.; Li, J.; Koutrakis, P. Sand and dust storm trajectories from Iraq Mesopotamian flood plain to Kuwait. Sci. Total Environ. 2020, 710, 136291. [Google Scholar] [CrossRef]
  31. Filioglou, M.; Giannakaki, E.; Backman, J.; Kesti, J.; Hirsikko, A.; Engelmann, R.; O’Connor, E.; Leskinen, J.T.T.; Shang, X.; Korhonen, H.; et al. Optical and geometrical aerosol particle properties over the United Arab Emirates. Atmospheric Chem. Phys. 2020, 20, 8909–8922. [Google Scholar] [CrossRef]
  32. Javed, W.; Guo, B. Chemical characterization and source apportionment of fine and coarse atmospheric particulate matter in Doha, Qatar. Atmospheric Pollut. Res. 2020, 12, 122–136. [Google Scholar] [CrossRef]
  33. Karami, S.; Hamzeh, N.H.; Alam, K.; Noori, F.; Abadi, A.R.S. Spatio-temporal and synoptic changes in dust at the three islands in the Persian Gulf region. J. Atmospheric Solar-Terrestrial Phys. 2021, 214, 105539. [Google Scholar] [CrossRef]
  34. Karami, S.; Hamzeh, N.H.; Abadi, A.R.S.; Madhavan, B.L. Investigation of a severe frontal dust storm over the Persian Gulf in February 2020 by CAMS model. Arab. J. Geosci. 2021, 14, 1–12. [Google Scholar] [CrossRef]
  35. Almamalachy, Y.S.; Al-Quraishi, A.M.F.; Moradkhani, H. Agricultural drought monitoring over Iraq utilizing MODIS products. In Environ. Remote Sensing and GIS in Iraq; Springer: Cham, Swtzerland, 2020; pp. 253–278. [Google Scholar]
  36. Halos, S.H.; Abed, F.G. Effect of spring vegetation indices NDVI & EVI on dust storms occurrence in Iraq. In AIP Conference Proceedings; AIP Publishing LLC: New York, NY, USA, 2019; Volume 2144, pp. 40015–40026. [Google Scholar]
  37. Hamzeh, N.H.; Kaskaoutis, D.G.; Rashki, A.; Mohammadpour, K. Long-Term Variability of Dust Events in Southwestern Iran and Its Relationship with the Drought. Atmosphere 2021, 12, 1350. [Google Scholar] [CrossRef]
  38. Karami, S.; Hossein Hamzeh, N.; Noori, F.; Ranjbar, A. Investigation of Dust Storms in Ilam and the Performance Analysis of Simulation of 6 Numerical Prediction Models at a Severe Dust Storm in West of Iran. J. Air Pollut. Health 2019, 4, 133–146. [Google Scholar] [CrossRef]
  39. Hamzeh, N.H.; Karami, S.; Ranjbar, A. Simulation of a severe dust storm with different dust emission schemes. In E3S Web of Conferences; EDP Sciences: Les Ulis, France, 2019; Volume 99, p. 02013. [Google Scholar]
  40. Hamidi, M.; Kavianpour, M.R.; Shao, Y. Synoptic Analysis of Dust Storms in the Middle East. Asia Pac. J. Atmos. Sci. 2013, 49, 279–286. [Google Scholar] [CrossRef]
  41. Hamzeh, N.H.; Karami, S.; Kaskaoutis, D.G.; Tegen, I.; Moradi, M.; Opp, C. Atmospheric dynamics and numerical simulations of six frontal dust storms in the Middle East region. Atmosphere 2021, 12, 125. [Google Scholar] [CrossRef]
  42. Yu, Y.; Notaro, M.; Kalashnikova, O.V.; Garay, M.J. Climatology of summer Shamal wind in the Middle East. J. Geophys. Res. Atmos. 2016, 121, 289–305. [Google Scholar] [CrossRef] [Green Version]
  43. Francis, D.; Flamant, C.; Chaboureau, J.P.; Banks, J.; Cuesta, J.; Brindley, H.; Oolman, L. Dust emission and transport over Iraq associated with the summer Shamal winds. Aeol. Res. 2017, 24, 15–31. [Google Scholar] [CrossRef]
  44. Francis, D.; Alshamsi, N.; Cuesta, J.; Gokcen Isik, A.; Dundar, C. Cyclogenesis and density currents in the Middle East and the associated dust activity in September 2015. Geosciences 2019, 9, 376. [Google Scholar] [CrossRef] [Green Version]
  45. Mohammadpour, K.; Sciortino, M.; Kaskaoutis, D.G. Classification of weather clusters over the Middle East associated with high atmospheric dust-AODs in West Iran. Atmospheric Research 2021, 259, 105682. [Google Scholar] [CrossRef]
  46. Karami, S.; Hamzeh, N.H.; Alam, K.; Ranjbar, A. The study of a rare frontal dust storm with snow and rain falls: Model results and ground measurements. J. Atmos. Sol. Terres. Phys. 2020, 197, 105149. [Google Scholar] [CrossRef]
  47. Abadi, A.R.S.; Hamzeh, N.H.; Shukurov, K.; Opp, C.; Dumka, U.C. Long-Term Investigation of Aerosols in the Urmia Lake Region in the Middle East by Ground-Based and Satellite Data in 2000–2021. Remote Sens. 2022, 14, 3827. [Google Scholar] [CrossRef]
  48. Hossein Hamzeh, N.; Fattahi, E.; Zoljodi, M.; Ghaffarian, P.; Ranjbar, A. Study and simulation of summer dust in West and Southwest of Iran. J. Clim. Res. 2017, 29, 91–109. [Google Scholar]
  49. Salmabadi, H.; Khalidy, R.; Saeedi, M. Transport Routes and Potential Source Regions of the Middle Eastern Dust over Ahvaz during 2005–2017. Atmos. Res. 2020, 241, 104947. [Google Scholar] [CrossRef]
  50. Alizadeh-Choobari, O.; Ghafarian, P.; Owlad, E. Temporal Variations in the Frequency and Concentration of Dust Events over Iran Based on Surface Observations: Climatology of dust events over Iran. Int. J. Climatol. 2016, 36, 2050–2062. [Google Scholar] [CrossRef]
  51. Daniali, M.; Karimi, N. Spatiotemporal Analysis of Dust Patterns over Mesopotamia and Their Impact on Khuzestan Province. Iran. Nat. Hazards 2019, 97, 259–281. [Google Scholar] [CrossRef]
  52. Climate Data Store. Available online: https://cds.climate.copernicus.eu (accessed on 20 June 2022).
  53. The Bridge Between Data and Science. Available online: https://giovanni.gsfc.nasa.gov (accessed on 12 July 2022).
  54. Lance-Modis and Viirs-Land near Real-Time Data. Available online: https://Lance-Modis.Eosdis.Nasa.Gov (accessed on 16 August 2022).
  55. Winker, D.M.; Hunt, W.H.; McGill, M.J. Initial performance assessment of CALIOP. Geophysic. Res. Let. 2007, 34, 1–5. [Google Scholar] [CrossRef] [Green Version]
  56. Uno, I.; Yumimoto, K.; Shimizu, A.; Hara, Y.; Sugimoto, N.; Wang, Z.; Liu, Z.; Winker, D.M. 3D structure of Asian dust transport revealed by CALIPSO lidar and a 4DVAR dust model. Geophys. Res. Let. 2008, 35, 11–15. [Google Scholar] [CrossRef] [Green Version]
  57. The Cloud-Aerosol Lidar and Infrared Pathfinder Satellite Observation (CALIPSO). Available online: https://www-calipso.larc.nasa.gov (accessed on 10 May 2022).
  58. Christensen, J.H. The Danish Eulerian Hemispheric Model—A three-dimensional air pollution model used for the Arctic. Atm. Env. 1997, 31, 4169–4191. [Google Scholar] [CrossRef]
  59. Maciszewska, A.E.; Markowicz, K.M.; Witek, M.L. A multiyear analysis of aerosol optical thickness over Europe and Central Poland using NAAPS model simulation. Acta Geophysica. 2020, 58, 1147–1163. [Google Scholar] [CrossRef]
  60. Perlwitz, J.P.; Pérez García-Pando, C.; Miller, R.L. Predicting the mineral composition of dust aerosols–Part 1: Representing key processes. Atmos. Chem. Phys. 2015, 15, 11593–11627. [Google Scholar] [CrossRef] [Green Version]
  61. Goudie, A.S.; Middleton, N.J. Desert Dust in the Global System; Springer Science & Business Media: Berlin, Germany, 2006. [Google Scholar]
  62. Baldo, C.; Formenti, P.; Nowak, S.; Chevaillier, S.; Cazaunau, M.; Pangui, E.; Di Biagio, C.; Doussin, J.F.; Ignatyev, K.; Dagsson-Waldhauserova, P.; et al. Distinct chemical and mineralogical composition of Icelandic dust compared to northern African and Asian dust. Atmos. Chem. Phys. 2020, 20, 13521–13539. [Google Scholar] [CrossRef]
  63. Al-Dousari, A.M. Section III: Recent studies on dust fallout within preserved and open areas in Kuwait. In Desertification in Arid Lands: Causes, Consequences and Mitigation; Bhat, N.R., Al-Nasser, A.Y., Omar, S., Eds.; Kuwait Institute for Scientific Research: Kuwait City, Kuwait, 2009; pp. 137–148. [Google Scholar]
  64. Shahsavani, A.; Naddafi, K.; Jaafarzadeh Haghighifard, N.; Mesdaghinia, A.; Yunesian, M.; Nabizadeh, R.; Arhami, M.; Yarahmadi, M.; Sowlat, M.H.; Ghani, M.; et al. Characterization of Ionic Composition of TSP and PM10 during the Middle Eastern Dust (MED) Storms in Ahvaz, Iran. Environ. Monit. Assess. 2012, 184, 6683–6692. [Google Scholar] [CrossRef]
  65. Arami, S.A.; Ownegh, M.; MohammadianBehbahani, A.; Akbari, M.; Zarasvandi, A. The analysis of dust hazard studies in southwest region of Iran in 22 years (1996–2017). J. Spat. Anal. Environ. Hazarts. 2018, 5, 39–66. [Google Scholar] [CrossRef]
  66. Zarasvandi, A.; Carranza, E.J.M.; Moore, F.; Rastmanesh, F. Spatio-Temporal Occurrences and Mineralogical–Geochemical Characteristics of Airborne Dusts in Khuzestan Province (Southwestern Iran). J. Geochem. Explor. 2011, 111, 138–151. [Google Scholar] [CrossRef]
  67. Yu, Y.; Notaro, M.; Liu, Z.; Wang, F.; Alkolibi, F.; Fadda, E.; Bakhrjy, F. Climatic Controls on the Interannual to Decadal Variability in Saudi Arabian Dust Activity: Toward the Development of a Seasonal Dust Prediction Model: Saudi Arabian Dust Prediction. J. Geophys. Res. 2015, 120, 1739–1758. [Google Scholar] [CrossRef]
  68. Al-Ghadban, A.N.; Uddin, S.; Beg, M.U.; Al-Dousari, A.M.; Gevao, B.; Al-Yamani, F. Ecological Consequences of River Manipulations and Drainage of Mesopotamian Marshes on the Arabian Gulf Ecosystem: Investigations on Changes in Sedimentology and Environmental Quality, with Special Reference to Kuwait Bay. Kuwait Inst. Sci. Res. (KISR) 2008, 9362, 1–141. [Google Scholar]
  69. Al-Faraj, F.A.; Scholz, M.; Tigkas, D.; Boni, M. Drought indices supporting drought management in transboundary watersheds subject to climate alterations. Water Policy 2015, 17, 865–886. [Google Scholar] [CrossRef]
  70. Al Ameri, I.D.; Briant, R.M.; Engels, S. Drought severity and increased dust storm frequency in the Middle East: A case study from the Tigris–Euphrates alluvial plain, central Iraq. Weather 2019, 74, 416–426. [Google Scholar] [CrossRef] [Green Version]
  71. Jasim, A.I.; Awchi, T.A. Regional meteorological drought assessment in Iraq. Arab. J. Geosci. 2020, 13, 1–16. [Google Scholar] [CrossRef]
  72. Soleimani Sardoo, F.; Hosein Hamzeh, N.; Karami, S.; Nateghi, S.; Hashemi Nezhad, M. Emission and transport of dust particles in Jazmourian basin (Case study: Dust storm 24 to 26 November 2016). J. Clim. Res. 2022, 1400, 41–54. [Google Scholar]
  73. Soleimani Sardoo, F.; Karami, S.; Hoseinhamzeh, N. Determining and analyzing the temporal and spatial trend of dust and its effect on vegetation and precipitation (Case study of Jazmourian Basin). Environ. Eros. Res. J. 2021, 11, 64–81. [Google Scholar]
  74. Rashki, A.; Arjmand, M.; Kaskaoutis, D.G. Assessment of dust activity and dust-plume pathways over Jazmurian Basin, southeast Iran. Aeol. Res. 2017, 24, 145–160. [Google Scholar] [CrossRef]
  75. Rashki, A.; Kaskaoutis, D.G.; Goudie, A.S.; Kahn, R.A. Dryness of ephemeral lakes and consequences for dust activity: The case of the Hamoun drainage basin, southeastern Iran. Sci. Tot. Environ. 2013, 463, 552–564. [Google Scholar] [CrossRef]
  76. Rashki, A.; Kaskaoutis, D.G.; Eriksson, P.G.; Rautenbach, C.D.W.; Flamant, C.; Vishkaee, F.A. Spatio-temporal variability of dust aerosols over the Sistan region in Iran based on satellite observations. Nat. Hazards 2014, 71, 563–585. [Google Scholar] [CrossRef] [Green Version]
  77. Sabetghadam, S.; Alizadeh, O.; Khoshsima, M.; Pierleoni, A. Aerosol properties, trends and classification of key types over the Middle East from satellite-derived atmospheric optical data. Atmospheric Environ. 2021, 246, 118100. [Google Scholar] [CrossRef]
  78. Liu, D.; Wang, Z.; Liu, Z.; Winker, D.; Trepte, C. A height resolved global view of dust aerosols from the first year CALIPSO lidar measurements. J. Geophys. Res. Earth Surf. 2008, 113, D16. [Google Scholar] [CrossRef]
  79. Liu, D.; Zhao, T.; Boiyo, R.; Chen, S.; Lu, Z.; Wu, Y.; Zhao, Y. Vertical Structures of Dust Aerosols over East Asia Based on CALIPSO Retrievals. Remote. Sens. 2019, 11, 70. [Google Scholar] [CrossRef] [Green Version]
  80. Karami, S.; Hamzeh, N.H.; Kaskaoutis, D.G.; Rashki, A.; Alam, K.; Ranjbar, A. Numerical simulations of dust storms originated from dried lakes in central and southwest Asia: The case of Aral Sea and Sistan Basin. Aeolian Res. 2021, 50, 100679. [Google Scholar] [CrossRef]
Figure 1. The clay (a) and silt fractions (b) of dust aerosols at emissions for the soil mineral fraction (SMF) method in the Middle East region (S1 and S2 are dust sources).
Atmosphere 13 01990 g001
Figure 2. Annual variation of the number of dust days at 8 stations in west, southwest, and south Iran from 2000 to 2020.
Atmosphere 13 01990 g002
Figure 3. (a): Sea level pressure (shaded as in the legend and solid color contours, interval is 5 mb), wind (ms−1), and (b): 500-hPa geopotential height (shaded as in the legend and solid red and blue contours, interval is 4 dam) at 00UTC on 15 September 2008. (c): sea level pressure and (d): 500-hPa geopotential height at 00UTC on 16 September 2008. The white rectangle on figure (a) shows the area of strong northwesterly winds (Shamal winds).
Atmosphere 13 01990 g003
Figure 4. Sea level pressure (shaded as in the legend and solid color contours, interval is 5 mb), wind (ms−1), and 500-hPa geopotential height (shaded as in the legend and solid red and blue contours, interval is 4 dam) at 00UTC on 1 and 2 June 2012. (a) and (b) for 1 June 2012, (c) and (d) for 2 June 2012.
Atmosphere 13 01990 g004
Figure 5. Vertical cross-section, from 1000 to 700 hPa of wind speed; (a): at latitude 35° N; (b): at latitude 31° N; (c,d): 925-hPa geopotential height and wind vectors (ms−1); (e,f): vertical cross-section of wind speed along the green lines from A to B and C to D.
Atmosphere 13 01990 g005
Figure 6. The figure shows 10 m of wind gust (ms−1) (shaded), 10 m of wind vector (ms−1) on (a) 15 September 2008 and (d) 2 June 2012, and 2 m dew point temperature (°C) (white color dash contour) at times indicated and time series of (b) A1, (c) A2, (e) A3, and (f) A4 areas.
Atmosphere 13 01990 g006
Figure 7. Measured P M 10 concentrations in three air monitoring stations in west and SW Iran on (a) 14–17 September 2008 and (b) 1–3 June 2012. Visibility reported under 1 km at several stations in Iran taken from dust-related weather codes on (c) 14–17 September 2008 and (d) 1–3 June 2012. One-day backward trajectory matrix from the HYSPLIT model for air masses at 500 m heights affected the southwest of Iran on (e) 15 September 2008 and (f) 2 June 2012.
Atmosphere 13 01990 g007aAtmosphere 13 01990 g007b
Figure 8. Terra/MODIS true color imagery on (a) 15 September 2008, (b) 16 September 2008, (c) 2 June 2012, (d) 3 June 2012.
Atmosphere 13 01990 g008
Figure 9. Mean AOD550 spatial distribution from Terra-MODIS observations during the periods (a) 14–17 September 2008, (b) 1–3 June 2012, (c) 2000–2020.
Atmosphere 13 01990 g009
Figure 10. True color imagery from aqua/moderate-resolution imaging spectroradiometer (MODIS) and aerosol-type classification during the two dust storms from CALIPSO. The satellite orbit paths are shown by the yellow lines in the MODIS imagery.
Atmosphere 13 01990 g010
Figure 11. Vertical distribution of NAAPS output dust (μg m−3) in (a,c) the Persian Gulf and (b,d) Basra stations from 13 to 19 September 2008 and from 1 to 6 June 2012.
Atmosphere 13 01990 g011
Figure 12. Surface dust concentration and wind direction from the NAAPS model at (a) 00 UTC on 15 September 2008, (b) 12 UTC on 1 June 2012.
Atmosphere 13 01990 g012
Table 1. The 8 selected synoptic weather stations in the west, southwest, and south of Iran, and the mean annual number of dust days from 1997 to 2017.
Synoptic StationLongitudeLatitudeElevationMean Annual of Dust Days
Ahvaz48.631.3322.561.38
Abadan48.2530.33684.14
Bushehr50.8328.962965.28
Kermanshah47.1534.35131844.09
Ilam46.4233.64138745.14
Kish Island53.9826.530121.77
Qeshm Island55.9226.926167.77
Dayyer port51.9327.834105.88
Table 2. The dust-related codes that are used in this study.
06Widespread dust in suspension, not raised by wind at or near the station at the time of observation
07Dust or sand raised by wind at or near the station at the time of observation
30, 31, 32Slight or moderate sand storms or dust storms
33, 34, 35Severe sand storms or dust storms
Table 3. The position, vertical expansion, and the jet core at the times indicated.
TimeLatitude
(°N)
Longitude
(°E)
Vertical Level
(hPa)
Jet Core
(ms−1)
00UTC on 15 September 20083638–40935–93012
3540–41930–92016
3441–42935–90016
3341.5–42.5935–89516
3242–43.5935–90012
3142.2–43.8930–91510
00UTC 2 June 201234N44.5–45.5935–87510
33N45–46930–88012
32N46.2–47.8935–91016
31N47.5–48930–92518
30N47.3–49.2940–90018
29N48.2–50.7950–88020
28N49.2–50.8930–90522
27N49.8–51930–90522
26N50.5–51.1930–91520
25N50.51.5930.89518
24N49.5–51.8835–84516
Publisher’s Note: MDPI stays neutral with regard to jurisdictional claims in published maps and institutional affiliations.

