Article

The Effect of Assimilating AMSU-A Radiance Data from Satellites and Large-Scale Flows from GFS on Improving Tropical Cyclone Track Forecast

1
South China Sea Marine Forecast Center of State Oceanic Administration, Guangzhou 510000, China
2
State Key Laboratory of Tropical Oceanography, South China Sea Institute of Oceanology, Chinese Academy of Sciences, Guangzhou 510000, China
3
School of Marine, University of Chinese Academy of Sciences, Beijing 100049, China
4
Southern Marine Science and Engineering Guangdong Laboratory, Guangzhou 510000, China
5
Guangxi Key Laboratory of Marine Disaster in the Beibu Gulf (LMDBG), Qinzhou University, Qinzhou 535011, China
*
Author to whom correspondence should be addressed.
Atmosphere 2022, 13(12), 1988; https://doi.org/10.3390/atmos13121988
Submission received: 11 August 2022 / Revised: 30 September 2022 / Accepted: 23 November 2022 / Published: 28 November 2022

Abstract

:
This study aimed to investigate the effect of assimilating either AMSU-A radiance data from satellites, large-scale flows from the Global Forecast System (GFS), or both together, on improving the track forecast of tropical cyclone (TC). The scale-selective data assimilation (SSDA) approach was employed for the assimilation of large-scale GFS flows, while the conventional 3D variational data assimilation (3DVAR) method was used for that of AMSU-A radiance data. The results show that assimilating either AMSU-A radiance data or large-scale GFS flows has a significant improvement on TC track forecast, but the improvement occurs within the first 72 h and after 72 h, respectively. When assimilating both AMSU-A radiance data and large-scale GFS flows, the forecast can take advantage of both data and thus lead to the smallest 5-day mean errors of the track forecast. These results are instructive to future operational TC track forecasting.

1. Introduction

Tropical cyclones (TCs) occurring over warm tropical oceans are one of the most severely disastrous weather systems. Accurate forecasting of TC tracks, especially landfall locations, is a prerequisite for the formulation of an effective strategy for preventing and mitigating TC-induced disasters. Though continuous improvements have been made over the past several decades [1,2,3,4,5,6], considerable track forecast errors still exist, especially for forecasting lead times of longer than 24 h, which are far from meeting the requirements of disaster prevention and reduction. Therefore, TC track forecasting remains a major challenge for weather forecasting in the world.
At present, numerical weather forecasting is one of the most widely-used TC forecasting methods, which is a problem of initial condition to a great extent [7]. Thus, in order to improve the forecasting accuracy, many new technologies or methods are being constantly put forward by scientists to optimize the initial fields of a model, among which the use of observations to directly correct the model initial conditions by data assimilation has been proven to be quite effective. In the early days, due to poor observing techniques, only a small amount of conventional observations was available. With the development of satellite remote sensing technology, more and more reliable satellite observations are available with a larger coverage area and higher spatial resolution for atmospheric information; these data have been used in addition to conventional observations to improve a given model’s performance in TC forecasting effectively through optimizing the model initial conditions [8,9]. In particular, the polar-orbiting meteorological satellite-borne Advanced Microwave Sounding Unit (AMSU) has the unique ability to penetrate through deep cloud layers, except for precipitation clouds. It can detect vertical profiles of atmospheric temperature and humidity, and its brightness temperature data are very useful for reconstructing the mesoscale structure of a typhoon [10]. Zhang [11] used the Advanced Television and Infrared Observation Satellite (TIROS)-N’s Operational Vertical Sounder (ATOVS) microwave data in a three-dimensional variational data assimilation (3DVAR) analysis to study typhoon structures as well as their variations in different periods over the northwest Pacific Ocean; the study showed that ATOVS microwave data assimilation can correctly describe the characteristics and changes of the 3D structure of typhoons over the northwest Pacific Ocean, which cannot be obtained using conventional observations. Since then, ATOVS radiance data have been widely used in the study of TC numerical forecast/simulation, and radiance data assimilation has become a research hotspot in recent years. Previous studies [12,13,14,15,16] have shown that assimilating ATOVS radiance data can improve the initial conditions of a model, including the environmental fields and inner structure of a TC, and is thus able to effectively improve the short-term forecasting accuracy of a TC.
In addition, a method referred to as the scale-selective data assimilation (SSDA) approach was proposed by Peng et al. in 2010 [17], and it has been successfully applied to TC forecasting/simulation in the past few years [18,19,20]. In principle, the SSDA approach takes into account the multi-scale features in both the observations and model output and only adjusts the model variables on a selective scale through scale separation; technically, the SSDA approach employs a band-pass digital filter and three-dimensional variational data assimilation scheme to correct the large-scale bias by incorporating the large-scale circulations from a global model into a regional model while keeping the regional-scale details unchanged [17]. Studies have showed that both large- and small-scale flows can benefit from the SSDA procedure, resulting in significant improvements in the TC track and intensity forecast/simulation [18,19,20].
Radiance data assimilation is an effective method to improve the TC forecast accuracy of a model through an optimization of the model initial conditions. However, the effects of radiance data assimilation usually rapidly attenuate with time, or even diminish after 2–3 days, due to the very fast decaying of the effects of the optimized initial conditions [21,22]. Thus, radiance data assimilation might do little to improve the TC forecast accuracy of a model for a longer forecast period. Although the rolling of data assimilation can make up for the disadvantage and be adopted to improve the accuracy of model simulation, it cannot be used in real-time numerical forecasts for the lack of observational data in the future (i.e., forecasting time). The SSDA approach, on the other hand, shows a large advantage in improving TC forecasts with lead times longer than 48 h [18,19], which is accomplished by assimilating large-scale components from global model forecasts instead of real observations at a preset time. Therefore, it is interesting to understand the combining effects of radiance data assimilation and the SSDA approach on TC forecasts, which is the objective of this study.
In this study, we investigated the impacts of assimilating AMSU-A radiance using the 3DVAR technique, assimilating large-scale GFS flows by the SSDA approach, and the combination of both on TC track forecasting through case studies. The rest of this paper is organized as follows. Section 2 briefly describes the model system and methodology. Experiment design is detailed in Section 3. Section 4 presents the results and discussion, followed by a summary in Section 5.

2. Methodology

2.1. The WRF-ARW Model

The weather model used in this study is the Weather Research and Forecasting (WRF) model utilizing the Advanced Research WRF dynamical core (WRF-ARW) [23], which was developed by the National Center for Atmosphere Research (NCAR). There are different dynamical cores and model physics packages accessible in the WRF framework. The WRF-ARW is a non-hydrostatic, fully compressible, primitive equation model that uses a terrain-following hydrostatic pressure coordinate and Arakawa C-grid staggering. In addition, a data assimilation package (WRFDA) is encompassed as a broader component of the WRF system. For more details about the model, readers can refer to Wang et al. [24].

2.2. The Data Assimilation System with SSDA Incorporated

In this study, the SSDA approach proposed by Peng et al. [17] is adopted to incorporate the large-scale circulation from the global model forecasts into the WRF model, driving the model from both the lateral boundaries and the domain interior. The SSDA employs a low-pass filter to separate the large- and small-scale components of the forecasts (or analysis) from both the global and the regional models. After the scale separation, a 3DVAR technique is used to assimilate the large-scale components of the global model forecasts (or analysis) into the regional model to adjust corresponding components periodically (i.e., at the interval of SSDA implementation) as the model integrates forward. The small-scale components of the circulation in the regional model are unconstrained and allowed to freely develop in accordance with the dynamics and physics at a higher resolution. Details about the approach can be referred to in previous studies [17,18,19,20].

2.3. Radiative Transfer Model—CRTM

For direct satellite radiance assimilation, a radiative transfer model (RTM), which calculates radiance or brightness temperatures from the input atmospheric state variables, should be incorporated into the WRFDA system. In this study, the Community Radiative Transfer Model (CRTM) [25,26] developed by the Joint Center for Satellite Data Assimilation (JCSDA) in the US is used. The model has already been integrated into the WRFDA system as a part of observation operators, having a flexible and consistent user interface since WRFDA v3.2.1. It includes four major modules, i.e., gaseous absorption model, surface emissivity and reflectivity model, cloud and aerosol optical model, and radiative transfer (RT) solution model [26]. The Optical Path Transmittance (OPTRAN) [27,28] algorithm is used in the gaseous absorption model to calculate the gaseous absorption for the given pressure, temperature, water vapor, and ozone concentration profiles. The surface emissivity and reflectivity model, covering land, ocean, ice, and snow surfaces, is divided into five smaller modules according to the spectral region and surface sub-type. The cloud and aerosol optical model includes six cloud and eight aerosol types, with the optical property pre-computed and stored in a lookup table, which is suitable for multiple cloud/aerosol layers in a vertical column. The advanced doubling-adding method [29] is used in the RT solution model to solve the RT equation.

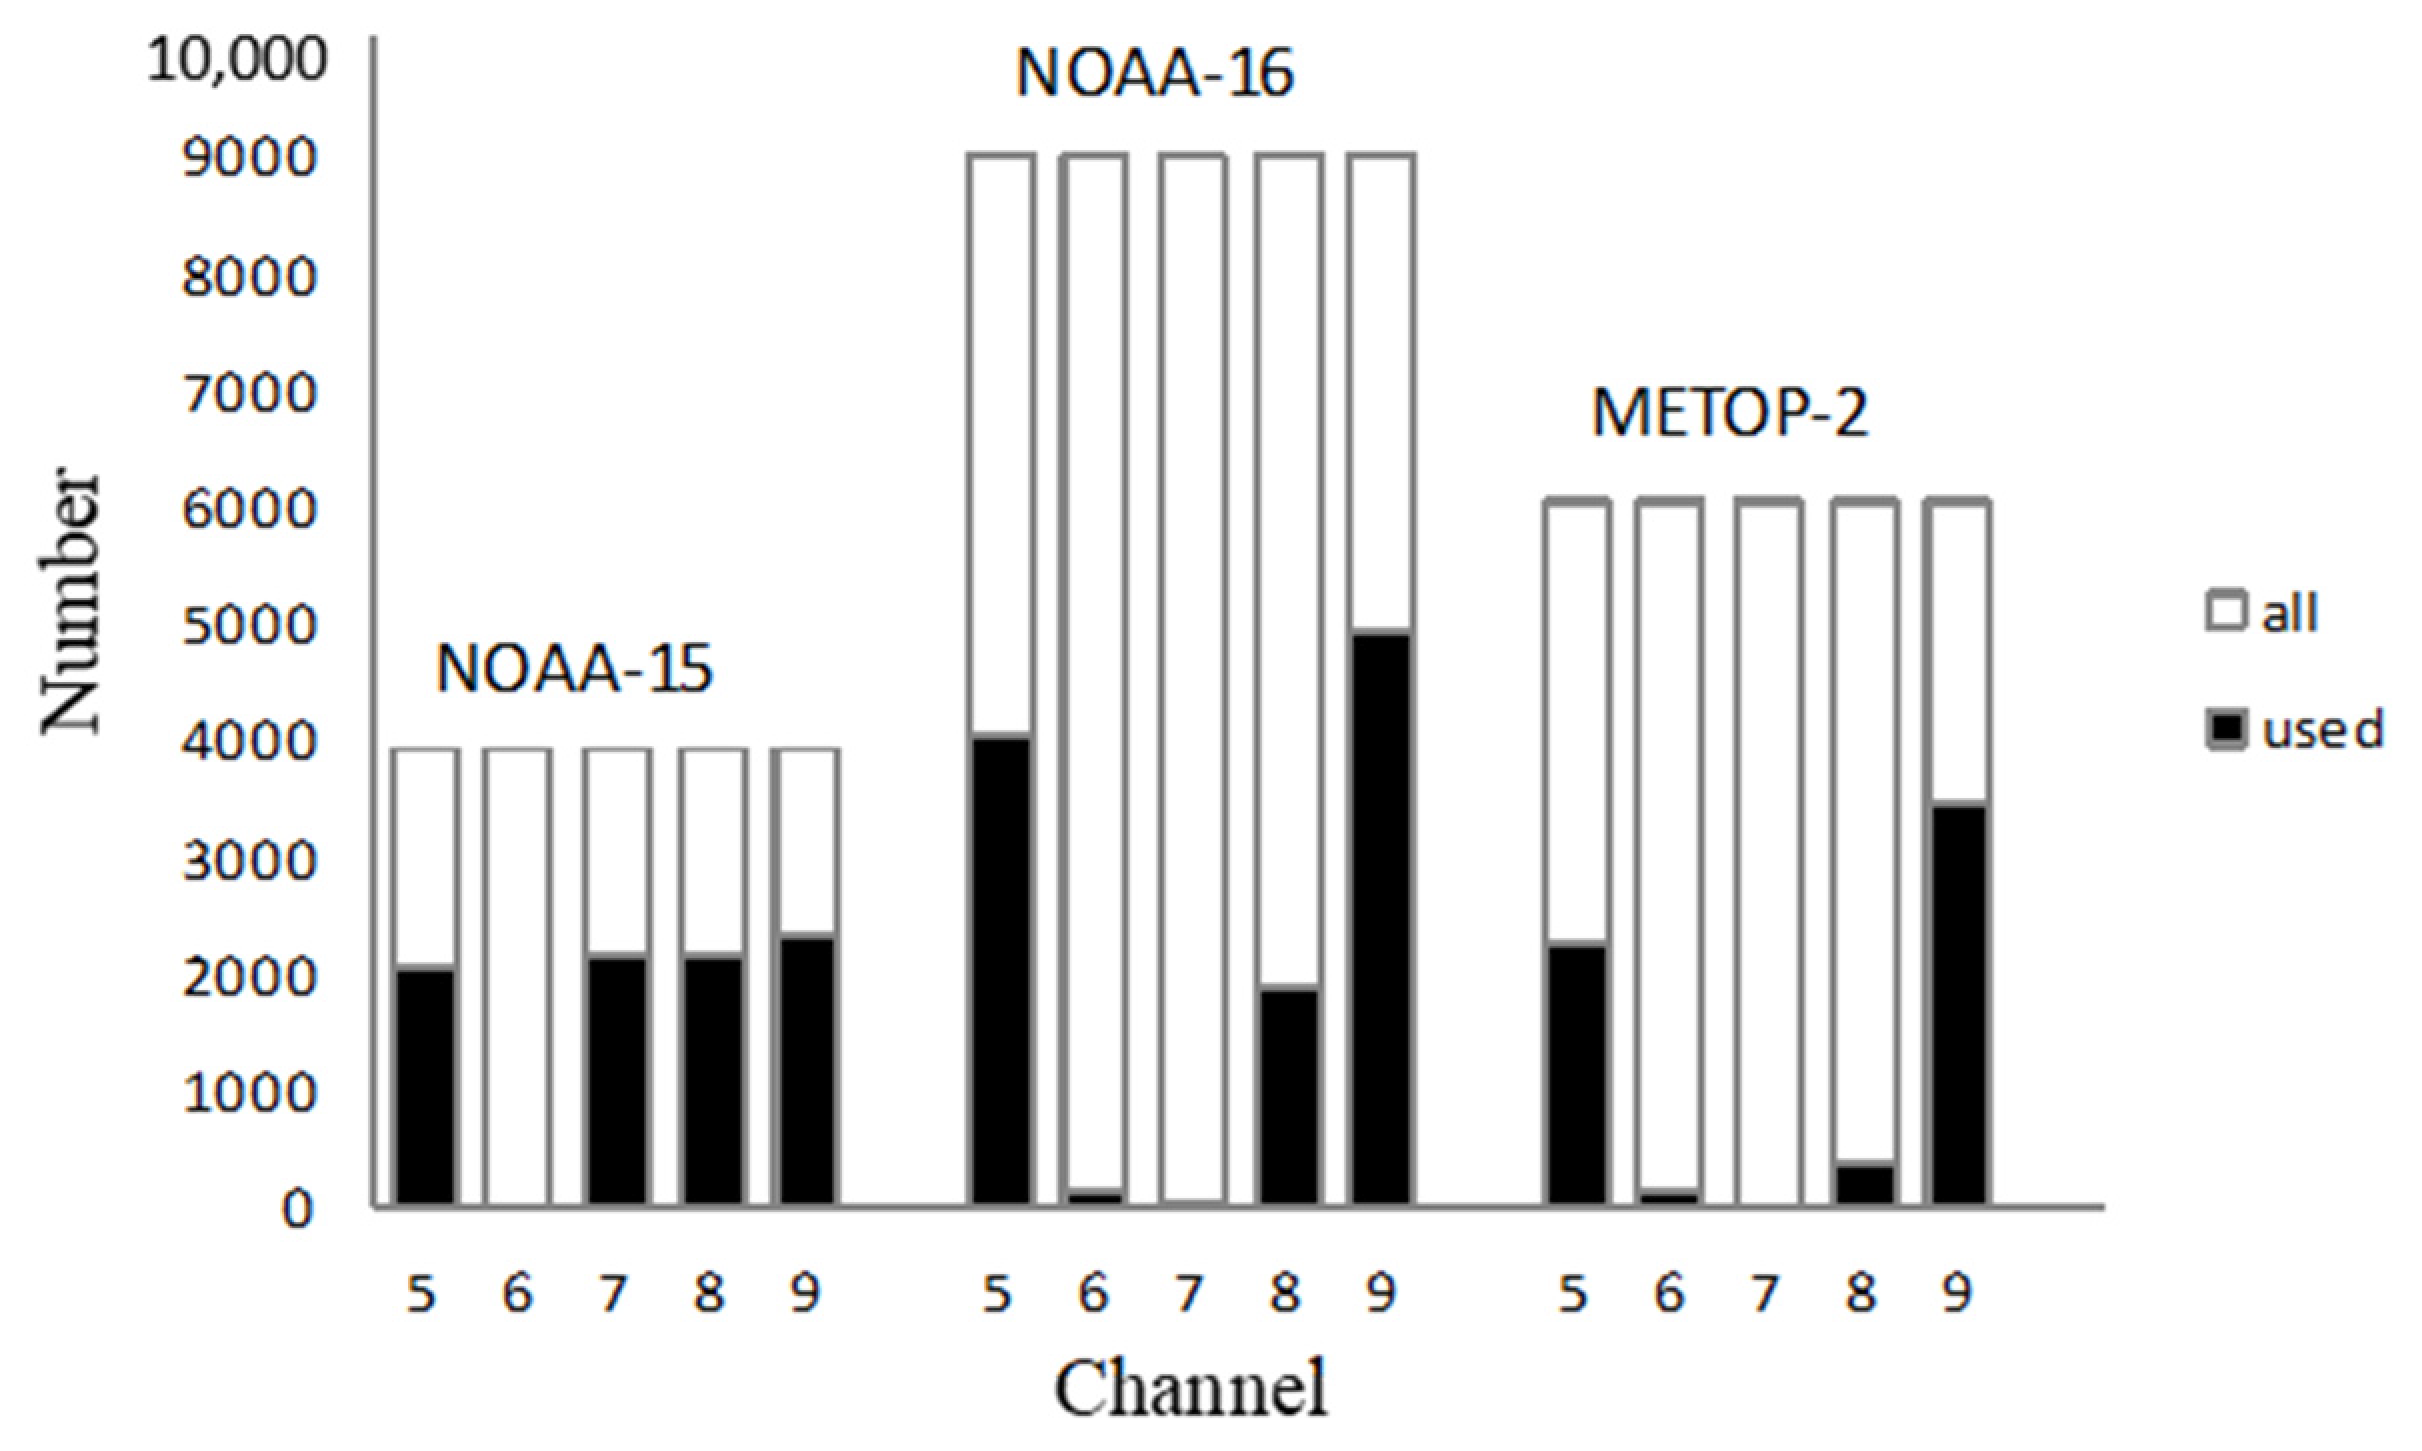
2.4. AMSU-A Radiance Data and Its Processing

The radiometer AMSU-A is one of the most important components to the Advanced Microwave Sounding Unit (AMSU). It is a cross-track, stepped-line scanning, and total power radiometer with fifteen channels (Table 1) whose primary goal is to measure the temperature profiles of the atmosphere. It observes the Earth with an instantaneous field-of-view of 3.3° at the half-power points and a nominal spatial resolution of 48 km at nadir. Because of the unique ability to penetrate through heavy cloud layers (except for precipitation clouds) and gather information of the inner structure of a tropical cyclone, the AMSU-A is especially useful for tropical cyclone studies.
It is well-known that some biases related to instrument calibration problems, RTM, and the predictor and zenith angle bias exist. These biases are equivalent to those of the air temperature in the short-term model prediction. Thus, it is essential to correct these biases before radiance data assimilation. The processing includes correcting the relative biases between measurements at different scan angles (Scan bias) with information on the scan angle and a correction for the biases correlated with “air-mass” as sensed by the measurements (air-mass bias). For a detailed description of these correction methods, please refer to relevant publications [30,31,32]. In WRFDA, there are two schemes available for bias correction. One is carried out using a set of co-efficient files pre-calculated with an off-line statistics package based on the Harris and Kelly [32] method. The other is the variational bias correction (VarBC) [30] scheme, which is of relative simplicity and was thus used in this paper.
In addition, because many factors (such as weather conditions, ground conditions, geographical locations, and so on) can cause large errors in satellite observations [12,15] and the presence of a single data point with large errors can result in a substantial degradation of the analyses and subsequent forecasts [30], quality control is vital and necessary prior to data assimilation. In order to avoid assimilating poor-quality observations, the following quality checks were carried out in this study: (1) performing a location check, which includes removing observations outside the domain, removing observations on both ends of each scan line, rejecting pixels over mixture surface, and rejecting channels with an absolute value of zenith angle >45°; (2) excluding incomplete observations and observations with duplicate locations/times by a thinning procedure to ensure the vertical consistency of upper-air profiles and to keep the radiances relatively uncorrelated; (3) rejecting radiance brightness temperature data outside the range of 150–350 K; (4) removing observations contaminated by precipitation. The presence of precipitation is detected by means of the scattering index (SI) and cloud liquid water (CLW) amount [33,34], respectively. If the SI is >3 K or the CLW is >0.2 mm, the microwave radiances are assumed to be contaminated by precipitation and are rejected; and (5) rejecting channels whose innovation (observation minus background) is 3 times larger than the standard deviation of observation errors, as well as those whose weighting function peak is above the model top or below the surface pressure according to the peak energy contribution level of the sounder channel. Thus, only data on channels 5–9 of AMSU-A are assimilated.
In general, only a small number of observations would be assimilated into the model after the processing of bias correction and quality control. This is beneficial to the minimization procedure in the variational data assimilation system. The number of radiance observations for different channels of different instruments used in the experiments in Section 3 and Section 4 is presented in Figure 1.

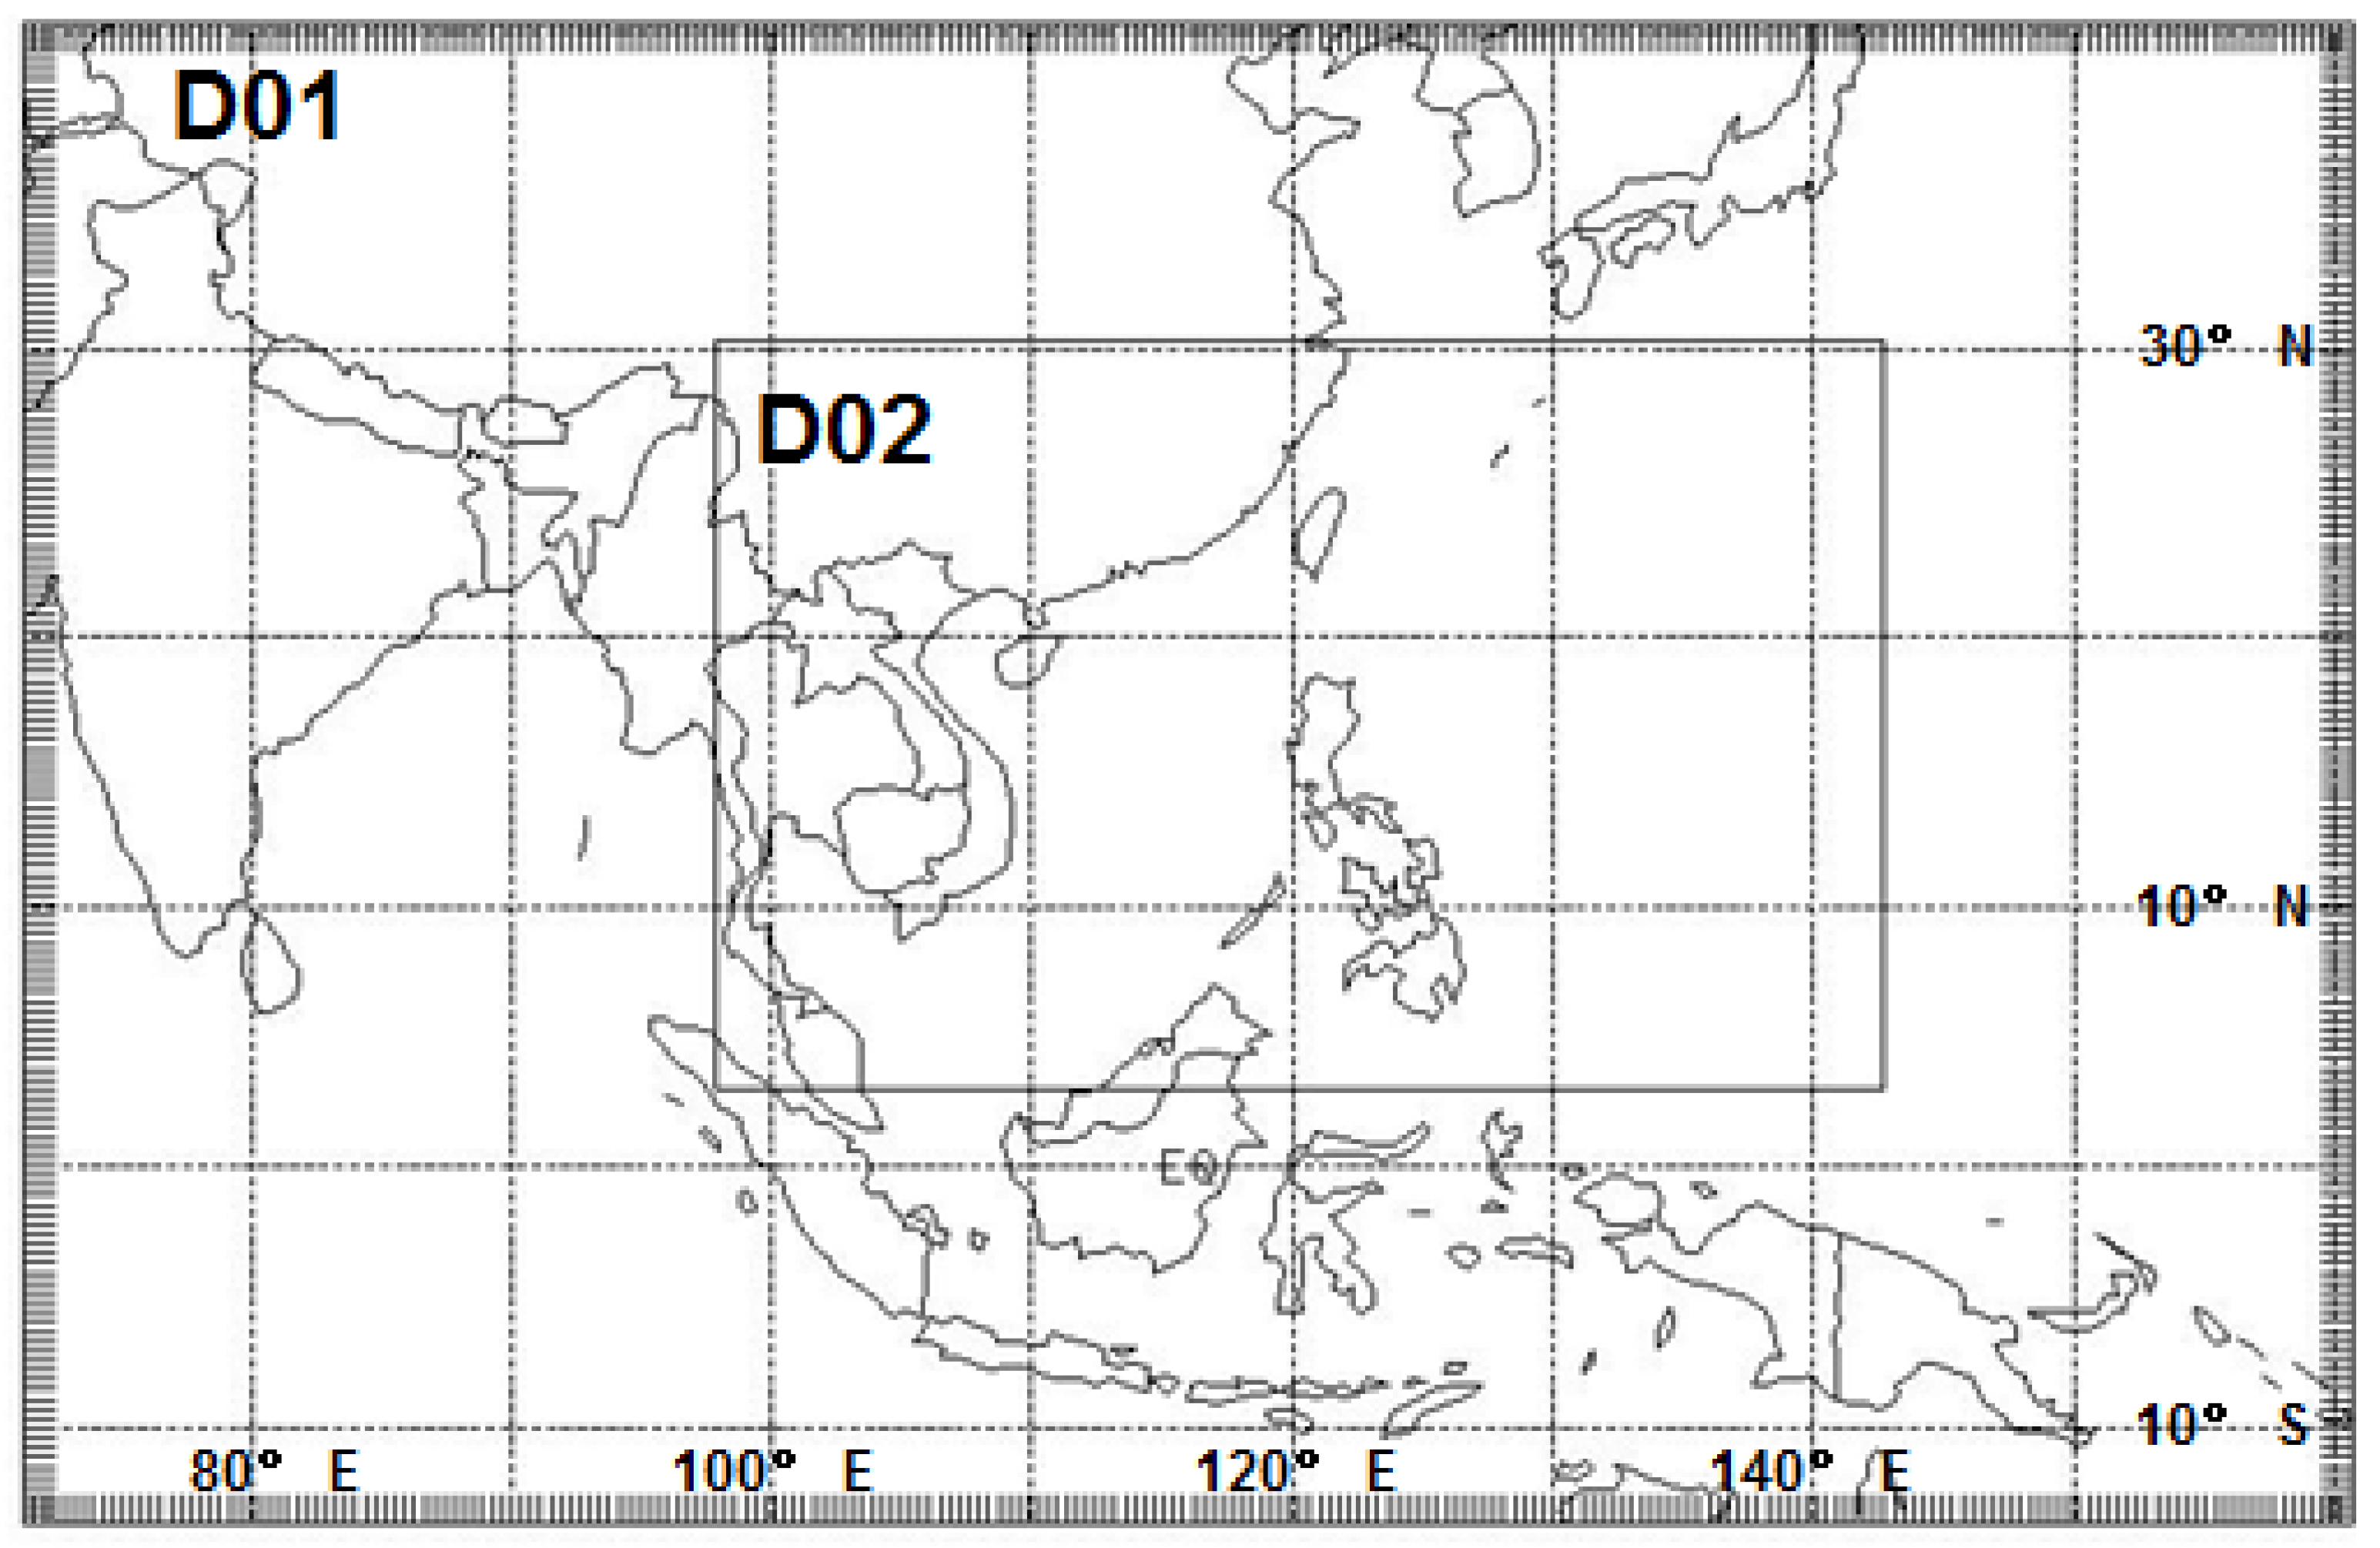
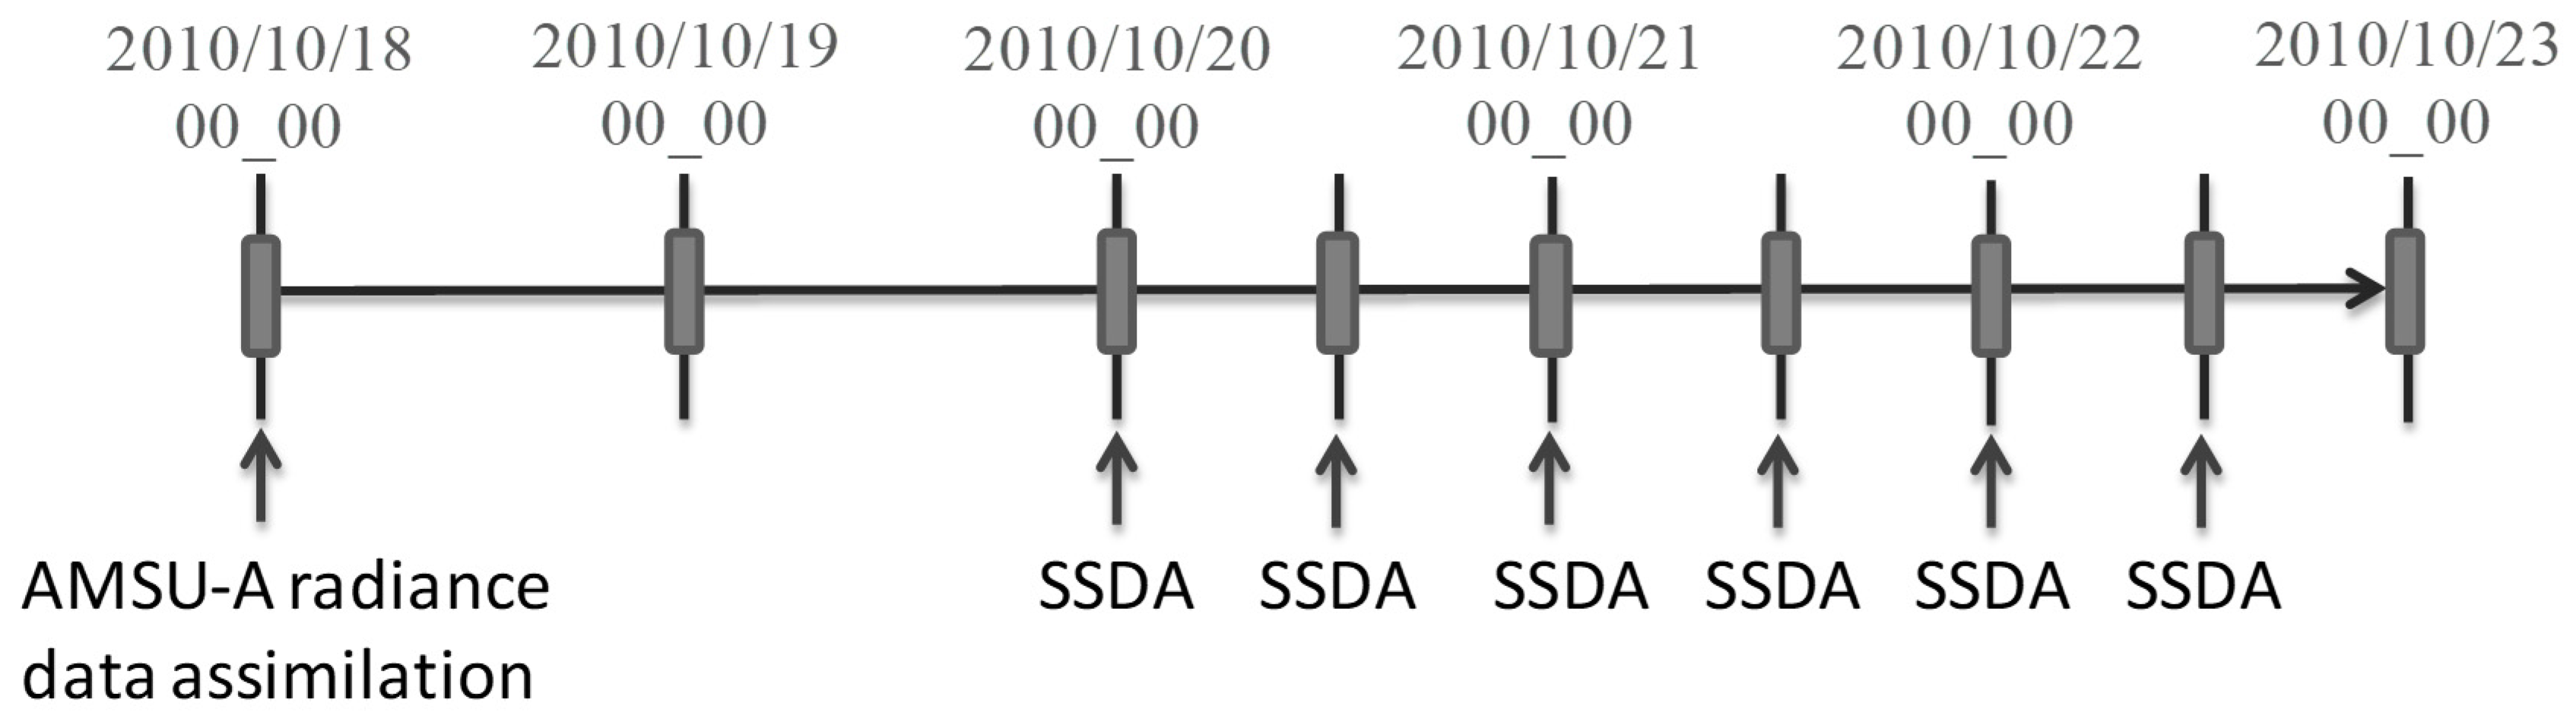
3. Experiment Design

Super typhoon Megi (2010) was chosen as a test case for detailed analysis in this study. Megi (2010) was one of the strongest typhoons in the northwestern Pacific since 1979; it generated over the northwestern Pacific far to the east of the Philippines at 1200 UTC 13 October 2010 and reached its peak intensity (with a minimum central pressure of 895 hPa and maximum surface wind speed up to 72 m/s) at 1200 UTC 17 October. After moving westward into the South China Sea, Megi (2010) suddenly made a sharp northward turn around 0000 UTC 20 October and finally landed at the coast of southern Fujian Province in China at about 0455 UTC 23 October. It caused large threats on the safety of life and property in southeastern China, and its sharp northward turn posed major challenges to operational forecasters [35], with an over-prediction of westward motion by nearly all of the official agencies, including the CMA, JTWC, and JMA, which issued five-day track forecasts during the period from 0000 UTC 17 October to 0000 UTC 19 October [4].
To perform TC track forecasts for Megi (2010), the WRF model was configured with 27 sigma levels in the vertical direction, with a model top of 50 hPa and two nested domains with 36 km and 12 km grid spacing, respectively, in a Mercator map projection (see in Figure 2). The parameterization schemes, which are needed for the boundary layer turbulence, cumulus convection, microphysics of the phase transform among ice, water and vapor, and short/long wave radiation, were employed as follows: the Bougeault and Lacarrere (BouLac) TKE PBL scheme [36], the Kain–Fritsch cumulus scheme [37], the Ferrier (new Eta) microphysics scheme [38], and the Dudhia shortwave [39] and rapid radiative transfer model (RRTM) longwave [40] radiation scheme.
The experimental design in this study consisted of four forecasts that are summarized in Table 2. In all of these experiments, the GFS analysis data at the initial time and the afterward 384-h GFS forecasts at 6 h intervals with a 1.0° × 1.0° resolution from NCEP were used for the initial conditions and boundary conditions of the WRF model, and the model was integrated from 0000 UTC 18 October 2010 to 0000 UTC 23 October 2010. The differences of these experiments are as follows. The first experiment was a control run (denoted as CTL) without any data assimilation. In the second experiment (denoted as RAD-DA), AMSU-A radiance data were assimilated into the WRF model using the 3DVAR technique to improve the model initial conditions. In the third experiment (denoted as GFS-DA), the large-scale wind components with wavelengths longer than 2151 m (corresponding to a cutoff wave number of four) above 850 hPa from the GFS global model forecasts were assimilated into the WRF model at an interval of 12 h using the SSDA approach. The fourth experiment (denoted as COM-DA) employed the data assimilation scheme, which combined the AMSU-A radiance data assimilation with the SSDA approach; i.e., AMSU-A radiance data were assimilated into the model using the 3DVAR technique at the initial time, and then large-scale wind fields with wavelengths longer than 2151 m above 850 hPa from the GFS global model forecasts were assimilated into the WRF model after 48 h at an interval of 12 h using the SSDA approach (Figure 3). The JTWC tropical cyclone best track data and NCEP GFS global analyses were used to validate the results of the WRF simulation corresponding to the above four experiments.

4. Results and Discussion

The TC track position error (TPE, in km) is defined as the great circle distance between the “observed” and the forecast TC center (defined as the location of the minimum sea level pressure), valid at the same time according to the following formulas [41,42]:
T P E = 111.11 cos 1 [ sin φ 0 sin φ f + cos φ 0 cos φ f cos ( λ 0 λ f ) ] ,
where φ 0 ( φ f ) and λ 0   ( λ f ) are the latitude and longitude of the “observed” (forecast) TC center, respectively.

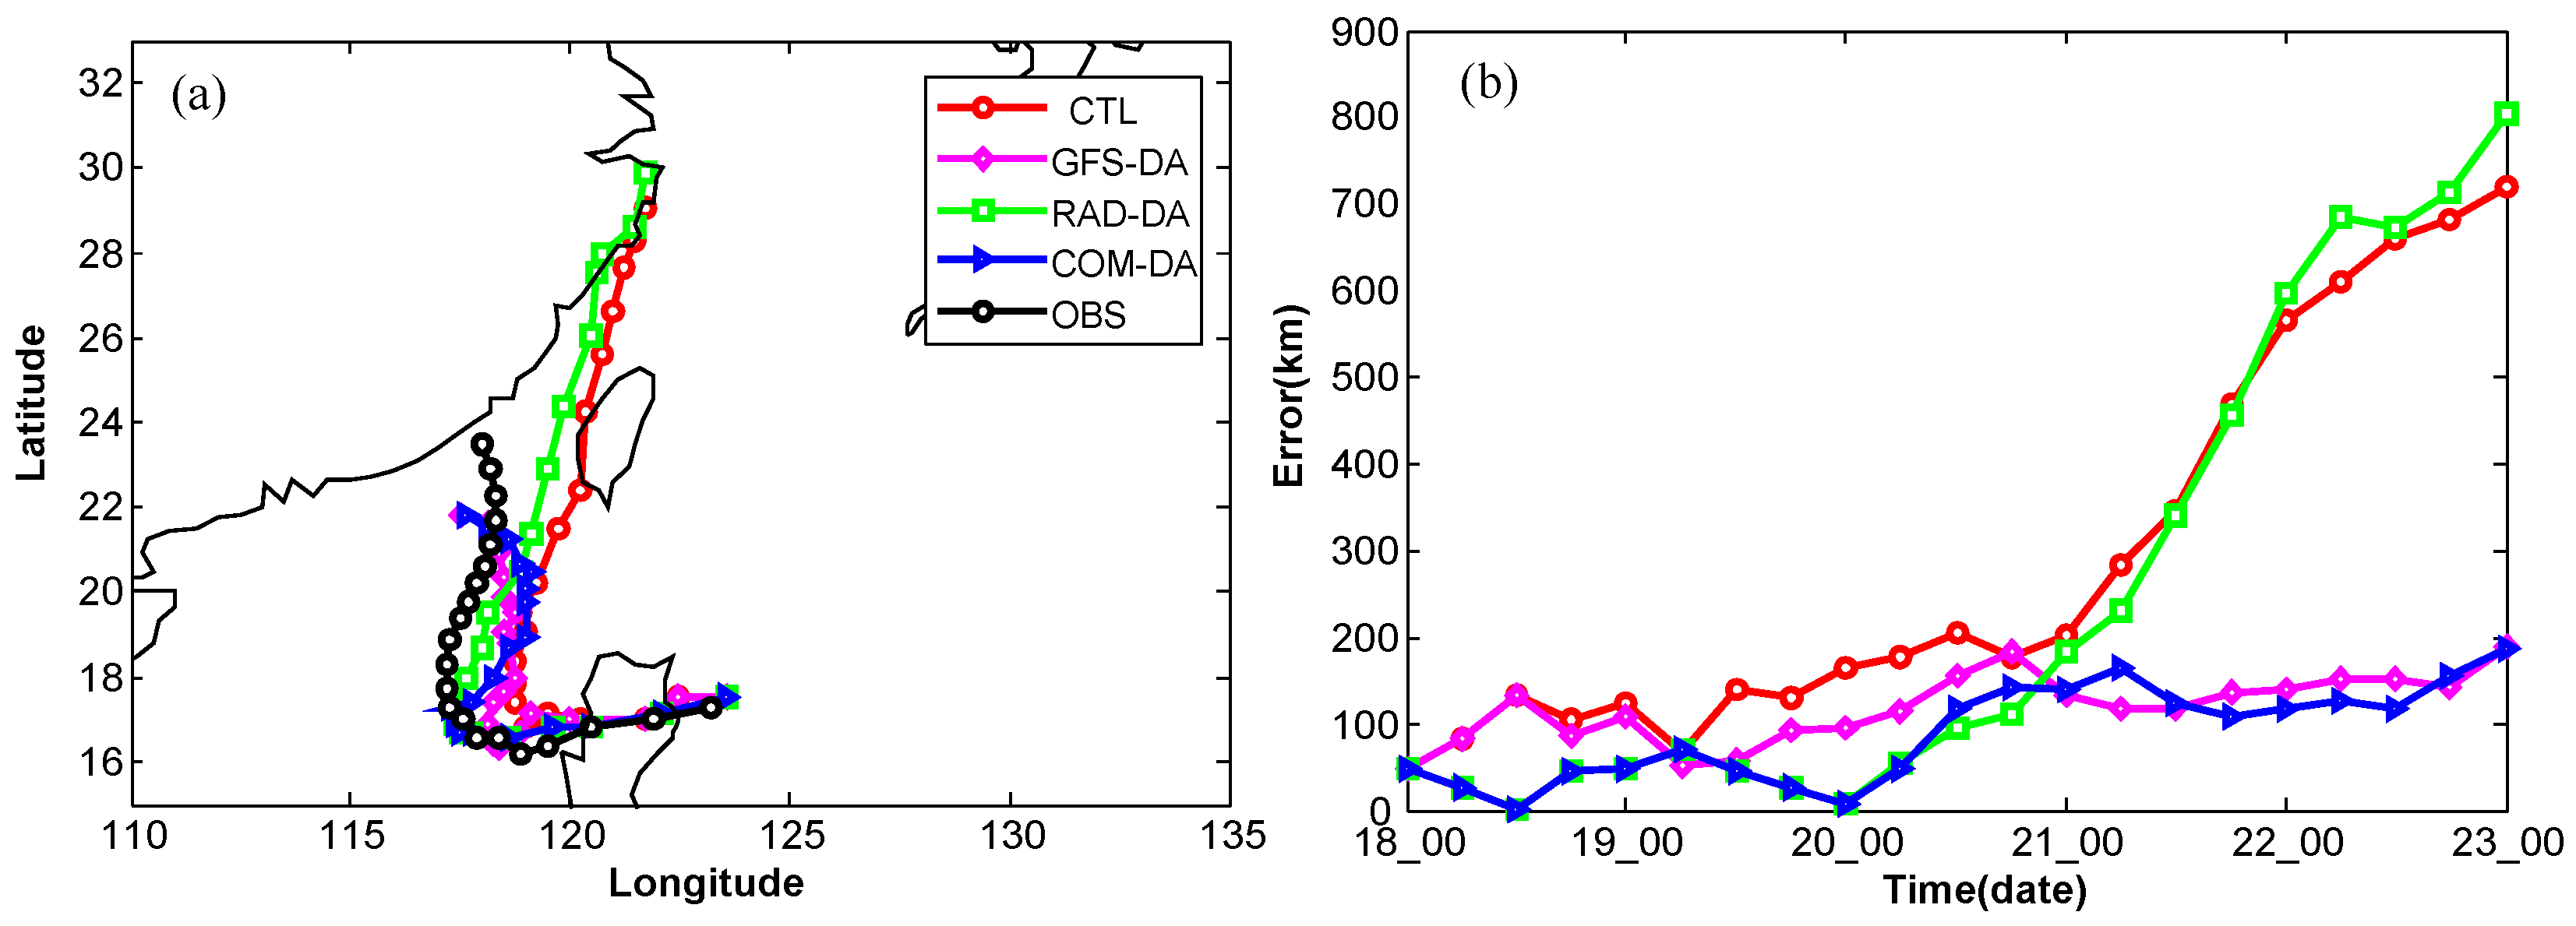
4.1. Forecasted Tracks from Different Experiments

Figure 4 shows the observed and forecasted track of Megi (2010) as well as the corresponding errors for all experiments. It is clear that all three data assimilation experiments, including RAD-DA, GFS-DA, and COM-DA, perform better than CTL in terms of track forecast. The forecasted track from CTL deviates to the east of the best track. It curves northward earlier and moves much faster than the best track. After optimizing the initial conditions through assimilating AMSU-A radiance data into the model (RAD-DA), the forecasted track steers west–southwest towards the “observed” track, and the smallest TPE is obtained in the first 3 days. However, the TC then moves much faster to the northeast, similarly to that in CTL. For the GFS-DA experiment, assimilating large-scale flows from the GFS global model forecasts to adjust corresponding components in the regional model periodically at preset intervals not only slows the northeastward track down, but also steers it west–southwest to be closer to the observed track, and thus results in significant improvements in the track forecast of Megi (2010) compared with that from the CTL approach. Though RAD-DA slightly outperforms GFS-DA in the first 72 h, the latter performs much better than the former after 72 h. When assimilating both AMSU-A radiance data and large-scale GFS flows by combining the approaches used in RAD-DA and GFS-DA, the forecasted track from COM-DA steers west–southwestward to be closer to the “observed” one than that from CTL in the first 48 h (which is similar to that from RAD-DA), and then follows that from GFS-DA, leading to the smallest TPEs nearly in all 5 days of forecasts. Detail analyses are presented in the following paragraphs.

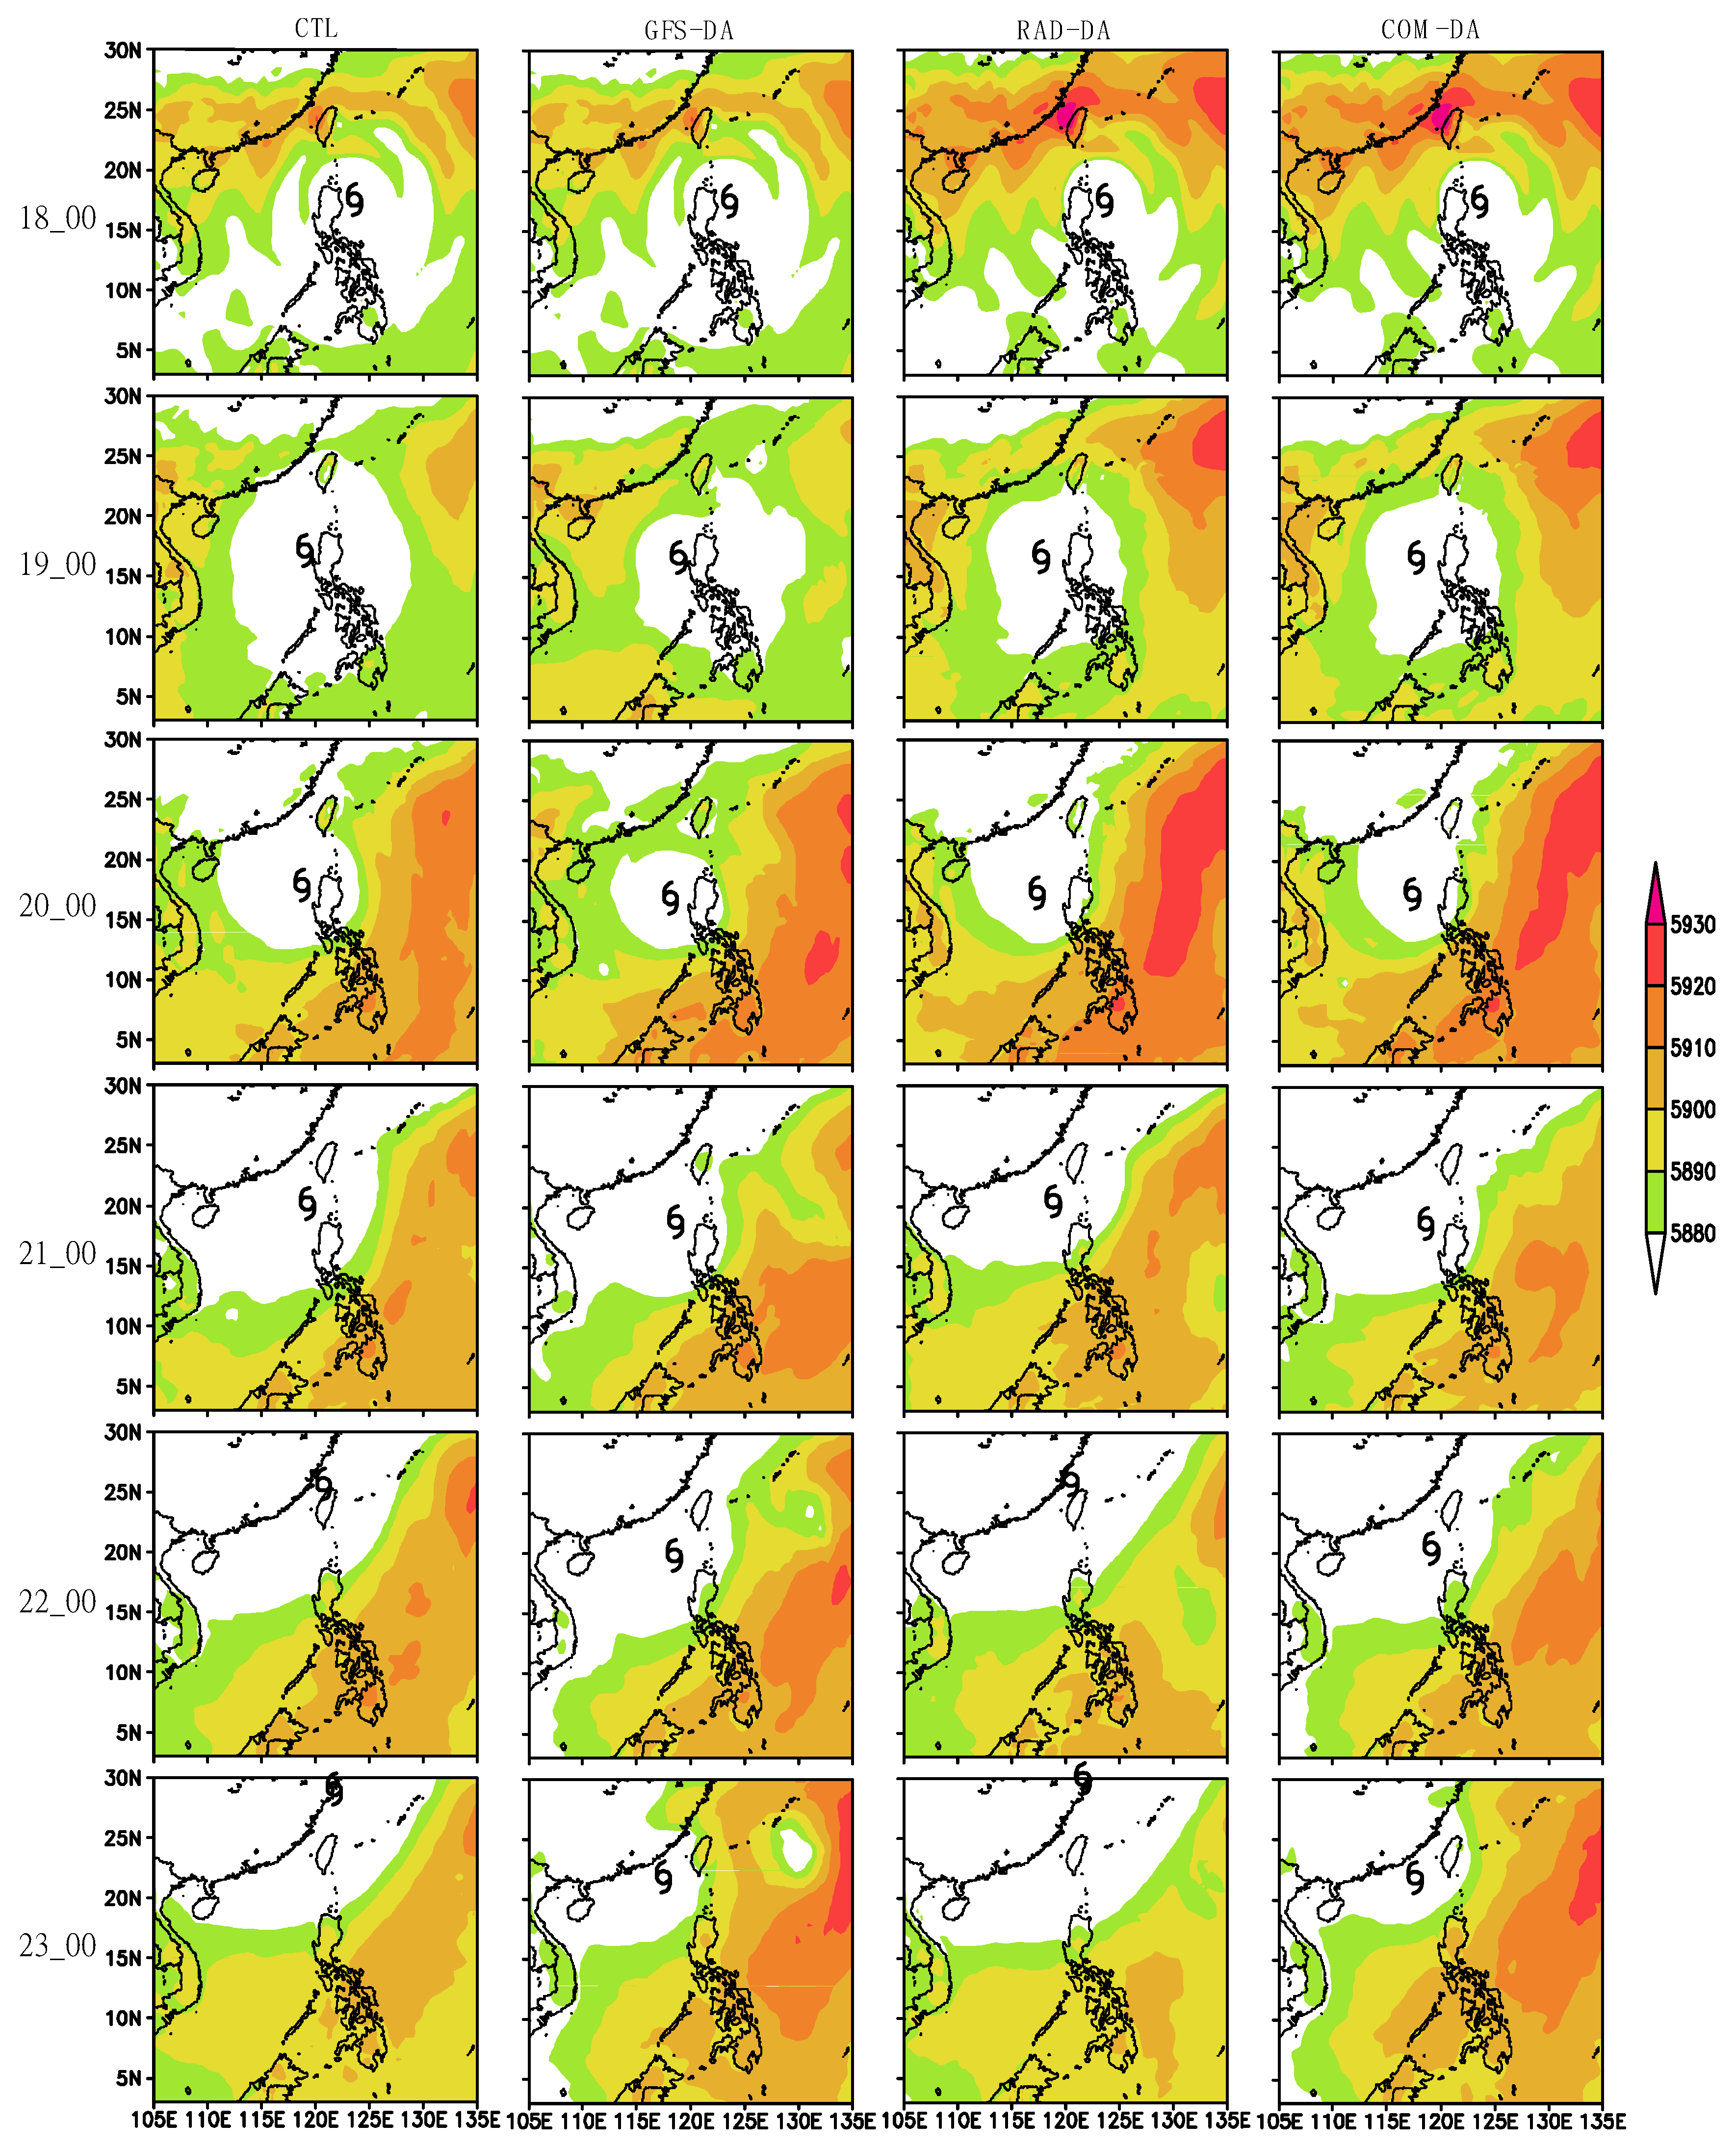
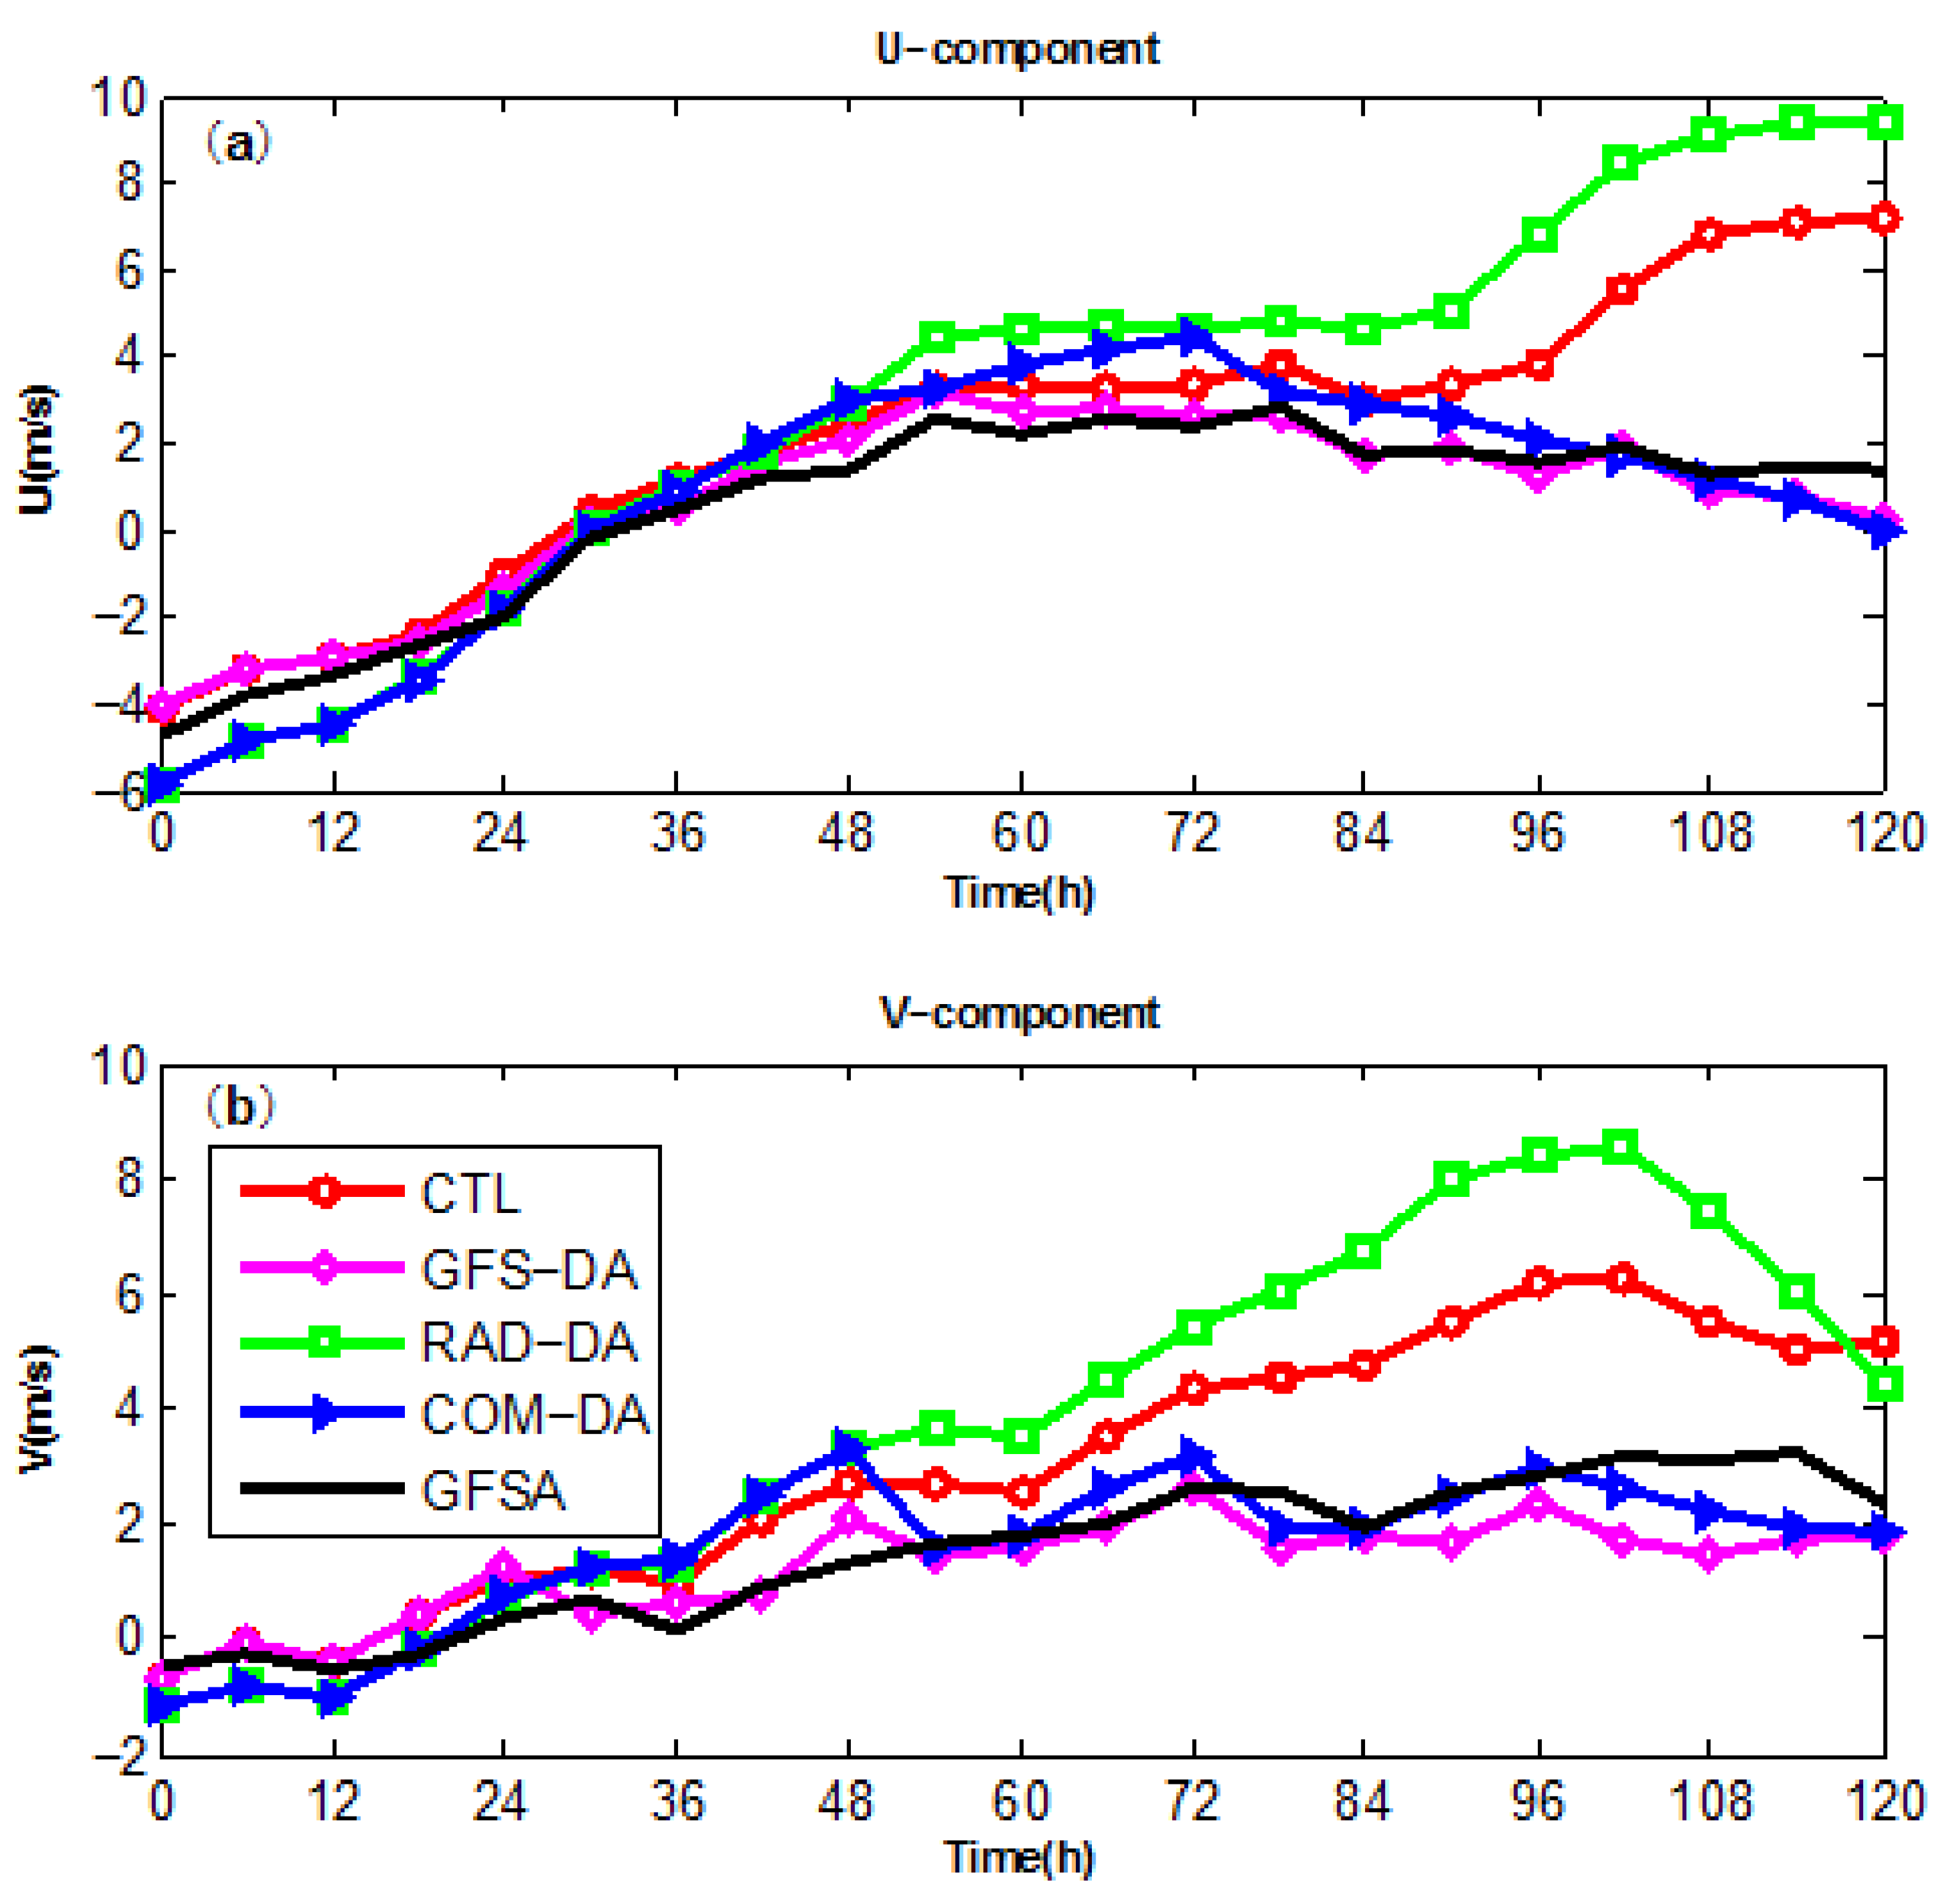
4.2. Analysis and Discussion

Because the same observations have been assimilated into the WRF model in RAD-DA and COM-DA, the initial conditions after the assimilation should be the same and thus only those for RAD-DA are shown here. Figure 5 presents the initial temperature and its increment against CTL at different vertical layers in RAD-DA. Compared with CTL (not shown), the temperature structure at these levels does not appear to change after assimilating the radiance data. However, the increment field (contour line) indicates that the temperature increases (decreases) at the lower and middle (upper) layers of the atmosphere over the western and northwestern areas of the TC center. This may cause temperature stratification that is more unstable in these regions. According to the study by Chen et al. [43], which shows that a TC has the trend to move towards the region with high unstable stratification regarding to temperature and/or humidity, such an adjustment of temperature field after the assimilation of AMSU-A radiance is beneficial for the TC to move towards the west first and then turn to the north. The initial geopotential heights at 500 hPa in Figure 6 indicate that, after the assimilation of AMSU-A radiance, the subtropical high to the north of the TC center in RAD-DA is much stronger than that in CTL. Besides, the mean wind increments at 500–700 hPa for RAD-DA against CTL (Figure 6b) show that there is an anomalously anticyclonic flow, with its southeast branch locating at the TC center forecasted by RAD-DA. All these adjustments of the initial conditions after the assimilation of AMSU-A radiance would inevitably lead to changes of the large-scale environmental fields and the steering flows, which would favor the west–southwestward movement of the TC.
In the GFS-DA experiment, the large-scale wind fields forecasted by the GFS global model system were assimilated into the model at an interval of 12 h, starting at the 12th hour of the model integration to adjust the large-scale wind components. As such, the biases of large-scale wind fields for GFS-DA were reduced substantially compared with CTL (Figure 7). Figure 8 displays the root-mean-square errors (RMSEs) of large-scale u and v components for all experiments against the corresponding components of GFS analysis. Compared with CTL, the RMSEs of the large-scale wind components for RAD-DA only slightly decrease at lower layers, while the RMSEs for GFS-DA and COM-DA significantly decrease at nearly all vertical levels, with those for COM-DA being the smallest.
The geopotential heights at 500 hPa valid at 0000 UTC every day for all experiments are displayed in Figure 9. It is evident that the subtropical high to the north of the TC center in the three data assimilation experiments is much stronger than that in CTL before the TC track turns north, which is beneficial for the TC to move westward. Furthermore, because AMSU-A radiance data have been used to optimize the model initial conditions by the 3DVAR technique, the subtropical high in RAD-DA is stronger than that in GFS-DA, resulting in a better performance of RAD-DA in the forecast of the westward TC track before the big curvature as compared with that of CTL or GFS-DA. After 0000 UTC 20 October, however, the subtropical high in RAD-DA rapidly weakens and steers the TC to quickly move northeastward similar to that in CTL. The subtropical high slowly weakens in the GFS-DA experiment, with a spatial pattern that facilitates the TC to move northward instead of northeastward, resulting in a better performance of GFS-DA in the forecast of the northward TC track after the big curvature as compared with that of CTL or RAD-DA. For the COM-DA experiment, because both the initialization using the AMSU-A radiance data as that in RAD-DA and the large-scale flow adjustment using the SSDA technique as that in GFS-DA are carried out, the subtropical high keeps both the feature found in RAD-DA before the big curvature and that found in GFS-DA after the big curvature, leading to the best performance of the track forecast among all experiments with respect to the entire life cycle of Megi (2010).
As a TC is mainly guided by the large-scale environmental steering flows [44,45,46,47,48], here we calculate the steering flows through averaging the wind vectors in the vertical levels between 700 hPa and 500 hPa along a 5°–7° radial band from the TC center. Figure 10 shows the u and v components of the environmental steering flows valid at different forecast time for all experiments. The steering flows forecasted by CTL and RAD-DA obviously deviate those from GFS analysis after 72 h, which corresponds to the large TPEs in the last 48 h for the two experiments. Enhanced southwestward (negative u and v components) steering flows in the early stage and enhanced northeastward (positive u and v components) steering flows in the later are obtained in the RAD-DA experiment with the assimilation of AMSU-A radiance data. Such an adjustment of steering flows in RAD-DA drives an enhanced southwestward (northeastward) movement of the TC in the early (later) stage, resulting in the smallest TPE in the first 72 h and a larger TPE later. For GFS-DA, the strength of both southerly (positive v component) and westerly (positive u component) of the steering flows in the later stage are significantly reduced as compared with those in CTL and RAD-DA due to the assimilation of large-scale wind components from the GFS global model forecasts, which slows down the northward movement of Typhoon Megi (2010) and steers it west toward the best track. It is worth noting that the adjustment of the steering flows in GFS-DA is relatively small at the beginning; however, it obviously increases after 72 h, which is why larger improvement in the track forecast from GFS-DA is seen after 72 h. It is apparent that the steering flows in COM-DA remain the same as those found in RAD-DA during the first 48 h and become more similar to those found in GFS-DA.
For a further assessment on the effect of assimilating both AMSU-A radiance data and large-scale GFS flows, we carried out the same experiments (TCL, GFS-DA, RAD-DA, and COM-DA) as above with a different initialization time for Megi (2010) as well as for another strong typhoon Nesat (2011), which has completely different track, as depicted in Table 3. The experiments for Megi (2010) and for Nesat (2011) were initialized every 6 h from 0000 UTC 17 Sep 2010 to 1800 UTC 18 Sep 2010 and from 0000 UTC 24 Sep 2011 to 1800 UTC 25 Sep 2011 to create 5-day forecasts, respectively. Thus, there are eight runs for each experiment for both Megi (2010) and Netsat (2011).
Table 4 presents the mean track forecast errors of Megi (2010) and Nesat (2011) for different forecast periods for each experiment. Generally, the 5-day mean TPEs from GFS-DA, RAD-DA, and COM-DA are reduced compared with CTL, and COM-DA has the smallest 5-day mean TPEs of 120.4 km and 268.3 km for Megi (2010) and Nesat (2011), respectively. As for different forecast periods, the TPEs from RAD-DA are smaller (larger) than those from GFS-DA before (after) the first 72 h, and COM-DA performs the best for the forecast periods of 12 h, 36 h, 48 h, 60 h, 72 h, 84 h, and 96 h for Megi (2010) and 12 h, 24 h, 36 h, 48 h, and 60 h for Netsat (2011). Therefore, while assimilating AMSU-A radiance data and large-scale GFS flows can achieve the largest improvement of track forecast for forecast periods within 72 h, it could be case dependent for those beyond 72 h.

5. Summaries

Reducing track forecast errors still remains one of top priorities in TC forecasting for forecasters for the sake of improving evacuation planning and disaster mitigation. In order to evaluate the effect of radiance data assimilation by the 3DVAR technique, large-scale GFS flows data assimilation by the SSDA approach and combining the use of both in TC track forecasting, a set of experiments using different data assimilation schemes was performed on Typhoon Megi (2010). The results indicate that AMSU-A radiance data assimilation for the model initialization was effective and better than the SSDA approach in improving the track forecast in the first 3 days. However, the improvements from AMSU-A radiance data assimilation vanish after 3 days because of the rapid decay of the effect of the optimized initial conditions with forecasting time. Assimilating large-scale wind components from GFS global model forecast into the regional model periodically at a preset time by the SSDA approach directly improves the large-scale environmental fields through correcting the large-scale bias of the regional model forecasts and is more effective than the AMSU-A radiance data assimilation in improving TC track forecasts for forecasting periods longer than 72 h. Assimilating both AMSU-A radiance data and large-scale GFS flows inherits the advantages of the both, not only optimizing the model initial conditions but also correcting the large-scale bias of the regional model forecasts, thus leading to the smallest 5-day mean TPEs; however, the improvement could be case dependent for the forecast periods beyond 72 h.
The effect of combining the use of radiance data assimilation and the SSDA approach, however, is still subject to a statistical assessment through a number of TC cases before it can be applied in operational TC track forecasts. Moreover, the setting of some parameters in the SSDA approach, such as the cut-off wave numbers for large scale component and the time interval of SSDA cycle, is also adjustable for different regions. These will be part of our work in the future.

Author Contributions

Data curation, Z.L.; formal analysis, Z.L.; investigation, Z.L.; methodology, Z.L. and S.P.; validation, Z.L.; writing—original draft, Z.L.; writing—review and editing, Z.L. and S.P. All authors have read and agreed to the published version of the manuscript.

Funding

This study is jointly supported by the China Special Fund for Meteorological Research in the Public Interest (Grant No. GYHY201406008), the National Natural Science Foundation of China (Grant No. 41931182, 41521005, and 41676016), the Guangdong Key Project (Grant No. GDME2018B001, 2019BT2H594), the Key Special Project for Introduced Talents Team of Southern Marine Science and Engineering Guangdong Laboratory (Guangzhou) (Grant No. GML2019ZD0303 and GML2019ZD0304), and the Chinese Academy of Sciences (Grant No. ZDRW-XH-2019-2).

Institutional Review Board Statement

Not applicable.

Informed Consent Statement

Not applicable.

Data Availability Statement

The JTWC tropical cyclone best track data were obtained from http://www.usno.navy.mil/NOOC/nmfc-ph/RSS/jtwc/best_tracks/ a few years ago. GFS global model forcast and analyses data were provided by courtesy of NCEP and UCAR (ftp://ftp.ncep.noaa.gov/pub/data/nccf/com/gfs/prod/ and https://rda.ucar.edu/datasets/ds335.0/, accessed on 22 November 2022). AMSU-A Radiance Data are accessible via https://rda.ucar.edu/datasets/ds735.0/, accessed on 22 November 2022.

Acknowledgments

The authors gratefully acknowledge the anonymous reviewers for their excellent comments and efforts, as well as the use of the High Performance Computing Cluster from South China Sea Institute of Oceanology, Chinese Academy of Sciences.

Conflicts of Interest

The authors declare no conflict of interest.

References

  1. Goerss, J.S.; Sampson, C.R.; Gross, J.M. A History of Western North Pacific Tropical Cyclone Track Forecast Skill. Weather Forecast. 2004, 19, 633–638. [Google Scholar] [CrossRef]
  2. Cangialosi, J.P.; Franklin, J.L. 2010 National Hurricane Center Forecast Verfication Report; NOAA: Silver Spring, MD, USA, 2011; p. 77.
  3. Yu, H.; Chan, S.T.; Brown, B.; Kunitsugu, M.; Fukada, E.; Park, S.; Lee, W.; Xu, Y.; Phalla, P.; Sysouphanthavong, B.; et al. Operational tropical cyclone forecast verification practice in the western North Pacific region. Trop. Cyclone Res. Rev. 2012, 1, 361–372. [Google Scholar]
  4. Qian, C.; Duan, Y.; Ma, S.; Xu, Y. The Current Status and Future Development of China Operational Typhoon Forecasting and Its Key Technologies. Adv. Meteorol. Sci. Technol. 2012, 2, 6–43. [Google Scholar]
  5. Gao, X. The accuracy of typhoon track forecasts in China hits a new record. Emerg. Manag. China 2015, 11, 74. [Google Scholar]
  6. Lei, X.; Chen, G.; Zhang, X.; Chen, P.; Yu, H.; Wan, R. Performance of Tropical Cyclone Forecast in Western North Pacific in 2016. In Proceedings of the Forty-ninth Session of ESCAP/WMO Typhoon Committee, Yokohama, Japan, 21–24 February 2017. [Google Scholar]
  7. Bjerknes, V. Dynamic meteorology and hydrographs, Part II. In Kinematics; Camegie Institute: New York, NY, USA, 1911. [Google Scholar]
  8. Zhang, S.; Wang, S. Numerical experiments of the prediction of typhoon tracks by using satellite cloud-derived wind. J. Trop. Meteor. 1999, 15, 347–355. [Google Scholar]
  9. Zhou, X.; Zhu, Y. Numerical study on the effect of asymmetric diabatic heating on tropical cyclone motion. Q. J. Appl. Meteorol. 1999, 10, 284–292. [Google Scholar]
  10. Kidder, S.Q.; Goldberg, M.D.; Zehr, R.M.; Demaria, M.; Purdom, J.F.W.; Velden, C.S.; Grody, N.C.; Kusselson, S.J. Satellite Analysis of Tropical Cyclones Using the Advanced Microwave Sounding Unit (AMSU). Bull. Amer. Meteor. Soc. 2000, 81, 1241–1259. [Google Scholar] [CrossRef]
  11. Zhang, H. Chapter 5, the Application of the ATOVS Radiance Microwave Data (I)—The Satellite Observation of the Typhoon Structure in Northwest Pacific, the Direct Assimilation Method and Application Research of the ATOVS Radiance Data. Ph.D. Thesis, Lanzhou University, Lanzhou, China, 2003; pp. 62–86. [Google Scholar]
  12. Cui, L.; Sun, J.; Qi, L.; Lei, T. Application of ATOVS Radiance-Bias Correction to Typhoon Track Prediction with Ensemble Kalman Filter Data Assimilation. Adv. Atmos. Sci. 2011, 28, 178–186. [Google Scholar] [CrossRef]
  13. Liu, Q.; Weng, F. Radiance assimilation in studying Hurricane Katrina. Geophys. Res. Lett. 2006, 33, L22811. [Google Scholar] [CrossRef]
  14. Sandeep, S.; Chandrasekar, A.; Singh, D. The impact of assimilation of AMSU data for the prediction of a tropical cyclone over India using amesoscale model. Int. J. Remote Sens. 2006, 27, 4621–4653. [Google Scholar] [CrossRef]
  15. Zhang, H.; Xue, J.; Zhu, G.; Zhuang, S.; Wu, X.; Zhang, F. Application of Direct Assimilation of ATOVS Microwave Radiances to Typhoon Track Prediction. Adv. Atmos. Sci. 2004, 21, 283–290. [Google Scholar] [CrossRef]
  16. Zhang, M.; Zupanski, M.; Kim, M.-J. Assimilating AMSU-A Radiances in the TC Core Area with NOAA Operational HWRF (2011) and a Hybrid Data Assimilation System: Danielle (2010). Mon. Weather Rev. 2013, 141, 3889–3907. [Google Scholar] [CrossRef] [Green Version]
  17. Peng, S.; Xie, L.; Liu, B.; Semazzi, F. Application of Scale-Selective Data Assimilation to Regional Climate Modeling and Prediction. Mon. Weather Rev. 2010, 138, 1307–1318. [Google Scholar] [CrossRef] [Green Version]
  18. Lai, Z.; Hao, S.; Peng, S.; Liu, B.; Gu, X.; Qian, Y.-K. On Improving Tropical Cyclone Track Forecasts Using a Scale-Selective Data Assimilation Approach: A Case Study. Nat. Hazards 2014, 73, 1353–1368. [Google Scholar] [CrossRef]
  19. Liu, B.; Xie, L. A Scale-Selective Data Assimilation Approach to Improving Tropical Cyclone Track and Intensity Forecasts in a Limited-Area Model: A Case Study of Hurricane Felix (2007). Weather. Forecast. 2012, 27, 124–140. [Google Scholar] [CrossRef]
  20. Xie, L.; Liu, B.; Peng, S. Application of scale-selective data assimilation to tropical cyclone track simulation. J. Geophys. Res. 2010, 115, D17105. [Google Scholar] [CrossRef] [Green Version]
  21. Chou, J. Some properties of operators and the effect of Initial condition. Acta. Meteorol. Sin. 1983, 41, 385–392. [Google Scholar]
  22. Ding, W.; Wan, Q.; Yan, J.; Huang, Y.; Chen, Z. Impact of The Initialization on Mesoscale Model Predition in South China. J. Trop. Meteor. 2006, 22, 10–17. [Google Scholar]
  23. Skamarock, W.C.; Klemp, J.B.; Dudhia, J.; Gill, D.O.; Barker, D.M.; Duda, M.G.; Huang, X.Y.; Wang, W.; Powers, J.G. A Description of the Advanced Research WRF Version 3. In NCAR Tech Note; Mesoscale and Microscale Meteorology Division, National Center for Atmospheric Research: Boulder, CO, USA, 2008. [Google Scholar]
  24. Wang, W.; Bruyere, C.; Duda, M.; Dudhia, J.; Gill, D.; Kavulich, M.; Keene, K.; Lin, H.-C.; Michalakes, J.; Rizvi, S.; et al. Advanced Research WRF (ARW) Version 3 Modeling system user’s guide. In ARW Tech Note; Mesoscale and Microscale Meteorology Division, National Center for Atmospheric Research: Boulder, CO, USA, 2014. [Google Scholar]
  25. Han, Y.; Delst, P.V.; Liu, Q.; Weng, F.; Yan, B.; Derber, J. User’s Guider to the JCSDA Community Radiative Transfer Model (Beta Version); Joint Center for Satellite Data Assimilation: Camp Springs, MD, USA, 2005. [Google Scholar]
  26. Han, Y.; Delst, P.V.; Liu, Q.; Weng, F.; Yan, B.; Treadon, R.; Derber, J. JCSDA Community Radiative Transfer Model (CRTM), Version 1. In NOAA Technical Report; NESDIS: Silver Spring, MD, USA, 2006; Volume 122, p. 33. [Google Scholar]
  27. Kleespies, T.J.; Delst, P.V.; McMillin, L.M.; Derber, J. Atmospheric transmittance of an absorbing gas. 6. An OPTRAN status report and introduction to the NESDIS/NCEP Community Radiative Transfer Model. Appl. Opt. 2004, 43, 3103–3109. [Google Scholar] [CrossRef]
  28. McMillin, L.M.; Core, L.J.; Kleespies, T.J. Atmospheric transmittance of an absorbing gas. 5: Improvements to the OPTRAN approach. Appl. Opt. 1995, 34, 8396–8399. [Google Scholar] [CrossRef]
  29. Liu, Q.; Weng, F. Advanced Doubling-Adding Method for Radiative Transfer in Planetary Atmospheres. J. Atmos. Sci. 2006, 63, 3459–3465. [Google Scholar] [CrossRef]
  30. Derber, J.C.; Wu, W.S. The use of TOVS cloud-cleared radiances in the NCEP SSI analysis system. Mon. Weather Rev. 1998, 126, 2287–2299. [Google Scholar] [CrossRef]
  31. Eyre, J.R. A bias correction scheme for simulated TOVS brightness temperatures. Tech. Memo. 1992, 176, 81–109. [Google Scholar]
  32. Harris, B.A.; Kelly, G. A satellite radiance bias correction scheme for data assimilation. Quart. J. R. Meteor. Soc. 2001, 127, 1453–1468. [Google Scholar] [CrossRef]
  33. Ferraro, R.R.; Weng, F.; Grody, N.C.; Zhao, L. Precipitation characteristics over land from the NOAA-15 AMSU sensor. Geophys. Res. Lett. 2000, 27, 2669–2672. [Google Scholar] [CrossRef]
  34. Grody, N.C.; Zhao, L.; Ferraro, R.R.; Weng, F.; Boers, R. Determination of precipitable water and cloud liquid water over oceans from the NOAA-15 advanced microwave sounding unit. J. Geophys Res. 2001, 106, 2943–2953. [Google Scholar] [CrossRef]
  35. Qian, C.; Zhang, F.; Green, B.W. Probabilistic Evaluation of the Dynamics and Prediction of Supertyphoon Megi (2010). Weather Forecast. 2013, 28, 1562–1577. [Google Scholar] [CrossRef]
  36. Bougeault, P.; Lacarrère, P. Parameterization of orography-induced turbulence in a mesobeta-scale model. Mon. Weather Rev. 1989, 117, 1872–1890. [Google Scholar] [CrossRef]
  37. Kain, J.S.; Fritsch, J.M. A one-dimensional entraining detraining plume model and its application in convective parameterization. J. Atmos. Sci. 1990, 47, 2784–2802. [Google Scholar] [CrossRef]
  38. Ferrier, B.S.; Jin, Y.; Lin, Y.; Black, T.; Rogers, E.; DiMego, G. Implementation of a new grid-scale cloud and precipitation scheme in the NCEP Eta model; Preprints. In Proceedings of the 19th Conference on Weather Analysis and Forecasting/15th Conference on Numerical Weather Prediction, San Antonio, TX, USA, 12–16 August 2002; American Meteorological Society: Boston, MA, USA; pp. 280–283. [Google Scholar]
  39. Dudhia, J. Numerical study of convection observed during the Winter Monsoon Experiment using a mesoscale two-dimensional model. J. Atmos. Sci. 1989, 46, 3077–3107. [Google Scholar] [CrossRef]
  40. Mlawer, E.J.; Taubman, S.J.; Brown, P.D.; Iacono, M.J.; Clough, S.A. Radiative transfer for inhomogeneous atmosphere: RRTM, a validated correlated-k model for the longwave. J. Geophys. Res. 1997, 102, 16663–16682. [Google Scholar] [CrossRef] [Green Version]
  41. Neumann, C.J.; Pelissier, J.M. An analysis of Atlantic tropical cyclone forecast errors, 1970-1979. Mon. Weather Rev. 1981, 109, 1248–1266. [Google Scholar] [CrossRef]
  42. Powell, M.D.; Aberson, S.D. Accuracy of United States Tropical Cyclone Landfall Forecasts in the Atlantic Basin (1976-2000). Bull. Am. Meteor. Soc. 2001, 82, 2749–2767. [Google Scholar] [CrossRef]
  43. Chen, L.; Xu, X.; Xie, Y.; Li, W. The Effect of Tropical Cyclone Asymmetric Thermodynamic Structure on Its Unusual Motion. Sci. Atmos. Sin. 1997, 21, 83–90. [Google Scholar]
  44. Chan, J.C.L.; Gray, W.M. Tropical cyclone movement and surrounding flow relationships. Mon. Weather Rev. 1982, 110, 1354–1374. [Google Scholar] [CrossRef]
  45. Deng, G.; Zhou, Y.-S.; Liu, L.-P. Use of a new steering flow method to predict tropical cyclone motion. J. Trop. Meteor. 2010, 16, 154–159. [Google Scholar]
  46. Dong, K.; Neumann, C.J. On the relative motion of binary tropical cyclones. Mon. Weather Rev. 1983, 111, 945–953. [Google Scholar] [CrossRef]
  47. Franklin, J. Dropwindsonde observations of the environmental flow of Hurricane Josephine (1984)—Relationships to vortex motion. Mon. Weather Rev. 1990, 118, 2732–2744. [Google Scholar] [CrossRef]
  48. Wang, B.; Elsberry, R.L.; Wang, Y.; Wu, L. Dynamics in Tropical Cyclone Motion: A Review. Chin. J. Atmos. Sci. 1998, 22, 416–434. [Google Scholar]
Figure 1. The number of radiance observations for different channels of different instruments used in the experiments in Section 3 and Section 4.
Atmosphere 13 01988 g001
Figure 2. The model domains of the WRF used for all experiments.
Atmosphere 13 01988 g002
Figure 3. Diagrams schematically illustrating the data assimilation scheme for the COM-DA experiment.
Atmosphere 13 01988 g003
Figure 4. Forecasted (a) tracks of typhoon Megi (2010) and (b) corresponding errors (unit: km) for experiments; CTL (in red), RAD-DA (in green), GFS-DA (in purple), and COM-DA (in blue). The best-track from the JTWC (OBS, in black) is also given as a reference.
Atmosphere 13 01988 g004
Figure 5. Initial temperature (shaded, unit: K) and temperature increment (RAD-DA minus CTL, contour, unit: K) at 200 hPa, 500 hPa, 700 hPa, and 850 hPa for the RAD-DA experiment.
Atmosphere 13 01988 g005
Figure 6. Initial geopotential heights (shaded, unit: gpm) at 500 hPa for the (a) CTL and (b) RAD-DA experiments, superimposed by the mean wind increments (RAD-DA minus CTL, arrows, unit: m/s) at 500–700 hPa.
Atmosphere 13 01988 g006
Figure 7. Biases of large-scale wind fields at 200 hPa for experiments (a) CTL and (b) GFS-DA against those in GFS analysis valid at 1200 UTC 19 Oct 2010 (right after the SSDA implementation; unit: m s−1). TC locations are indicated in red circles.
Atmosphere 13 01988 g007
Figure 8. Vertical profile of 5-day mean RMSEs of large-scale (a) u and (b) v components for each experiment against the corresponding components in the GFS analysis, averaged over all grids in the inner domain. (unit: m s−1).
Atmosphere 13 01988 g008
Figure 9. Geopotential heights (unit: gpm) at 500 hPa, valid at 0000 UTC of 18–23 Oct 2010 for experiments CTL, RAD-DA, GFS-DA, and COM-DA.
Atmosphere 13 01988 g009
Figure 10. Values of the (a) u and (b) v components of the steering flows at different forecast times for each experiment (unit: m s−1). The steering flows from the GFS analysis (OBS, in black) are also given as references.
Atmosphere 13 01988 g010
Table 1. Characteristics of the AMSU-A.
ChannelFrequency (GHz)Peak LevelMain Observation
AMSU-A123.8SurfaceSurface condition and the precipitable water
231.4SurfaceAs above
350.3SurfaceSurface emissivity
452.81000 hPaAtmospheric temperature
553.59 ± 0.115700 hPaAtmospheric temperature
654.4400 hPaAtmospheric temperature
759.94270 hPaAtmospheric temperature
855.5180 hPaAtmospheric temperature
9FLO = 57.2990 hPaAtmospheric temperature
10FLO ± 0.21750 hPaAtmospheric temperature
11FLO ± 0.322 ± 0.04825 hPaAtmospheric temperature
12FLO ± 0.322 ± 0.02212 hPaAtmospheric temperature
13FLO ± 0.322 ± 0.0105 hPaAtmospheric temperature
14FLO ± 0.322 ± 0.00452 hPaAtmospheric temperature
1589SurfaceSurface condition and the precipitable water
Table 2. Experiments designed in the study.
Exp. No.Exp. NameData AssimilatedAssimilation Method Used
1CTLNo No
2RAD-DAAMSU-A Radiance Data 3 DVAR technique
3GFS-DAlarge-scale GFS flowsScale-Selective Data Assimilation
4COM-DAAMSU-A Radiance Data and large-scale GFS flows3DVAR technique and Scale-Selective Data Assimilation
Table 3. Experiments included for further assessments in the study.
Exp. NameMegiNesat
CTL8 runs of 5-day forecast initialized every 6 hours from 0000 UTC 17 Sep 2010 to 1800 UTC 18 Sep 20108 runs of 5-day forecast initialized every 6 hours from 0000 UTC 24 Sep 2011to 1800 UTC 25 Sep 2011
RAD-DA
GFS-DA
COM-DA
Table 4. Mean track forecast errors of Typhoon Megi (2010) and Nesat (2011) at different forecast periods for the CTL, GFS-DA, RAD-DA, and COM-DA runs (unit: km).
Forecast Period (h) and (No. of Cases)TPEs of Megi (2010)TPEs of Nesat (2011)
CTLGFS-DARAD-DACOM_DACTLGFS-DARAD-DACOM_DA
12(8)73.4 73.4 58.4 58.4 114.8 111.8 89.3 89.3
24(8)67.9 69.6 74.1 74.1 134.2 149.1 93.1 93.1
36(8)82.7 76.3 74.3 74.3 215.7 184.7 142.5 142.5
48(8)127.5 115.6 98.9 98.9 285.6 215.5 188.4 188.4
60(8)150.0 130.6 127.2 122.5 353.0 251.8 248.7 229.8
72(8)147.4 152.9 187.1 126.1 434.6 259.3 311.0 269.4
84(8)197.6 166.7 292.8 142.3 526.2 307.0 390.2 327.8
96(8)296.5 163.1 426.7 138.0 617.5 348.1 472.6 375.4
108(8)378.9 151.0 535.6 166.1 748.8 430.4 595.6 453.5
120(8)449.9 174.5 652.8 203.5 923.2 480.7 770.4 513.5
Mean errors197.2 127.3 252.8 120.4 435.4 273.8 330.2 268.3
Publisher’s Note: MDPI stays neutral with regard to jurisdictional claims in published maps and institutional affiliations.

