
Spatial-Temporal Variation of AOD Based on MAIAC AOD in East Asia from 2011 to 2020
 , ,
, ,
Abstract
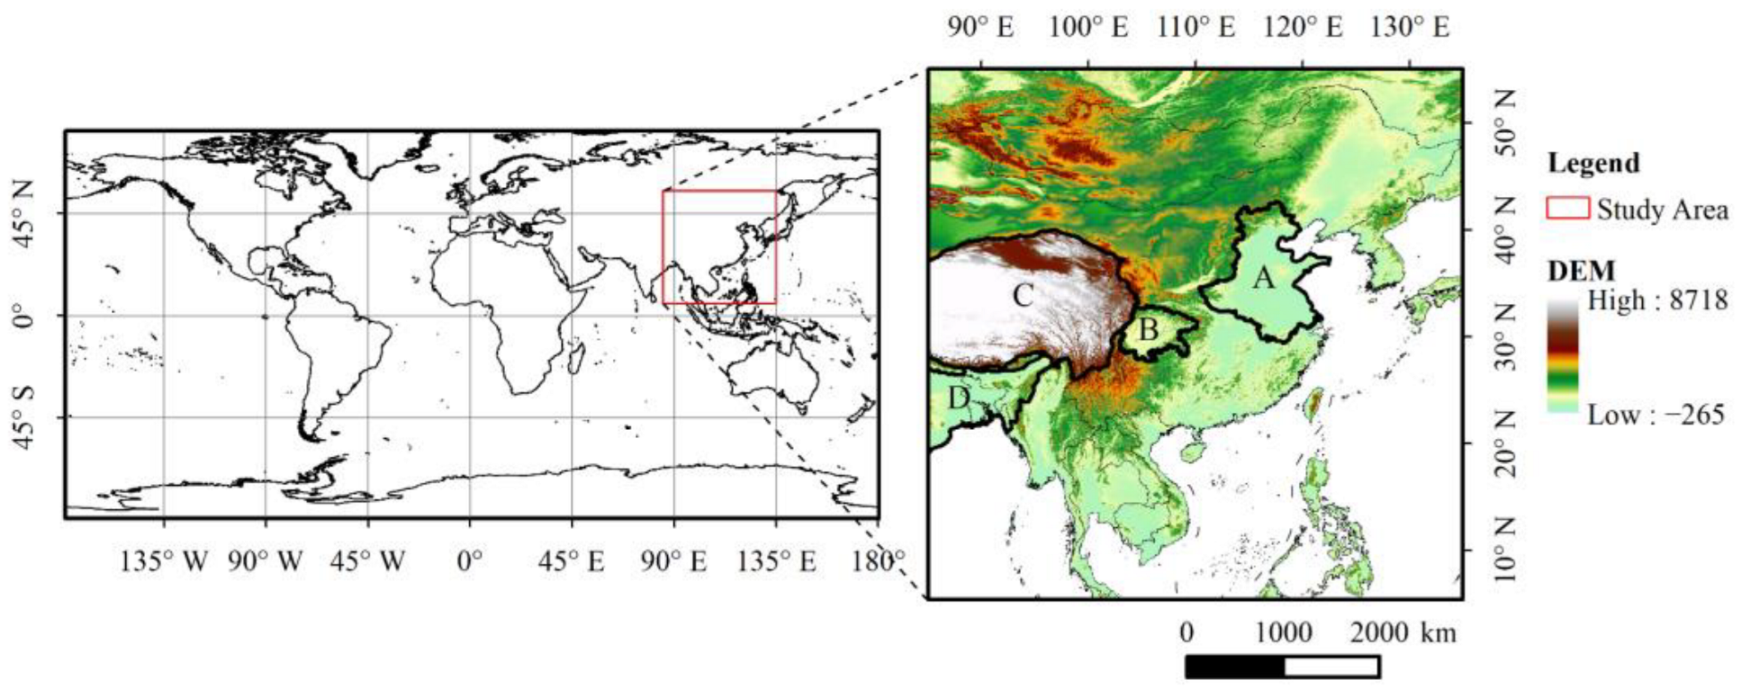
:1. Introduction
2. Data and Methods
2.1. Data
2.1.1. MAIAC AOD
2.1.2. DEM
2.2. Statistical Methods
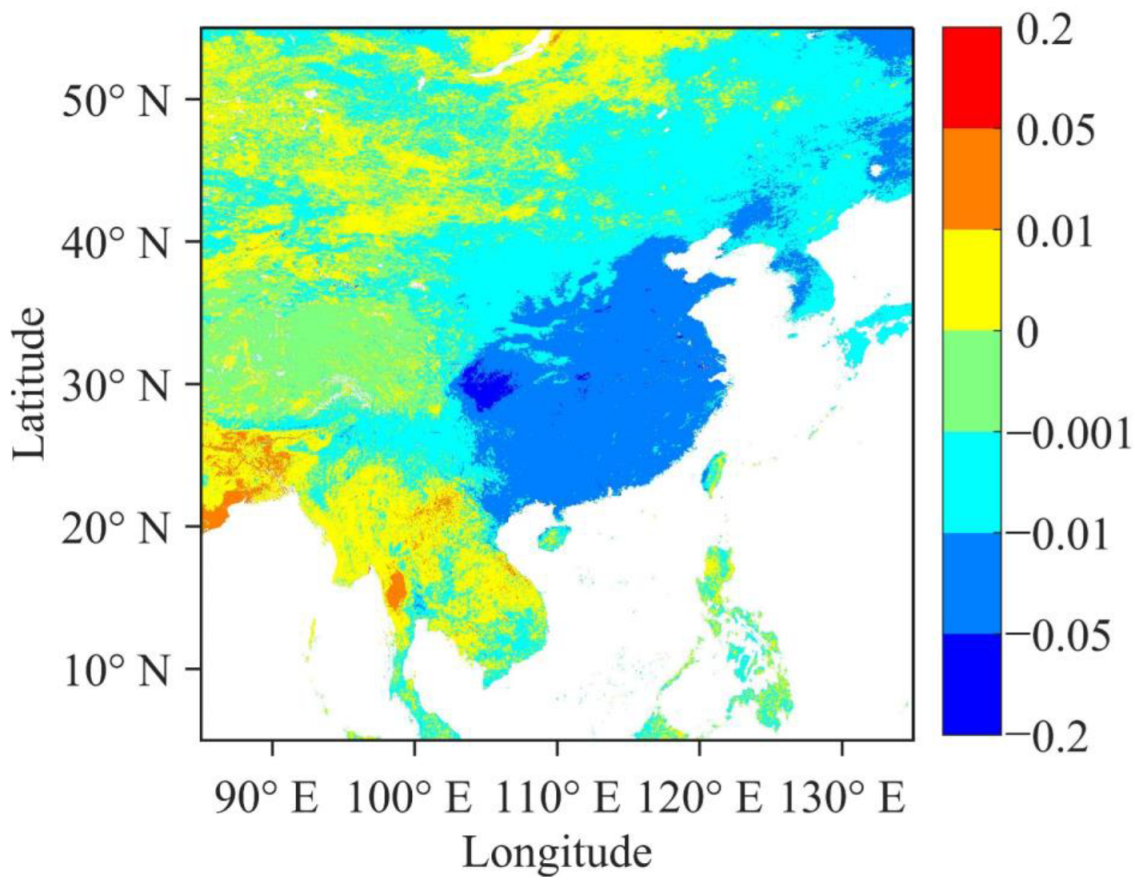
2.2.1. Linear Regression Trend Analysis
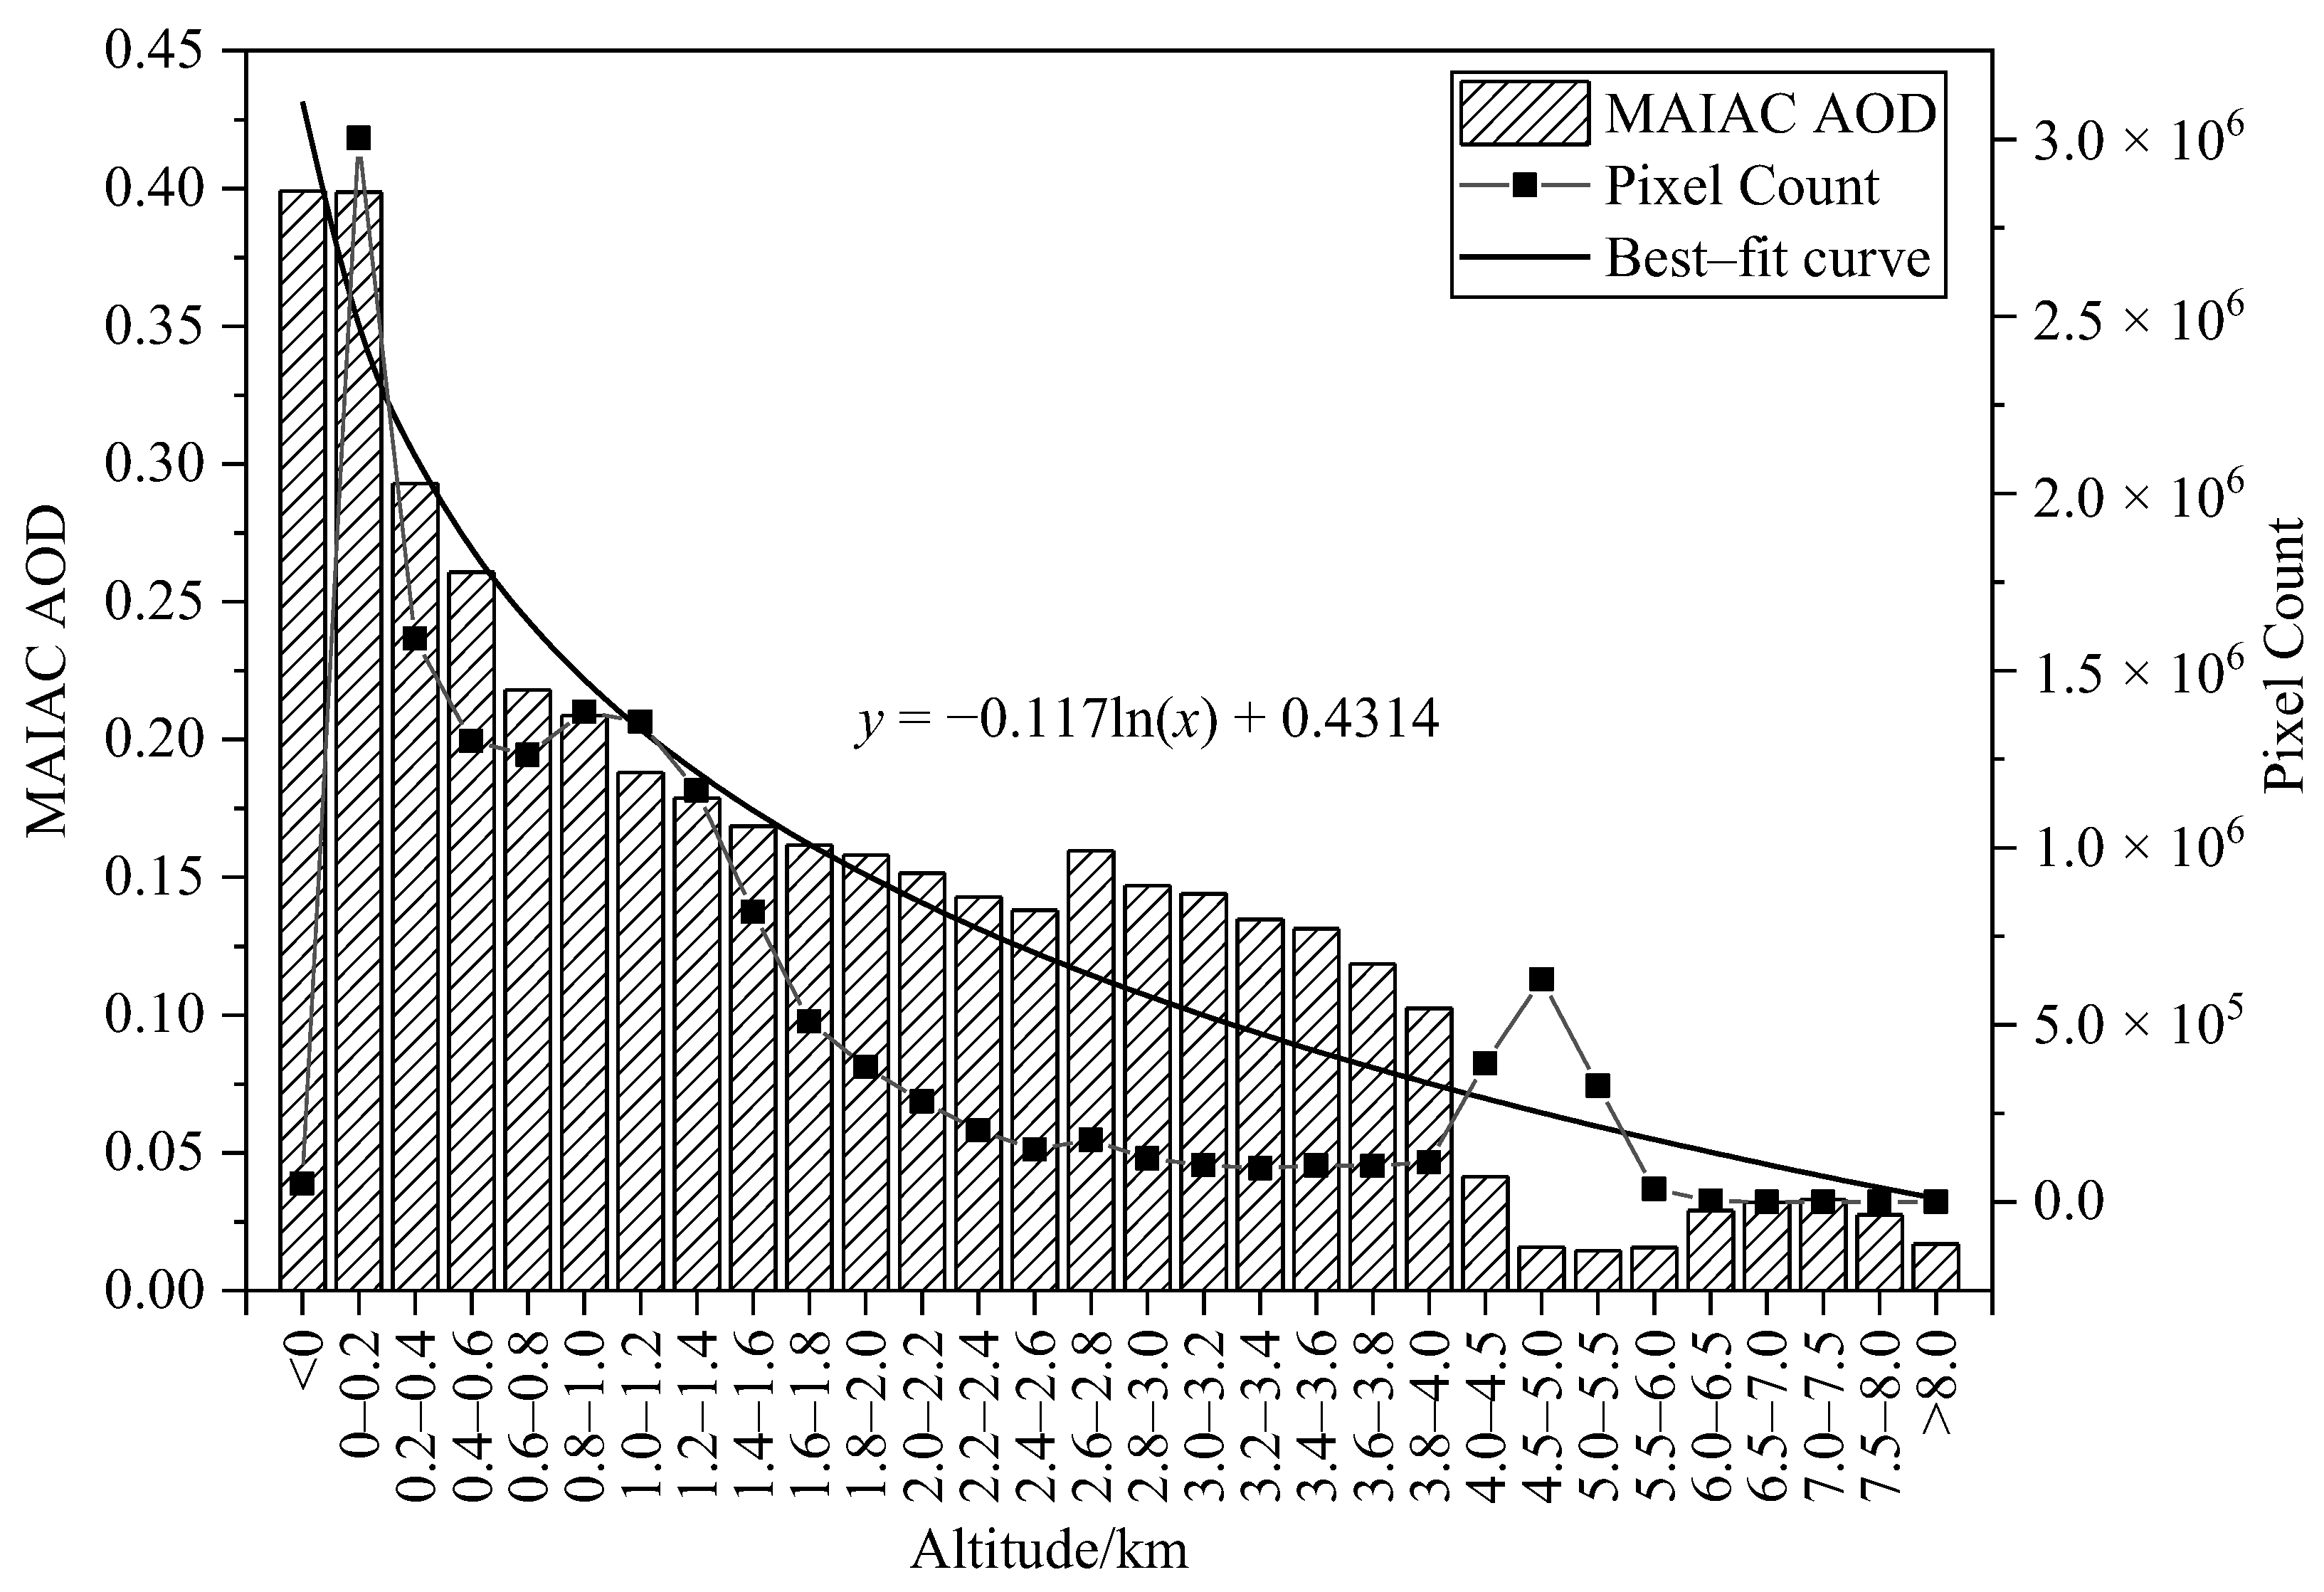
2.2.2. Fitting Model
3. Results and Discussion
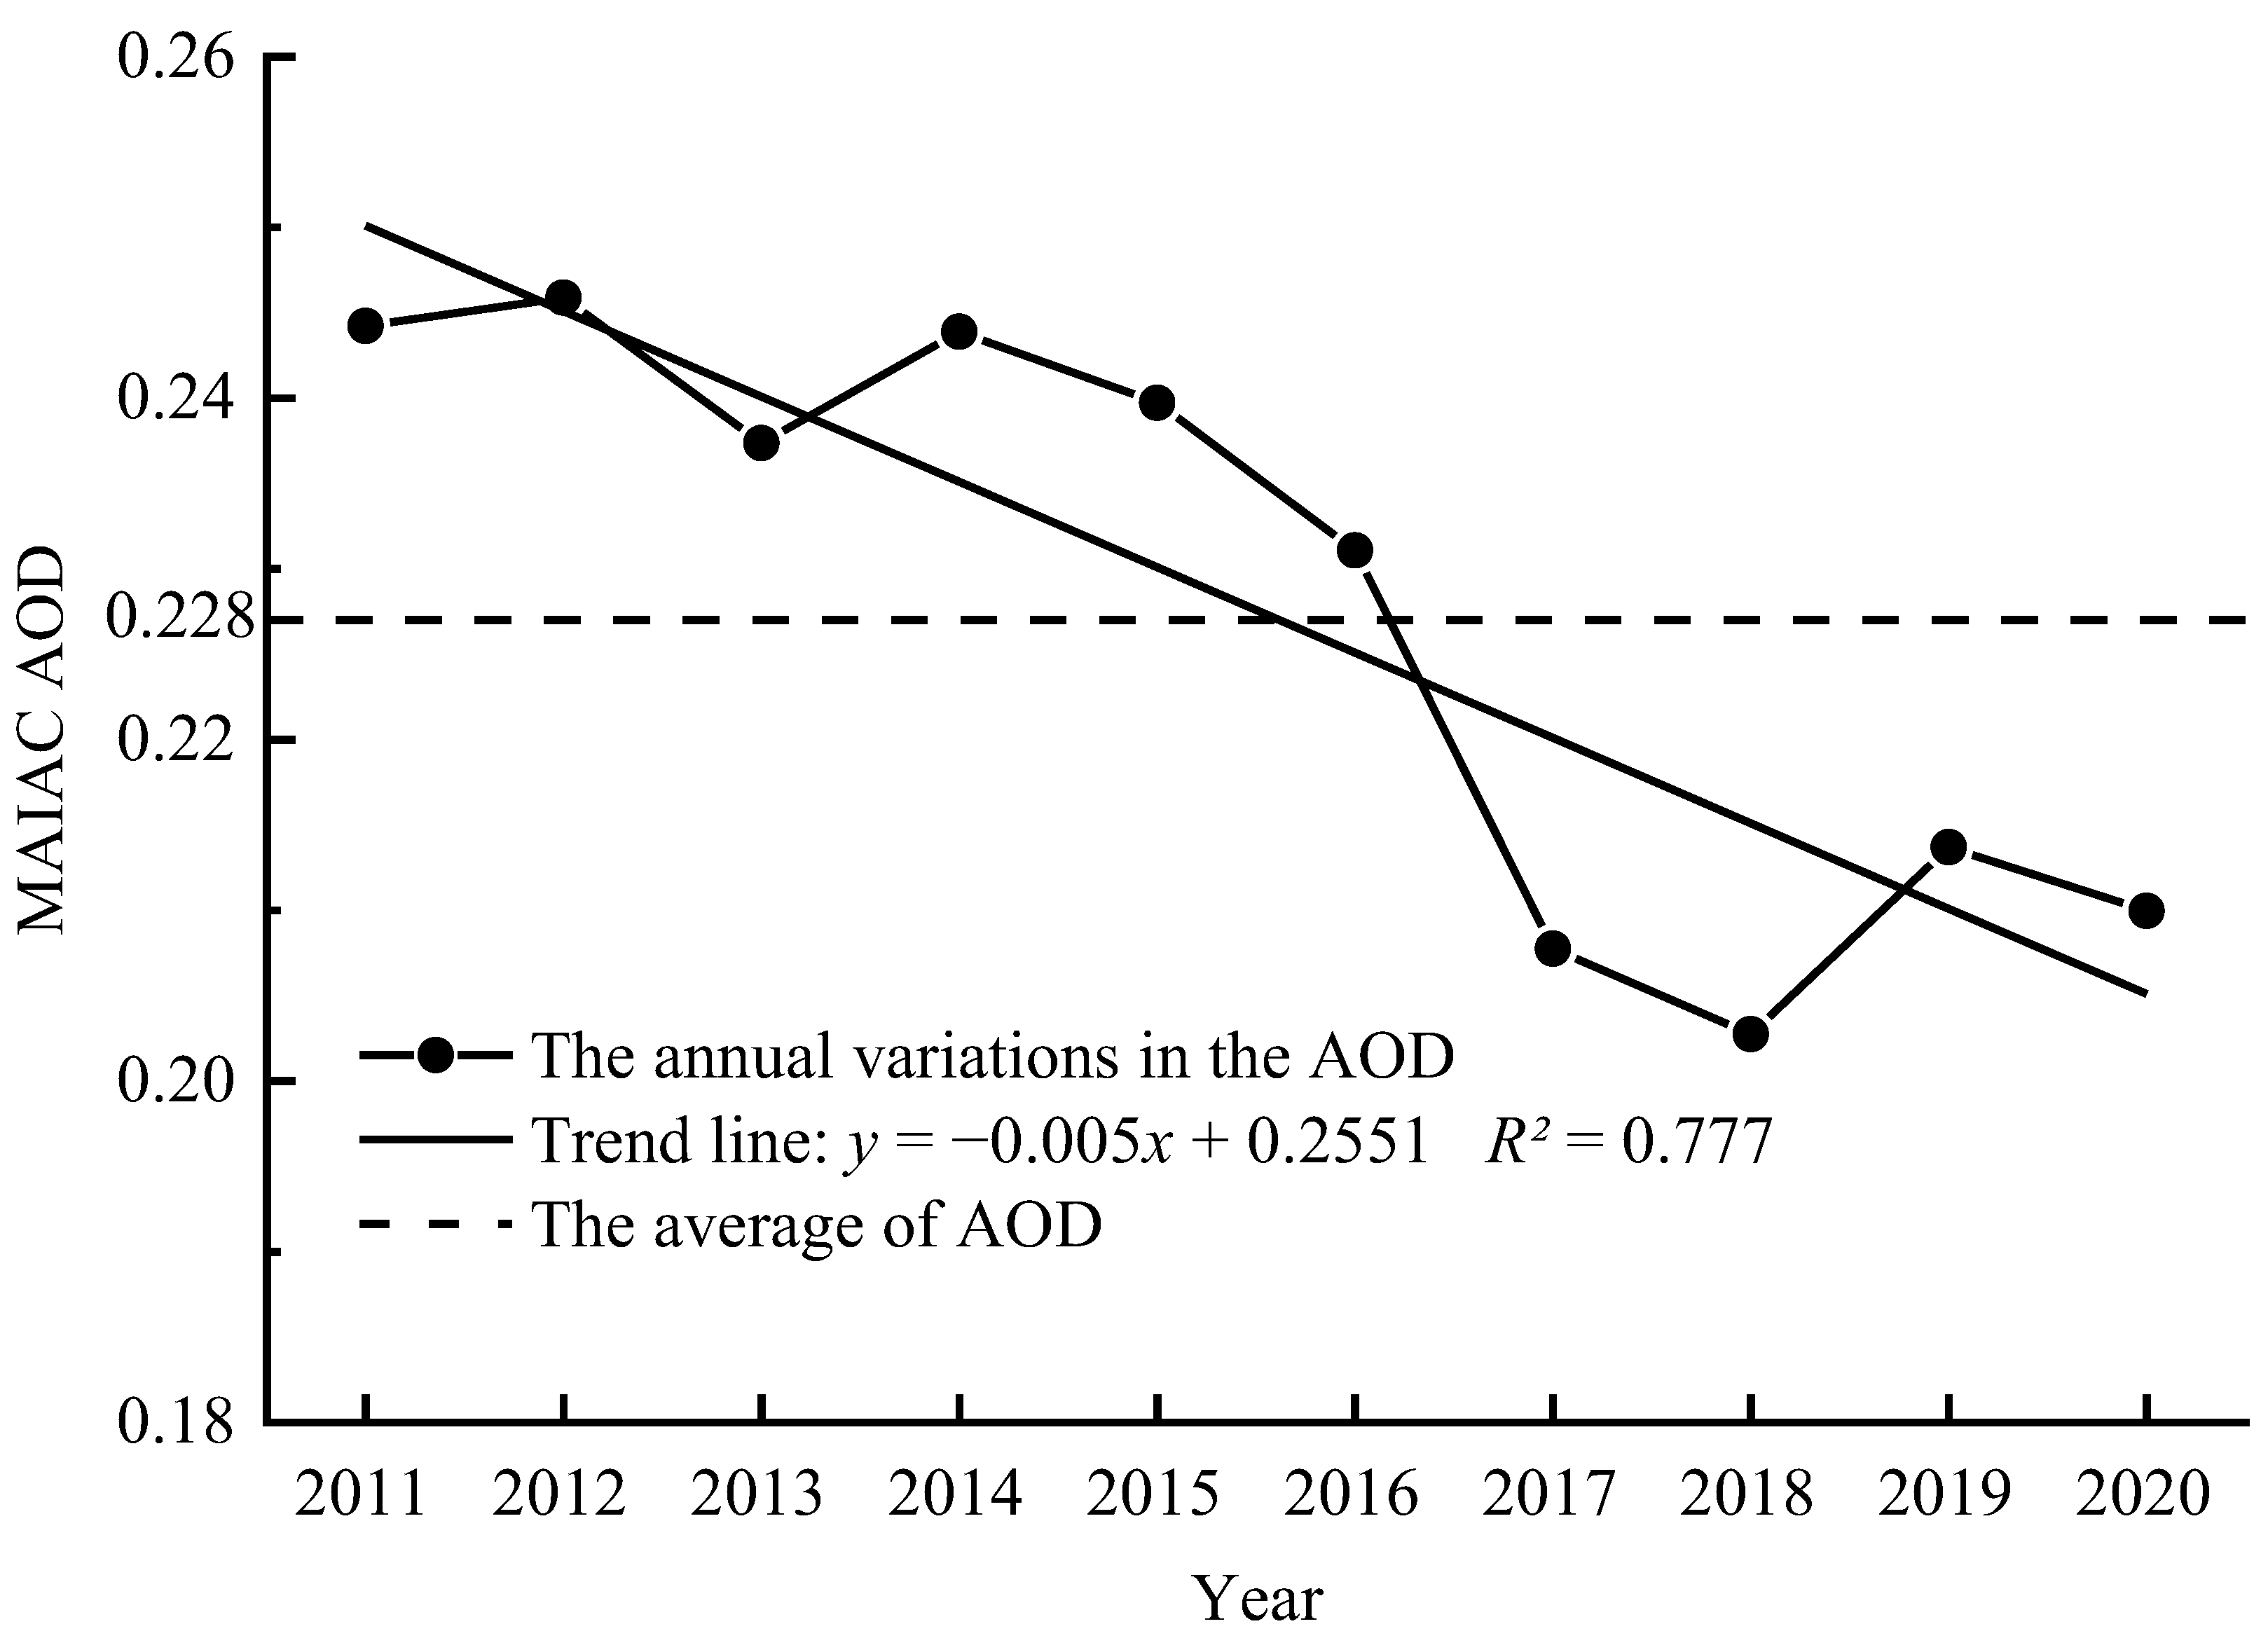
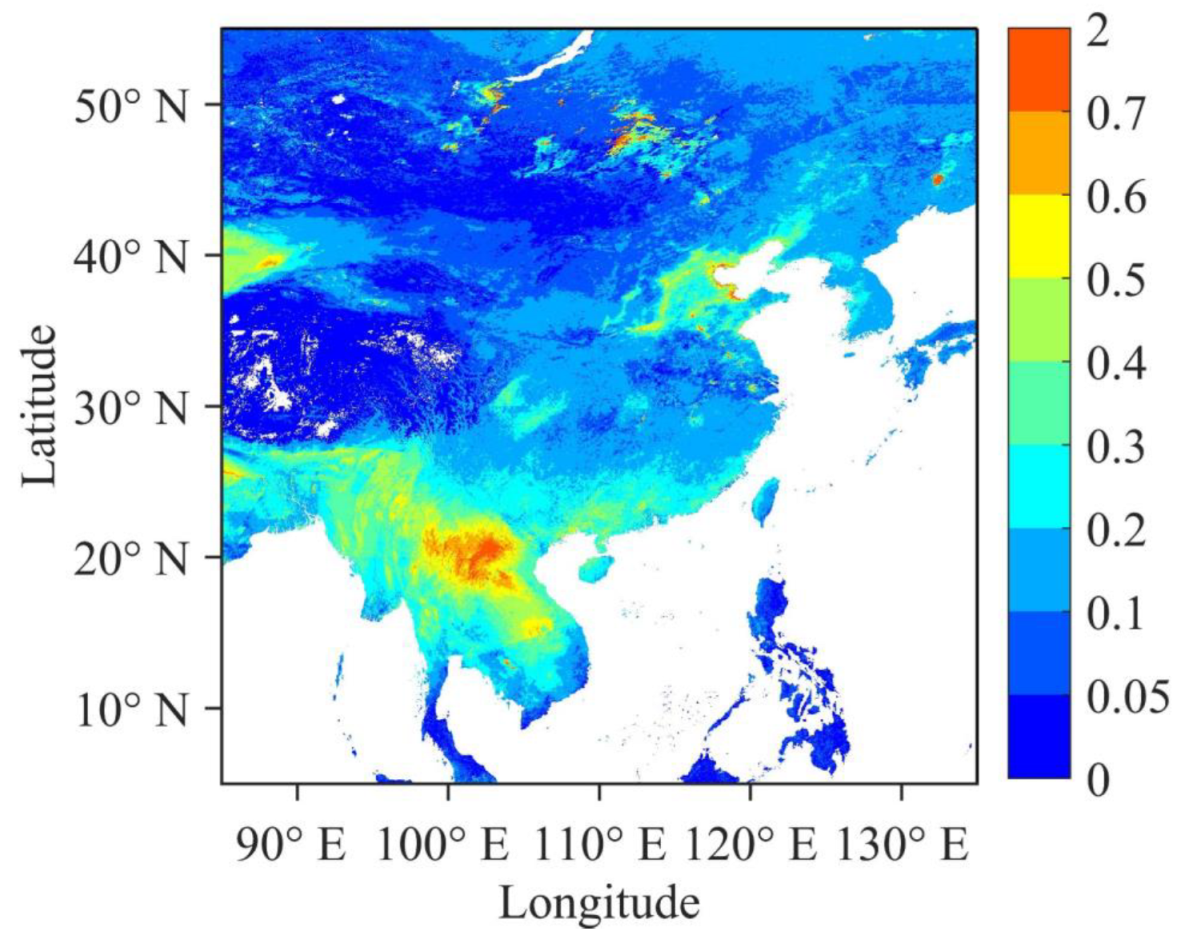
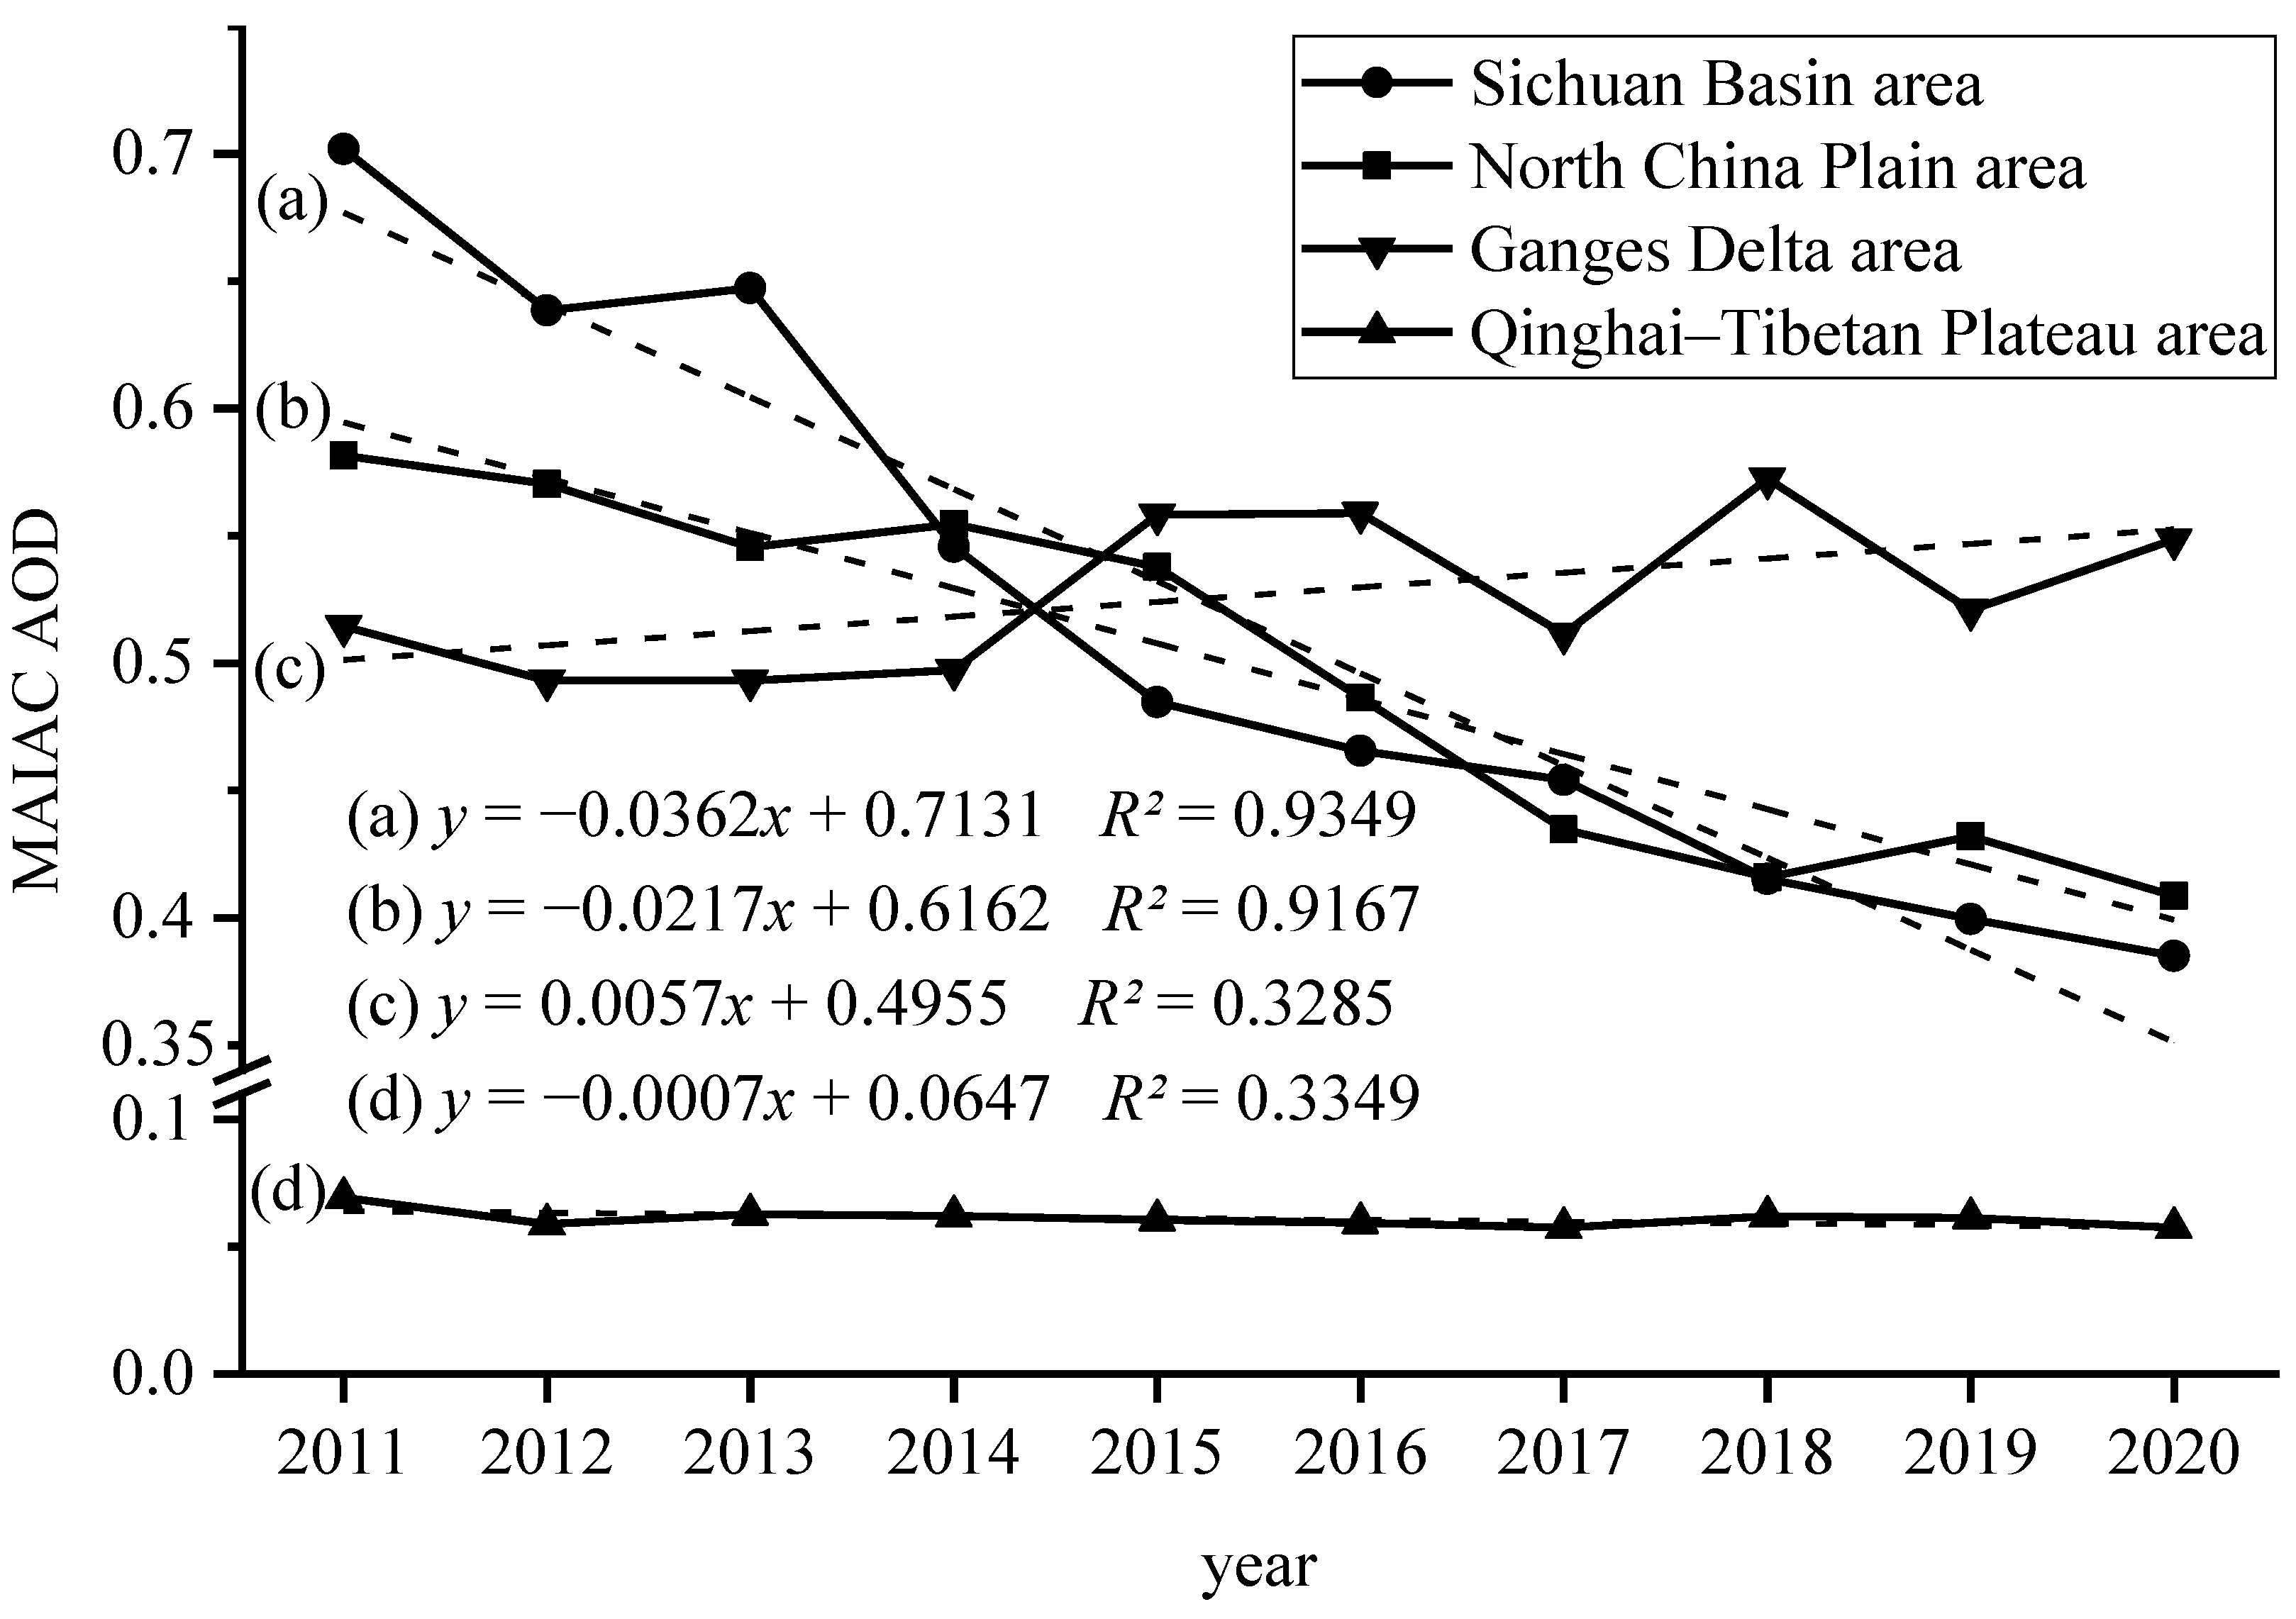
3.1. Interannual Variation of AOD
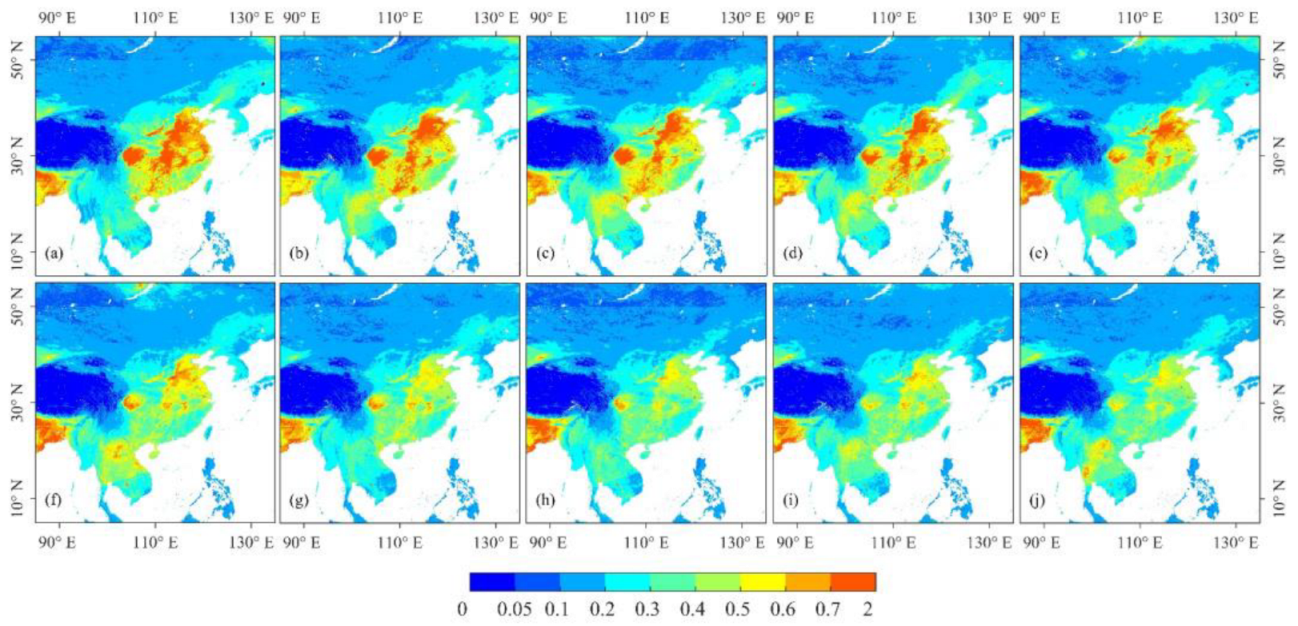
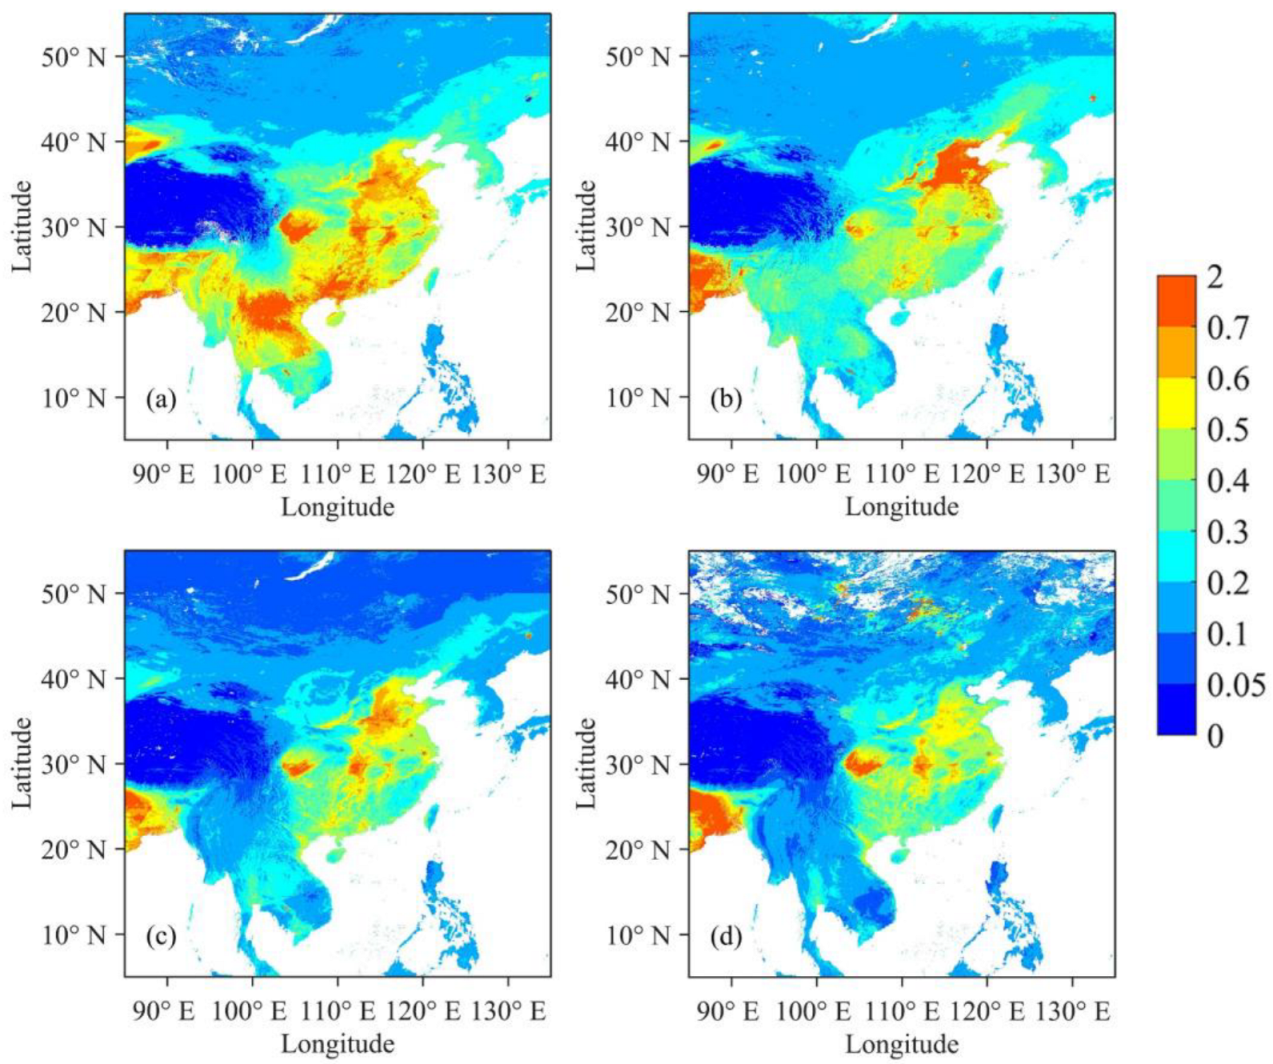
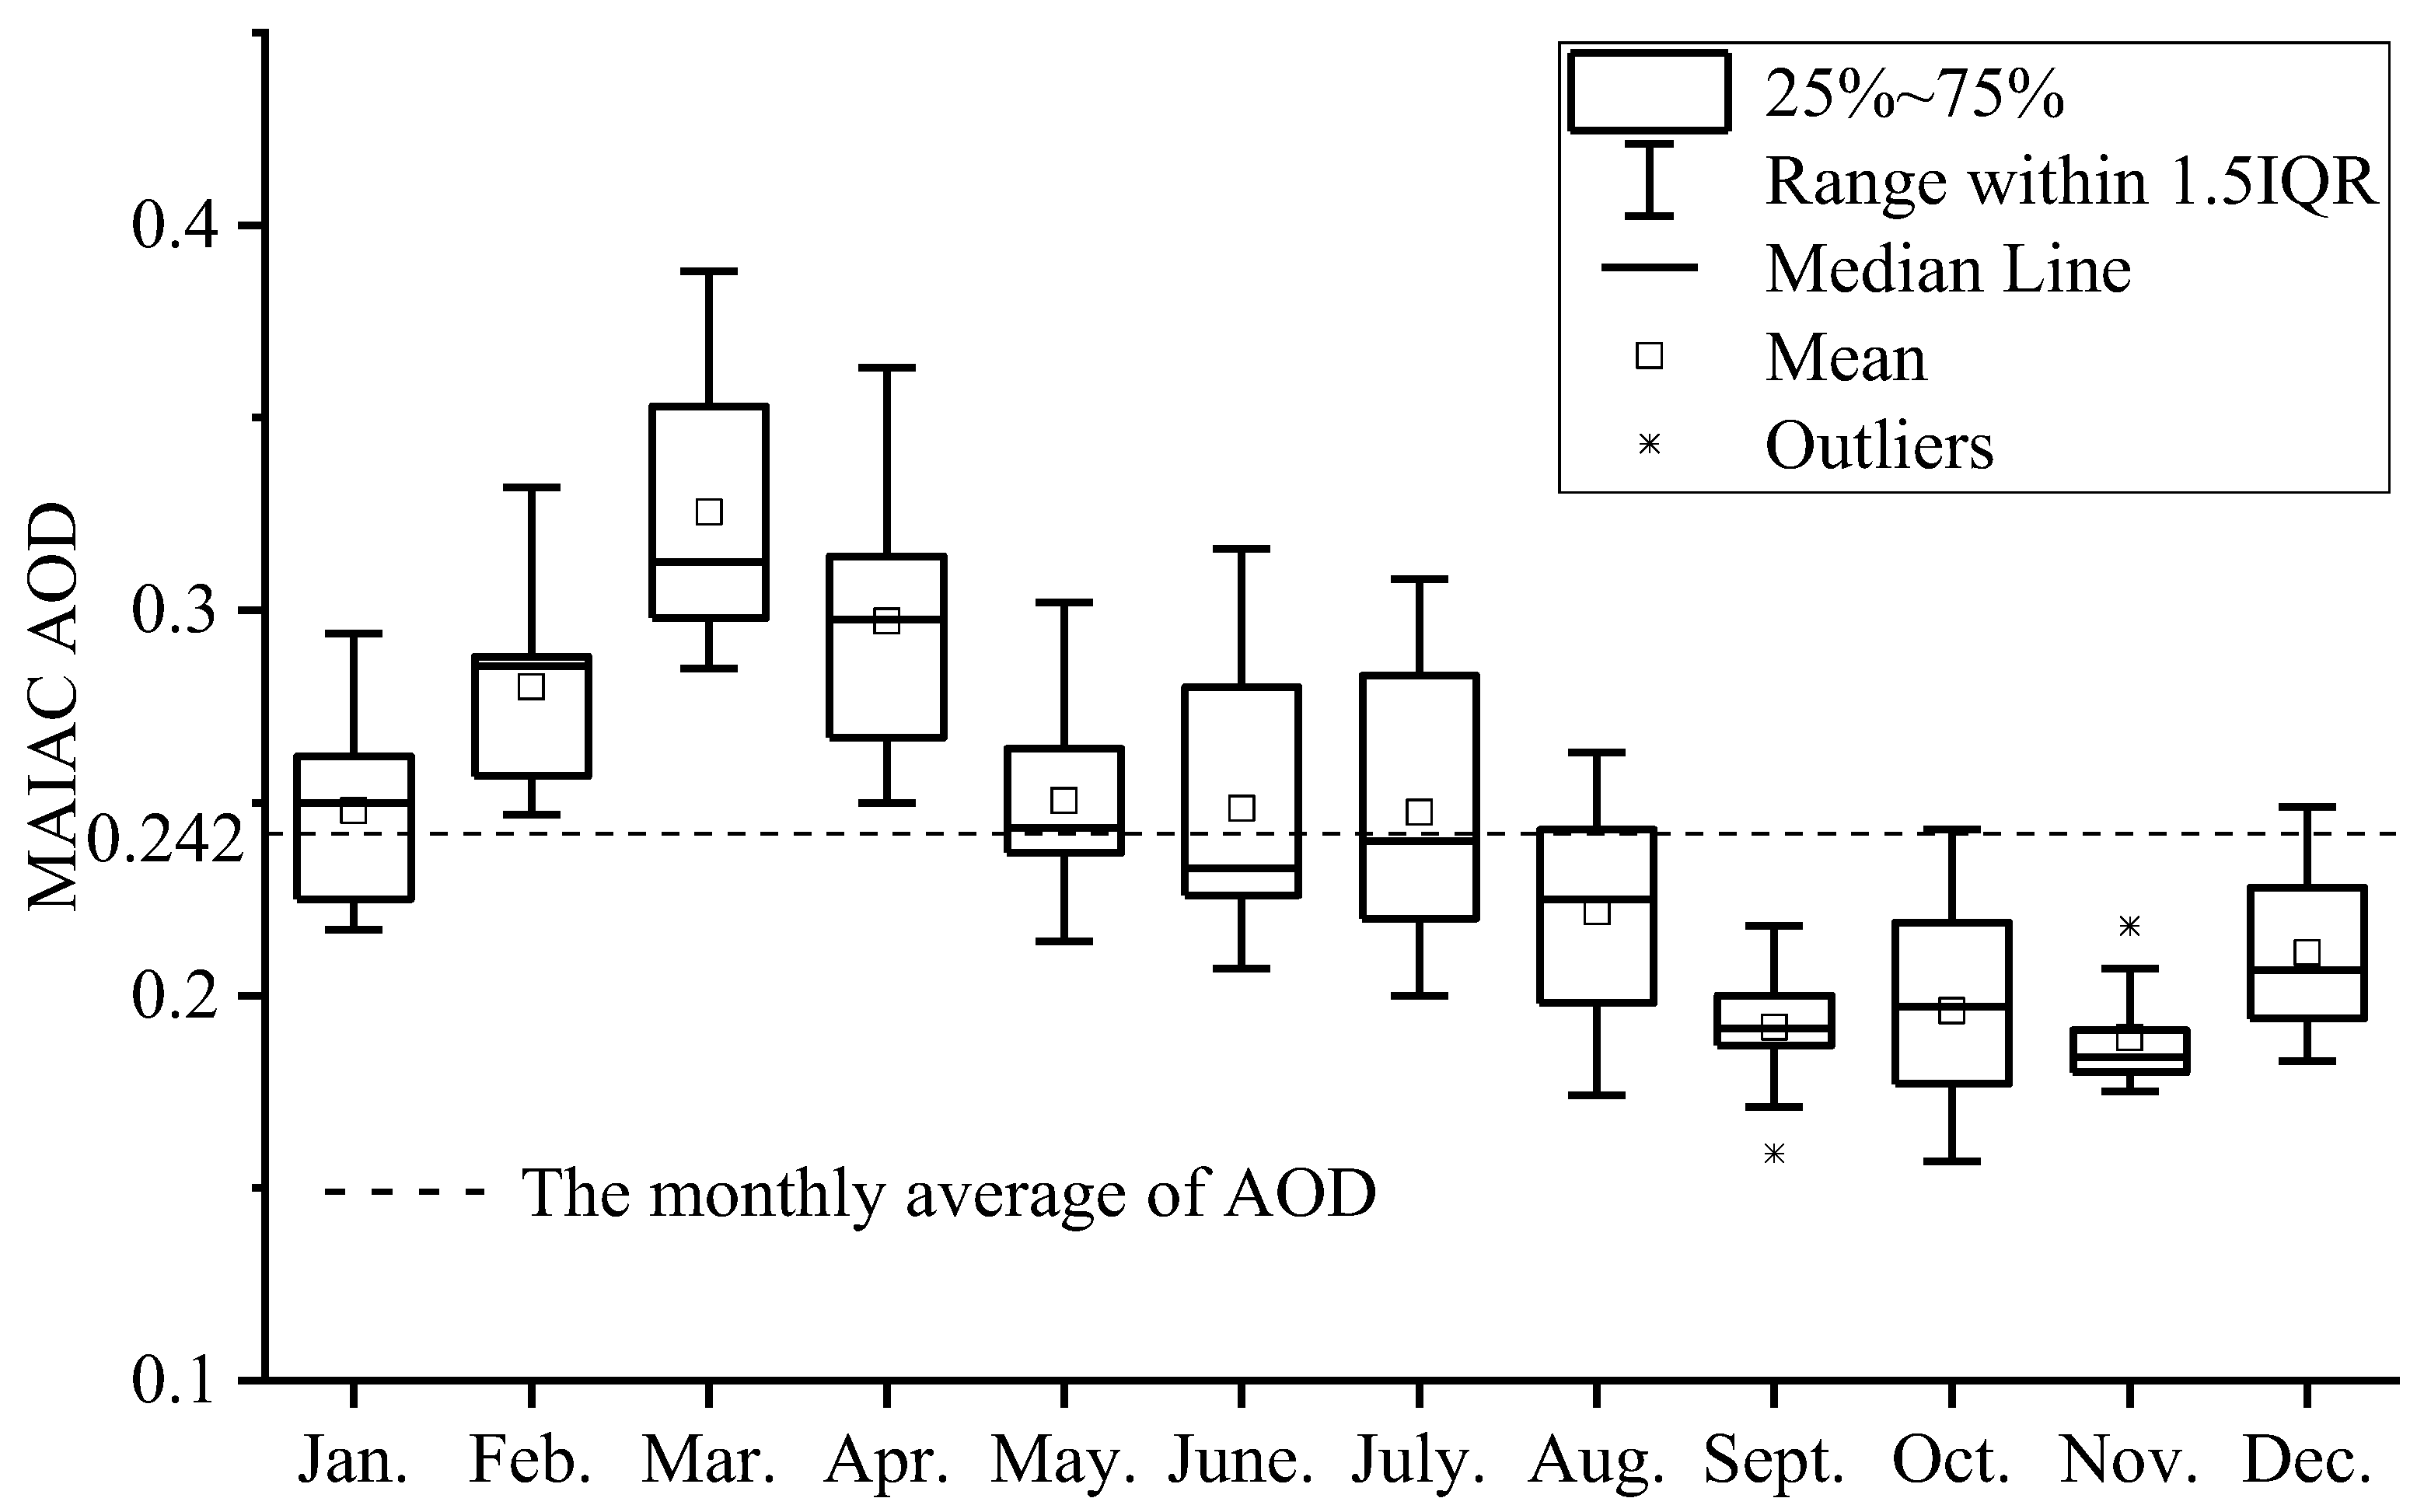
3.2. Intra-Annual Variations of AOD
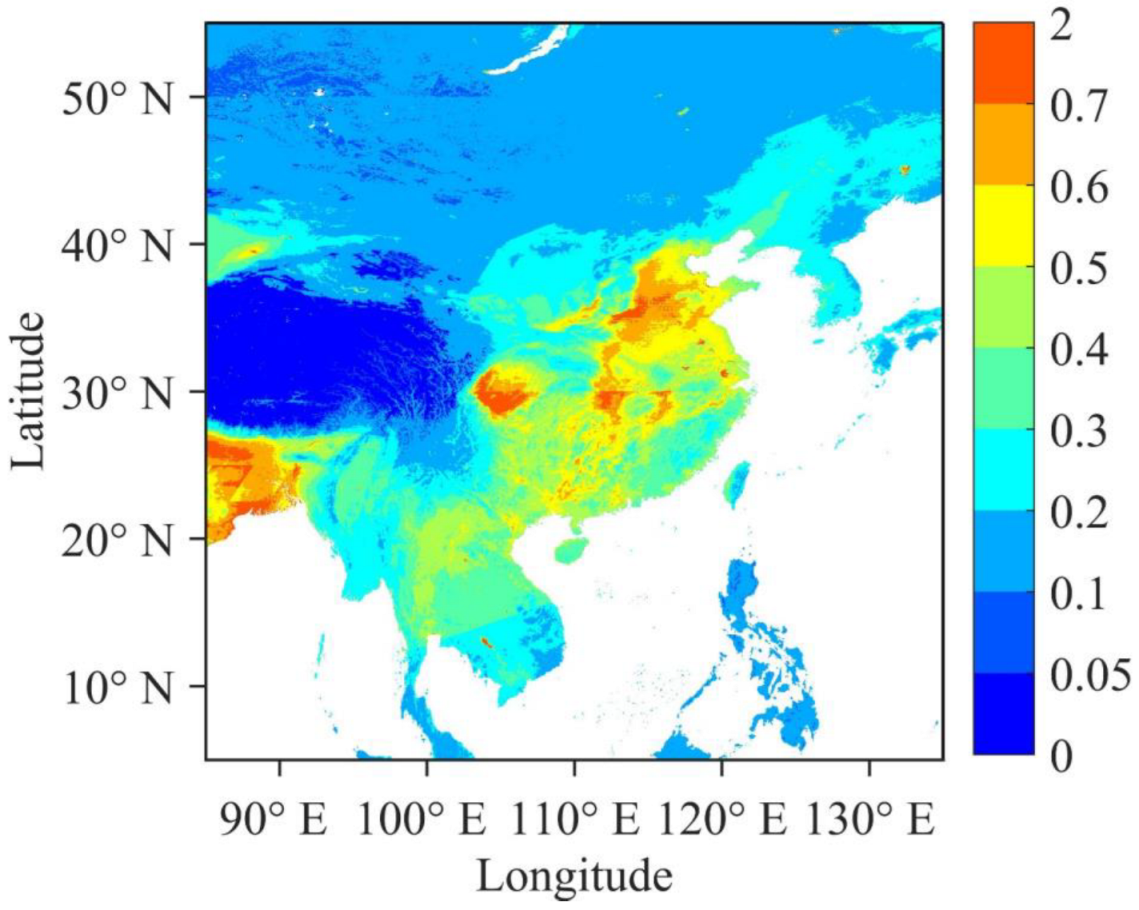
3.3. Spatiotemporal Variations of AOD in High and Low Hotspots
4. Conclusions
Author Contributions
Funding
Institutional Review Board Statement
Informed Consent Statement
Data Availability Statement
Acknowledgments
Conflicts of Interest
References
- Xin, J.; Zhang, Q.; Wang, L.; Gong, C.; Wang, Y.; Liu, Z.; Gao, W. The empirical relationship between the PM2.5 concentration and aerosol optical depth over the background of North China from 2009 to 2011. Atmos. Res. 2014, 138, 179–188. [Google Scholar] [CrossRef]
- Wang, J.; Wu, J.; Liu, B.; Liu, X.; Gao, H.; Zhang, Y.; Feng, Y.; Han, S.; Gong, X. Exploring the Sensitivity of Visibility to PM2.5 Mass Concentration and Relative Humidity for Different Aerosol Types. Atmosphere 2022, 13, 471. [Google Scholar] [CrossRef]
- Lacagnina, C.; Hasekamp, O.P.; Torres, O. Direct radiative effect of aerosols based on PARASOL and OMI satellite observations. J. Geophys. Res. Atmos. 2017, 122, 2366–2388. [Google Scholar] [CrossRef]
- Tsui, W.G.; Woo, J.L.; McNeill, V.F. Impact of Aerosol-Cloud Cycling on Aqueous Secondary Organic Aerosol Formation. Atmosphere 2019, 10, 666. [Google Scholar] [CrossRef] [Green Version]
- Luo, R.; Liu, Y.; Zhu, Q.; Tang, Y.; Shao, T. Effects of aerosols on cloud and precipitation in East-Asian drylands. Int. J. Climatol. 2021, 41, 4603–4618. [Google Scholar] [CrossRef]
- Madadi, A.; Sadr, A.H.; Kashani, A.; Gilandeh, A.G.; Safarianzengir, V.; Kianian, M. Monitoring of aerosols and studying its effects on the environment and humans health in Iran. Environ. Geochem. Health 2021, 43, 317–331. [Google Scholar] [CrossRef]
- Okuda, T.; Schauer, J.J.; Shafer, M.M. Improved methods for elemental analysis of atmospheric aerosols for evaluating human health impacts of aerosols in East Asia. Atmos. Environ. 2014, 97, 552–555. [Google Scholar] [CrossRef]
- Al-Salihi, A.M. Characterization of aerosol type based on aerosol optical properties over Baghdad, Iraq. Arab. J. Geosci. 2018, 11, 633. [Google Scholar] [CrossRef]
- Zhao, H.; Che, H.; Xia, X.; Wang, Y.; Wang, H.; Wang, P.; Ma, Y.; Yang, H.; Liu, Y.; Wang, Y.; et al. Multiyear Ground-Based Measurements of Aerosol Optical Properties and Direct Radiative Effect Over Different Surface Types in Northeastern China. J. Geophys. Res. Atmos. 2018, 123, 13887–13916. [Google Scholar] [CrossRef]
- Pappalardo, G.; Amodeo, A.; Apituley, A.; Comeron, A.; Freudenthaler, V.; Linné, H.; Ansmann, A.; Bösenberg, J.; D’Amico, G.; Mattis, I.; et al. EARLINET: Towards an advanced sustainable European aerosol lidar network. Atmos. Meas. Tech. 2014, 7, 2389–2409. [Google Scholar] [CrossRef]
- Kittaka, C.; Winker, D.M.; Vaughan, M.A.; Omar, A.; Remer, L.A. Intercomparison of column aerosol optical depths from CALIPSO and MODIS-Aqua. Atmos. Meas. Tech. 2011, 4, 131–141. [Google Scholar] [CrossRef] [Green Version]
- Wang, W.; Mao, F.; Pan, Z.; Du, L.; Gong, W. Validation of VIIRS AOD through a Comparison with a Sun Photometer and MODIS AODs over Wuhan. Remote Sens. 2017, 9, 403. [Google Scholar] [CrossRef] [Green Version]
- Jin, Y.; Hao, Z.; Chen, J.; He, D.; Tian, Q.; Mao, Z.; Pan, D. Retrieval of Urban Aerosol Optical Depth from Landsat 8 OLI in Nanjing, China. Remote Sens. 2021, 13, 415. [Google Scholar] [CrossRef]
- Li, J.; He, Q.; Ge, X.; Abbas, A. Spatiotemporal distribution of aerosols over the Tibet Plateau and Tarim Basin (1980–2020). J. Clean. Prod. 2022, 374, 133958. [Google Scholar] [CrossRef]
- Wang, W.; Zhu, D.; Jing, C.; Guo, X.; Chen, L. Spatial distribution and temporal variation of aerosol optical depth in the Western Pacific Ocean. Dyn. Atmos. Ocean. 2022, 99, 101303. [Google Scholar] [CrossRef]
- Kaufman, Y.J.; Tanré, D.; Remer, L.A.; Vermote, E.F.; Chu, A.; Holben, B.N. Operational remote sensing of tropospheric aerosol over land from EOS moderate resolution imaging spectroradiometer. J. Geophys. Res. Atmos. 1997, 102, 17051–17067. [Google Scholar] [CrossRef]
- Levy, R.C.; Mattoo, S.; Munchak, L.A.; Remer, L.A.; Sayer, A.M.; Patadia, F.; Hsu, N.C. The Collection 6 MODIS aerosol products over land and ocean. Atmos. Meas. Tech. 2013, 6, 2989–3034. [Google Scholar] [CrossRef] [Green Version]
- Hsu, N.C.; Jeong, M.J.; Bettenhausen, C.; Sayer, A.M.; Hansell, R.; Seftor, C.S.; Huang, J.; Tsay, S.C. Enhanced Deep Blue aerosol retrieval algorithm: The second generation. J. Geophys. Res. Atmos. 2013, 118, 9296–9315. [Google Scholar] [CrossRef]
- Wang, Y.; Wang, J.; Levy, R.C.; Shi, Y.R.; Mattoo, S.; Reid, J.S. First Retrieval of AOD at Fine Resolution Over Shallow and Turbid Coastal Waters From MODIS. Geophys. Res. Lett. 2021, 48, e2021GL094344. [Google Scholar] [CrossRef]
- Cheng, L.; Li, L.; Chen, L.; Hu, S.; Yuan, L.; Liu, Y.; Cui, Y.; Zhang, T. Spatiotemporal Variability and Influencing Factors of Aerosol Optical Depth over the Pan Yangtze River Delta during the 2014–2017 Period. Int. J. Environ. Res. Public Health 2019, 16, 3522. [Google Scholar] [CrossRef]
- Shen, X.; Bilal, M.; Qiu, Z.; Sun, D.; Wang, S.; Zhu, W. Long-term spatiotemporal variations of aerosol optical depth over Yellow and Bohai Sea. Environ. Sci. Pollut. Res. Int. 2019, 26, 7969–7979. [Google Scholar] [CrossRef] [PubMed]
- Boiyo, R.; Kumar, K.R.; Zhao, T. Spatial variations and trends in AOD climatology over East Africa during 2002-2016: A comparative study using three satellite data sets. Int. J. Climatol. 2018, 38, e1221–e1240. [Google Scholar] [CrossRef]
- Lyapustin, A.; Wang, Y.; Korkin, S.; Huang, D. MODIS Collection 6 MAIAC algorithm. Atmos. Meas. Tech. 2018, 11, 5741–5765. [Google Scholar] [CrossRef] [Green Version]
- Mhawish, A.; Banerjee, T.; Sorek-Hamer, M.; Lyapustin, A.; Broday, D.M.; Chatfield, R. Comparison and evaluation of MODIS Multi-angle Implementation of Atmospheric Correction (MAIAC) aerosol product over South Asia. Remote Sens. Environ. 2019, 224, 12–28. [Google Scholar] [CrossRef]
- Soleimany, A.; Solgi, E.; Ashrafi, K.; Jafari, R.; Grubliauskas, R. Temporal and spatial distribution mapping of particulate matter in southwest of Iran using remote sensing, GIS, and statistical techniques. Air Qual. Atmos. Health 2022, 15, 1057–1078. [Google Scholar] [CrossRef]
- Dong, J.; Wang, X.; Li, J.; Hao, C.; Jiao, L. The Spatial-Temporal Differentiation of Aerosol Optical Properties and Types in the Beijing–Tianjin–Hebei Region Based on the Ecological Functional Zones. Sustainability 2022, 14, 12656. [Google Scholar] [CrossRef]
- Bi, J.; Huang, J.; Holben, B.; Zhang, G. Comparison of key absorption and optical properties between pure and transported anthropogenic dust over East and Central Asia. Atmos. Chem. Phys. 2016, 16, 15501–15516. [Google Scholar] [CrossRef] [Green Version]
- Kumar, D.B.; Verma, S. Potential emission flux to aerosol pollutants over Bengal Gangetic plain through combined trajectory clustering and aerosol source fields analysis. Atmos. Res. 2016, 178–179, 415–425. [Google Scholar] [CrossRef]
- Lau, K.M.; Ramanathan, V.; Wu, G.X.; Li, Z.; Tsay, S.C.; Hsu, C.; Sikka, R.; Holben, B.; Lu, D.; Tartari, G.; et al. The Joint Aerosol–Monsoon Experiment: A New Challenge for Monsoon Climate Research. Bull. Am. Meteorol. Soc. 2008, 89, 369–384. [Google Scholar] [CrossRef] [Green Version]
- Giri, B.; Patel, K.S.; Jaiswal, N.K.; Sharma, S.; Ambade, B.; Wang, W.; Simonich, S.L.M.; Simoneit, B.R.T. Composition and sources of organic tracers in aerosol particles of industrial central India. Atmos. Res. 2013, 120–121, 312–324. [Google Scholar] [CrossRef]
- Ramachandran, S.; Srivastava, R. Mixing states of aerosols over four environmentally distinct atmospheric regimes in Asia: Coastal, urban, and industrial locations influenced by dust. Environ. Sci. Pollut. Res. Int. 2016, 23, 11109–11128. [Google Scholar] [CrossRef] [PubMed]
- Jung, C.R.; Hwang, B.F.; Chen, W.T. Incorporating long-term satellite-based aerosol optical depth, localized land use data, and meteorological variables to estimate ground-level PM2.5 concentrations in Taiwan from 2005 to 2015. Environ. Pollut. 2018, 237, 1000–1010. [Google Scholar] [CrossRef] [PubMed]
- Liu, B.; Cong, Z.; Wang, Y.; Xin, J.; Wan, X.; Pan, Y.; Liu, Z.; Wang, Y.; Zhang, G.; Wang, Z.; et al. Background aerosol over the Himalayas and Tibetan Plateau: Observed characteristics of aerosol mass loading. Atmos. Chem. Phys. 2017, 17, 449–463. [Google Scholar] [CrossRef] [Green Version]
- Huang, C.; Li, J.; Sun, W.; Chen, Q.; Mao, Q.-J.; Yuan, Y. Long-Term Variation Assessment of Aerosol Load and Dominant Types over Asia for Air Quality Studies Using Multi-Sources Aerosol Datasets. Remote Sens. 2021, 13, 3116. [Google Scholar] [CrossRef]
- Wang, D.; Zhang, F.; Yang, S.; Xia, N.; Ariken, M. Exploring the spatial-temporal characteristics of the aerosol optical depth (AOD) in Central Asia based on the moderate resolution imaging spectroradiometer (MODIS). Environ. Monit. Assess. 2020, 192, 383. [Google Scholar] [CrossRef]
- Wang, Y.; Yu, X.; Xie, G. Spatial distribution and temporal variation of aerosol optical depth over China in the past 15 years. China Environ. Sci. 2018, 38, 426–434. [Google Scholar] [CrossRef]
- Hu, Z.; Zhao, C.; Huang, J.; Leung, L.R.; Qian, Y.; Yu, H.; Huang, L.; Kalashnikova, O.V. Trans-Pacific transport and evolution of aerosols: Evaluation of quasi-global WRF-Chem simulation with multiple observations. Geosci. Model Dev. 2016, 9, 1725–1746. [Google Scholar] [CrossRef] [Green Version]
- Lu, Z.; Streets, D.G.; Zhang, Q.; Wang, S.; Carmichael, G.R.; Cheng, Y.F.; Wei, C.; Chin, M.; Diehl, T.; Tan, Q. Sulfur dioxide emissions in China and sulfur trends in East Asia since 2000. Atmos. Chem. Phys. 2010, 10, 6311–6331. [Google Scholar] [CrossRef] [Green Version]
- Zhang, M.; Wang, L.; Bilal, M.; Gong, W.; Zhang, Z.; Guo, G. The Characteristics of the Aerosol Optical Depth within the Lowest Aerosol Layer over the Tibetan Plateau from 2007 to 2014. Remote Sens. 2018, 10, 696. [Google Scholar] [CrossRef] [Green Version]
- Singh, N.; Murari, V.; Kumar, M.; Barman, S.C.; Banerjee, T. Fine particulates over South Asia: Review and meta-analysis of PM2.5 source apportionment through receptor model. Environ. Pollut. 2017, 223, 121–136. [Google Scholar] [CrossRef]
- Saikawa, E.; Wu, Q.; Zhong, M.; Avramov, A.; Ram, K.; Stone, E.A.; Stockwell, C.E.; Jayarathne, T.; Panday, A.K.; Yokelson, R.J. Garbage Burning in South Asia: How Important Is It to Regional Air Quality? Environ. Sci. Technol. 2020, 54, 9928–9938. [Google Scholar] [CrossRef] [PubMed]
- Gautam, R.; Hsu, N.C.; Tsay, S.C.; Lau, K.M.; Holben, B.; Bell, S.; Smirnov, A.; Li, C.; Hansell, R.; Ji, Q.; et al. Accumulation of aerosols over the Indo-Gangetic plains and southern slopes of the Himalayas: Distribution, properties and radiative effects during the 2009 pre-monsoon season. Atmos. Chem. Phys. 2011, 11, 12841–12863. [Google Scholar] [CrossRef] [Green Version]
- Wu, J.; Fu, C. Simulation Research of Distribution Transportation and Radiative Effects of Black Carbon Aerosol in Recent Five Spring Seasons over East Asia Region. Chin. J. Atmos. Sci. 2005, 29, 111–119. [Google Scholar]
- Cohen, J.B.; Lecoeur, E.; Hui Loong Ng, D. Decadal-scale relationship between measurements of aerosols, land-use change, and fire over Southeast Asia. Atmos. Chem. Phys. 2017, 17, 721–743. [Google Scholar] [CrossRef] [Green Version]
- Xia, X.; Che, H.; Zhu, J.; Chen, H.; Cong, Z.; Deng, X.; Fan, X.; Fu, Y.; Goloub, P.; Jiang, H.; et al. Ground-based remote sensing of aerosol climatology in China: Aerosol optical properties, direct radiative effect and its parameterization. Atmos. Environ. 2016, 124, 243–251. [Google Scholar] [CrossRef]
- Yli-Juuti, T.; Mielonen, T.; Heikkinen, L.; Arola, A.; Ehn, M.; Isokaanta, S.; Keskinen, H.M.; Kulmala, M.; Laakso, A.; Lipponen, A.; et al. Significance of the organic aerosol driven climate feedback in the boreal area. Nat. Commun. 2021, 12, 5637. [Google Scholar] [CrossRef]
- Zhou, B.; Zhao, P. Inverse correlation between ancient winter and summer monsoons in East Asia? Chin. Sci. Bull. 2009, 54, 3760–3767. [Google Scholar] [CrossRef]
- Kaboth-Bahr, S.; Bahr, A.; Zeeden, C.; Yamoah, K.A.; Lone, M.A.; Chuang, C.-K.; Löwemark, L.; Wei, K.-Y. A tale of shifting relations: East Asian summer and winter monsoon variability during the Holocene. Sci. Rep. 2021, 11, 6938. [Google Scholar] [CrossRef]
- Kim, D.; Chin, M.; Yu, H.; Diehl, T.; Tan, Q.; Kahn, R.A.; Tsigaridis, K.; Bauer, S.E.; Takemura, T.; Pozzoli, L.; et al. Sources, sinks, and transatlantic transport of North African dust aerosol: A multimodel analysis and comparison with remote sensing data. J. Geophys. Res. Atmos. 2014, 119, 6259–6277. [Google Scholar] [CrossRef] [Green Version]
- Liu, Y.; Cai, W.; Sun, C.; Song, H.; Cobb, K.M.; Li, J.; Leavitt, S.W.; Wu, L.; Cai, Q.; Liu, R.; et al. Anthropogenic Aerosols Cause Recent Pronounced Weakening of Asian Summer Monsoon Relative to Last Four Centuries. Geophys. Res. Lett. 2019, 46, 5469–5479. [Google Scholar] [CrossRef] [Green Version]
- Liu, H.; Miao, J.; Wu, K.; Du, M.; Zhu, Y.; Hou, S. Why the Increasing Trend of Summer Rainfall over North China Has Halted since the Mid-1990s. Adv. Meteorol. 2020, 2020, 9031796. [Google Scholar] [CrossRef]
- Lee, S.; Lee, M.I.; Song, C.K.; Kim, K.M.; da Silva, A.M. Interannual Variation of the East Asia Jet Stream and Its Impact on the Horizontal Distribution of Aerosol in Boreal Spring. Atmos. Environ. (1994) 2020, 223, 117296. [Google Scholar] [CrossRef] [PubMed]
- Deng, X.; Tie, X.; Zhou, X.; Wu, D.; Zhong, L.; Tan, H.; Li, F.; Huang, X.; Bi, X.; Deng, T. Effects of Southeast Asia biomass burning on aerosols and ozone concentrations over the Pearl River Delta (PRD) region. Atmos. Environ. 2008, 42, 8493–8501. [Google Scholar] [CrossRef]
- Hansen, A.B.; Witham, C.S.; Chong, W.M.; Kendall, E.; Chew, B.N.; Gan, C.; Hort, M.C.; Lee, S.-Y. Haze in Singapore-source attribution of biomass burning PM<sub>10</sub> from Southeast Asia. Atmos. Chem. Phys. 2019, 19, 5363–5385. [Google Scholar] [CrossRef] [Green Version]
- Mhawish, A.; Sorek-Hamer, M.; Chatfield, R.; Banerjee, T.; Bilal, M.; Kumar, M.; Sarangi, C.; Franklin, M.; Chau, K.; Garay, M.; et al. Aerosol characteristics from earth observation systems: A comprehensive investigation over South Asia (2000–2019). Remote Sens. Environ. 2021, 259, 112410. [Google Scholar] [CrossRef]
- Caixia, Y.; Chun’e, S.; Xinfeng, L.; Yuejia, Z.; Wei, F. Analysis of a severe fog-haze process in central and eastern China based on comprehensive observations. Acta Sci. Circumstantiae 2020, 40, 2346–2355. [Google Scholar] [CrossRef]
- Wu, C.; Wang, G.; Wang, J.; Li, J.; Ren, Y.; Zhang, L.; Cao, C.; Li, J.; Ge, S.; Xie, Y.; et al. Chemical characteristics of haze particles in Xi’an during Chinese Spring Festival: Impact of fireworks burning. J. Environ. Sci. 2018, 71, 179–187. [Google Scholar] [CrossRef]
- Wang, G.; Zhang, F.; Peng, J.; Duan, L.; Ji, Y.; Marrero-Ortiz, W.; Wang, J.; Li, J.; Wu, C.; Cao, C.; et al. Particle acidity and sulfate production during severe haze events in China cannot be reliably inferred by assuming a mixture of inorganic salts. Atmos. Chem. Phys. 2018, 18, 10123–10132. [Google Scholar] [CrossRef] [Green Version]
- Filonchyk, M.; Yan, H.; Zhang, Z.; Yang, S.; Li, W.; Li, Y. Combined use of satellite and surface observations to study aerosol optical depth in different regions of China. Sci. Rep. 2019, 9, 6174. [Google Scholar] [CrossRef] [Green Version]
- Nam, J.; Kim, S.-W.; Park, R.J.; Park, J.-S.; Park, S.S. Changes in column aerosol optical depth and ground-level particulate matter concentration over East Asia. Air Qual. Atmos. Health 2017, 11, 49–60. [Google Scholar] [CrossRef]
- Liao, Y.; Yang, F.; Luo, Y.; Zhao, T.; Shang, Y.; Zheng, X. Regional Climatology of Aerosol Distribution over Yunnan-Guizhou Plateau. Ecol. Environ. Sci. 2019, 28, 316–323. [Google Scholar] [CrossRef]
- Wang, J.; Wang, G.; Wu, C.; Li, J.; Cao, C.; Li, J.; Xie, Y.; Ge, S.; Chen, J.; Zeng, L.; et al. Enhanced aqueous-phase formation of secondary organic aerosols due to the regional biomass burning over North China Plain. Environ. Pollut. 2020, 256, 113401. [Google Scholar] [CrossRef] [PubMed]
- Wu, Z.; Zhao, H.; Hao, J.; Wu, G. Climatological Characteristics and Aerosol Loading Trends from 2001 to 2020 Based on MODIS MAIAC Data for Tianjin, North China Plain. Sustainability 2022, 14, 1072. [Google Scholar] [CrossRef]
- Du, H.; Li, J.; Wang, Z.; Dao, X.; Guo, S.; Wang, L.; Ma, S.; Wu, J.; Yang, W.; Chen, X.; et al. Effects of Regional Transport on Haze in the North China Plain: Transport of Precursors or Secondary Inorganic Aerosols. Geophys. Res. Lett. 2020, 47, e2020GL087461. [Google Scholar] [CrossRef]
- Liu, X.; Chen, Q.; Che, H.; Zhang, R.; Gui, K.; Zhang, H.; Zhao, T. Spatial distribution and temporal variation of aerosol optical depth in the Sichuan basin, China, the recent ten years. Atmos. Environ. 2016, 147, 434–445. [Google Scholar] [CrossRef]
- Srivastava, R. Trends in aerosol optical properties over South Asia. Int. J. Climatol. 2017, 37, 371–380. [Google Scholar] [CrossRef]


| Fitting Model | Fitting Equation | R2 | SSE |
|---|---|---|---|
| Linear | y = −0.0108x + 0.309 | 0.8511 | 0.0462 |
| Quadratic polynomial | y = 0.0003x2 − 0.0199x + 0.3574 | 0.8883 | 0.0350 |
| Logarithmic | y = −0.117ln(x) + 0.4314 | 0.9210 | 0.0245 |
| Exponential | y = 0.4812e−0.104x | 0.8078 | 0.0456 |
| Power | y = 1.0083x−0.942 | 0.6242 | 0.4470 |
| K | Percentage (%) | Trend | Total (%) |
|---|---|---|---|
| −0.2~−0.05 | 0.502 | Decrease | 74.627 |
| −0.05~−0.01 | 17.291 | ||
| −0.01~−0.001 | 38.478 | ||
| −0.001~0 | 18.355 | ||
| 0~0.001 | 24.071 | Increase | 25.373 |
| 0.001~0.05 | 1.299 | ||
| 0.05~0.2 | 0.003 |
| Year | Spring | Summer | Autumn | Winter |
|---|---|---|---|---|
| 2011 | 0.285 | 0.282 | 0.211 | 0.241 |
| 2012 | 0.324 | 0.277 | 0.185 | 0.215 |
| 2013 | 0.303 | 0.217 | 0.200 | 0.249 |
| 2014 | 0.310 | 0.281 | 0.198 | 0.183 |
| 2015 | 0.281 | 0.260 | 0.186 | 0.228 |
| 2016 | 0.298 | 0.222 | 0.184 | 0.203 |
| 2017 | 0.239 | 0.233 | 0.173 | 0.194 |
| 2018 | 0.261 | 0.218 | 0.158 | 0.186 |
| 2019 | 0.259 | 0.237 | 0.180 | 0.204 |
| 2020 | 0.259 | 0.209 | 0.161 | 0.209 |
| Mean | 0.282 | 0.244 | 0.184 | 0.211 |
| Maximum | 0.324 | 0.282 | 0.211 | 0.249 |
| Minimum | 0.239 | 0.209 | 0.158 | 0.183 |
| Decreases of decade | 0.026 | 0.073 | 0.050 | 0.032 |
| Degree of decreases | 9.123% | 25.887% | 23.697% | 13.278% |
| Month/Year | 2011 | 2012 | 2013 | 2014 | 2015 | 2016 | 2017 | 2018 | 2019 | 2020 | Mean | Decreases of Decade | Degree of Decreases |
|---|---|---|---|---|---|---|---|---|---|---|---|---|---|
| January | 0.265 | 0.253 | 0.294 | 0.262 | 0.238 | 0.247 | 0.225 | 0.218 | 0.217 | 0.261 | 0.248 | 0.004 | 1.509% |
| February | 0.332 | 0.273 | 0.291 | 0.288 | 0.285 | 0.287 | 0.257 | 0.255 | 0.247 | 0.286 | 0.280 | 0.046 | 13.855% |
| March | 0.304 | 0.381 | 0.388 | 0.321 | 0.331 | 0.353 | 0.285 | 0.298 | 0.292 | 0.302 | 0.326 | 0.002 | 0.658% |
| April | 0.314 | 0.306 | 0.324 | 0.363 | 0.299 | 0.295 | 0.250 | 0.267 | 0.258 | 0.296 | 0.297 | 0.018 | 5.732% |
| May | 0.276 | 0.302 | 0.242 | 0.243 | 0.244 | 0.264 | 0.229 | 0.237 | 0.255 | 0.214 | 0.251 | 0.062 | 22.464% |
| June | 0.280 | 0.316 | 0.235 | 0.293 | 0.226 | 0.231 | 0.256 | 0.227 | 0.215 | 0.207 | 0.249 | 0.073 | 26.071% |
| July | 0.283 | 0.264 | 0.200 | 0.308 | 0.287 | 0.235 | 0.224 | 0.210 | 0.245 | 0.220 | 0.248 | 0.063 | 22.261% |
| August | 0.263 | 0.241 | 0.214 | 0.236 | 0.251 | 0.201 | 0.196 | 0.198 | 0.243 | 0.174 | 0.222 | 0.089 | 33.840% |
| September | 0.218 | 0.187 | 0.190 | 0.193 | 0.194 | 0.218 | 0.171 | 0.159 | 0.200 | 0.188 | 0.192 | 0.030 | 13.761% |
| October | 0.219 | 0.199 | 0.243 | 0.223 | 0.197 | 0.189 | 0.197 | 0.157 | 0.177 | 0.159 | 0.196 | 0.060 | 27.397% |
| November | 0.218 | 0.207 | 0.191 | 0.190 | 0.184 | 0.180 | 0.183 | 0.184 | 0.178 | 0.175 | 0.189 | 0.043 | 19.725% |
| December | 0.241 | 0.215 | 0.249 | 0.183 | 0.228 | 0.202 | 0.194 | 0.186 | 0.204 | 0.209 | 0.211 | 0.032 | 13.278% |
| Region | Annual Mean AOD | Seasonal Mean AOD | |||
|---|---|---|---|---|---|
| Spring | Summer | Autumn | Winter | ||
| North China Plain area | 0.497 | 0.523 | 0.573 | 0.469 | 0.406 |
| Sichuan Basin area | 0.514 | 0.573 | 0.428 | 0.428 | 0.510 |
| Ganges Delta area | 0.527 | 0.569 | 0.535 | 0.438 | 0.519 |
| Qinghai-Tibetan Plateau area | 0.061 | 0.077 | 0.076 | 0.053 | 0.051 |
Publisher’s Note: MDPI stays neutral with regard to jurisdictional claims in published maps and institutional affiliations. |
© 2022 by the authors. Licensee MDPI, Basel, Switzerland. This article is an open access article distributed under the terms and conditions of the Creative Commons Attribution (CC BY) license (https://creativecommons.org/licenses/by/4.0/).
Share and Cite
Wang, P.; Tang, Q.; Zhu, Y.; He, Y.; Yu, Q.; Liang, T.; Zheng, K. Spatial-Temporal Variation of AOD Based on MAIAC AOD in East Asia from 2011 to 2020. Atmosphere 2022, 13, 1983. https://doi.org/10.3390/atmos13121983
Wang P, Tang Q, Zhu Y, He Y, Yu Q, Liang T, Zheng K. Spatial-Temporal Variation of AOD Based on MAIAC AOD in East Asia from 2011 to 2020. Atmosphere. 2022; 13(12):1983. https://doi.org/10.3390/atmos13121983
Chicago/Turabian StyleWang, Ping, Qingxin Tang, Yuxin Zhu, Yaqian He, Quanzhou Yu, Tianquan Liang, and Ke Zheng. 2022. "Spatial-Temporal Variation of AOD Based on MAIAC AOD in East Asia from 2011 to 2020" Atmosphere 13, no. 12: 1983. https://doi.org/10.3390/atmos13121983