Article

Land Surface Albedo Estimation and Cross Validation Based on GF-1 WFV Data

State Key Laboratory of Remote Sensing Science, Beijing Engineering Research Center for Global Land Remote Sensing Products, Faculty of Geographical Science, BNU, Beijing 100875, China
*
Author to whom correspondence should be addressed.
Atmosphere 2022, 13(10), 1651; https://doi.org/10.3390/atmos13101651
Submission received: 4 August 2022 / Revised: 23 September 2022 / Accepted: 28 September 2022 / Published: 10 October 2022
(This article belongs to the Special Issue Recent Advance in Energy Budget and Earth-Atmosphere Coupling)

Abstract

:
The land surface albedo (LSA) represents the ability of the land surface to reflect solar radiation. It is one of the driving factors in the energy balance of land surface radiation and in land–air interactions. In this paper, we estimated the land surface albedo based on GF-1 WFV satellite data that have a high spatial and temporal resolution and cross-validated the albedo estimation results. The albedo estimations and validations were performed in the Ganzhou District, Zhangye City, China, and the Sindh Province, Pakistan. We used the direct estimation method which used a radiative transfer simulation to establish the relationship between the narrow band top of the atmosphere bidirectional reflectance and the land broadband albedo to estimate the albedo data. The results were validated with ground data, Landsat data, MODIS products, and GLASS products. The results show that the method can produce highly accurate albedo estimation results on different land cover types (RMSE: 0.026, R2: 0.835) and has a good consistency with the existing albedo products. This study makes a significant contribution to improving the utilization of GF data and contributes to the understanding of land–air interactions.

1. Introduction

Land surface albedo is an important parameter widely used in surface energy balances, medium- and long-term weather predictions, and global change studies [1,2,3]. LSA is defined as the ratio of all the reflected energy to the incident energy at the surface in the shortwave band [4]. LSA can provide boundary conditions at the land–atmosphere interface in general climate models [5,6,7,8]. It is essential to estimate LSA accurately for global change [9] and polar region studies [10]. Many practical remote sensing albedo products are obtained from various sensors, such as the Moderate Resolution Imaging Spectroradiometer (MODIS) [11,12,13], Polarization and Directionality of the Earth’s Reflectance (POLDER) [14,15,16], Medium Resolution Imaging Spectrometer (MERIS) [17], Clouds and the Earth’s Radiant Energy System (CERES) [18], Meteosat Second Generation (MSG) [19], Visible Infrared Imaging Radiometer Suite (VIIRS) [20,21], and Airborne Visible Infrared Imaging Spectrometer (AVIRIS) [22]. Their spatial resolutions are mainly in the order of kilometers, and their temporal resolutions vary from days to months.
To meet the demand for regional-scale climate change simulations and applications, it is currently imperative to generate higher-resolution LSA products. Researchers have attempted to generate 30-m spatial resolution surface albedo products from Landsat data [23,24,25]. Since Landsat data contain near-zenith observations and single-angle observations, it is difficult to extract bidirectional reflection information from the surface using observations from different angles [24]. The MODIS pure pixels have been used to provide information of the bidirectional reflection distribution at the surface, and the Landsat albedo estimation results were obtained using the ratio of the directional reflection to the albedo. Based on this idea, Shuai et al. [23] proposed that a 30 m albedo estimation algorithm depends on the MODIS BRDF products, and the algorithm was used for long-term 30-m land surface snow-free albedo retrieval [24]. Wang et al. [26] then adopted this method to generate snow-free and snow-cover albedo in boreal forests. Wang also detected early spring post-fire snow albedo dynamics and examined the progress of fire recovery. Gao et al. [27] used this algorithm in albedo estimation by combining HJ-1A/B satellite reflectance data and MODIS BRDF products. A 30 m albedo was generated by establishing the ratio relationship between HJ-1A/B and MODIS. However, the method relies on the extraction of bidirectional reflection distribution information from MODIS pixel elements of different land cover types, thus limiting the widespread use of this method.
To simplify the estimation, He et al. [28] proposed an algorithm to directly estimate the surface albedo using the TOA observation data obtained via HJ satellite. The algorithm integrates the surface BRDF database of MODIS into the radiative transfer simulation. Zhou et al. [21] generated HJ-1 and Landsat 30 m albedo data using the direct estimation method for regional-scale studies and as intermediate-scale data for coarse spatial resolution product validation. However, the effect of a complex terrain environment was not considered, and attempts at high spatial resolution albedo data generation are still ongoing.
Recently, China has identified the Chinese high-resolution earth observation system as a major special project, and under the support of this project, a number of high spatial resolution remote sensing satellites have been launched, playing an important role in agriculture [29,30,31], the environment [32,33,34], and human activities such as traffic under COVID-19 [35]. GF-1 is the first satellite of the Chinese high-resolution Earth observation system; it was developed by the Institute of Space Technology of the China Aerospace Science and Technology Corporation. The satellite has broken through the key technology of optical remote sensing with high spatial resolution, multispectrum, and wide coverage, with a design life of 5–8 years. The successful launch of the GF-1 satellite provides high-precision and wide-range space observation services for land and resources, agriculture, meteorology, environmental protection, and other research areas. The development of advanced remote sensing product estimation methods based on Chinese satellite data will effectively improve the application capabilities of Chinese satellites and support applications such as agricultural ecology, resource environment, and public information. Zhou et al. [36] proposed a method to estimate the land surface albedo based on GF-1 data, which used land surface bidirectional reflectance distribution function characteristic parameters to represent the non-Lambertian characteristic of land surface. Wang et al. [37] estimated the surface albedo of the Ganzhou District based on GF-1 satellite data and analyzed the temporal and spatial variation of albedo. However, the estimation was only constrained in China, so further validation is still needed.
In this paper, the GF-1 albedo was estimated in and out of China (Ganzhou District, Zhangye City, Gansu Province and Sindh Province, Pakistan) via the direct estimation method. The albedo estimation results were then validated with field observations and cross-validated with a variety of different albedo data to demonstrate the feasibility of the direct estimation method with different GF-1 land coverage types.

2. Study Area and Data
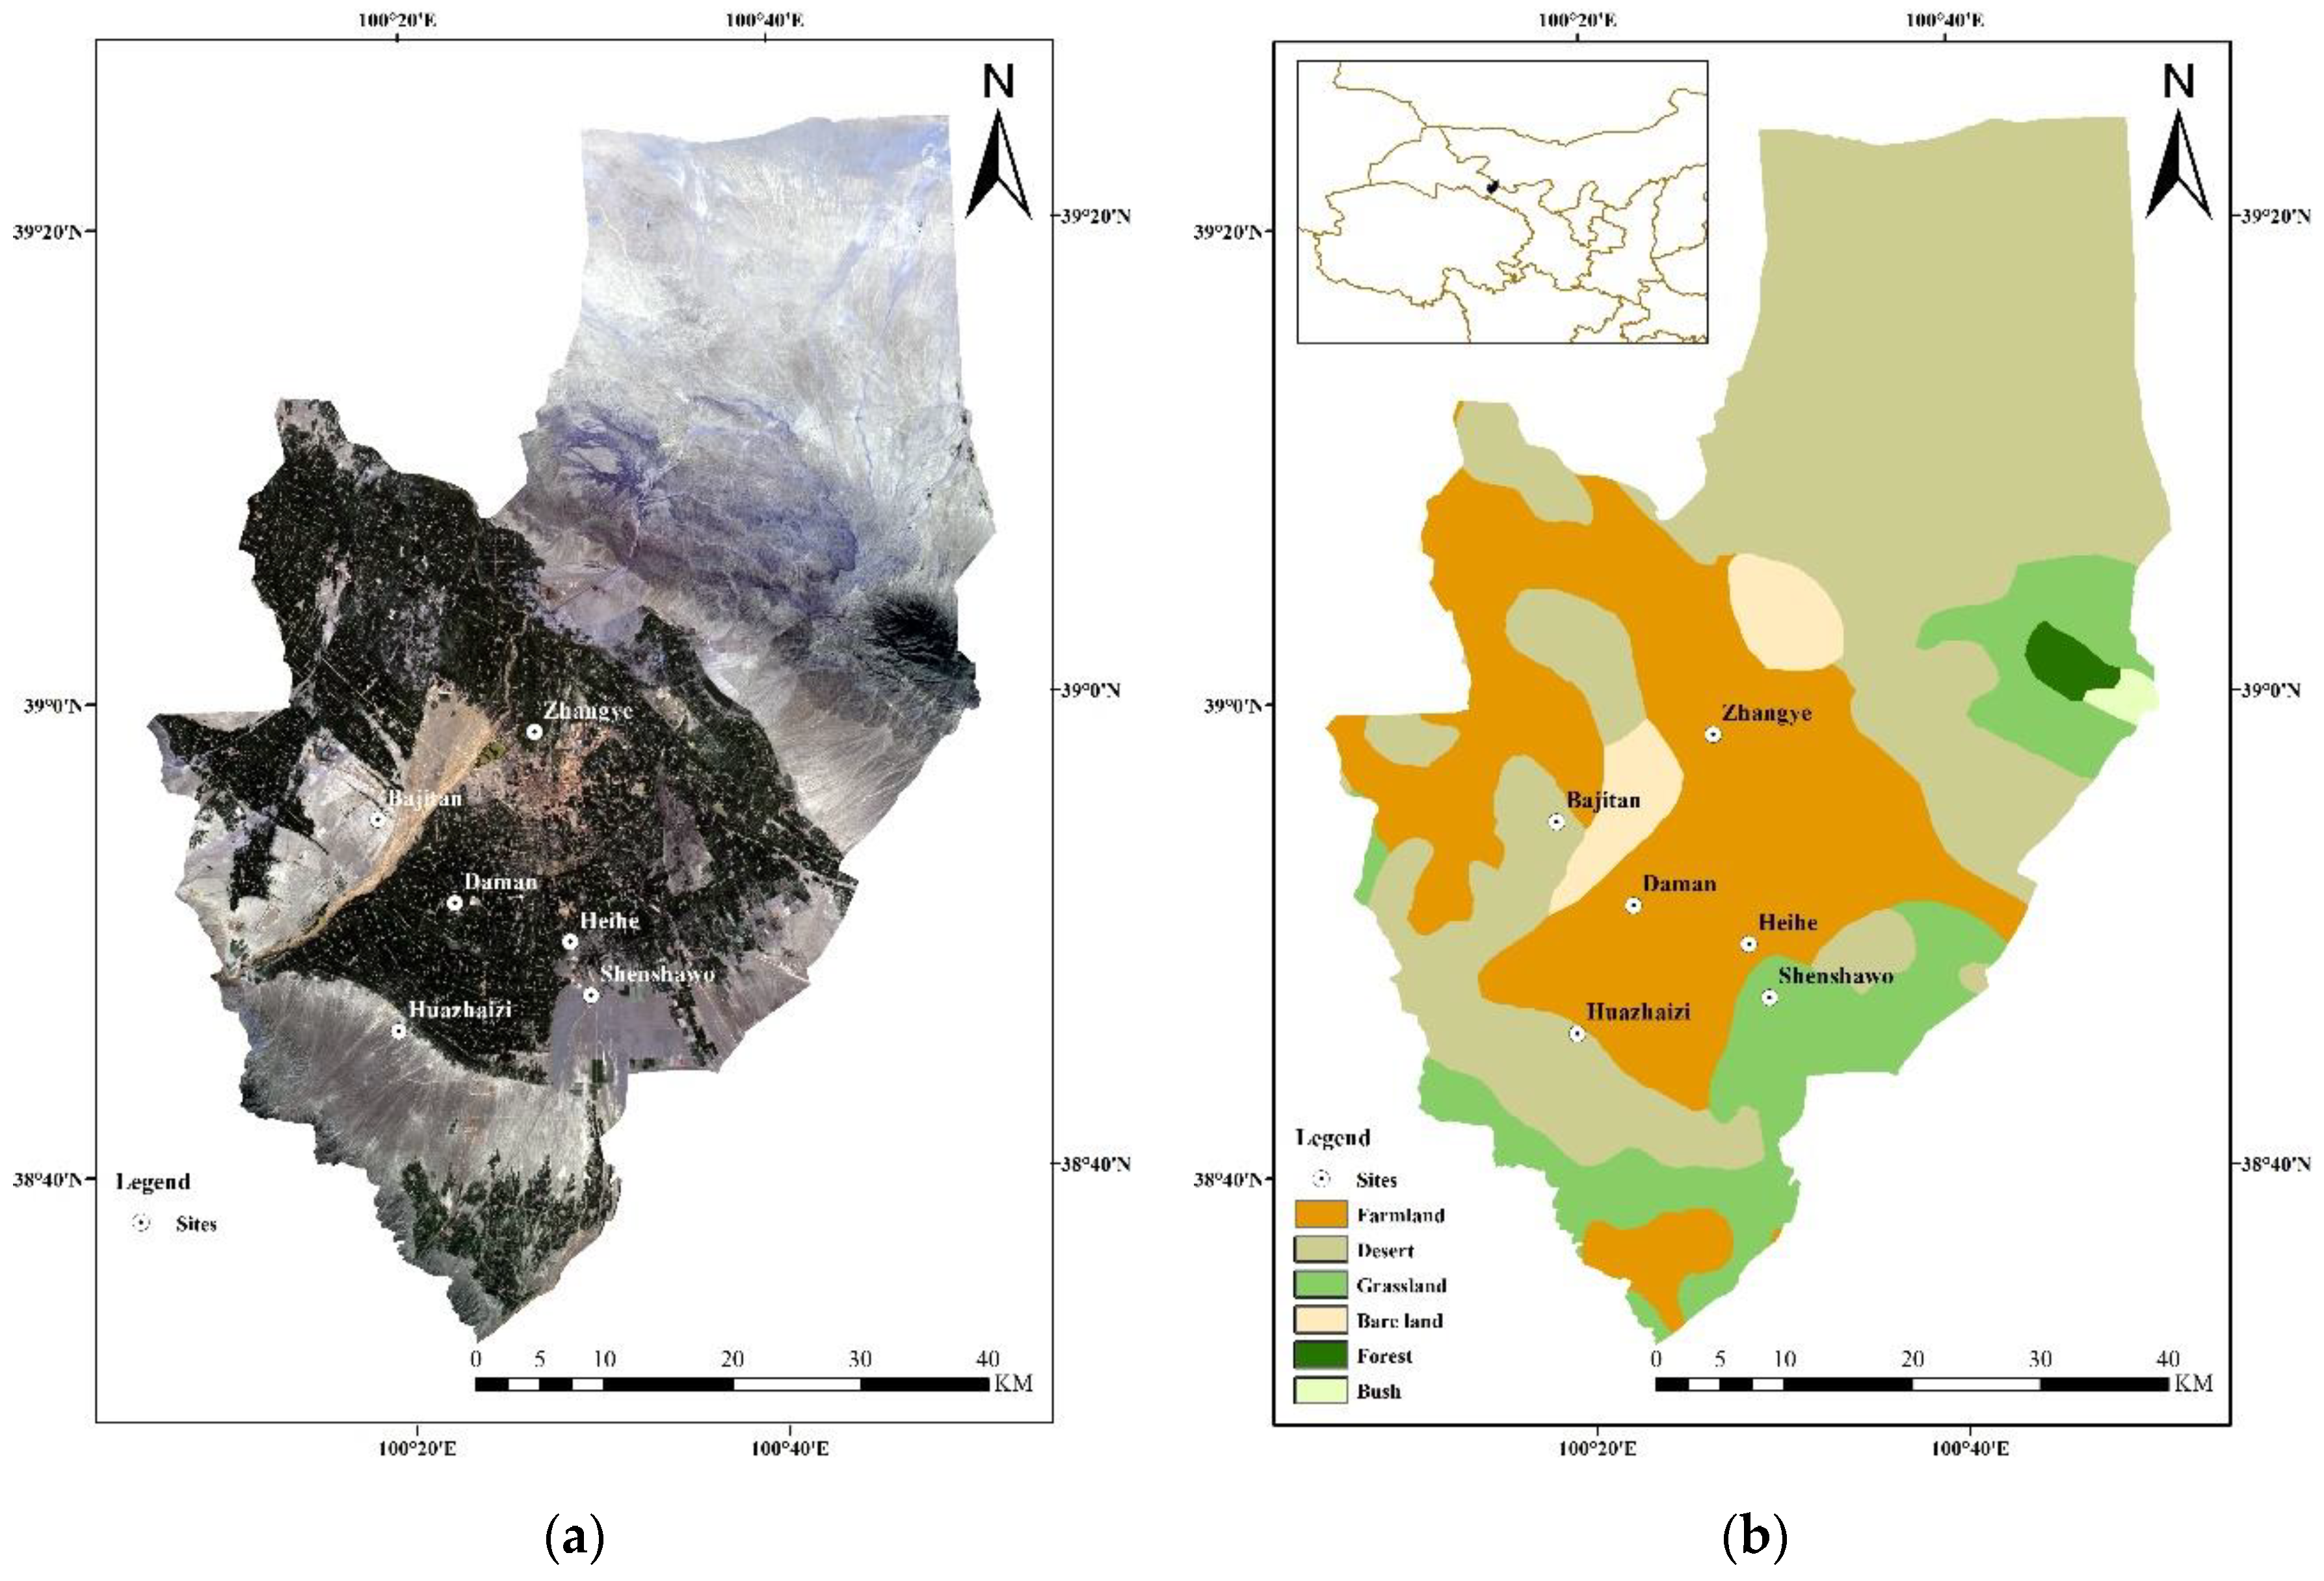
2.1. Study Area

The study areas are located in two different countries, the Ganzhou District, Gansu Province, China, and the Sindh Province, Pakistan.
The Ganzhou District of Zhangye City is located in the middle reaches of the Heihe River Basin and belongs to the middle section of the Hexi Corridor, bordering the Alashan Right Banner of the Inner Mongolia Autonomous Region. The latitude and longitude of the study area ranges from 100°6′ E to 100°52′ E and 38°39′ N to 39°24′ N [38]. The study area is flat, with an average elevation of 1474 m. The Black River and other rivers run through the entire study area, which is a typical oasis agricultural area. The study area has a temperate continental climate, dry and with little rain, with an average annual precipitation of 113–312 mm, evaporation of 2047 mm, and an average annual temperature of 7.1 °C. The image and surface classification of the study area are shown in Figure 1. The surface classification data used in this paper were downloaded from the GlobeLand30 (http://www.globallandcover.com/, accessed on 2 June 2021).
The Sindh Province is located in southeastern Pakistan. It is adjacent to India in the east and the Arabian Sea in the south, with an area of 140,900 square kilometers [39]. The study area is located in the plains of the lower Indus River, with an arid climate and an average annual rainfall of 180 mm. Thirty-eight percent of the land in the study area is farmland, mainly used for planting cotton, wheat, and rice. The image and surface classification of the study area are shown in Figure 2.

2.2. GF-1 Data

The GF-1 satellite is the first satellite of the Chinese high-resolution Earth observation system and was launched on 26 April 2013. The GF-1 is equipped with two panchromatic/multispectral cameras (PMSs) and four wide field view cameras (WFVs). In this study, a WFV camera with a resolution of 16 m was selected for estimating LSA. The WFV camera includes four bands with the spectral resolution shown in Table 1. The field of view of each camera is 8°, the angle between adjacent cameras is 16°, and the observed field of view is approximately 65° after a combination of four cameras. The sensor has a width of 830 km for vertical downward observations and has both a ±25° sway capability and a maximum emergency sway capability of ±35°. In practice, an image is obtained from a single sensor so that the deviation of the observed zenith angle at each point of each image is less than 8° of the field of view. Since the study area selected for this study is a small part of the entire image, the observed zenith angle variation between image elements is not considered. The revisit time of the GF-1 at the equator is approximately 4 days, which is much more frequent than that of Landsat. The high frequency revisit time, extensive coverage capability, and high spatial resolution of GF-1 make it suitable for regional land surface monitoring and variability detection. GF-1 achieves the combination of high resolution and large width, 2 m high resolution achieves an imaging width greater than 60 km, and 16 m resolution achieves an imaging width greater than 800 km, which can meet the comprehensive needs of multisource remote sensing data and the requirements of different applications. GF-1 achieves 50 m image positioning accuracy without ground control points to meet users’ needs for refined applications. GF-1 also has high stability, an attitude stability that is better than 5 × 10⁻⁴ °/s, and 35° side-swing imaging capability, which can meet the flexible application of on-orbit remote sensing.
All GF-1 WFV data used in this paper were downloaded from the China Center for Resources Satellite Data and Application (http://www.cresda.com/CN/, accessed on 22 May 2021), and we selected clear sky data (clouds < 10%) to ensure data quality. The GF-1 WFV data released by the China Center for Resources Satellite Data and Application are divided into two levels, a preprocessing level radiometric correction image product (L1A) and a preprocessing level geometric correction image product (L2). L1A is a data analysis and radiation correction processed image data product that provides rational polynomial function model correction parameter files. The GF-1 images used in this paper are all L1A. For L1A data, geometric correction of GF-1 WFV data can be achieved based on the RPC model according to the RPC parameter file (*.rpb) provided with it.

2.3. Validation Data

We used field observation data, Landsat data, MODIS data, and GLASS data to cross-validate the albedo estimation results.

2.3.1. Field Observation Data

We selected six sites in the Ganzhou District, including four land cover types, which are grassland, desert, farmland (corn), and wetland. There are three sites for desert and one for each of the other land types. The field observation data in the Ganzhou study area include temperature, humidity, precipitation, air pressure, wind speed, soil, and radiation. The instrument used for radiation measurements was the CNR4 net radiometer produced by Kipp and Zonen in the Netherlands. The uncertainty of the CNR4 radiometer is less than 1%, so the uncertainty of CNR4 was not considered in this study. The radiometer was set up on the flux observation tower with a sampling interval of 10 min, and the radiometer was set up at different heights at different stations. The coverage of field observations can be calculated based on the height of the radiometer by Equation (1), and pixels located in the observation area are aggregated and used for validation. The LSA was calculated from the ratio of upward shortwave radiation and downward shortwave radiation data. The field observation data were downloaded from the National Tibetan Plateau Data Center (https://data.tpdc.ac.cn/zh-hans/, accessed on 10 March 2021), and the data information is shown in Table 2.
R = H · tan ( θ 2 )
where R is the observation radius, H is the height of the radiometer, and θ is the field of view of the radiometer.

2.3.2. Remote Sensing Data

The Landsat data used in this study are all Landsat 8 OLI sensor data. Landsat-8 was launched in February 2013 with two sensors, the Operational Land Imager (OLI) and the Thermal Infrared Sensor (TIRS). OLI includes nine bands with a spatial resolution of 30 m, including a 15 m panchromatic band with an imaging width of 185 km × 185 km. We used He’s method [25] to estimate the surface albedo using Landsat-8. The Landsat 8 OLI data used in this paper were downloaded from the Geospatial Data Cloud (http://www.gscloud.cn/, accessed on 3 June 2021).
The MODIS surface albedo data used for the study are the black-sky albedo and white-sky albedo products of the MCD43A3 version 6 product. The data are provided by the United States Geological Survey (USGS) Earth Resource Observation and Science (EROS) Data Center and are of sufficient quality to meet the requirements of scientific research and analysis. The MODIS surface albedo product is based on the RossThick-LiSparse-R kernel-driven BRDF model for inversion of LSA and is the most widely used LSA product available. The MCD43 data used in this paper were downloaded from the LAADS DAAC of NASA (https://ladsweb.modaps.eosdis.nasa.gov/search/, accessed on 23 June 2021).
The GLASS surface albedo product used in this study is GLASS02A01. GLASS02A01 is a synthetic product obtained by averaging the 17-day albedo product of GLASS02A21 with an update period of 8 days. The two products mainly include shortwave black-sky albedo (BSA), shortwave white-sky albedo (WSA), and quality control datasets. The data information used for the validation is shown in Table 2. The GLASS data used in this paper were downloaded from the National Earth System Science Data Center (http://www.geodata.cn/, accessed on 26 May 2021). The information of the data used for validation is shown in Table 3.
The projections of MODIS, GLASS, GF-1, and Landsat were different. To ensure the comparability of each dataset, the MODIS, GLASS, and GF-1 WFV data were converted to UTM projects and resampled to 30 m. We visually interpreted the remote sensing images after resampling and determined that the error was within two pixels.

3. Method

3.1. GF-1 WFV Albedo Estimation Method

In this study, the GF-1 WFV albedo was estimated by the direct estimation method [36]. The direct estimation method estimates the surface albedo directly from the TOA reflectance without an atmospheric correction. The idea of the direct estimation method is to discard the complex multistep inversion process and directly establish the statistical relationship between the top of the atmosphere bidirectional reflectance and the surface broadband albedo at narrow wavelengths. This method combines the three steps of atmospheric correction, narrow band albedo calculation, and the conversion of narrow band albedo to broadband albedo, which are based on physical processes, into one statistical analysis step to solve the problem. The algorithm is simpler and more efficient and is well suited, as a generation algorithm, for global albedo products.
The process of estimating the albedo using the direct estimation method in this study consists of the following steps:
(1) In this study, the MODIS BRDF mode parameters are used to depict the land surface BRDF characteristics. MODIS BRFD data need to be converted to the GF-1 WFV band, and the band conversion coefficient is calculated based on the spectral library data and the spectral response functions of MODIS and GF-1 WFV. According to the band conversion coefficients, the surface directional reflection characteristic parameters of the MODIS band are converted to the GF-1 WFV band, and the directional reflection characteristic parameters of each GF-1 WFV band are obtained, which is then used in the 6S simulation.
(2) The 6S model is used to simulate the directional reflectance at the top of the atmosphere, and the BRDF model simulation is used by considering the surface BRDF characteristics. The input parameters include observation condition parameters, atmospheric condition parameters, surface information, etc. The input parameters are organized into input files, and the files are called cyclically to simulate the top of the atmospheric reflectance under different conditions. The input parameters of the 6S model are shown in Table 4.
(3) The LSA is obtained based on the data of the typical feature spectral library and the BRDF parameters of GF-1 WFV. The MODIS BRDF model parameter (MCD43A2) products provide seven bands of linear kernel-driven model coefficients, which characterize the directional reflection characteristics of the surface. Using the linear kernel-driven model, model coefficients and equations and coefficients provided by Schaaf, the black-sky albedo and white-sky albedo can be calculated for each band. The calculation formula is shown in Equation (2).
α b s ( θ , λ ) = f i s o ( λ ) ( g 0 i s o + g 1 i s o θ 2 + g 2 i s o θ 3 ) + f v o l ( λ ) ( g 0 v o l + g 1 v o l θ 2 + g 2 v o l θ 3 ) + f g e o ( λ ) ( g 0 g e o + g 1 g e o θ 2 + g 2 g e o θ 3 )  
The coefficients in the formula are listed in Table 5.
(4) Establish a lookup table between the top of atmospheric reflectance and surface albedo. In the study, the search grid was established at intervals of 5° for the solar zenith angle and view zenith angle and at intervals of 30° for the relative azimuth angle. According to the angle settings in Table 4, there were 16 solar zenith angle samples, 9 view zenith angle samples, and 7 relative azimuth angle samples, so a 16 × 9 × 7 three-level lookup table was established. The coefficients of each grid were calculated by the linear regression method. Each grid established a linear regression between the top of the atmospheric reflectance and the broadband LSA for each of the four GF-1 WFV bands, and the regression coefficients of the linear regression were stored in the lookup table.

3.2. Validation Method

3.2.1. Validation Based on Field Observation Data

The spatial extent of field observation data of each site was calculated by the radiometer height and observation field of view; the estimated GF-1 WFV surface albedo data were aggregated according to the representative range of the site observations; finally, the aggregated results were directly validated against the field measurements. When the calculated results are compared with the ground measured albedo data, the BSA and WSA need to be calculated as blue-sky albedo based on the proportion of direct sky light.
α ( θ i , λ ) = ( 1 s ( θ i τ ( λ ) ) ) α b s ( θ i , λ ) + s ( θ i τ ( λ ) ) α w s ( θ i , λ )
where α ( θ i , λ ) is the blue-sky albedo of the band λ at a solar zenith angle of θ, α b s ( θ i , λ ) is the black-sky albedo, α w s ( θ i , λ ) is the white-sky albedo, and s ( θ i τ ( λ ) ) is the fraction of diffuse skylight when the solar zenith angle is θ, which is a function of aerosol optical depth and can be calculated using a predetermined lookup table (LUT) based on the 6S atmospheric radiative transfer code [40].
Since the transit time of remote sensing observations varies, to ensure time consistency between the field observation data and the remote sensing estimation results, we refer to the method proposed by Liang et al. [41] to calculate the monthly average albedo. In this method, the observation data of half an hour before and after the satellite transit time were averaged as the surface albedo at the satellite transit time.

3.2.2. Validation Based on Other Remote Sensing Data

The extent of the study area was clipped from the images of each remote sensing product separately, and remote sensing images with similar times to the GF-1 WFV were selected for validation. Since the spatial resolution of Landsat-8, MCD43A3, and GLASS02A01 is different from that of the GF-1 WFV, these remote sensing products need to be resampled to the same spatial resolution as the GF-1 WFV before validation. Finally, the GF-1 WFV albedo estimation results were validated with other remote sensing products pixel by pixel, and scatter density maps were plotted.

3.2.3. Accuracy Evaluation

The estimation results of GF-1 WFV were calculated by a linear regression with the ground measurement results and other remote sensing products. The accuracy of the estimation results was evaluated using the coefficient of determination (R2) and the root mean square error (RMSE) of linear regression.

4. Result

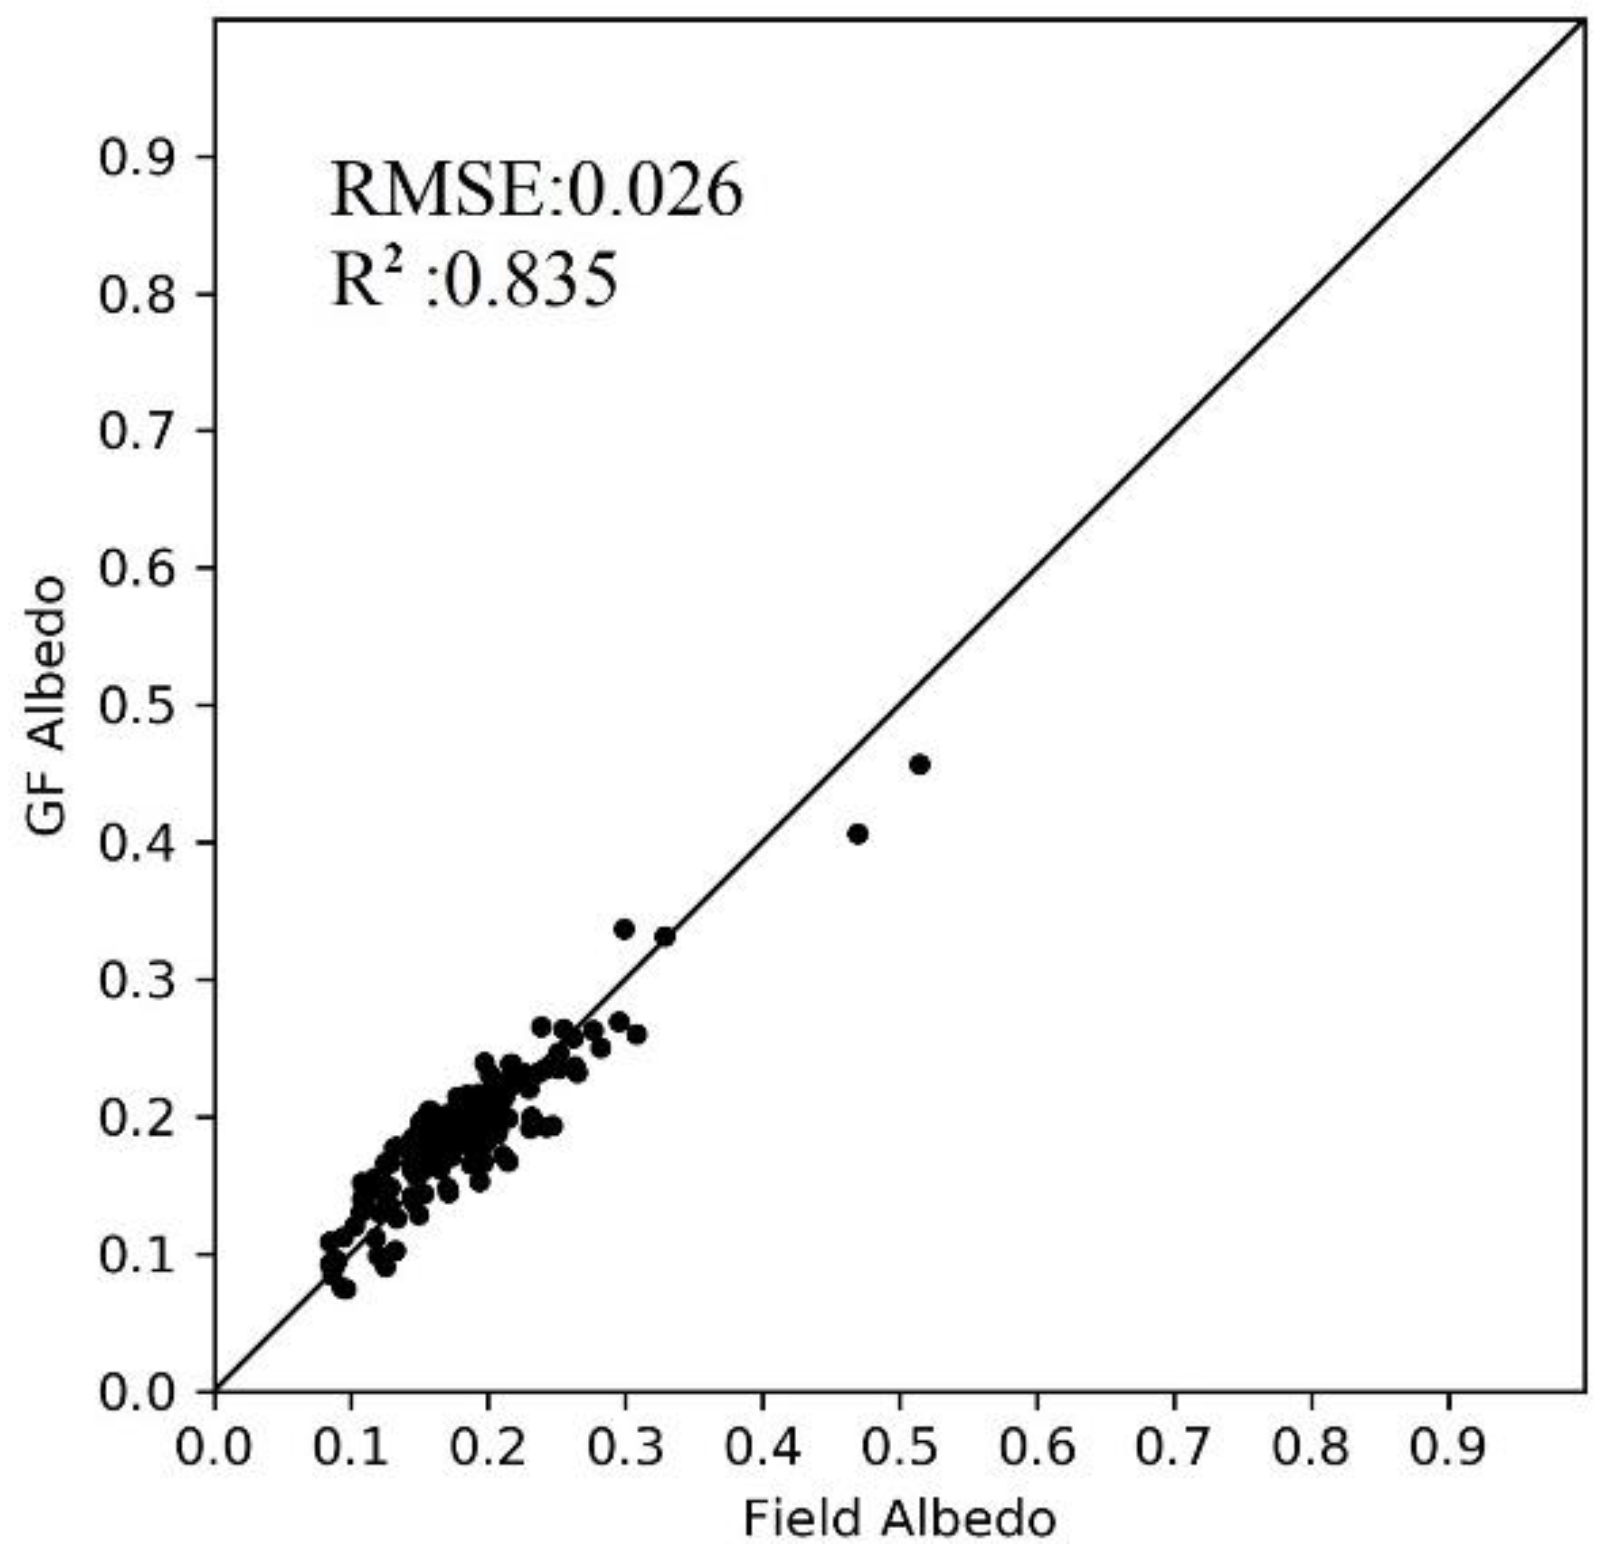
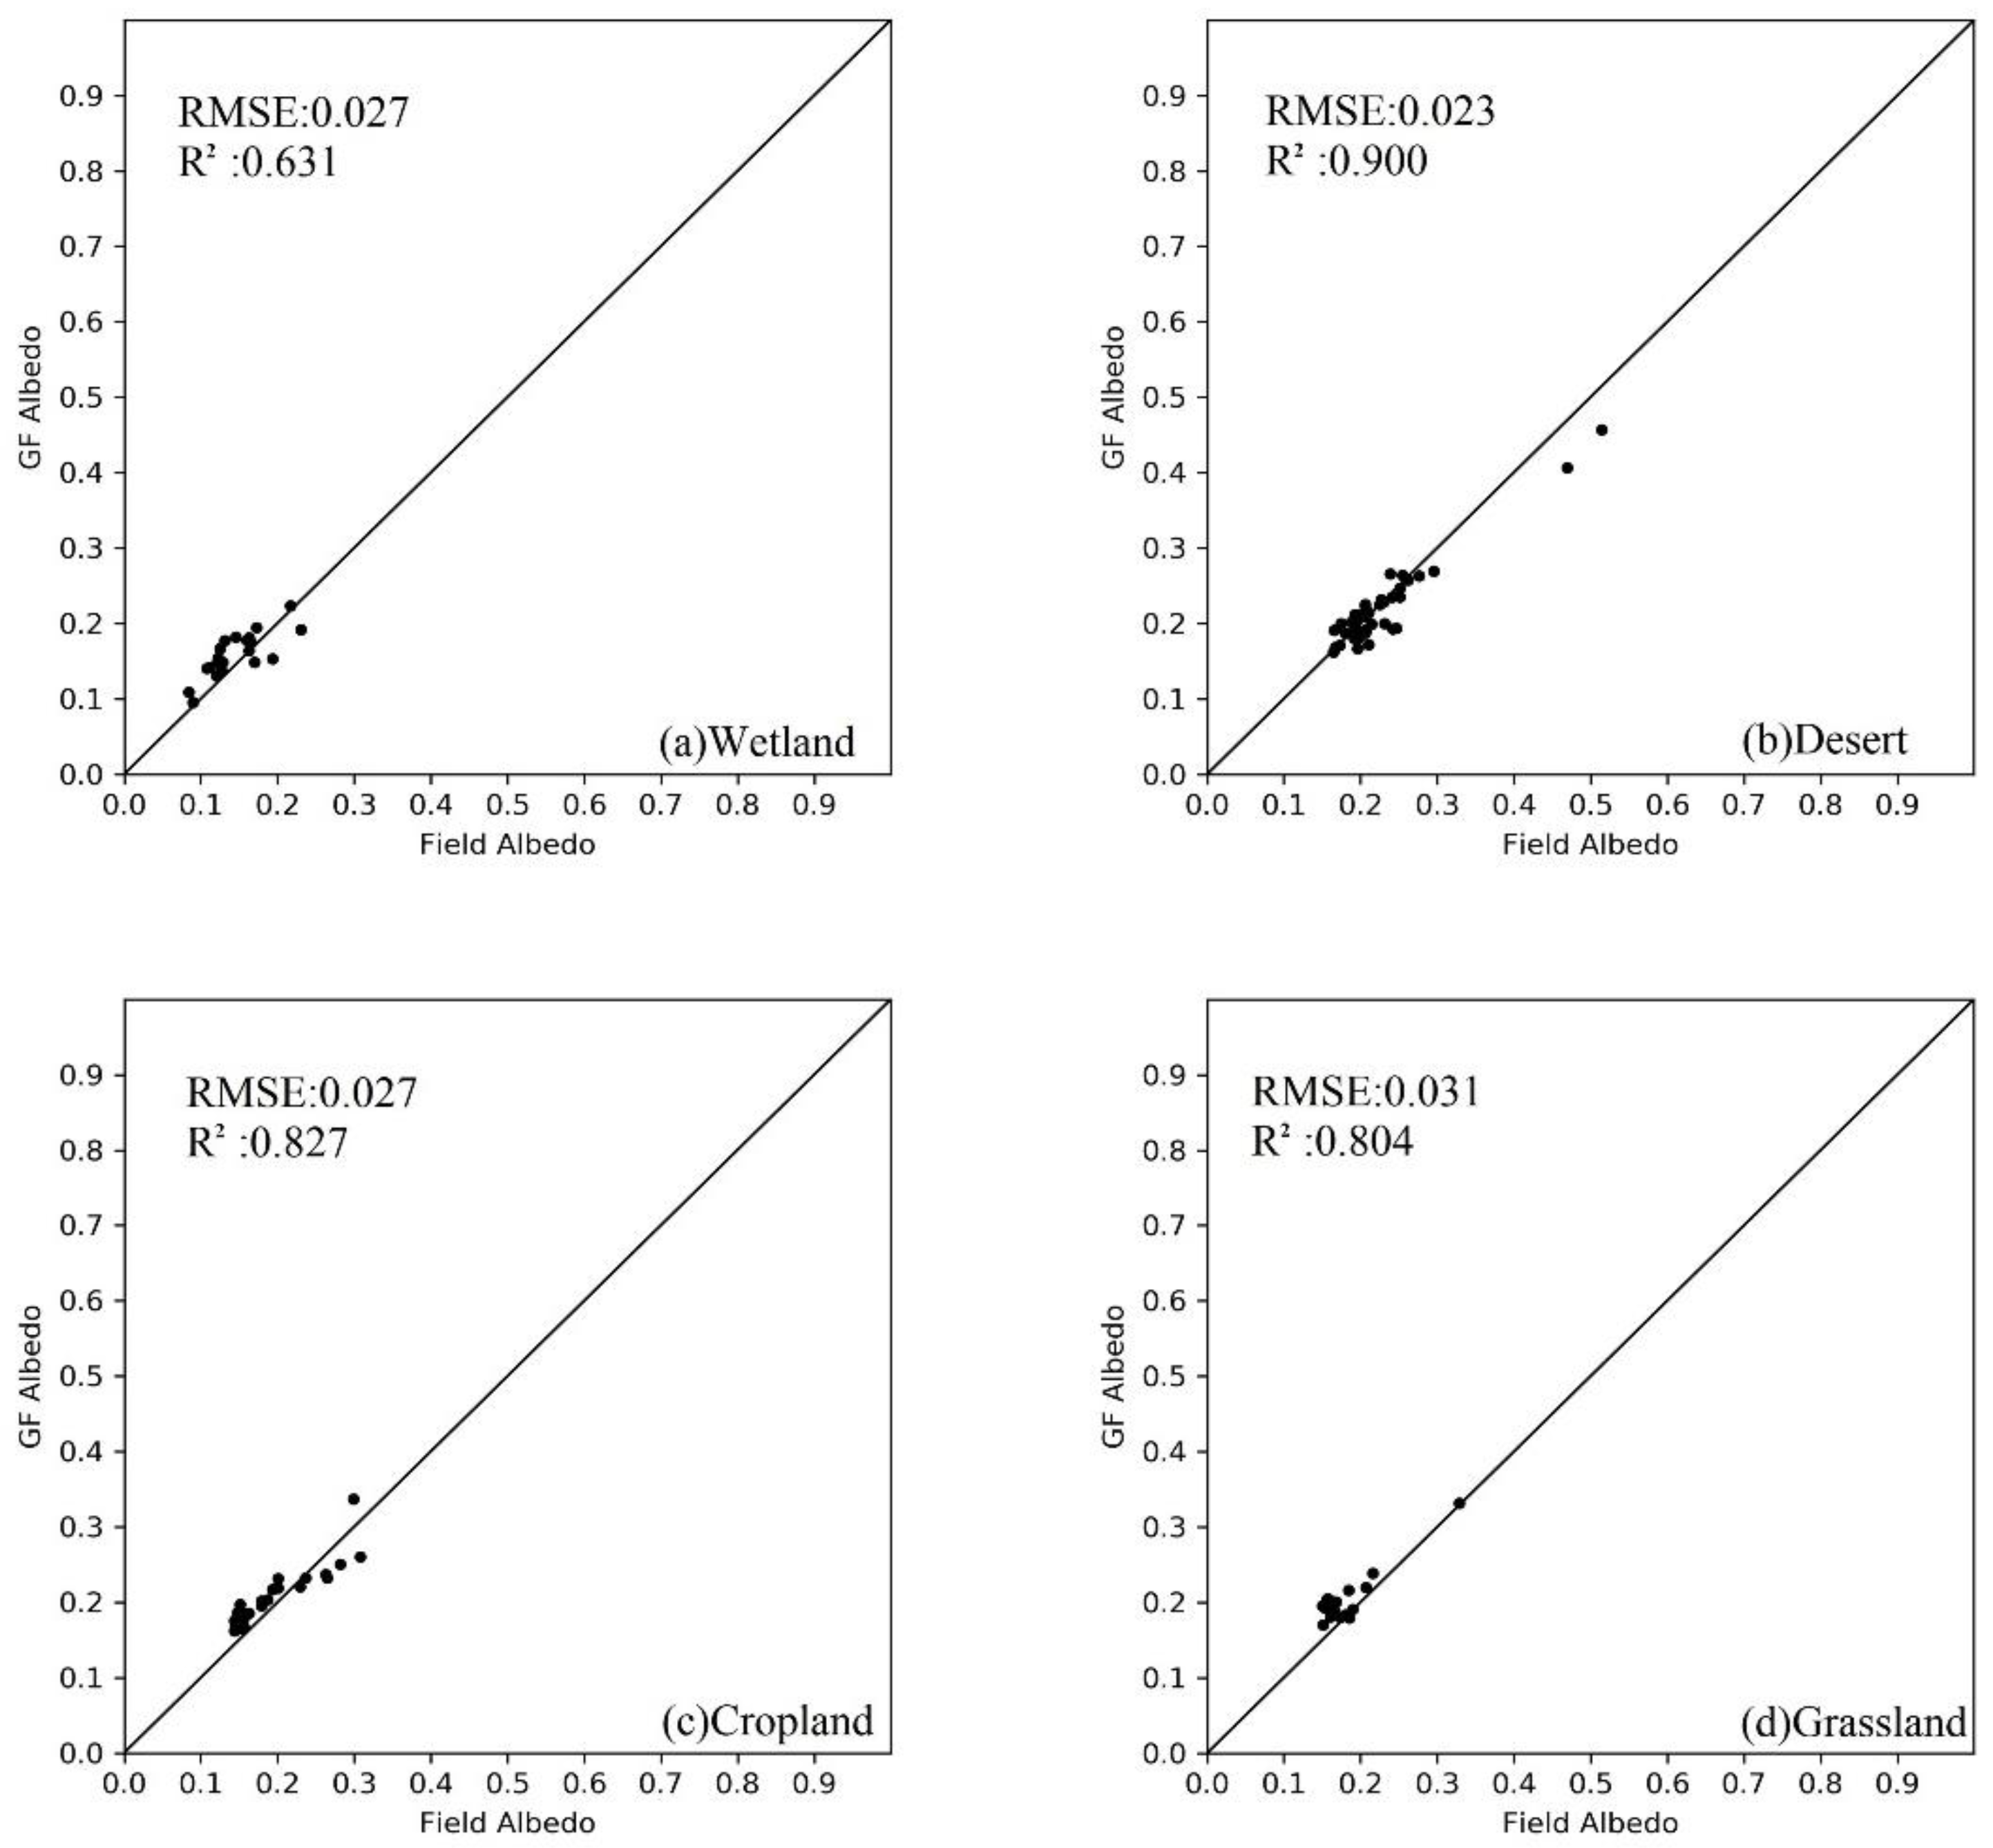
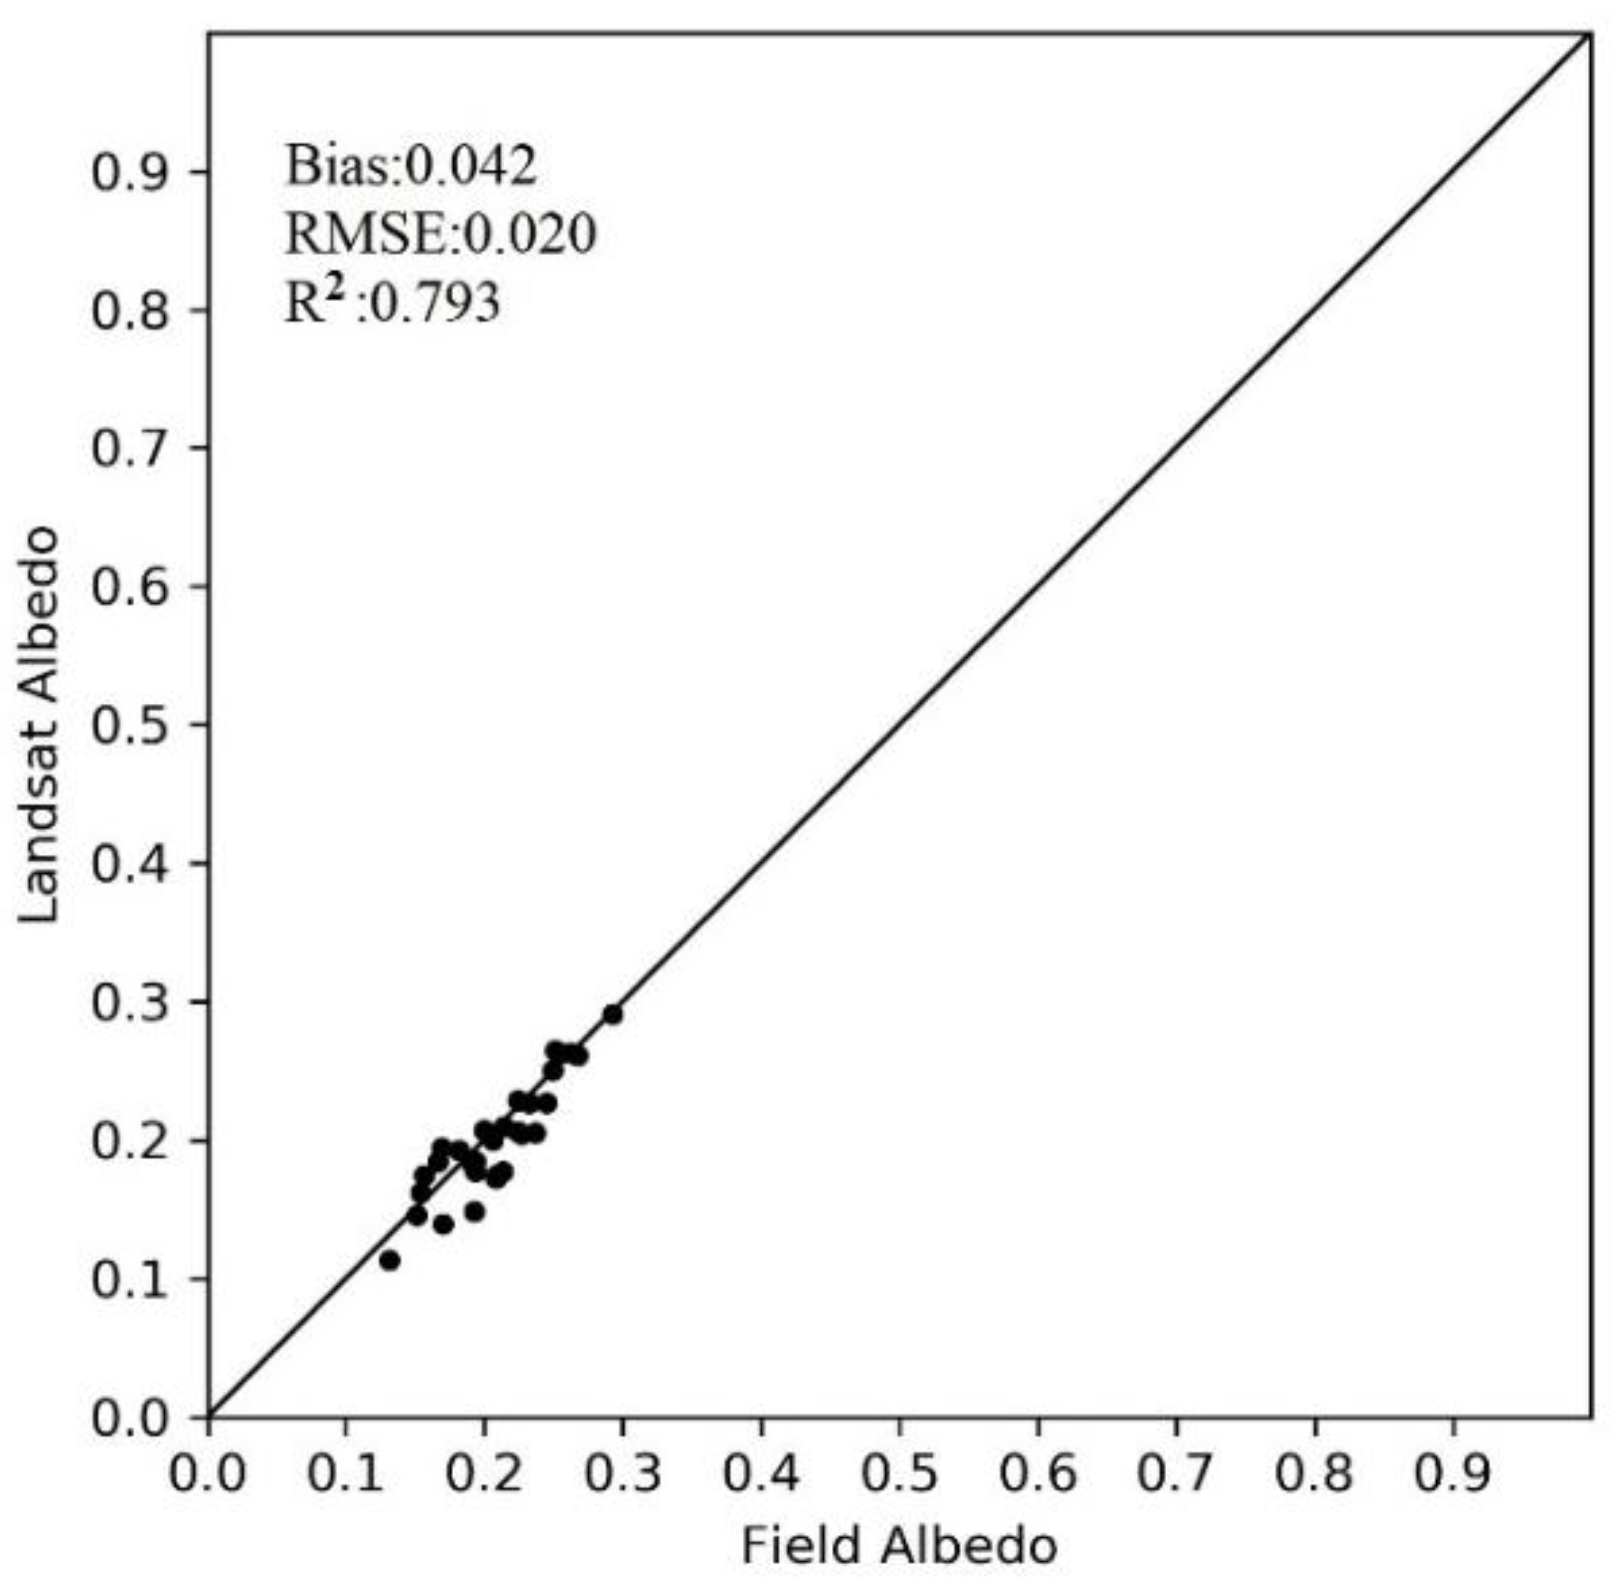
4.1. Validation against Field Observation Data

According to the formula of blue-sky albedo in Section 3.2, we compared the blue-sky albedo of GF-1 with ground measurement data. The results of the validation are shown in Figure 3. As seen from the scatter plot, the results for all sites show high accuracy for R2 (0.835) and RMSE (0.026).
Since different land cover types have significant differences in LSA, it is necessary to discuss sites with different land cover types separately. The surface albedo around each site was estimated according to the direct estimation method, and the results were directly compared with the ground measurements, as shown in Figure 4. The land cover type of the Zhangye site is a wetland, and it is located in Zhangye National Wetland Park. The estimation results for wetlands are relatively poor compared to those of other land cover types, with R2 and RMSE values of 0.631 and 0.027, respectively. The figure shows that the albedo estimation results are overestimated in most cases. The overall albedo of wetlands was maintained between 0.1 and 0.25, indicating that the albedo of wetlands did not vary significantly with the seasons and was relatively stable.
The desert sites have the most data of the four land cover types, which leads to a higher reliability for the albedo estimation. The desert sites have the best albedo estimation results, boasting the highest R2, 0.900, and the lowest RMSE, 0.023. The large albedo (>0.4) in the figure is because the data were collected in winter and there was snowfall, which greatly increased the albedo due to the snow on the ground. We also find that the overall albedo of the desert station is slightly higher than that of the other three land cover types. This is because the desert is mostly bare land with very little vegetation cover and therefore has a high albedo.
The land cover type of the Daman site is farmland, and the main crop is corn, so the variation in LSA at this site has a very strong correlation with the crop growth pattern. For example, when crops start to grow, the albedo decreases; when crops are harvested and the surface becomes bare soil, the albedo increases. The albedo estimation results of the site are good, with R2 and RMSE values of 0.827 and 0.027, respectively. As seen from the figure, the LSA is highly variable, varying between 0.15 and 0.35, which may be related to crop growth and harvesting and is discussed specifically in Section 5.
The albedo of the grassland site fluctuates slightly, with the overall albedo fluctuating approximately 0.2. The RMSE and R2 of the grassland site had poorer results compared to the desert and farmland (RMSE: 0.804, R2: 0.031) due to the smaller amount of data of the grassland site, which resulted in a greater instability in the albedo results. In general, the albedo decreases gradually as the vegetation cover increases. Although there are few grassland site data, the fitting degree with the field observation data is still very good, indicating the accuracy of the estimation results.

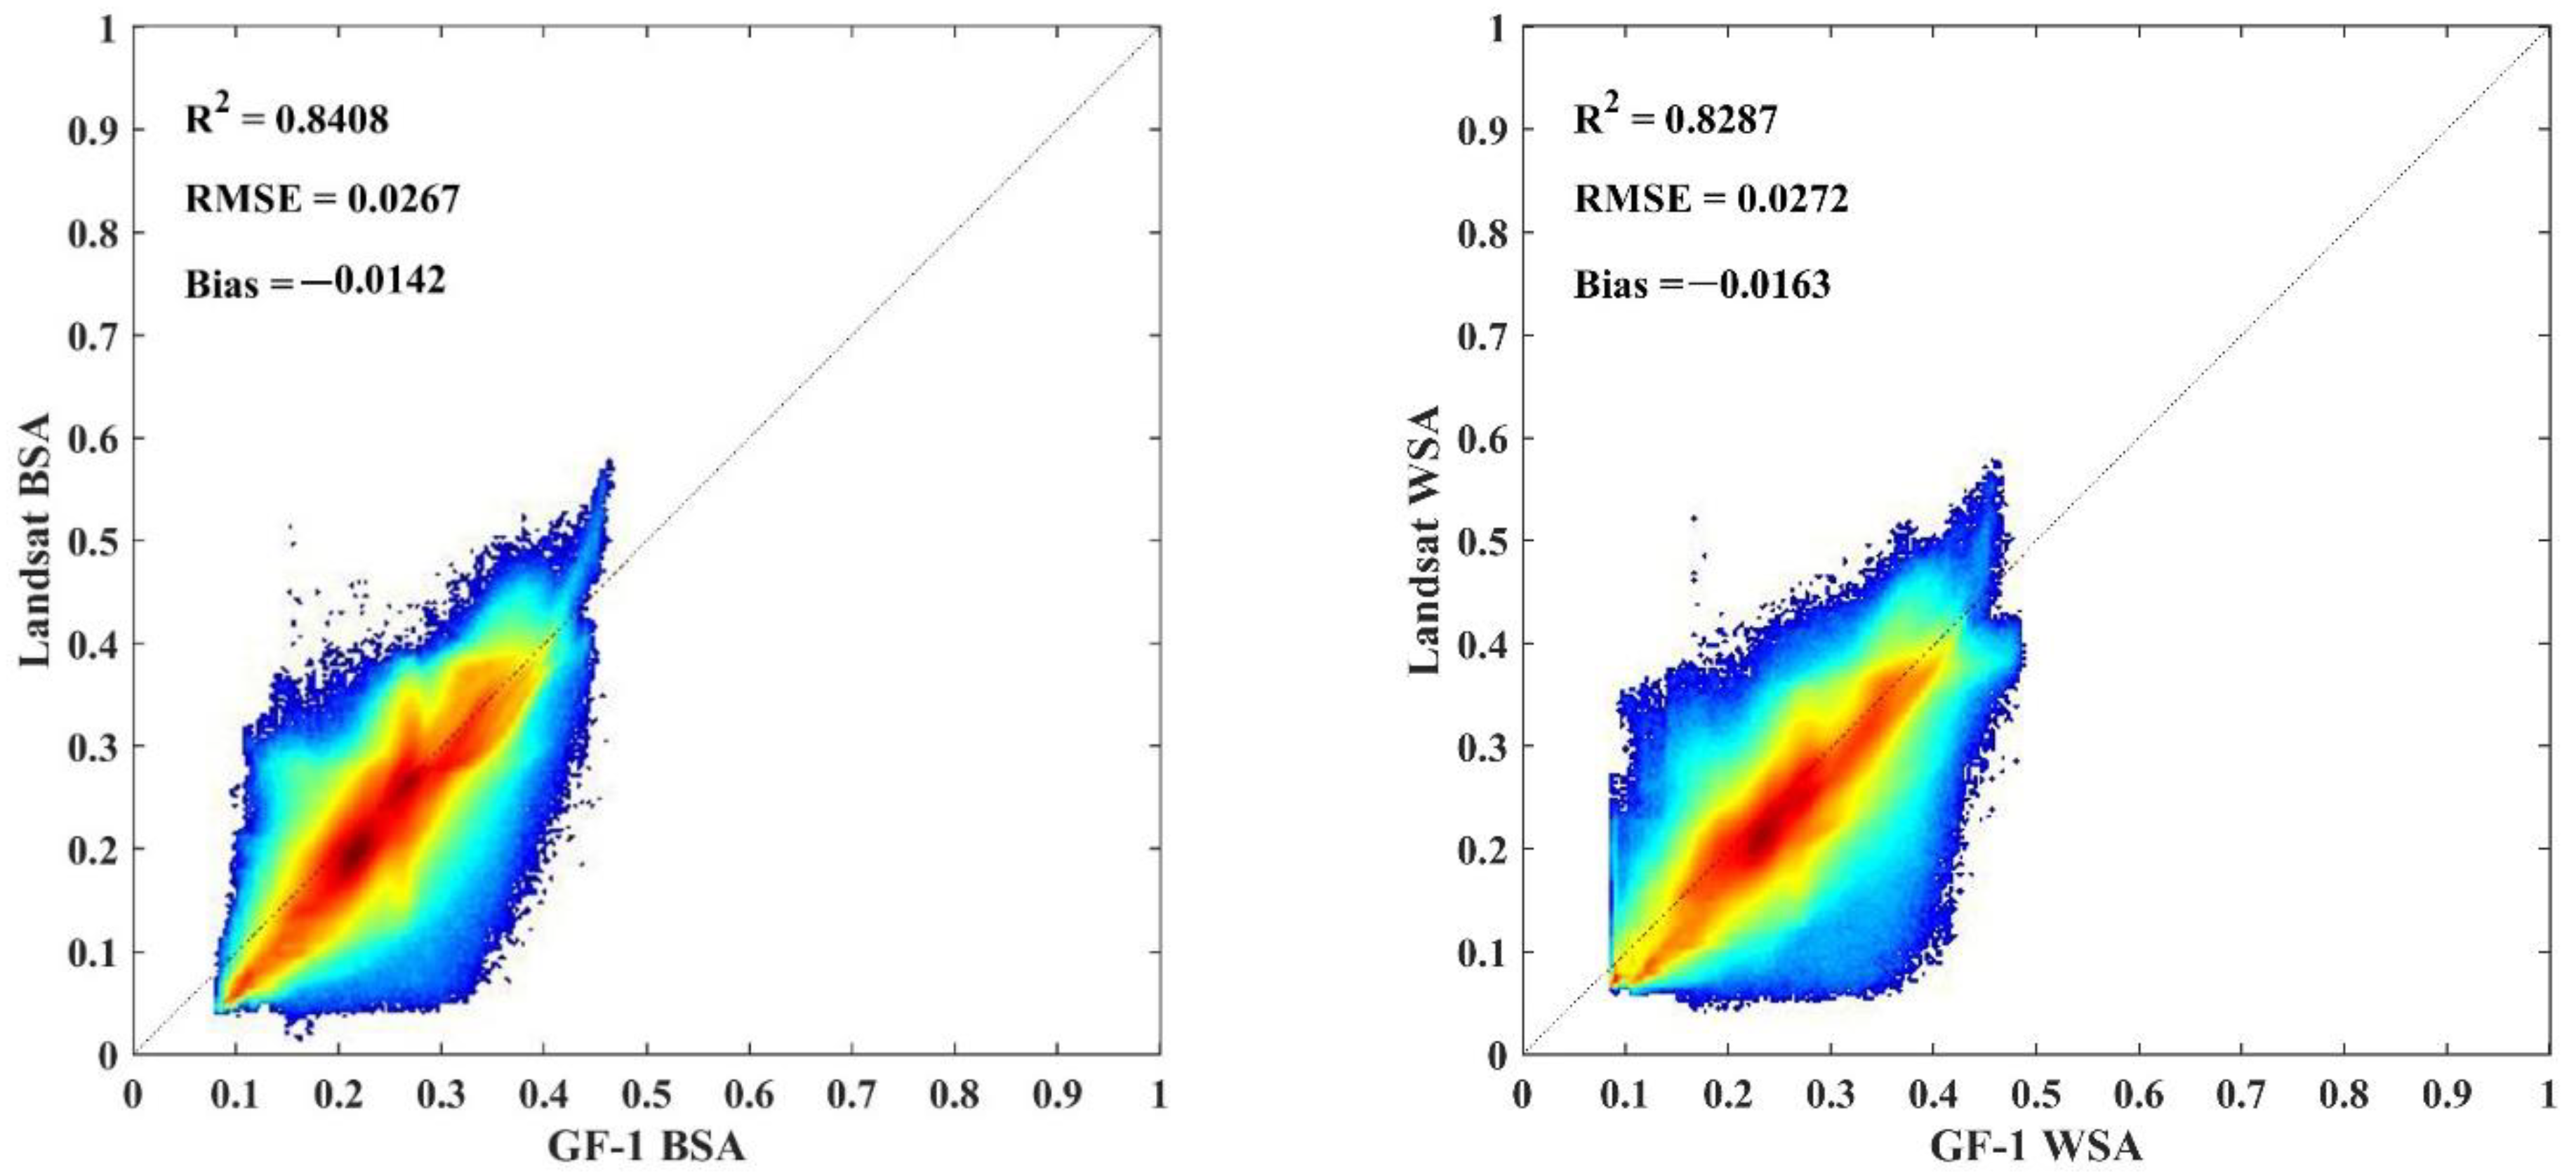
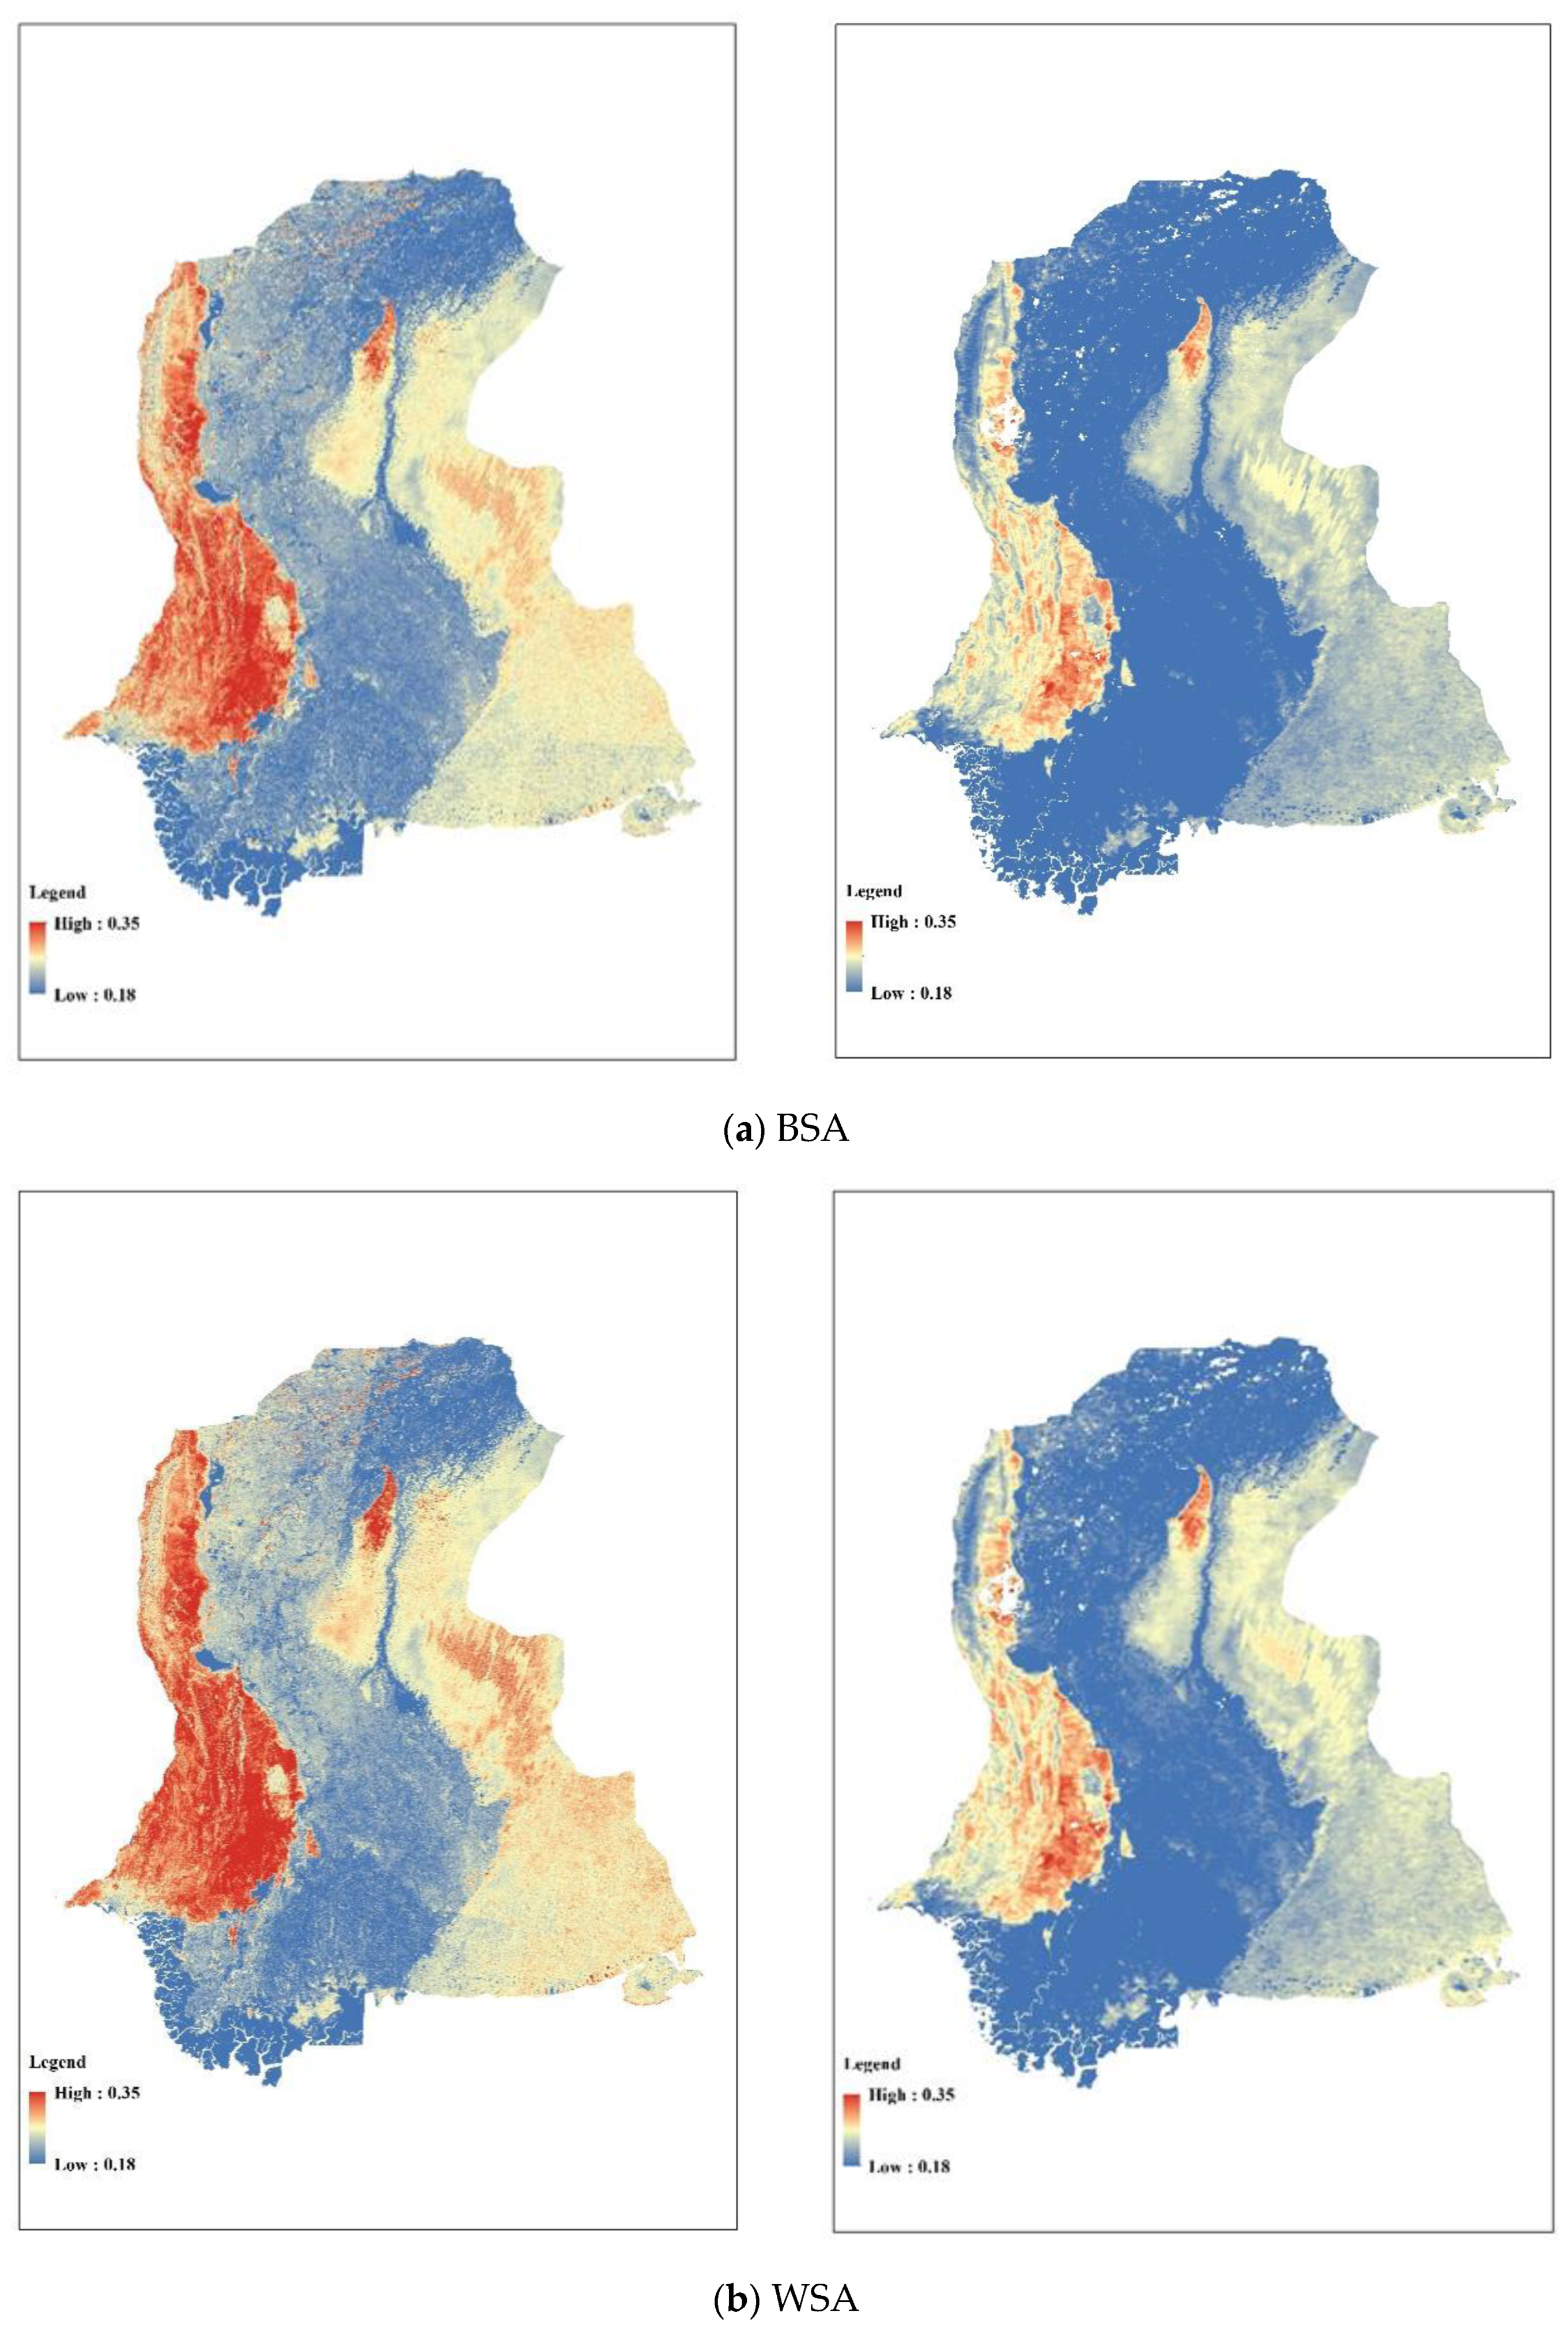
4.2. Validation against Landsat Data

In this study, the method of He et al. [25] was used to estimate the surface albedo of Landsat-8, and the estimated results were used for validation. Since Landsat-7 has an obvious strip, the albedo results of GF-1 were compared with those of the Landsat-8 estimation albedo from the same period.

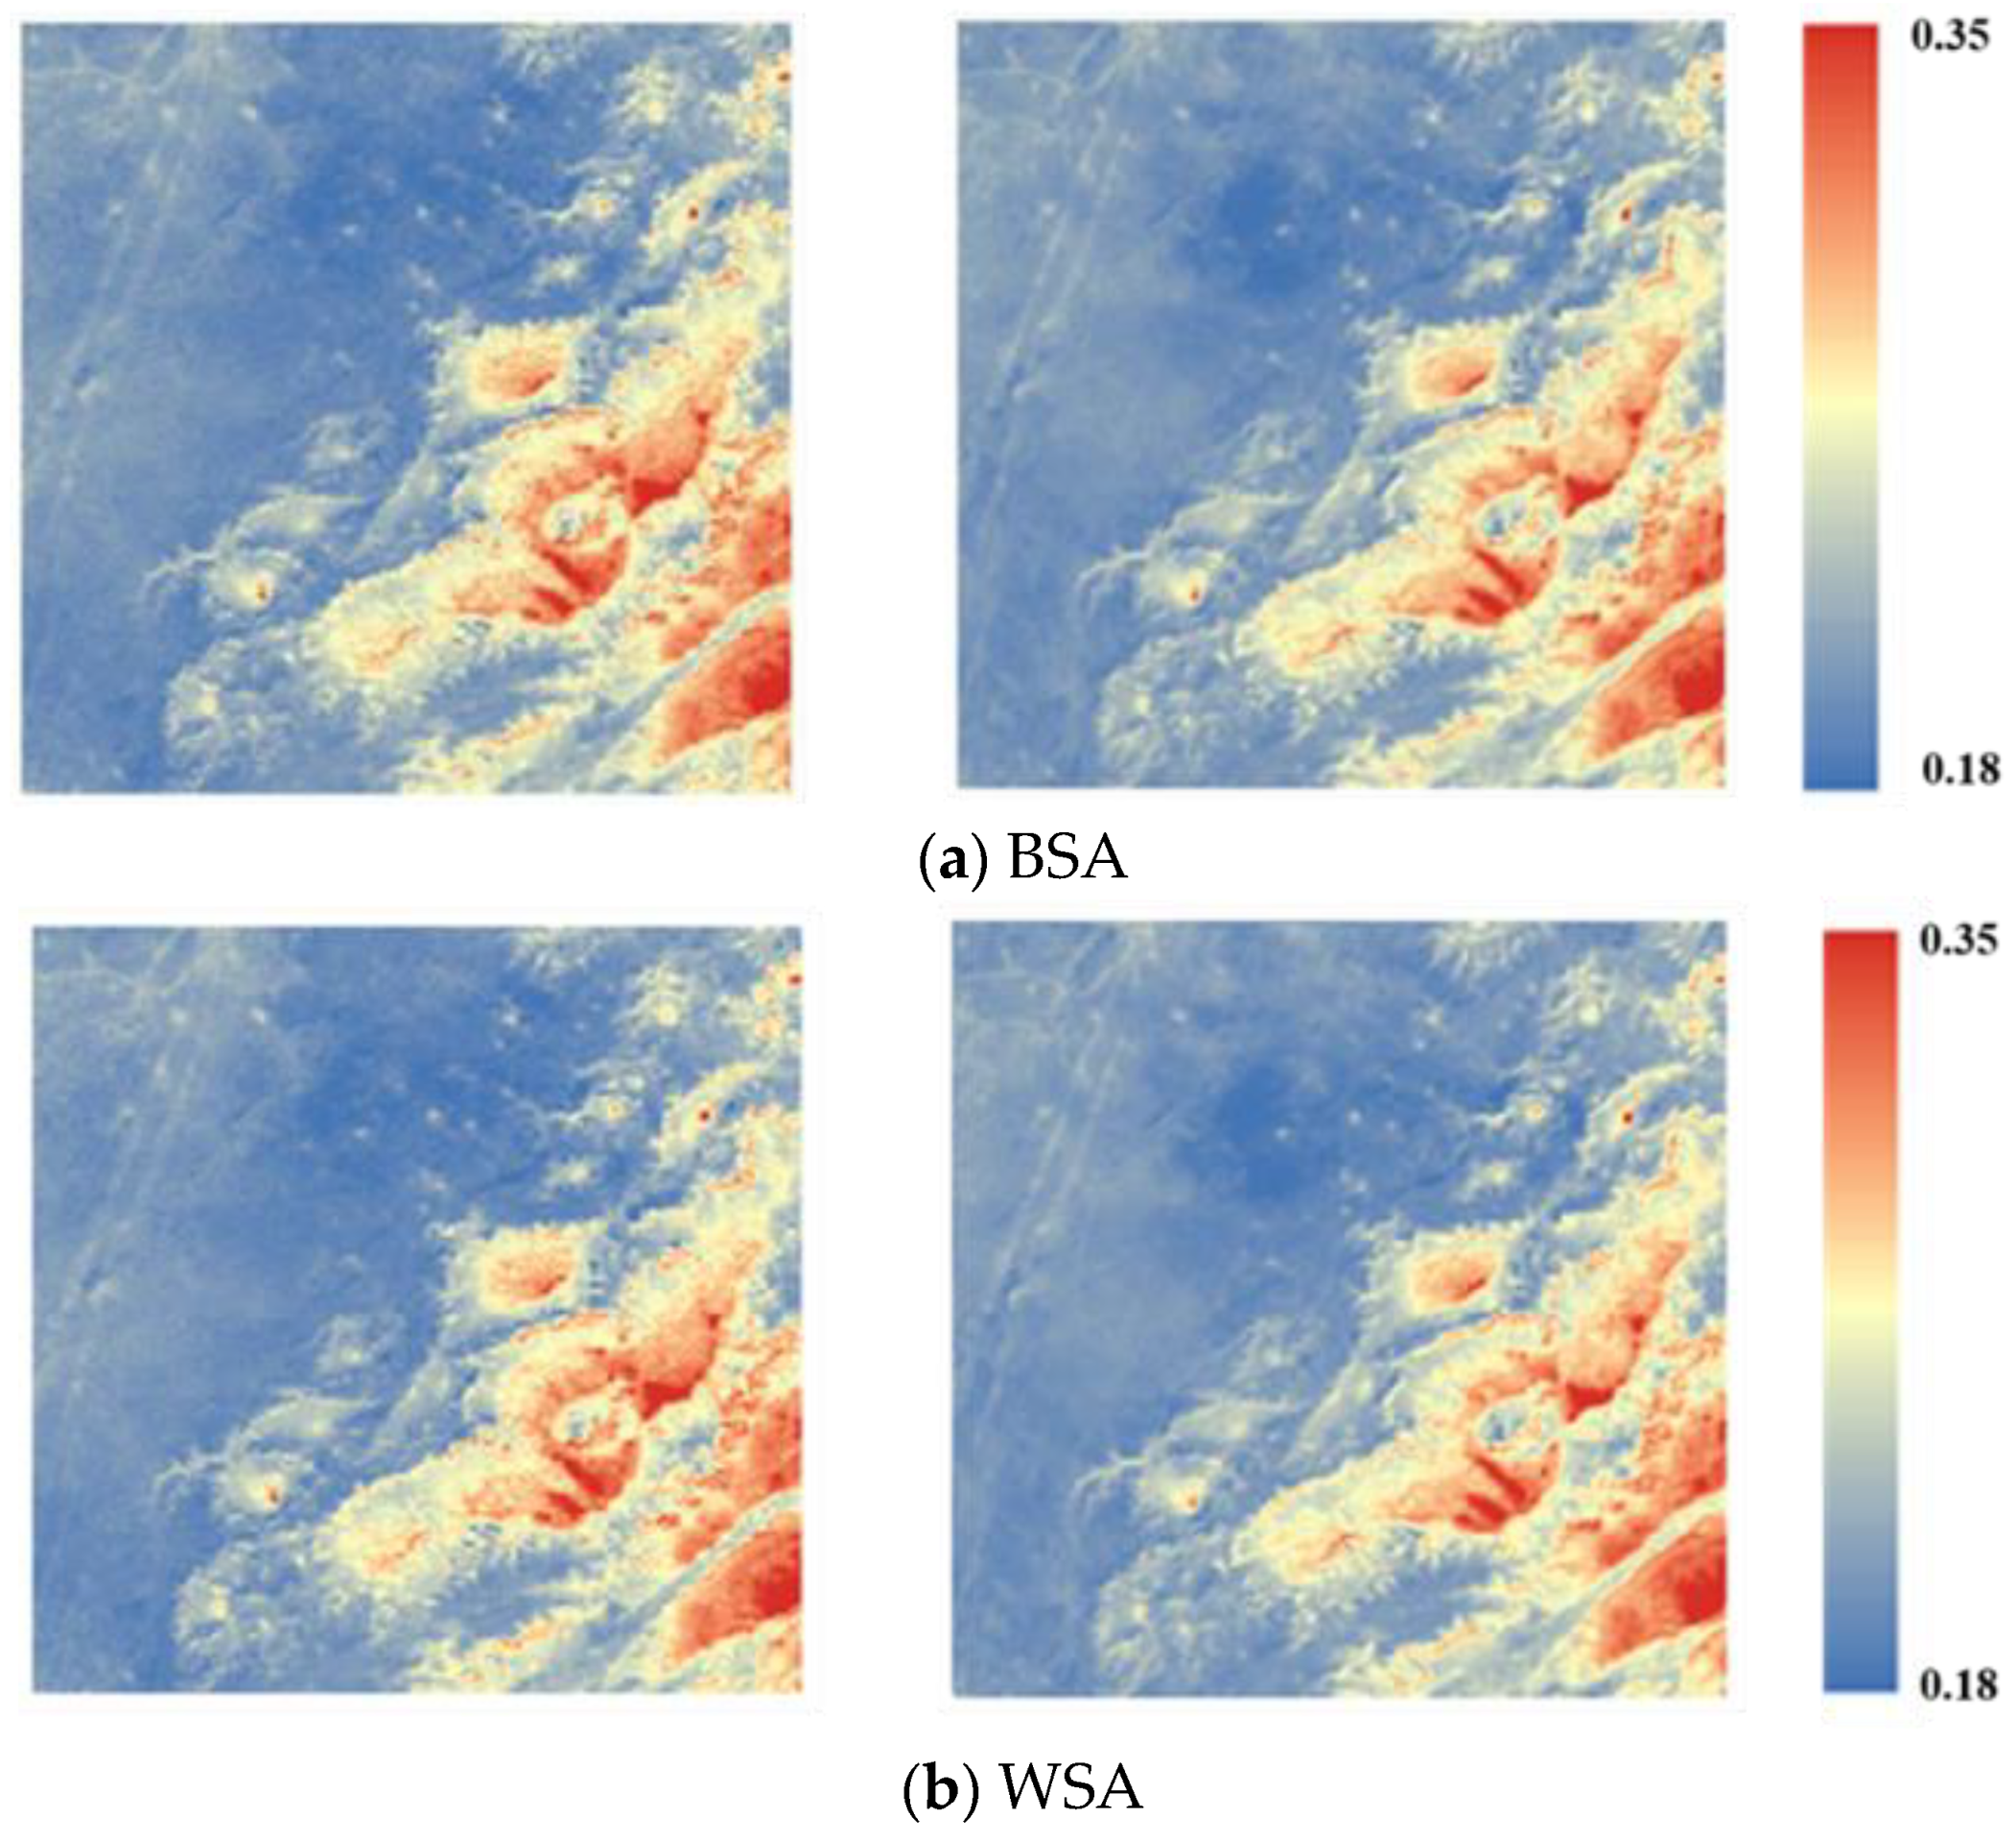
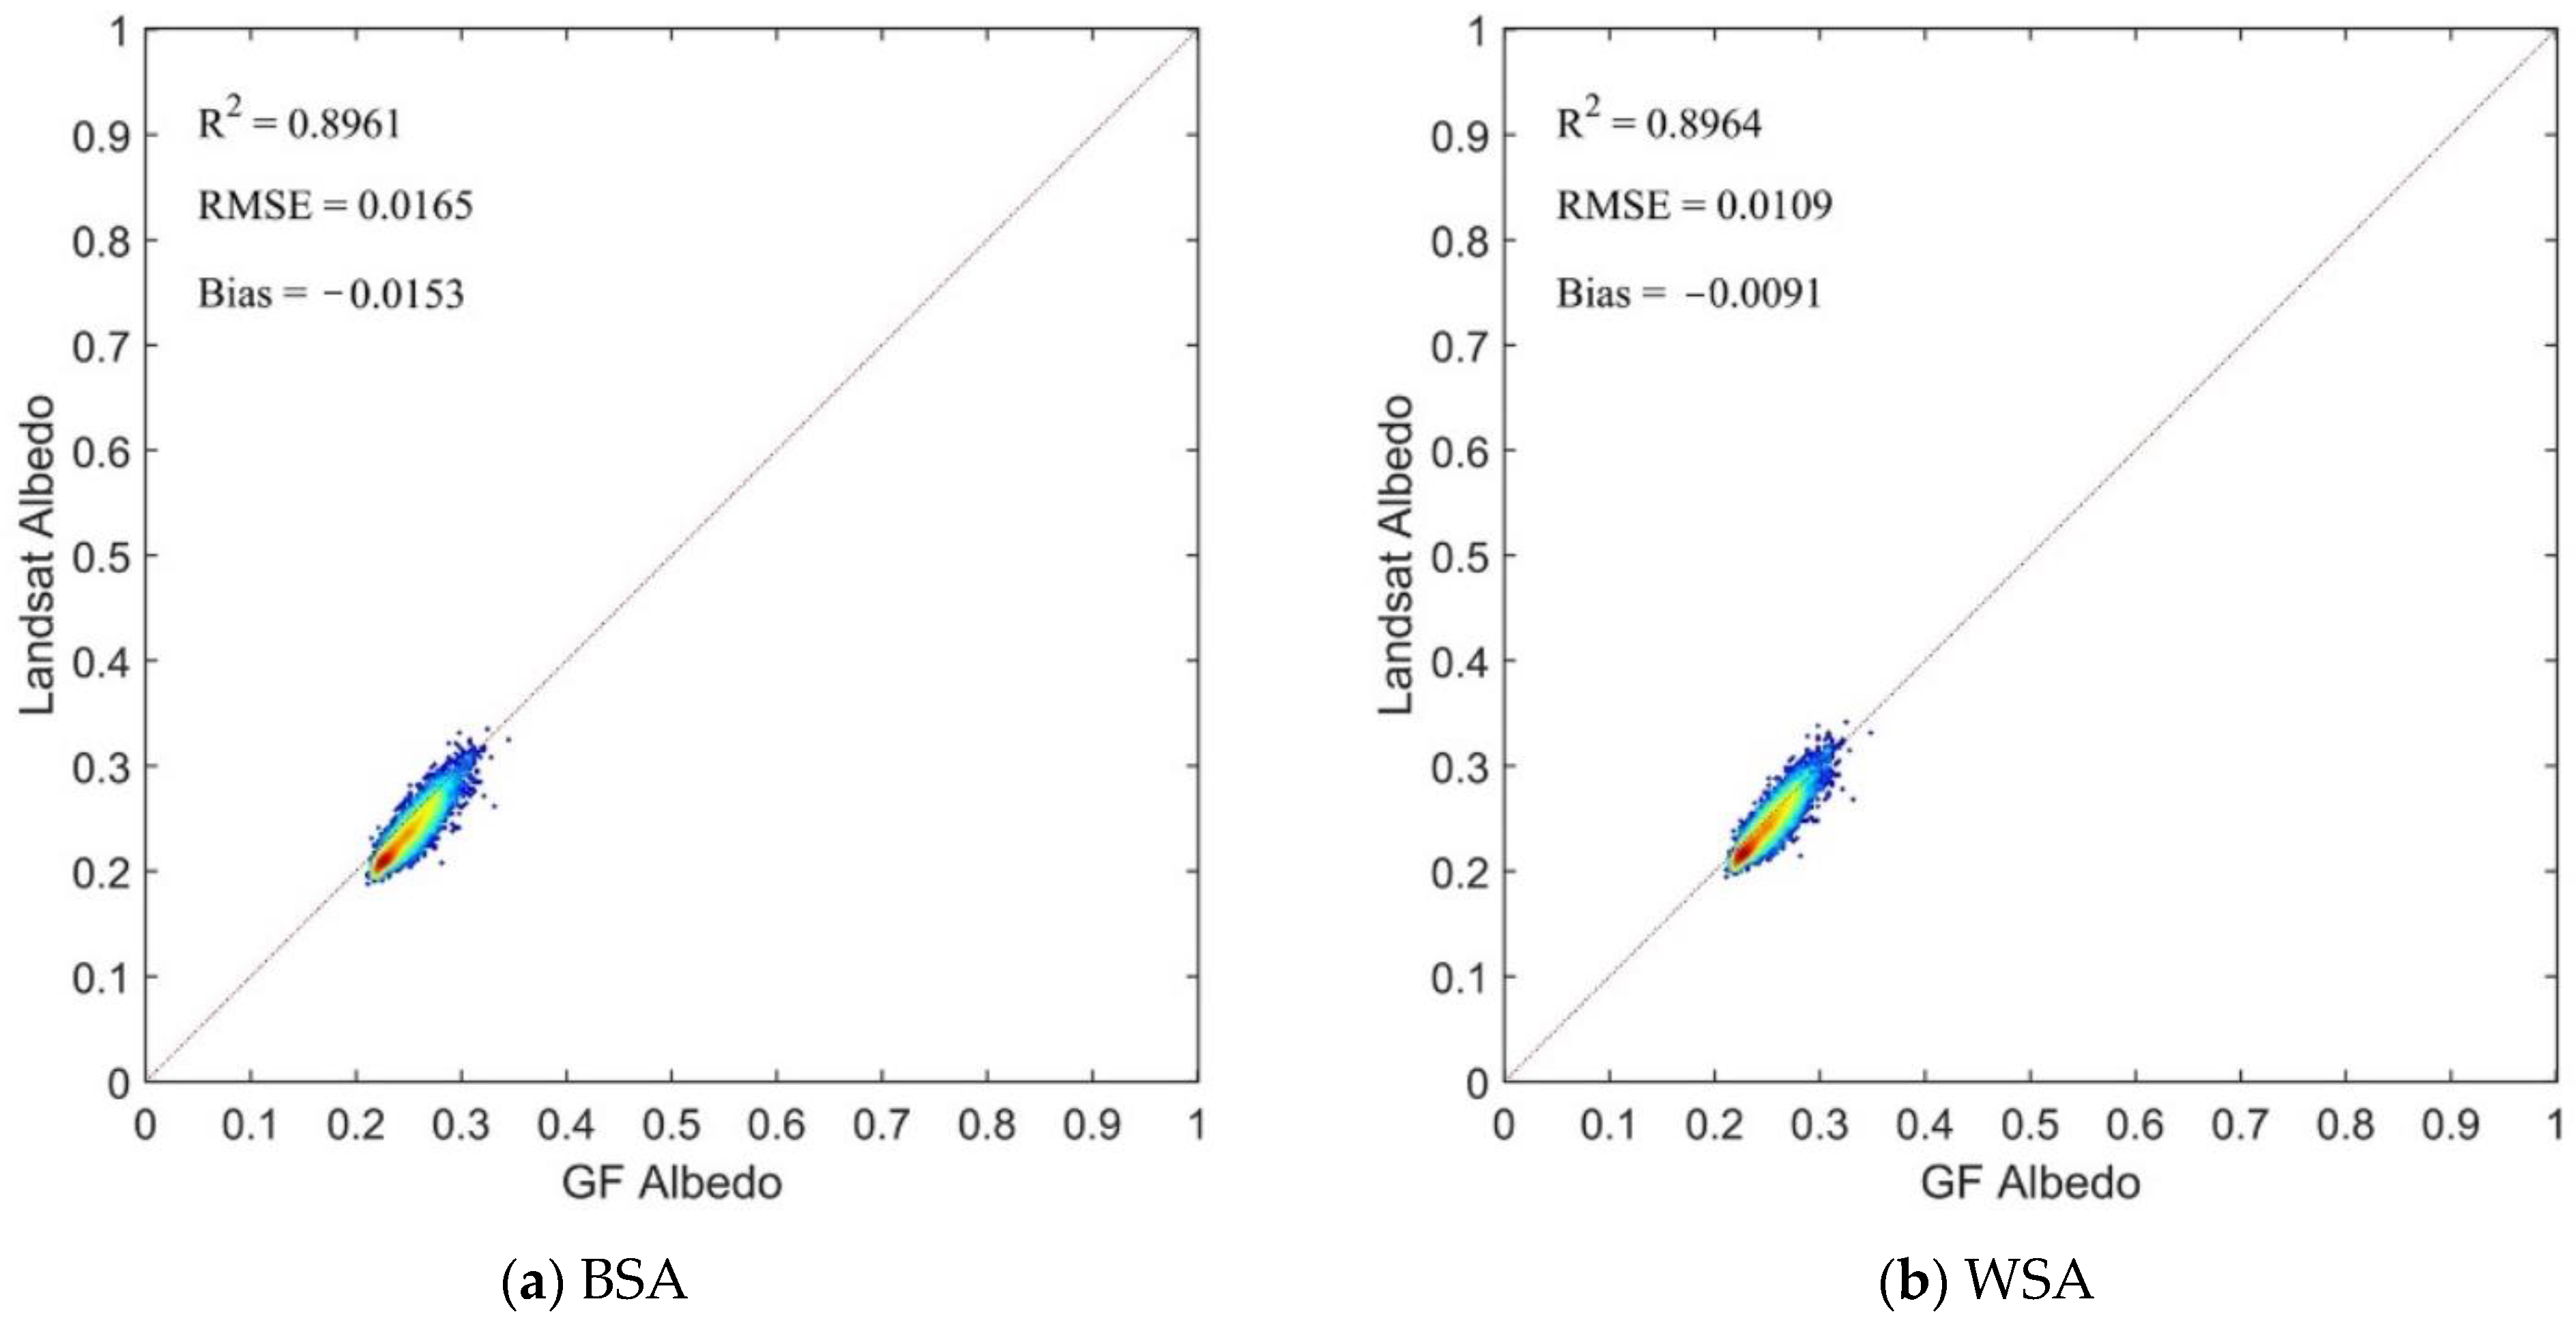
4.2.1. Study Area of Ganzhou District

We first examined the accuracy of the Landsat albedo estimation results. The albedo of Landsat-8 in this study area was summarized and compared with the ground measurements. According to the formula of blue-sky albedo in Section 3.2, we compared the blue-sky albedo of Landsat with ground measurement data. The results are shown in Figure 5. The ground measurements are in excellent agreement with the Landsat albedo, with an R2 of 0.79 and RMSE of 0.02.
The clear and cloudless GF-1 WFV and Landsat-8 data with adjacent imaging times were selected, and black-sky and white-sky albedos were estimated and compared. The GF-1 WFV was imaged on 23 February 2015 (DOY = 54), and Landsat-8 was imaged on 24 February 2015 (DOY = 55). The comparison of albedo estimation results is shown in Figure 6. Figure 7 shows that the albedo estimation results of the two sensors have a strong spatial consistency, and the scatter plot shows a higher agreement with the white-sky albedo than the black-sky albedo. This may be due to the different imaging times between the two images, resulting in different solar angles, and the solar incidence angle has a greater impact on the black-sky albedo than on the white-sky albedo.

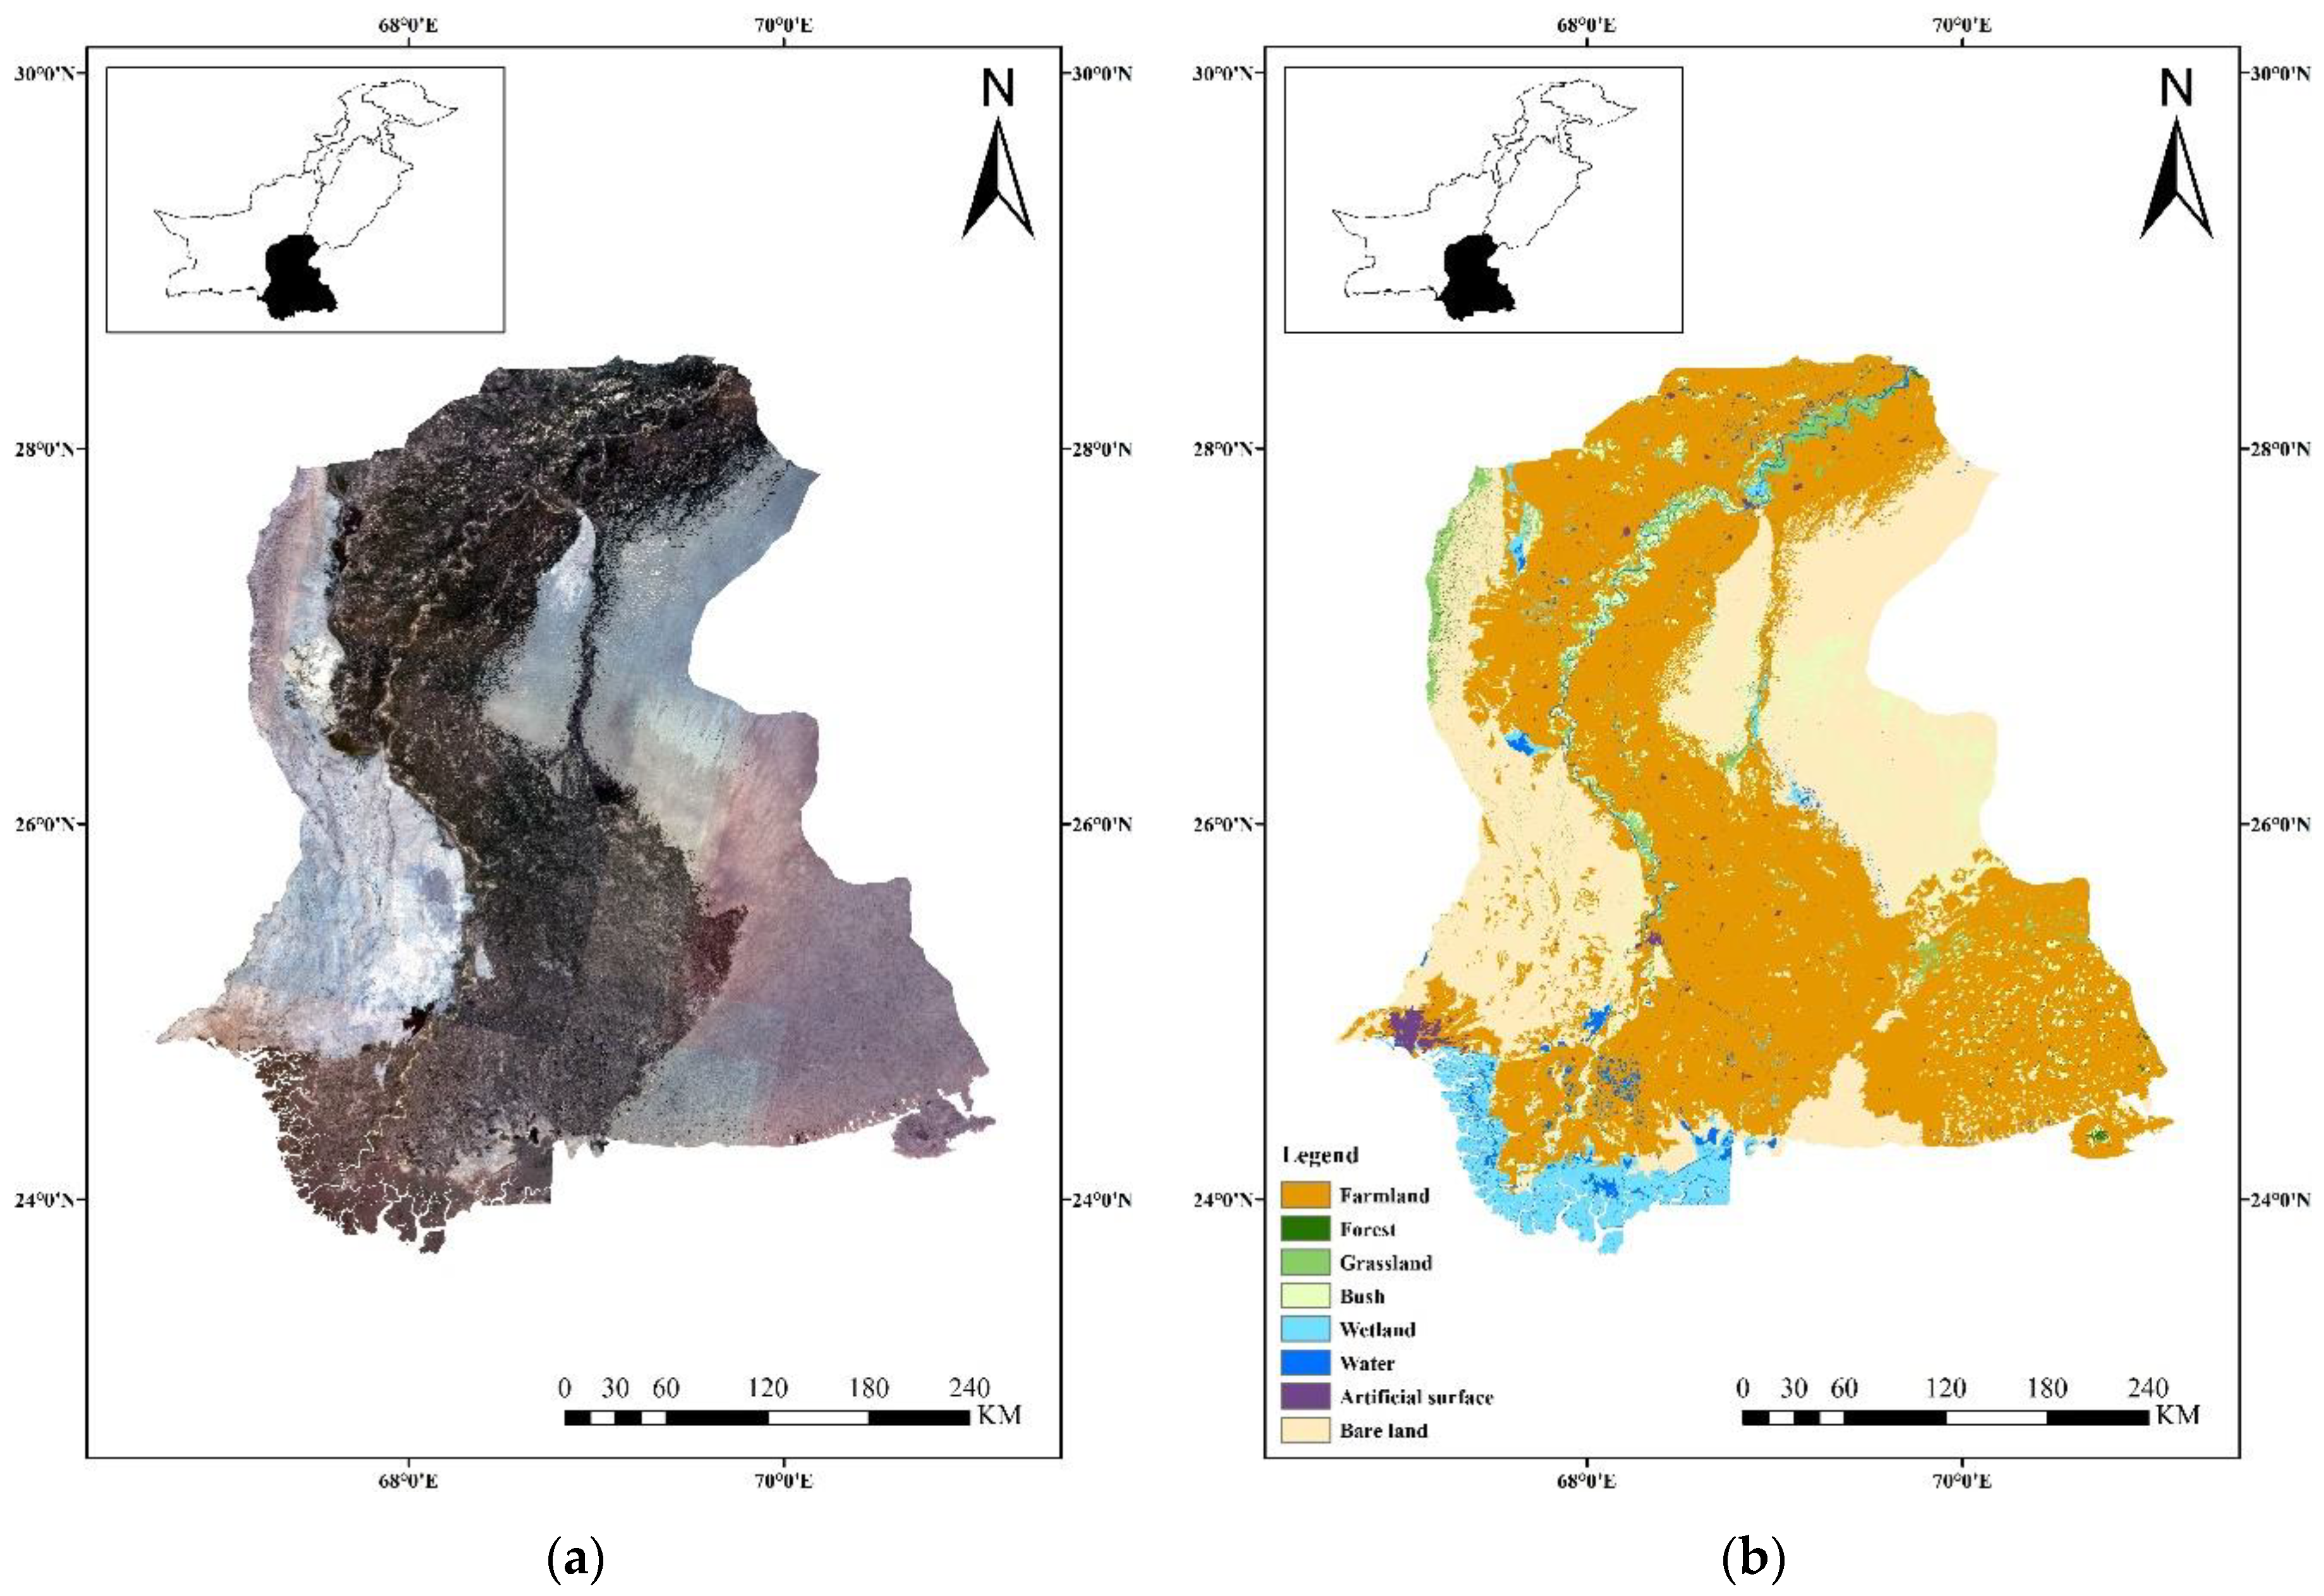
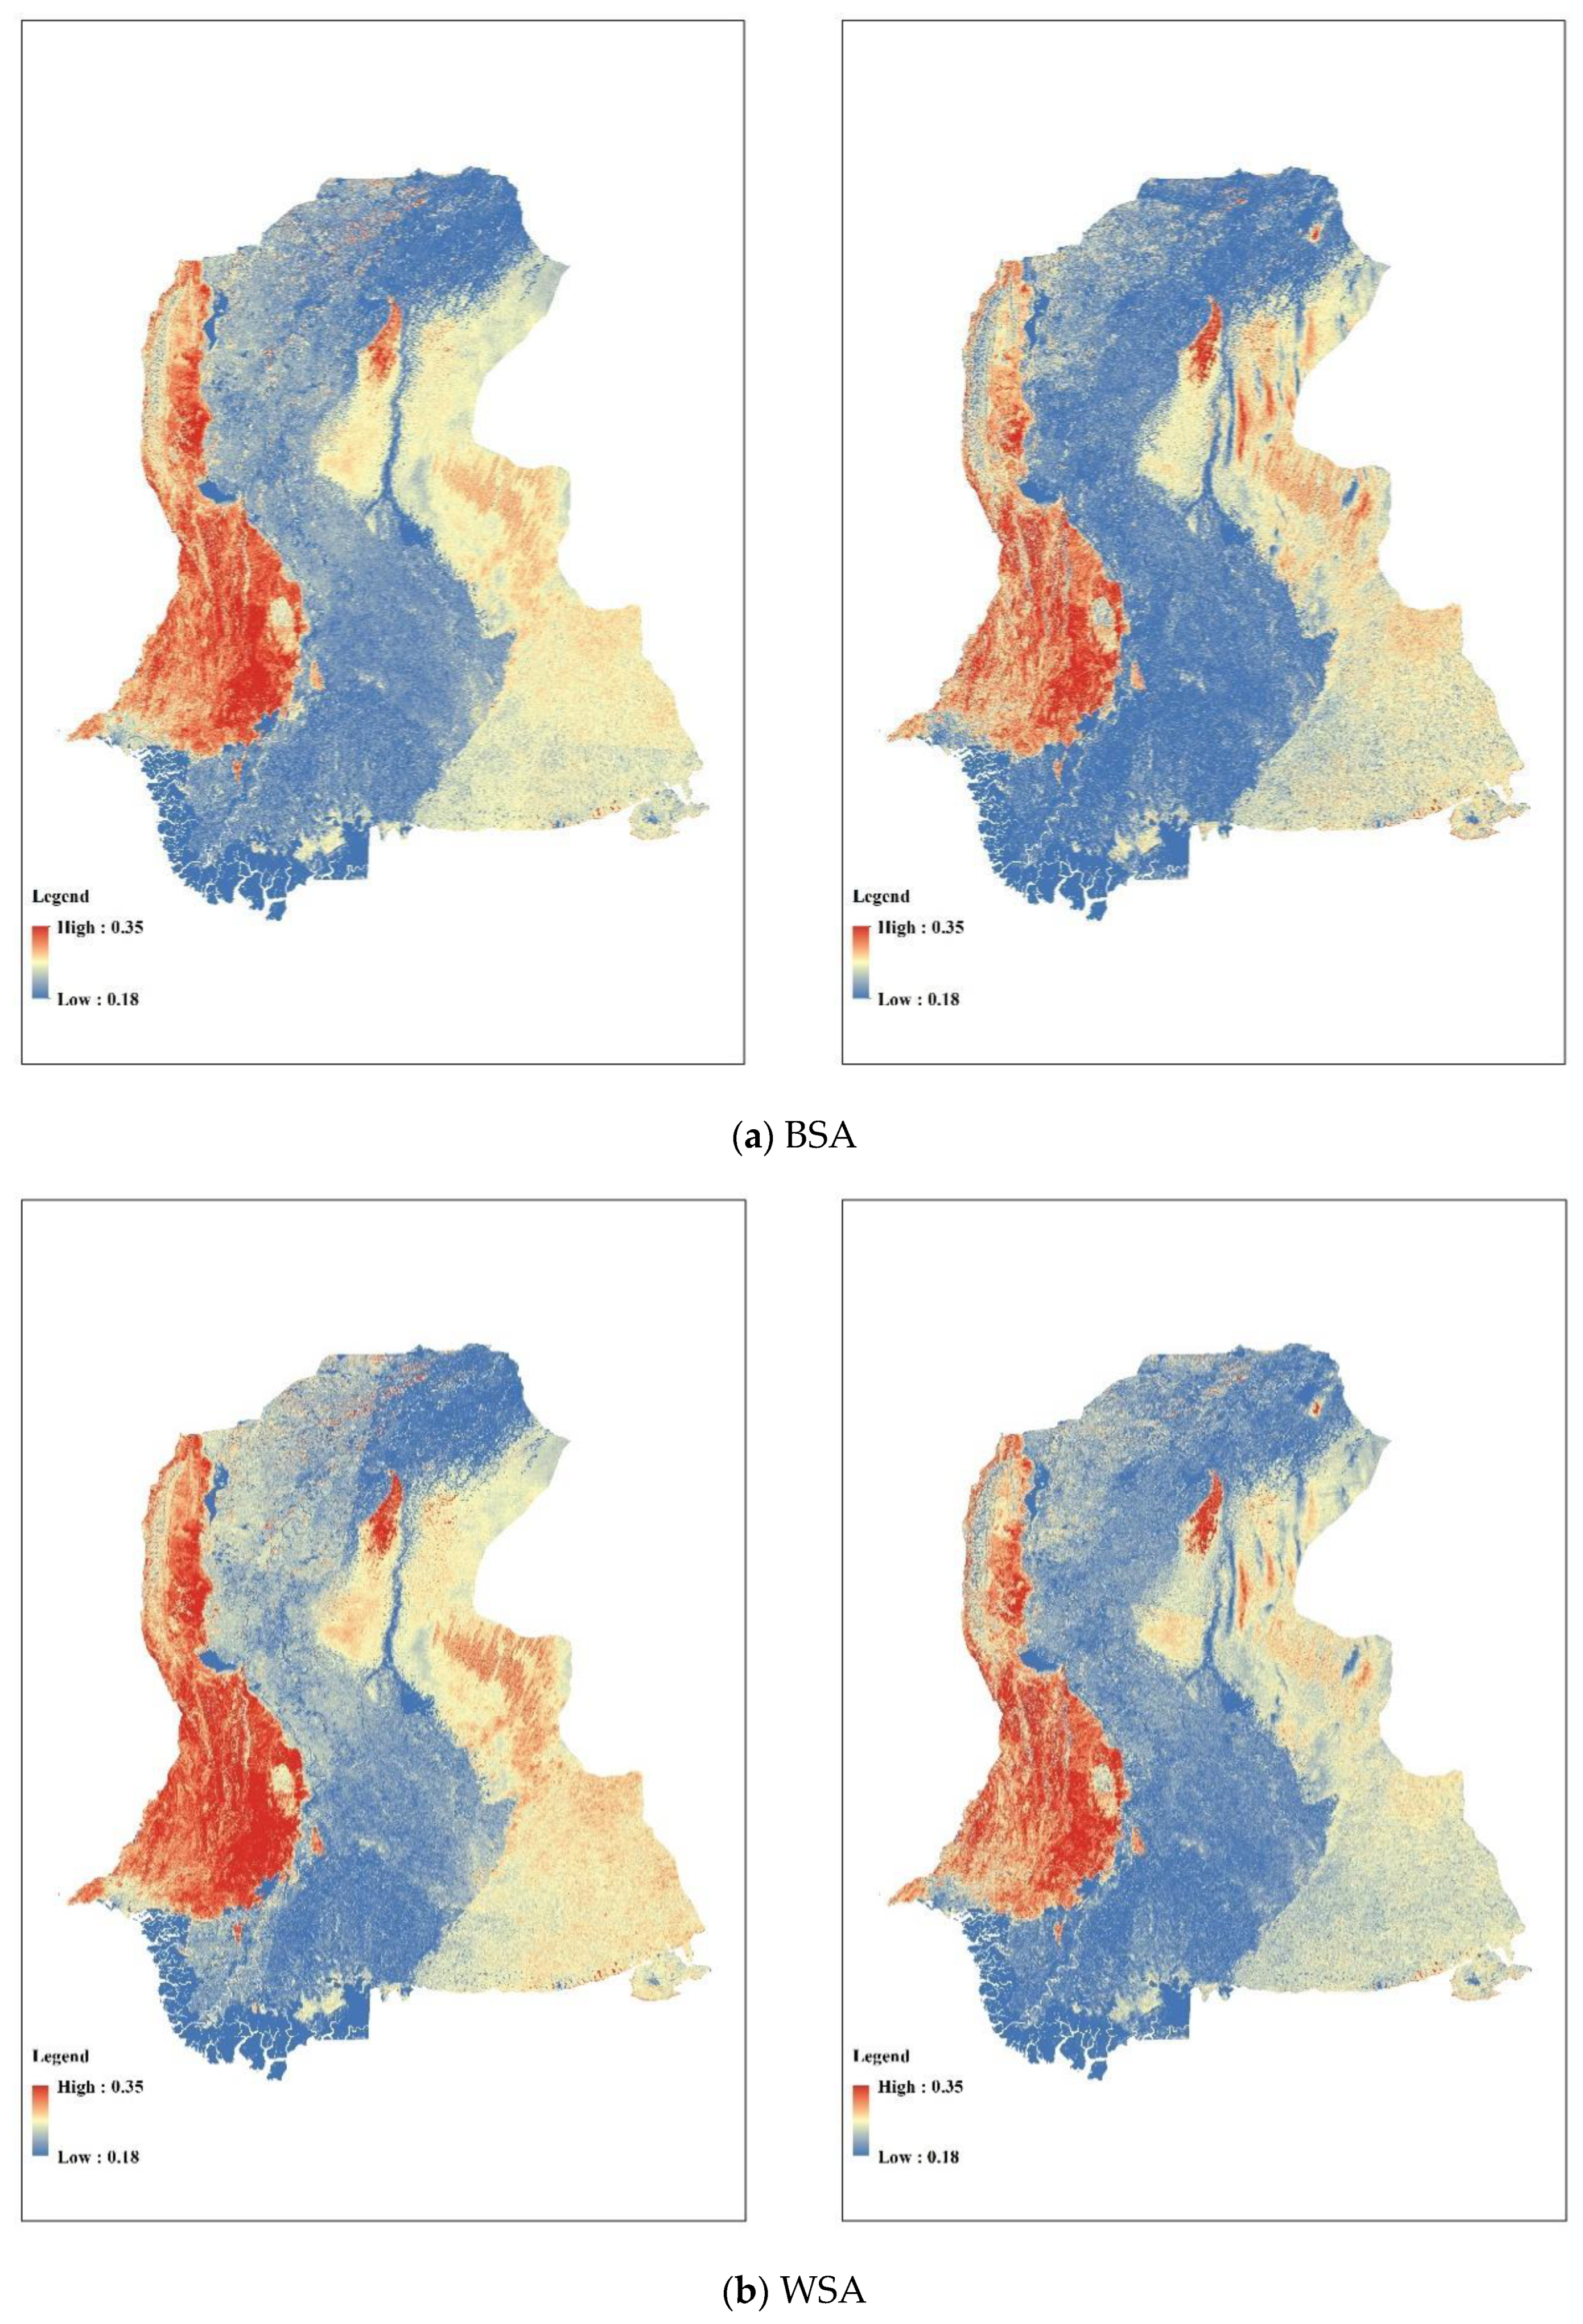
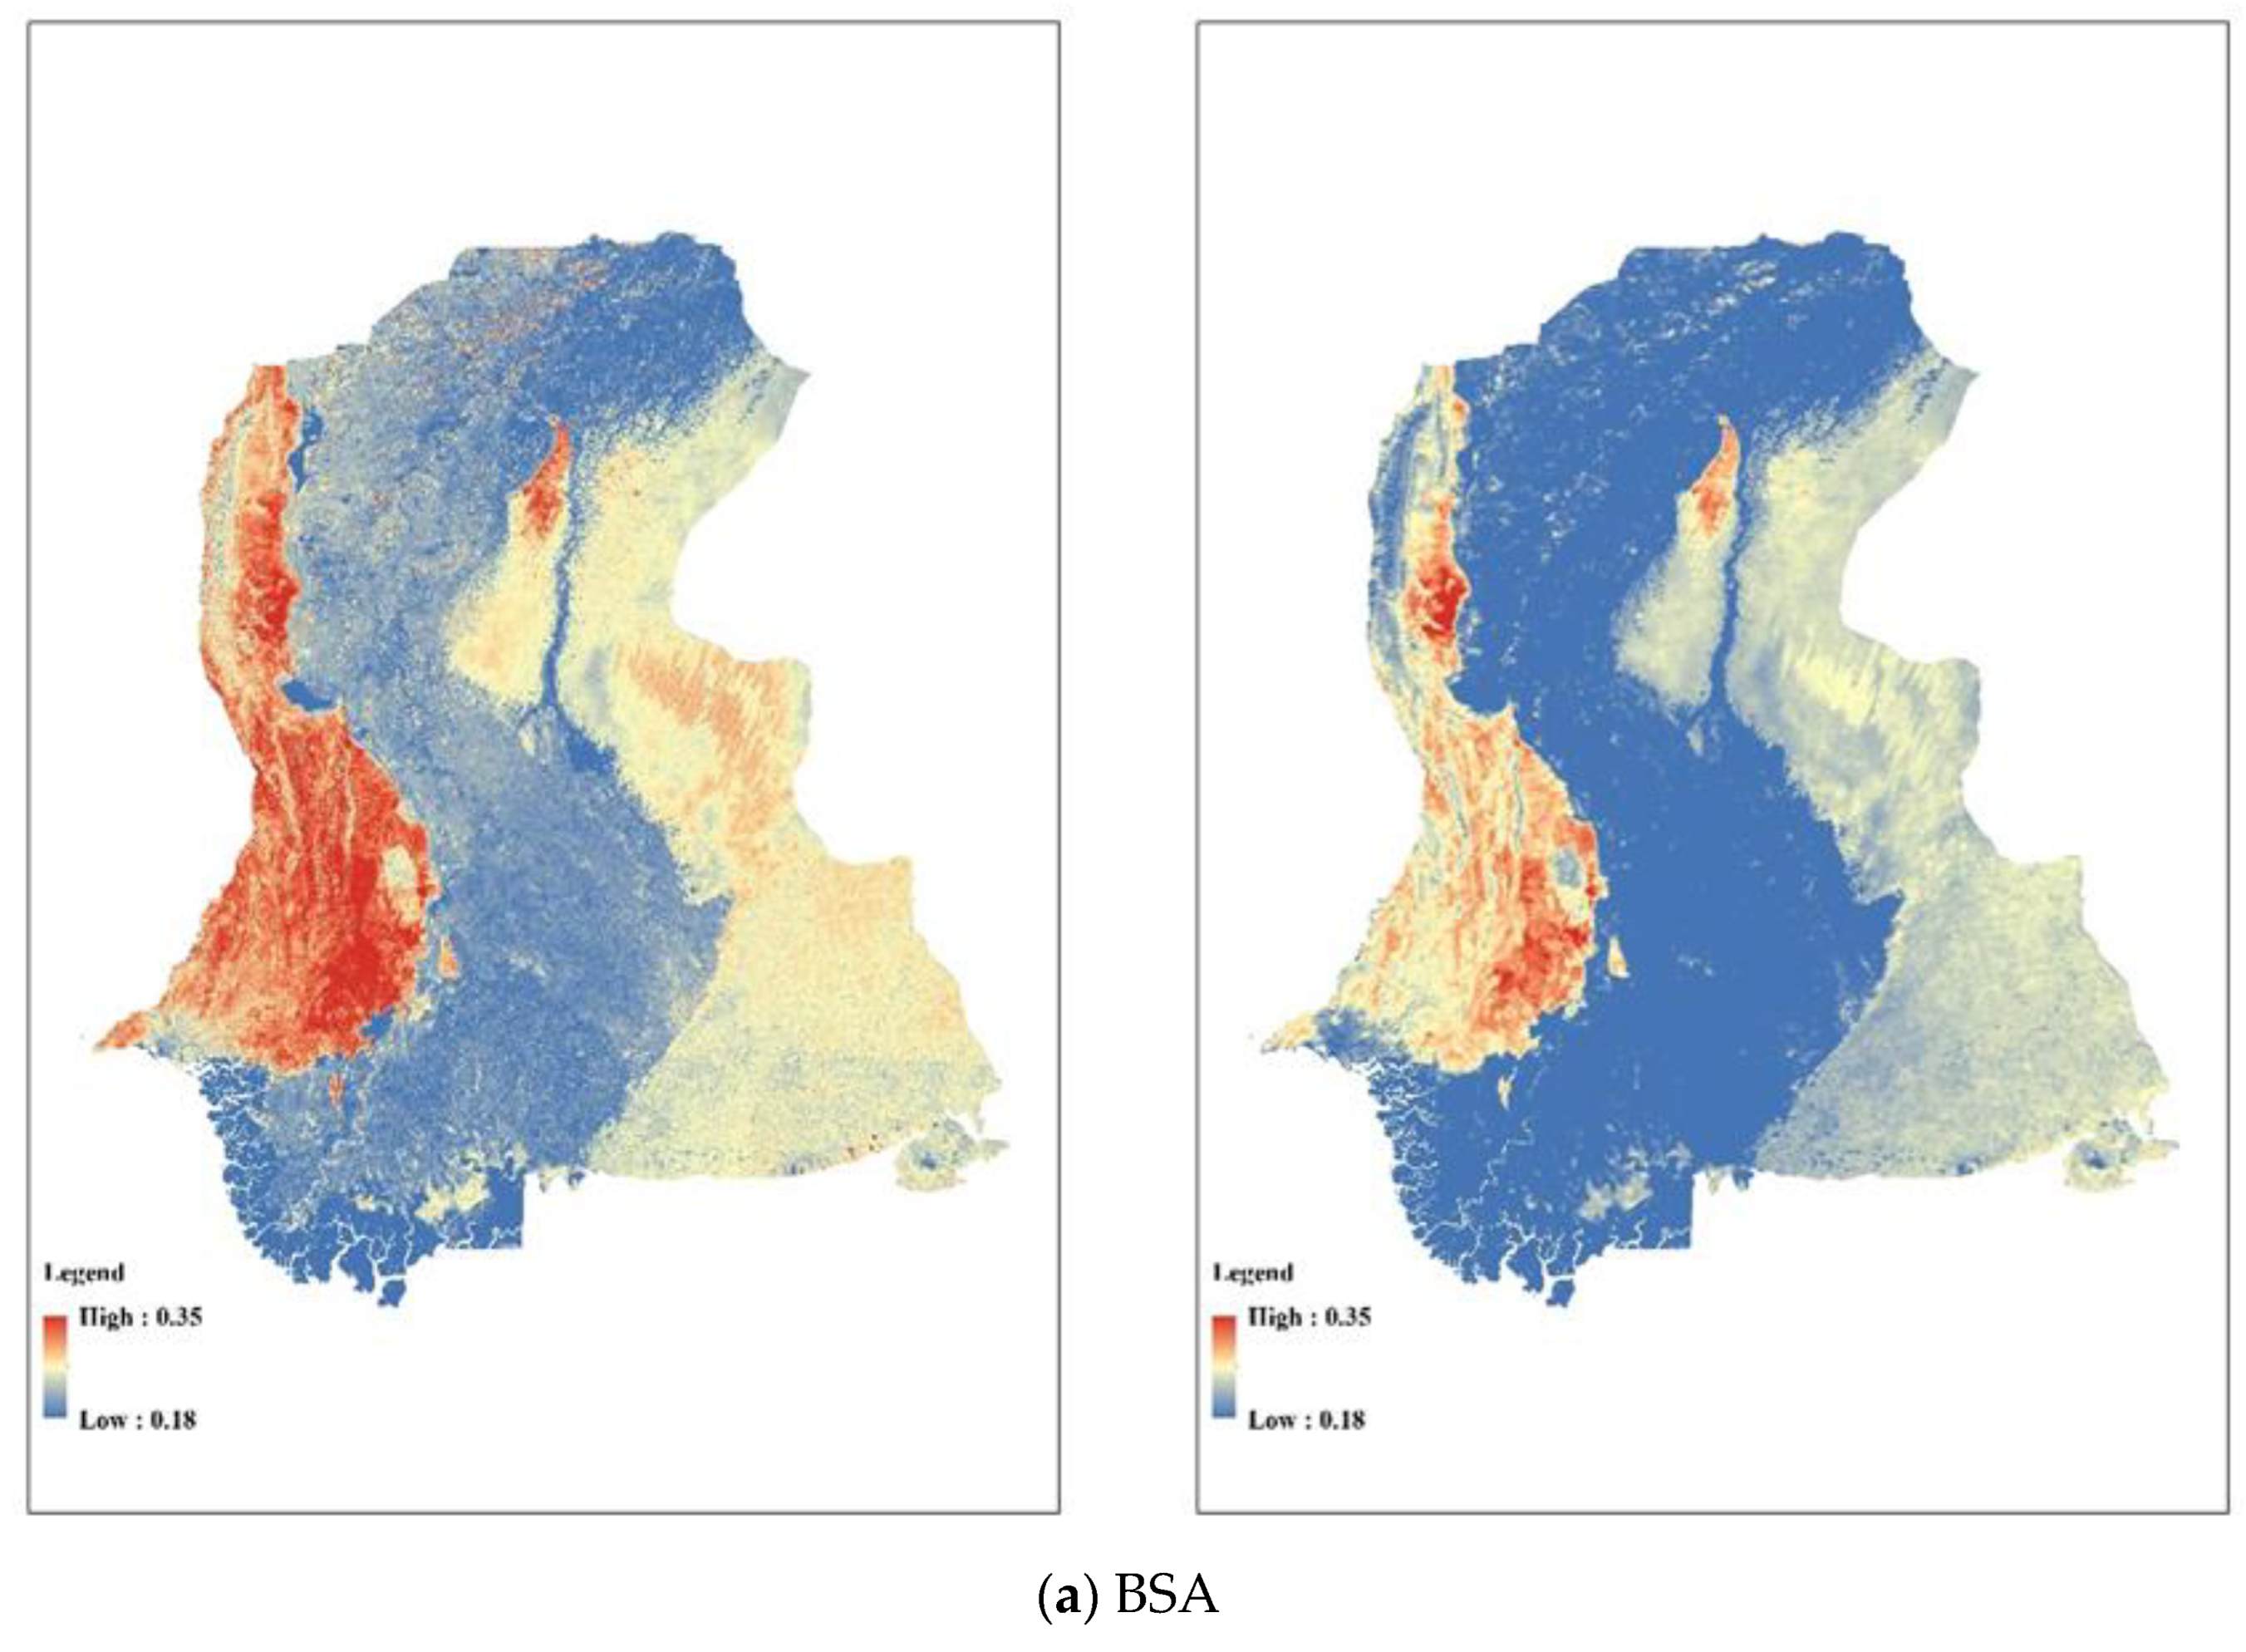
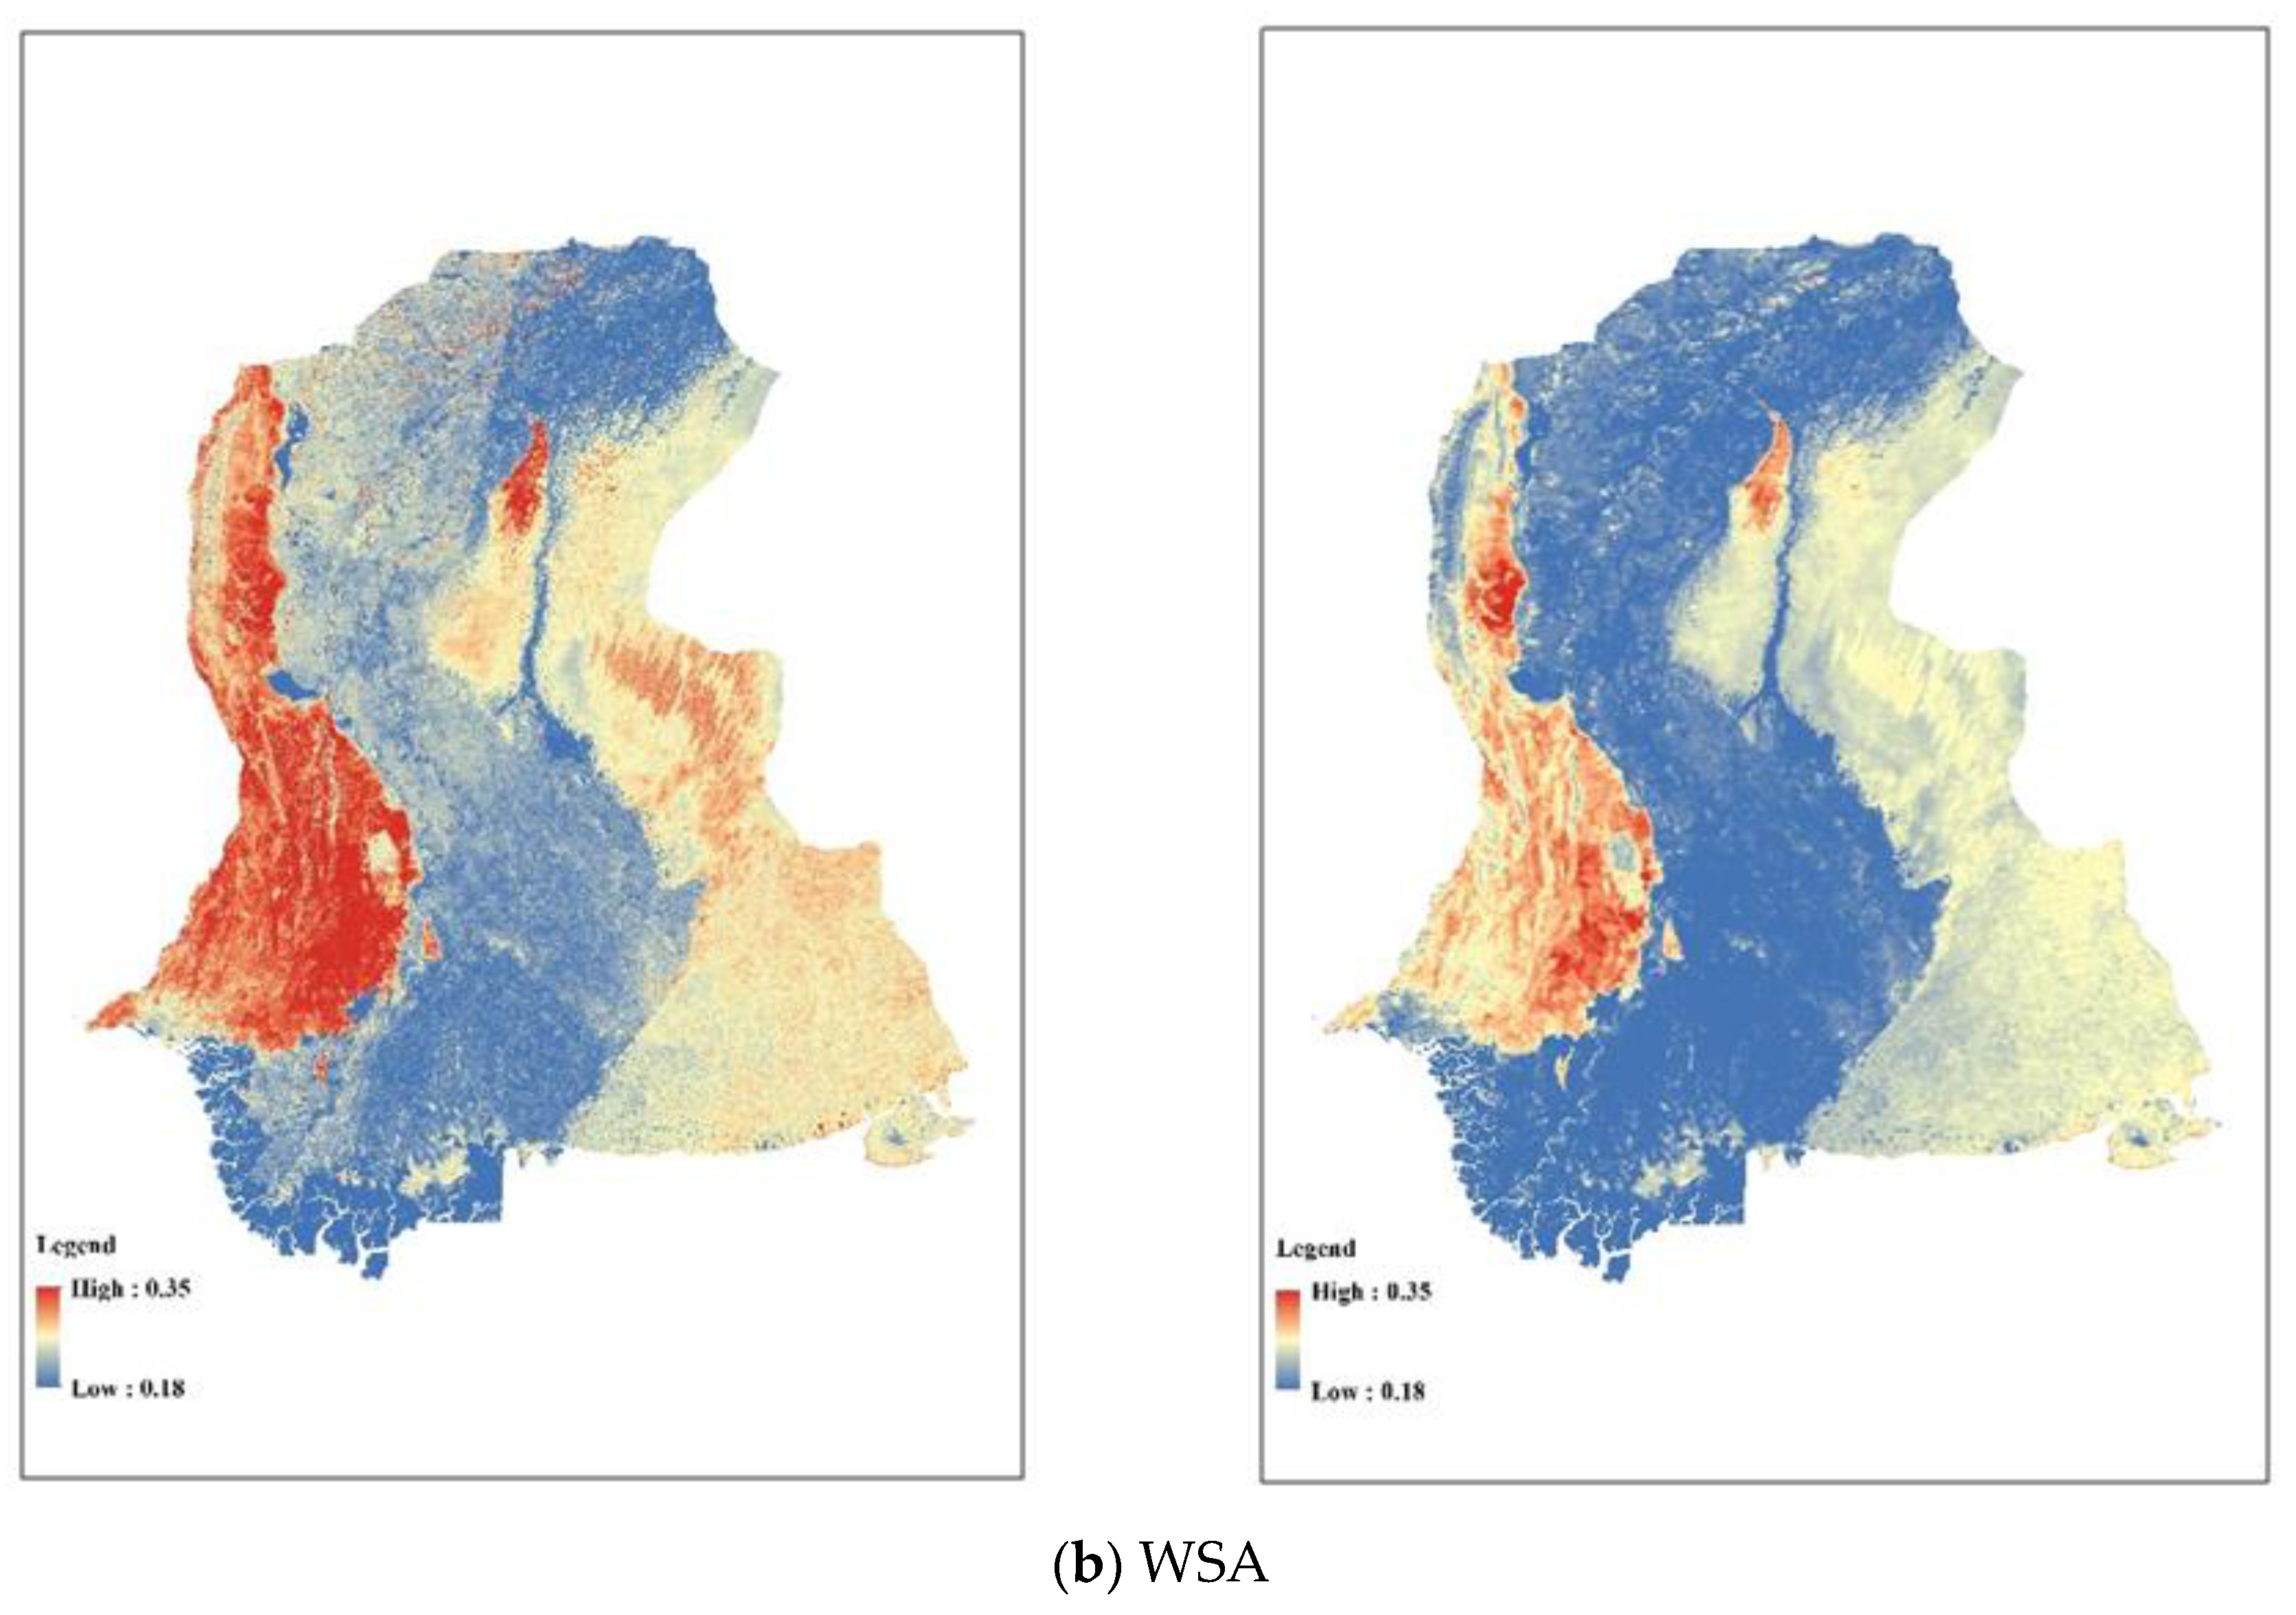
4.2.2. Study Area of Sindh Province

Since the study area of Sindh is large, remote sensing images taken on the same day cannot cover the entire study area, so cloudless images taken on similar dates were selected for mosaicking to obtain the study area. The Landsat-8 data were mosaicked from a total of 12 images of 20160202, 20160209, 20160211, and 20160216, and the GF-1 data were mosaicked from a total of 10 images of 20160207, 20160211, and 20160215. The comparison of the black-sky albedo and the white-sky albedo of the GF-1 and Landsat-8 is shown in Figure 8. The results show that the albedos of GF-1 and Landsat-8 are in good spatial agreement, and there are significant differences in albedo between different land cover types. It can be seen from the figure that the black-sky albedo and white-sky albedo of GF-1 are slightly higher than the albedo of Landsat-8, which may be related to the different imaging dates of the two.
The scatter plot of the black-sky albedo and white-sky albedo comparison of the GF-1 WFV and Landsat-8 is shown in Figure 9. From the figure, it is clear that the black-sky albedo and white-sky albedo agree well: the RMSE of the black-sky albedo is 0.028, and the R2 is 0.891; the RMSE of the white-sky albedo is 0.028, and the R2 is 0.889.

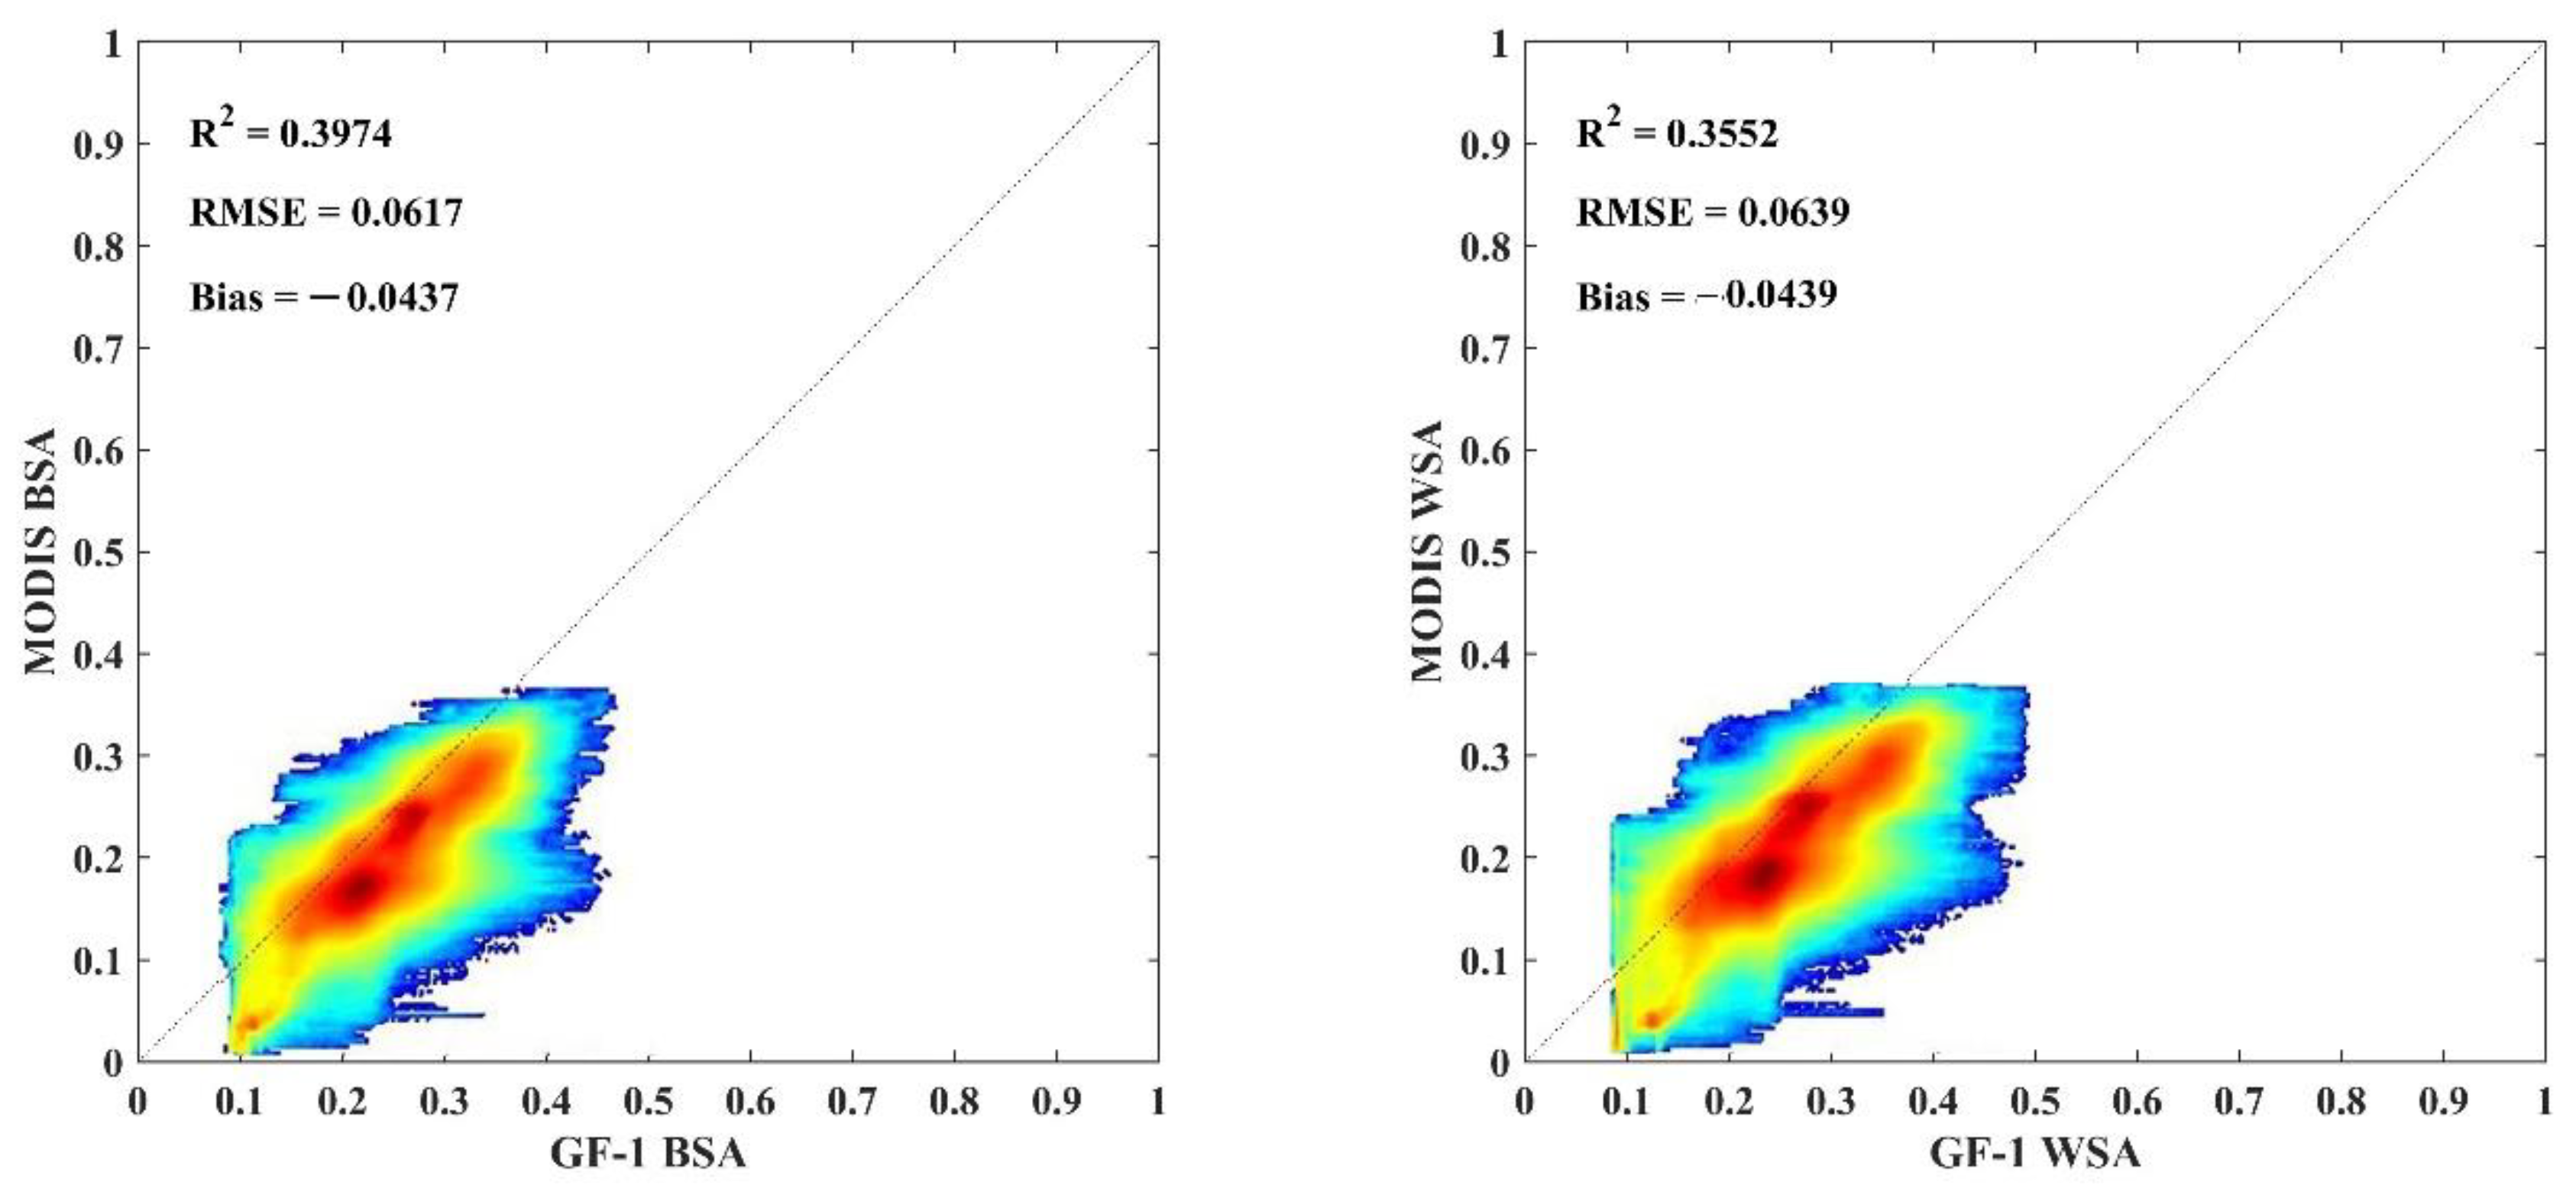
4.3. Validation against MODIS Product

The albedo comparison results obtained based on the 2016042 (11 February 2016) product of MCD43A3 and the GF-1 image (mosaicked from 20160207, 20160211, and 20160215) are shown in Figure 10. The albedo of the GF-1 is higher than that of the MODIS albedo product, probably because the MODIS albedo product is generated based on the time synthesis method. The values of the MODIS albedo products represent the main surface conditions within a 16-day synthetic window under clear sky conditions.
Figure 11 is a scatter plot of a pixel-by-pixel albedo comparison. The GF-1 albedo estimation results are in excellent agreement with those of the MCD43A3 albedo product. The RMSE and R2 of the black-sky albedo are 0.046 and 0.843, respectively; the RMSE and R2 of the white-sky albedo are 0.050 and 0.807, respectively. The agreement between the GF-1 albedo and MCD43A3 albedo products is less than the agreement between the GF-1 and Landsat-8 albedo. This may be because the spatial and temporal resolution of the MCD43A3 is different from that of the GF-1 WFV, which has a temporal resolution of 16 days and a spatial resolution of 500 m, while the GF-1 WFV has a temporal resolution of 2 days and a spatial resolution of 16 m. Since their albedos cannot be compared directly due to different resolutions, the albedo of GF-1 was spatially aggregated to obtain the resolution of the MODIS and then validated. The process of spatial aggregation leads to errors.

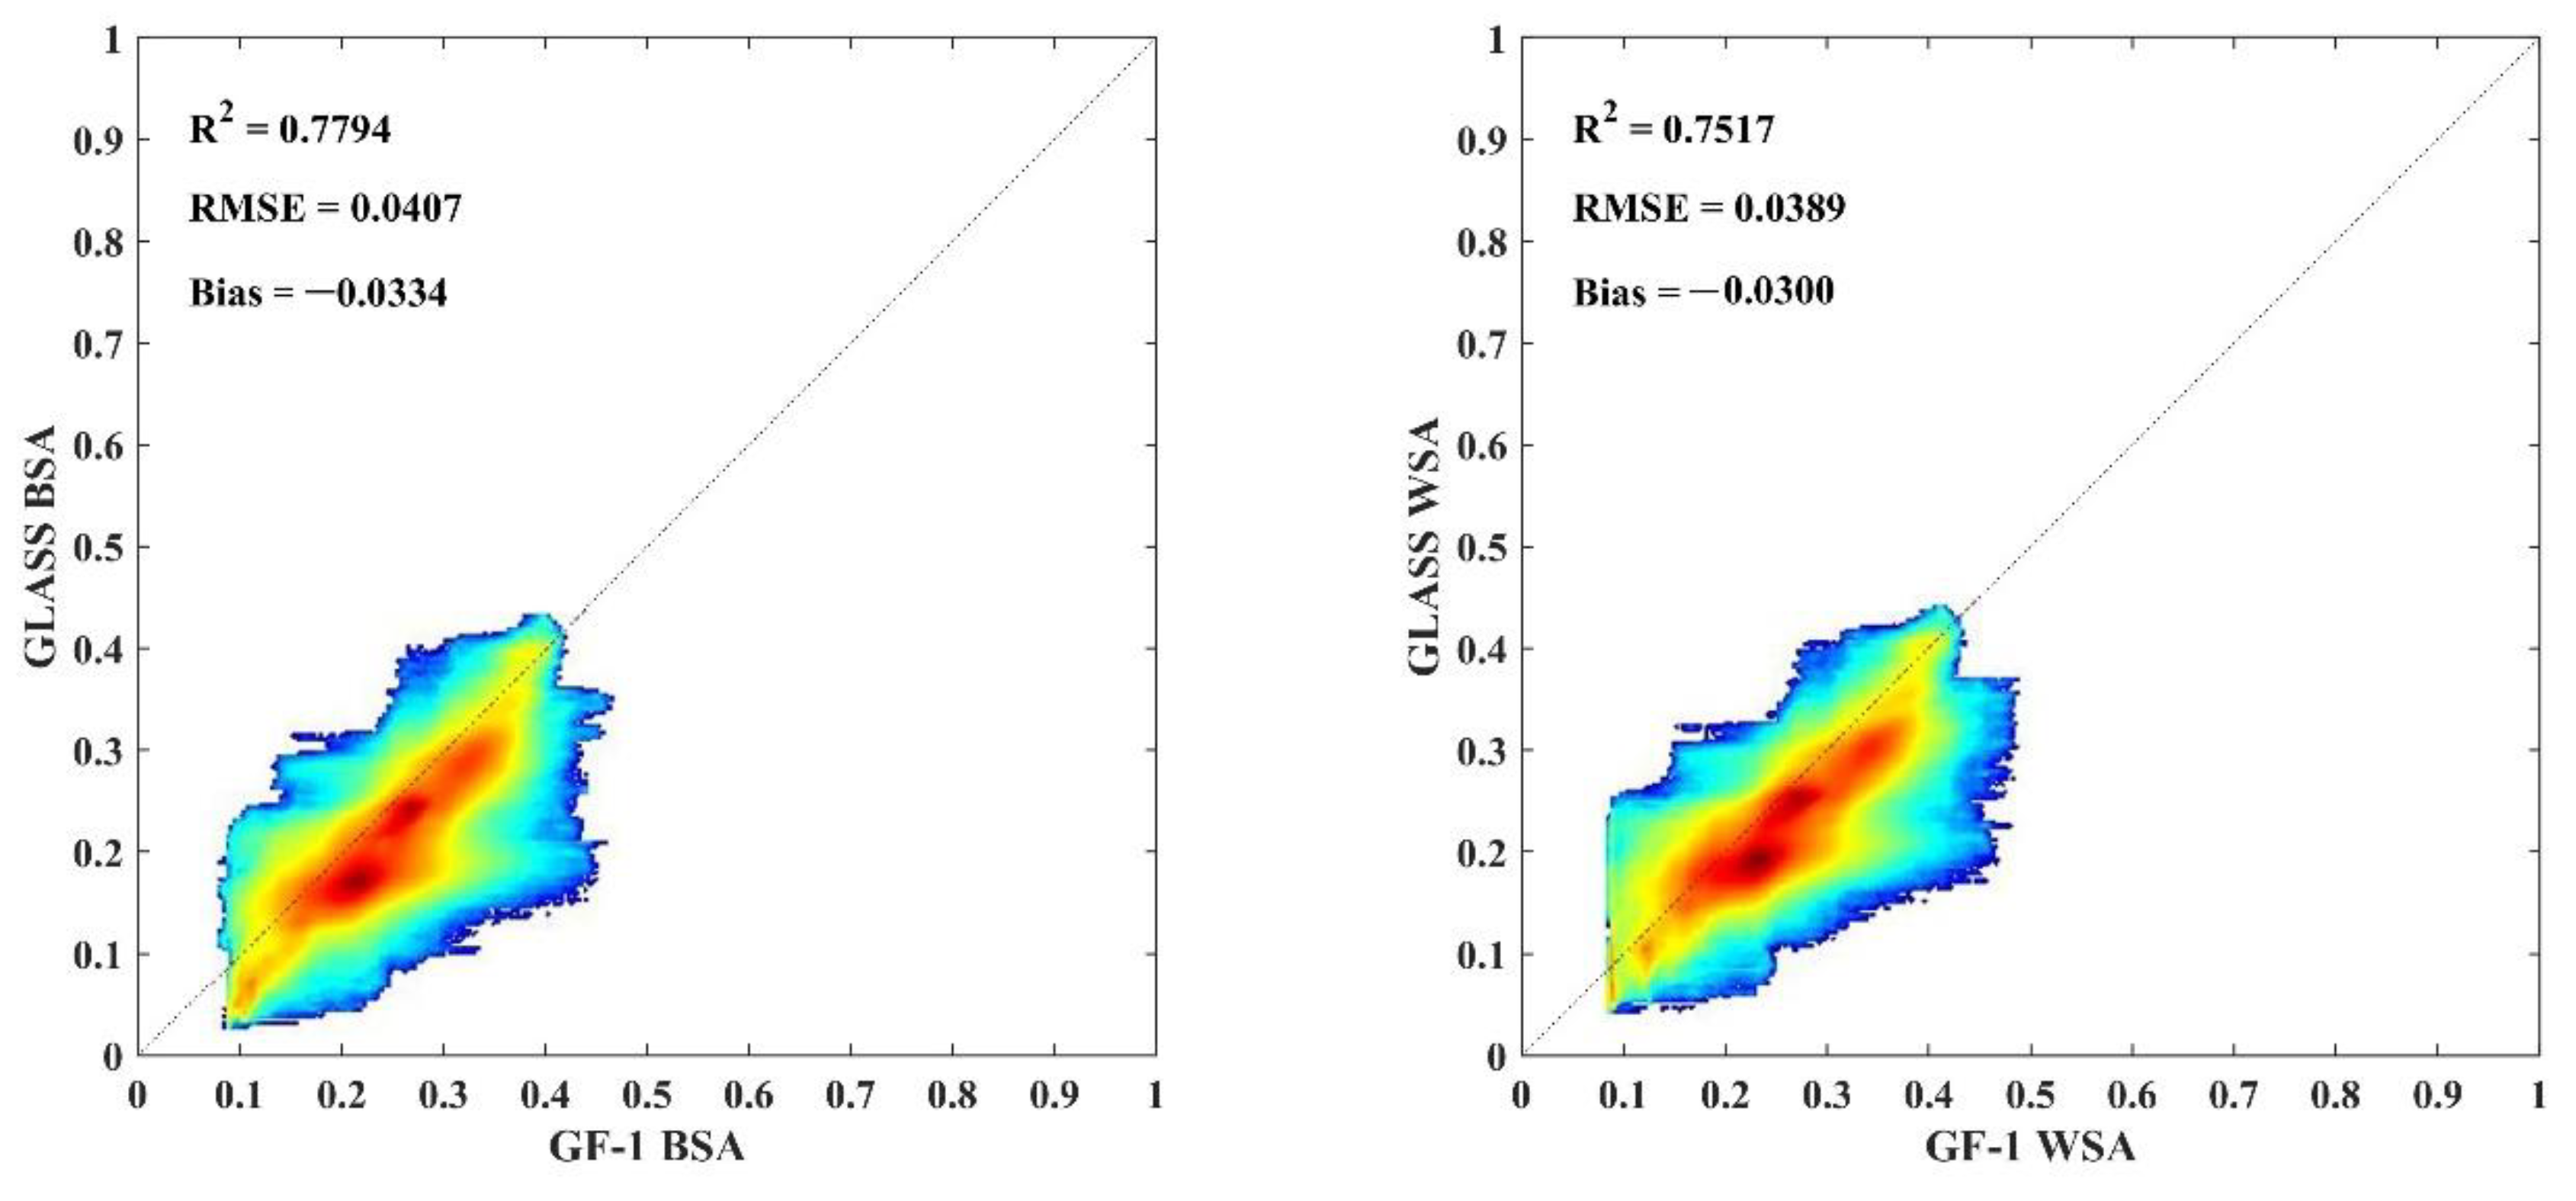
4.4. Validation against GLASS Product

GLASS02A01 of the GLASS product was selected for comparison with the GF-1 albedo. The albedo results obtained based on the 2016045 (14 February 2016) product of GLASS02A01 and the GF-1 image are shown in Figure 12. We find that the albedo of GF-1 is higher than that of the GLASS product, which is probably because GLASS02A01 is a synthetic product obtained by averaging the GLASS02A21 product over 17 days.
Figure 13 is a scatter plot of a pixel-by-pixel albedo comparison. The albedos of GF-1 and GLASS are consistent, with the RMSE and R2 values of the black-sky albedo being 0.041 and 0.779 and the RMSE and R2 values of the white-sky albedo being 0.039 and 0.752, respectively. However, there are still errors between their albedos, which may be related to their different spatial and temporal resolutions.

5. Discussion

In this paper, we used the direct estimation method to estimate the LSA of GF-1, and the estimation results still had errors in the validation process. We identified possible sources of the errors through further research.

5.1. Errors Induced by Land Cover Types

Due to the difference in vegetation and soil composition, the uncertainty of surface albedo verifications will be affected by surface heterogeneity. From the validation results, the albedo accuracy of grasslands and farmlands is better than that of deserts, which may be related to spatial heterogeneity. Though in this study, only pixels located in the observation area are aggregated and used to validate remote sensing estimation, the heterogeneity of the site will affect the representativeness of the field site and induce more uncertainties in the albedo estimation and validation, and the poor spatial homogeneity of some sites leads to increased errors in the surface albedo estimation results [42,43,44,45]. The study by Cescatti et al. [46] found that albedo estimation errors were small for farmland and grassland areas, while errors were large for desert areas. We believe that this error is related to the vegetation cover. The results of this study are very consistent with previous studies that used the HJ satellite to estimate the albedo [28]. The results showed that the forest had the smallest bias and RMSE. As the vegetation cover decreases, the surface albedo gradually increases, and its bias and RMSE increase.

5.2. The Effect of Aerosol Types

Aerosol scattering is the main atmospheric factor affecting visible light radiation. The default “continental” aerosol type used in this study may lead to overestimation of the albedo. In [25], He changed the default “continental” aerosol at the sites to “Biomass Burning” and “Urban” aerosol and found that the accuracy of the albedo estimates at the sites changed. Liang et al. [47] suggested that albedo estimations in non-desert areas could be improved by using accurate aerosol type maps.

5.3. Errors Induced by the Radiation Calibration

The correction factor of the GF-1 satellite is updated annually, and we used the current year’s correction factor when calculating the albedo for different years. The calibration accuracy of the GF-1 WFV sensor may also be a major factor in the increased uncertainty of the albedo estimations. For consistency and calibration accuracy between satellite sensors, the study of Feng [48] shows that the radiometric calibration accuracy of high-resolution satellites needs to be further improved. To improve the estimation of surface albedo, it is feasible to refine the radiometric calibration.

6. Conclusions

In this study, the direct estimation method was used to estimate the LSA, and the estimation results were cross-validated using different data. Albedo estimations were carried out in the Ganzhou District and Sindh Province study areas. The albedo estimation results of the GF-1 were cross-validated with field observation data, Landsat-8 albedo estimation results, MODIS albedo products, and GLASS albedo products. The results show that the surface albedo data estimated based on the GF-1 WFV have a high accuracy. Compared with the field observation data, the RMSEs of grasslands, deserts, wetlands, and farmlands are all less than 0.031, which meets the accuracy requirements of global change research for LSA of 0.02–0.05; compared with the Landsat-8, MODIS and GLASS data, the albedo results are in good agreement and match the spatial distribution characteristics.
There are still some deficiencies in this study. For example, due to the limitations of the experimental conditions, the field observation data of other countries could not be obtained, and the accuracy of the GF-1 albedo and field observation results could not be verified. Extensive validation in more study areas and more land cover types are needed in future studies.

Author Contributions

Conceptualization, methodology, software, project administration, funding acquisition, validation, writing—review and editing, H.Z.; formal analysis, software, validation, visualization, writing—original draft preparation, Z.W.; validation, W.M. and W.F.; conceptualization, project administration, funding acquisition, J.W. All authors have read and agreed to the published version of the manuscript.

Funding

This research was funded by the National Natural Science Foundation of China, grant number 42171313, 42090012.

Institutional Review Board Statement

Not applicable.

Informed Consent Statement

Not applicable.

Data Availability Statement

Satellite remote sensing and field measured data used in this study are openly and freely available. The GF-1 WFV data is available at http://www.cresda.com/CN/, accessed on 22 May 2021. The Landsat 8 OLI data is available at http://www.gscloud.cn/, accessed on 3 June 2021.The Collection 6 MODIS albedo data is available at https://ladsweb.modaps.eosdis.nasa.gov/search/, accessed on 23 June 2021. The GLASS data is available at http://www.geodata.cn/, accessed on 26 May 2021. The field observation data is available at https://data.tpdc.ac.cn/zh-hans/, accessed on 10 March 2021.

Conflicts of Interest

The authors declare no conflict of interest.

References

  1. Dickinson, R.E. Land surface processes and climate—Surface albedos and energy balance. Adv. Geophys. 1983, 25, 305–353. [Google Scholar]
  2. Andrews, T.; Forster, P.M.; Gregory, J.M. A surface energy perspective on climate change. J. Clim. 2009, 22, 2557–2570. [Google Scholar] [CrossRef] [Green Version]
  3. Otto, A.; Otto, F.E.L.; Boucher, O.; Church, J.; Hegerl, G.; Forster, P.M.; Gillett, N.P.; Gregory, J.; Johnson, G.C.; Knutti, R.; et al. Energy budget constraints on climate response. Nat. Geosci. 2013, 6, 415–416. [Google Scholar] [CrossRef] [Green Version]
  4. Dickinson, R.E. Land processes in climate models. Remote Sens. Environ. 1995, 51, 27–38. [Google Scholar] [CrossRef]
  5. Brovkin, V.; Boysen, L.; Raddatz, T.; Gayler, V.; Loew, A.; Claussen, M. Evaluation of vegetation cover and land-surface albedo in MPI-ESM CMIP5 simulations. J. Adv. Model. Earth Syst. 2013, 5, 48–57. [Google Scholar] [CrossRef] [Green Version]
  6. Henderson-Sellers, A.; Wilson, M.F. Surface albedo data for climatic modeling. Rev. Geophys. Space Phys. 1983, 21, 1743–1778. [Google Scholar] [CrossRef]
  7. Hollinger, D.Y.; Ollinger, S.V.; Richardson, A.D.; Meyers, T.P.; Dail, D.B.; Martin, M.E.; Scott, N.A.; Arkebauer, T.J.; Baldocchi, D.D.; Clark, K.L.; et al. Albedo estimates for land surface models and support for a new paradigm based on foliage nitrogen concentration. Glob. Chang. Biol. 2010, 16, 696–710. [Google Scholar] [CrossRef] [Green Version]
  8. Li, Y.; Wang, T.; Zeng, Z.; Peng, S.; Lian, X.; Piao, S. Evaluating biases in simulated land surface albedo from CMIP5 global climate models. J. Geophys. Res. Atmos. 2016, 121, 6178–6190. [Google Scholar] [CrossRef]
  9. He, T.; Liang, S.; Song, D.-X. Analysis of global land surface albedo climatology and spatial-temporal variation during 1981–2010 from multiple satellite products. J. Geophys. Res. Atmos. 2014, 119, 10281–10298. [Google Scholar] [CrossRef]
  10. Cao, Y.; Liang, S.; He, T.; Chen, X. Evaluation of Four Reanalysis Surface Albedo Data Sets in Arctic Using a Satellite Product. IEEE Geosci. Remote Sens. Lett. 2016, 13, 384–388. [Google Scholar] [CrossRef]
  11. Schaaf, C.B.; Lucht, W.; Tsang, T.; Feng, G.; Strugnell, N.; Chen, L.; Liu, Y.; Strahler, A.L. Prototyping the Moderate Resolution Imaging Spectroradiometer (MODIS) BRDF and albedo product. Geosci. Remote Sens. Symp. Igarss. Proc. IEEE Int. 2000, 3, 1506–1508. [Google Scholar]
  12. Liang, S.; Strahler, A.H.; Walthall, C. Retrieval of land surface albedo from satellite observations: A simulation study. IEEE Int. Geosci. Remote Sens. Symp. 1998, 38, 712–725. [Google Scholar] [CrossRef]
  13. Privette, J.L.; Eck, T.F.; Deering, D.W. Estimating spectral albedo and nadir reflectance through inversion of simple BRDF models with AVHRR/MODIS-like data. J. Geophys. Res. Atmos. 1997, 102, 29529–29542. [Google Scholar] [CrossRef]
  14. Maignan, F.; Bréon, F.M.; Lacaze, R. Bidirectional reflectance of Earth targets: Evaluation of analytical models using a large set of spaceborne measurements with emphasis on the Hot Spot. Remote Sens. Environ. 2004, 90, 210–220. [Google Scholar] [CrossRef]
  15. Mira, M.; Weiss, M.; Baret, F.; Courault, D.; Hagolle, O.; Gallego-Elvira, B.; Olioso, A. The MODIS (collection V006) BRDF/albedo product MCD43D: Temporal course evaluated over agricultural landscape. Remote Sens. Environ. 2015, 170, 216–228. [Google Scholar] [CrossRef] [Green Version]
  16. Rutan, D.; Rose, F.; Roman, M.; Manalo-Smith, N.; Schaaf, C.; Charlock, T. Development and assessment of broadband surface albedo from Clouds and the Earth’s Radiant Energy System Clouds and Radiation Swath data product. J. Geophys. Res. 2009, 114, D08125. [Google Scholar] [CrossRef] [Green Version]
  17. Muller, J. Algorithm Theoretical Basis Document, ATBD v1.4: BRDF/Albedo retrieval. Meris Albedomaps 2006, 1, 1–19. [Google Scholar]
  18. Rutan, D.; Charlock, T.; Rose, F.; Kato, S.; Zentz, S.; Coleman, L. Global surface albedo from CERES/TERRA surface and atmospheric radiation budget (SARB) data product. In Proceedings of the 12th Conference on Atmospheric Radiation (AMS), 9–10 July 2006; pp. 11–12. Available online: https://citeseerx.ist.psu.edu/viewdoc/download?doi=10.1.1.570.2225&rep=rep1&type=pdf (accessed on 3 August 2022).
  19. Leeuwen, W.J.D.V.; Roujean, J.L. Land surface albedo from the synergistic use of polar (EPS) and geo-stationary (MSG) observing systems. Remote Sens. Environ. 2002, 81, 273–289. [Google Scholar] [CrossRef]
  20. Wang, D.; Liang, S.; He, T.; Yu, Y. Direct estimation of land surface albedo from VIIRS data: Algorithm improvement and preliminary validation. J. Geophys. Res. Atmos. 2013, 118, 12577–12586. [Google Scholar] [CrossRef]
  21. Zhou, Y.; Wang, D.; Liang, S.; Yu, Y.; He, T. Assessment of the Suomi NPP VIIRS Land Surface Albedo Data Using Station Measurements and High-Resolution Albedo Maps. Remote Sens. 2016, 8, 137. [Google Scholar] [CrossRef] [Green Version]
  22. Green, R.O.; Eastwood, M.L.; Sarture, C.M.; Chrien, T.G.; Aronsson, M.; Chippendale, B.J.; Faust, J.A.; Pavri, B.E.; Chovit, C.J.; Solis, M.; et al. Imaging spectroscopy and the airborne visible/infrared imaging spectrometer (AVIRIS). Remote Sens. Environ. 1998, 65, 227–248. [Google Scholar] [CrossRef]
  23. Shuai, Y.; Masek, J.G.; Gao, F.; Schaaf, C.B. An algorithm for the retrieval of 30-m snow-free albedo from Landsat surface reflectance and MODIS BRDF. Remote Sens. Environ. 2011, 115, 2204–2216. [Google Scholar] [CrossRef]
  24. Shuai, Y.; Masek, J.G.; Gao, F.; Schaaf, C.B.; He, T. An approach for the long-term 30-m land surface snow-free albedo retrieval from historic Landsat surface reflectance and MODIS-based a priori anisotropy knowledge. Remote Sens. Environ. 2014, 152, 467–479. [Google Scholar] [CrossRef]
  25. He, T.; Liang, S.; Wang, D.; Cao, Y.; Gao, F.; Yu, Y.; Feng, M. Evaluating land surface albedo estimation from Landsat MSS, TM, ETM+, and OLI data based on the unified direct estimation approach. Remote Sens. Environ. 2018, 204, 181–196. [Google Scholar] [CrossRef]
  26. Wang, Z.; Erb, A.M.; Schaaf, C.B.; Sun, Q.; Liu, Y.; Yang, Y.; Shuai, Y.; Casey, K.A.; Román, M.O. Early spring post-fire snow albedo dynamics in high latitude boreal forests using Landsat-8 OLI data. Remote Sens. Environ. 2016, 185, 71–83. [Google Scholar] [CrossRef] [Green Version]
  27. Gao, B.; Jia, L.; Wang, T. Derivation of Land Surface Albedo at High Resolution by Combining HJ-1A/B Reflectance Observations with MODIS BRDF Products. Remote Sens. 2014, 6, 8966–8985. [Google Scholar] [CrossRef] [Green Version]
  28. He, T.; Liang, S.; Wang, D.; Chen, X.; Song, D.X.; Jiang, B. Land surface albedo estimation from Chinese HJ satellite data based on the direct estimation approach. Remote Sens. 2015, 7, 5495–5510. [Google Scholar] [CrossRef] [Green Version]
  29. Zhou, Q.-b.; Yu, Q.-y.; Liu, J.; Wu, W.-b.; Tang, H.-j. Perspective of Chinese GF-1 high-resolution satellite data in agricultural remote sensing monitoring. J. Integr. Agric. 2017, 16, 242–251. [Google Scholar] [CrossRef]
  30. Zhang, Y.; Shi, M.; Zhao, X.; Wang, X.; Luo, Z.; Zhao, y. Methods for automatic identification and extraction of terraces from high spatial resolution satellite data (China-GF-1). Int. Soil Water Conserv. Res. 2017, 5, 17–25. [Google Scholar] [CrossRef] [Green Version]
  31. Xia, T.; He, Z.; Cai, Z.; Wang, C.; Wang, W.; Wang, J.; Hu, Q.; Song, Q. Exploring the potential of Chinese GF-6 images for crop mapping in regions with complex agricultural landscapes. Int. J. Appl. Earth Obs. Geoinf. 2022, 107, 102702. [Google Scholar] [CrossRef]
  32. Wu, X.; Xiao, Q.; Wen, J.; Liu, Q.; You, D.; Dou, B.; Tang, Y.; Li, X. Optimal nodes selectiveness from WSN to fit field scale Albedo observation and validation in long time series in the Foci experiment areas, Heihe. Remote Sens. 2015, 7, 14757–14780. [Google Scholar] [CrossRef] [Green Version]
  33. Li, L.; Che, H.; Zhang, X.; Chen, C.; Chen, X.; Gui, K.; Liang, Y.; Wang, F.; Derimian, Y.; Fuertes, D.; et al. A satellite-measured view of aerosol component content and optical property in a haze-polluted case over North China Plain. Atmos. Res. 2022, 266, 105958. [Google Scholar] [CrossRef]
  34. Zhang, B.; Guo, B.; Zou, B.; Wei, W.; Lei, Y.; Li, T. Retrieving soil heavy metals concentrations based on GaoFen-5 hyperspectral satellite image at an opencast coal mine, Inner Mongolia, China. Environ. Pollut. 2022, 300, 118981. [Google Scholar] [CrossRef] [PubMed]
  35. Wu, C.; Guo, Y.; Guo, H.; Yuan, J.; Ru, L.; Chen, H.; Du, B.; Zhang, L. An investigation of traffic density changes inside Wuhan during the COVID-19 epidemic with GF-2 time-series images. Int. J. Appl. Earth Obs. Geoinf. 2021, 103, 102503. [Google Scholar] [CrossRef] [PubMed]
  36. Zhou, H.; Wang, Z.; Ma, W.; He, T.; Wan, H.; Wang, J.; Liang, S. Land Surface Albedo Estimation With Chinese GF-1 WFV Data in Northwest China. IEEE J. Sel. Top. Appl. Earth Obs. Remote Sens. 2022, 15, 849–861. [Google Scholar] [CrossRef]
  37. Wang, Z.; Zhou, H.; Wan, H.; Wang, Q.; Fan, W.; Ma, W.; Wang, J. Identifying Spatial and Temporal Characteristics of Land Surface Albedo Using GF-1 WFV Data. Remote Sens. 2021, 13, 4070. [Google Scholar] [CrossRef]
  38. Li, R.; Shi, Y.; Yao, Y.; Tian, F.; Hu, Y. Temporal and spatial variation of oasis cold island effect in Ganzhou district of Zhangye based on landsat TM/ETM+. J. Arid. Land Resour. Environ. 2014, 28, 139–144. [Google Scholar]
  39. Haq, M.; Akhtar, M.; Muhammad, S.; Paras, S.; Rahmatullah, J. Techniques of Remote Sensing and GIS for flood monitoring and damage assessment: A case study of Sindh province, Pakistan. Egypt. J. Remote Sens. Space Sci. 2012, 15, 135–141. [Google Scholar] [CrossRef] [Green Version]
  40. Hongmin, Z.; Jindi, W.; Shunlin, L. Design of a Novel Spectral Albedometer for Validating the MODerate Resolution Imaging Spectroradiometer Spectral Albedo Product. Remote Sens. 2018, 10, 101. [Google Scholar]
  41. Liang, S.; Li, X.; Wang, J. Quantitative Remote Sensing: Concept and Algorithm; Science Press: Beijing, China, 2013. [Google Scholar]
  42. Zhenchao, L.; Jiaxi, Y.; Xiaoqing, G.; Ye, Y.; Zhiyuan, Z.; Rong, L.; Chao, W.; Xuhong, H.; Zhigang, W. The relationship between surface spectral albedo and soil moisture in an arid Gobi area. Theor. Appl. Climatol. 2018, 136, 1475–1482. [Google Scholar]
  43. Pang, G.; Chen, D.; Wang, X.; Lai, H.W. Spatiotemporal variations of land surface albedo and associated influencing factors on the Tibetan Plateau. Sci. Total Environ. 2022, 804, 150100. [Google Scholar] [PubMed]
  44. Shen, X.; Liu, Y.; Liu, B.; Zhang, J.; Wang, L.; Lu, X.; Jiang, M. Effect of shrub encroachment on land surface temperature in semi-arid areas of temperate regions of the Northern Hemisphere. Agric. For. Meteorol. 2022, 320, 108943. [Google Scholar] [CrossRef]
  45. Shen, X.; Liu, B.; Henderson, M.; Wang, L.; Jiang, M.; Lu, X. Vegetation greening, extended growing seasons, and temperature feedbacks in warming temperate grasslands of China. J. Clim. 2022, 21, 1–51. [Google Scholar] [CrossRef]
  46. Cescatti, A.; Marcolla, B.; Vannan, S.K.S.; Pan, J.Y.; Román, M.O.; Yang, X.; Ciais, P.; Cook, R.B.; Law, B.E.; Matteucci, G.; et al. Intercomparison of MODIS albedo retrievals and in situ measurements across the global FLUXNET network. Remote Sens. Environ. 2012, 121, 323–334. [Google Scholar] [CrossRef] [Green Version]
  47. Liang, S. A direct algorithm for estimating land surface broadband albedos from MODIS imagery. IEEE Trans. Geosci. Remote Sens. 2003, 41, 136–145. [Google Scholar] [CrossRef]
  48. Feng, L.; Li, J.; Gong, W.; Zhao, X.; Chen, X.; Pang, X. Radiometric cross-calibration of Gaofen-1 WFV cameras using Landsat-8 OLI images: A solution for large view angle associated problems. Remote Sens. Environ. 2016, 174, 56–68. [Google Scholar] [CrossRef]
Figure 1. (a) Remote sensing image (GF-1 WFV, 17 July 2014) and (b) surface classification (GlobeLand30) of Ganzhou District.
Atmosphere 13 01651 g001
Figure 2. (a) Remote sensing image (GF-1 WFV, February 2016) and (b) surface classification (GlobeLand30) of Sindh Province.
Atmosphere 13 01651 g002
Figure 3. Comparison of GF-1 WFV estimated albedo with ground measurements.
Atmosphere 13 01651 g003
Figure 4. Comparison of the estimated albedo of GF-1 WFV with the ground measurements for different land cover types.
Atmosphere 13 01651 g004
Figure 5. Comparison of Landsat-8 estimated albedo with ground measurements.
Atmosphere 13 01651 g005
Figure 6. Comparison of (a) black-sky albedo and (b) white-sky albedo of GF-1 WFV (left) and Landsat-8 (right) in Ganzhou.
Atmosphere 13 01651 g006
Figure 7. Scatter plot of albedo comparison between GF-1 WFV and Landsat-8.
Atmosphere 13 01651 g007
Figure 8. Comparison of (a) black-sky albedo and (b) white-sky albedo of GF-1 (left) and Landsat-8 (right) in Sindh.
Atmosphere 13 01651 g008
Figure 9. Scatter plot of GF-1 albedo and Landsat-8 albedo in Sindh.
Atmosphere 13 01651 g009
Figure 10. Comparison of the (a) black-sky albedo and (b) white-sky albedo of the GF-1 (left) and MODIS (right) in Sindh.
Atmosphere 13 01651 g010
Figure 11. Scatter plot of GF-1 albedo and MODIS albedo in Sindh.
Atmosphere 13 01651 g011
Figure 12. Comparison of the (a) black-sky albedo and (b) white-sky albedo of the GF-1 (left) and GLASS (right) in Sindh.
Atmosphere 13 01651 g012aAtmosphere 13 01651 g012b
Figure 13. Scatter plot of the GF-1 albedo and GLASS albedo in Sindh.
Atmosphere 13 01651 g013
Table 1. Spectral resolution of GF-1 WFV.
BandB1B2B3B4
Spectral Resolution0.45–0.52 µm0.52–0.59 µm0.63–0.69 µm0.77–0.89 µm
Table 2. Information of field observation sites.
SiteLand Cover TypeHeight of Radiometer (m)Time
HeiheGrassland1.52015001–2015365,
2016001–2016365,
2017001–2017365,
2018001–2018365
BajitanDesert62014001–2014365,
2015001–2015103
ShenshawoDesert62014001–2014365,
2015001–2015102
HuazhaiziDesert62014001–2014365,
2015001–2015365,
2016001–2016365,
2017001–2017365,
2018001–2018365
ZhangyeWetland62014001–2014365,
2015001–2015365,
2016001–2016365,
2017001–2017365,
2018001–2018365
DamanFarmland122014001–2014365,
2015001–2015365,
2016001–2016365,
2017001–2017365,
42018001–2018365
Table 3. Validation data.
Study AreaDataTime
GanzhouGF-1 WFV2014001–2018365
Field Observation2014001–2018365
Landsat2015055
SindhGF-1 WFV2016038, 2016042, 2016046
Landsat2016033, 2016040, 2016042, 2016047
MODIS2016042
GLASS2016045
Table 4. Input parameters of the 6S model.
Input ParametersValue
Solar Zenith Angle0, 5, 10, …, 75
View Zenith Angle0, 5, 10, …, 40
Relative Azimuth Angle0, 30, 60, …, 180
Atmospheric ModelTropic, Mid-latitude summer, Mid-latitude winter, Subarctic summer, Subarctic winter, United States standard
Aerosol Optical Depth TypeContinental
Aerosol Optical Depth0.05, 0.1, 0.2, 0.25, 0.3, 0.35, 0.4
Table 5. Coefficients for calculating LSA.
Parameterk = isok = volk = geo
g 0 k 1−0.007574−1.284909
g 1 k 0−0.070987−0.166314
g 2 k 00.3075880.041840
White-sky10.189184−1.377622
Publisher’s Note: MDPI stays neutral with regard to jurisdictional claims in published maps and institutional affiliations.

