Article

Application of Remote Sensing Methodology for Vehicle Emission Inspection

1
State Key Laboratory of Engine Reliability, Weichai Power Co., Ltd., Weifang 261061, China
2
School of Mechanical Engineering, Beijing Institute of Technology, Beijing 100081, China
*
Author to whom correspondence should be addressed.
Atmosphere 2022, 13(11), 1862; https://doi.org/10.3390/atmos13111862
Submission received: 31 October 2022 / Revised: 2 November 2022 / Accepted: 7 November 2022 / Published: 9 November 2022
(This article belongs to the Special Issue Recent Advances in Mobile Source Emissions)

Abstract

:
Remote sensing detection of vehicle emissions is an effective supplement to the statutory periodic inspection of in-use vehicle emissions and it is a convenient technical method for real-time screening of high-emission vehicles. The principle of remote sensing detection is to inversely calculate the absolute concentrations of gaseous pollutants in vehicle exhaust according to the relative volume concentration ratio of each exhaust component to carbon dioxide (CO2) in the vehicle exhaust plume. Because the combustion mechanisms of gasoline engines and diesel engines are different, different inversion calculation methods of remote sensing data must be applied. The absolute concentrations of gasoline vehicle gaseous emissions measured by remote sensing can be calculated by the inversion calculation method based on the theoretical air–fuel ratio combustion mechanism. However, the absolute concentrations of diesel vehicle nitrogen oxide (NOx) measured by remote sensing must be calculated by the inversion calculation method based on the correction of the excess air coefficient. For the integrated remote sensing test system of gasoline and diesel vehicles, it is necessary to determine the vehicle category according to the vehicle type and license plate and adopt different inversion calculation methods to obtain the correct remote sensing results of vehicle emissions. The big data statistical analysis method for vehicle emission remote sensing results can quickly screen high-emission vehicles and dynamically determine the remote sensing emission screening threshold of high-emission vehicles as the composition of in-use vehicles changes and the overall emission of vehicles declines, so as to achieve dynamic and accurate screening of high-emission vehicles.

1. Introduction

Vehicle emissions such as Carbon Monoxide (CO), Hydrocarbon (HC), Nitrogen Oxides (NOx), and Particle matter (PM) are the main sources of atmospheric pollution. HC and NOx emissions cause damage to human respiratory organs, generate photochemical smog under the action of sunlight, and increase the concentration of the ambient ozone, which may further harm the atmospheric environment and human health [1,2].
In order to control vehicle emission pollution, in addition to tightening new vehicle emission standards and reducing the initial emissions of new production vehicles, strengthening in-use vehicle emission supervision is an effective means to control vehicle emissions. In-use vehicle emission regulation refers to the vehicle detection and maintenance system (I/M system), that is, through periodic emission testing of in-use vehicles, screening of high-emission vehicles, and mandatory maintenance of high-emission vehicles, so that in-use vehicles can reach or be close to their own optimal emission level, so as to minimize the air pollution caused by in-use vehicles. Regular inspection of in-use vehicle emissions is the main means to monitor vehicle emissions, but there are still many problems in the actual inspection process. First of all, the annual inspection period is long and the data are not real-time. The long time span of one to two years regarding the regular emission inspection period cannot ensure that vehicles meet the requirements of emission regulations within the inspection period. Therefore, irregular vehicle emission testing is added, that is, spot checks and roadside inspections. Vehicle emission sampling inspection and roadside inspection require special annual emission inspection equipment, which makes it time-consuming, laborious, and difficult to complete a large number of vehicle inspections. Therefore, in order to screen high-emission vehicles in a timely and rapid manner, remote sensing detection, as an efficient, fast, and non-contact vehicle emission detection technology, can realize on-site, non-stop mobile detection on the road and become an important means of in-use vehicle emission supervision, and has begun to be used around the world [3,4].
In 1989, researchers at the University of Denver in the United States used remote sensing technology to measure CO emissions from gasoline vehicles, and the measuring principle of CO emission concentration of gasoline vehicles is an inverse calculation method based on the theoretical air–fuel ratio or rich mixture combustion mechanism of gasoline engines [5]. Later, with the development of remote sensing detection technology, the measurement methods of HC and NO concentrations in gasoline vehicle exhaust are increasingly improved [6] and gradually used for screening high-emission vehicles, exempting clean vehicles, or evaluating vehicle emission levels [7,8].
Hong Kong introduced vehicle emission remote sensing monitoring equipment for high-emission vehicle detection, and since 1 September 2014, Hong Kong Environmental Protection Department (HKEPD) has used road remote sensing as a law-enforcement tool for screening high-emission vehicles [9]. If the vehicle is determined to be a high-emission vehicle through remote sensing detection results, the owner will be notified to conduct emission testing at an authorized emission testing organization within 12 working days, and to maintain/repair the vehicle. Remote sensing screening of high-emission vehicles is mainly aimed at gasoline and liquefied petroleum gas (LPG) vehicles. For remote sensing diesel vehicle emission concentrations, the error is large [9]. Major cities in the Chinese Mainland such as Beijing, Shanghai, Chongqing, and Chengdu have introduced vehicle emission testing equipment to detect in-use vehicle emissions [10]. Nearly 3000 sets of remote sensing testing equipment have been built nationwide [11]. In order to screen high-emission diesel vehicles, the Ministry of Ecology and Environment of China promulgated and implemented the “HJ 845-2017 Measurement Method and Technical Requirements for Exhaust Pollutants from Diesel Vehicles in Use (Remote Sensing Detection Method)” standard on 27 July 2017 [12], which requires testing the NO emission concentration of diesel vehicles in use and stipulates that the NO emission limit is 1500 ppm. Therefore, the key to ensuring the smooth implementation of the remote sensing detection standard is to establish a remote sensing detection and inversion calculation method for the absolute concentration of NO emissions from diesel vehicles.
The remote sensing measurement method of CO, HC, and NO concentrations in gasoline vehicle exhaust has reached a consensus at home and abroad. In terms of remote sensing detection methods for diesel vehicle exhaust emissions, scholars all over the world have carried out research one after the other but have not yet reached a recognized test method. At present, there are three treatment methods: (1) Use the concentration ratios of gaseous emissions and CO2 in diesel vehicle exhaust plume directly detected by a remote sensing detection system to evaluate diesel vehicle emission levels [5,13]; (2) use the pollutant emission factor (g/kg fuel) of the vehicle to evaluate the emission level of diesel vehicles [14]; and (3) establish the inversion calculation method of remote sensing data of diesel vehicle exhaust emissions and use the obtained absolute concentration of diesel vehicle exhaust emissions to evaluate the diesel vehicle emission level [15]. Carslaw et al. used a remote sensing method to measure the NOx/CO2 concentration ratio in the vehicle exhaust plume in London to evaluate the NOx emissions of road vehicles, and found that during the period of 1985–2012, the NOx/CO2 concentration ratio of gasoline vehicle emissions exhibited a downward trend. However, the NOx/CO2 concentration ratio of diesel vehicle emissions shows little sign of decline [3]. Pujadas et al. studied the real road driving NOx emissions of pre-Euro 6 passenger cars in Spain and found that the NOx/CO2 concentration ratio of diesel vehicles did not decrease significantly [16]. Huang et al. used the NOx/CO2 concentration ratio in the exhaust plume of diesel vehicles measured by remote sensing to identify high-emission diesel vehicles and studied the NOx/CO2 concentration ratio threshold of high-emission diesel vehicles [17]. In addition, the fuel-based NO emission factor is used to evaluate the NO emission level of diesel vehicles [14], which represents the mass NO produced per unit of mass fuel burnt (g/kg fuel).
According to our research experience, the concentration ratio of gaseous emissions to CO2 and the pollutant emission factor based on unit fuel consumption are prone to abnormally high values under the low speed and small load conditions of diesel vehicles. Therefore, judging high-emission diesel vehicles will lead to a false judgment while judging high-emission diesel vehicles by using the emission absolute concentration of pollutants such as NO from diesel vehicles has higher reliability [18].
Although a large number of scholars at home and abroad have carried out research on vehicle emission remote sensing measurement methods, most of them focus on research on vehicle emission evaluation and high-emission vehicle screening methods, while few of them focus on research on the testing procedure and data processing methods of remote sensing testing systems. At present, vehicle remote sensing detection systems at home and abroad are integrated systems applied to both gasoline vehicles and diesel vehicles. Because the combustion mechanism of gasoline engines and diesel engines is different, it is necessary to adopt different inversion methods of remote sensing test data for gasoline vehicles and diesel vehicles. However, at present, the remote sensing system is only built with the inversion calculation method of remote sensing test data based on gasoline engines’ theoretical air–fuel ratio combustion, which is not applicable to diesel vehicles.
This paper proposes the detection procedure and detection methods by vehicle type for the integrated vehicle emission remote sensing detection system, that is, first distinguish whether the vehicle type is a gasoline vehicle (including spark ignition gas fuel vehicles) or a diesel vehicle and calculate the gasoline vehicle emission remote sensing detection results based on the inversion calculation method established by the gasoline engine theoretical air–fuel ratio mixture or rich mixture combustion mechanism. The remote sensing detection results of diesel vehicles’ gaseous emission concentrations are calculated based on the inversion calculation method of diesel engines’ excess air coefficient correction. Finally, the remote sensing detection data of gasoline vehicles and diesel vehicles are statistically analyzed, and high-emission vehicles are screened based on remote sensing big data processing methods. Using the inversion calculation method and remote sensing big data processing method proposed in this paper for the remote sensing detection data of gasoline and diesel vehicle emissions, the emissions data of gasoline and diesel vehicles measured at 60 road vehicle remote sensing monitoring stations in Beijing in 2021 were processed, and the emissions of gasoline and diesel vehicles in Beijing were studied and analyzed.

2. Methodology

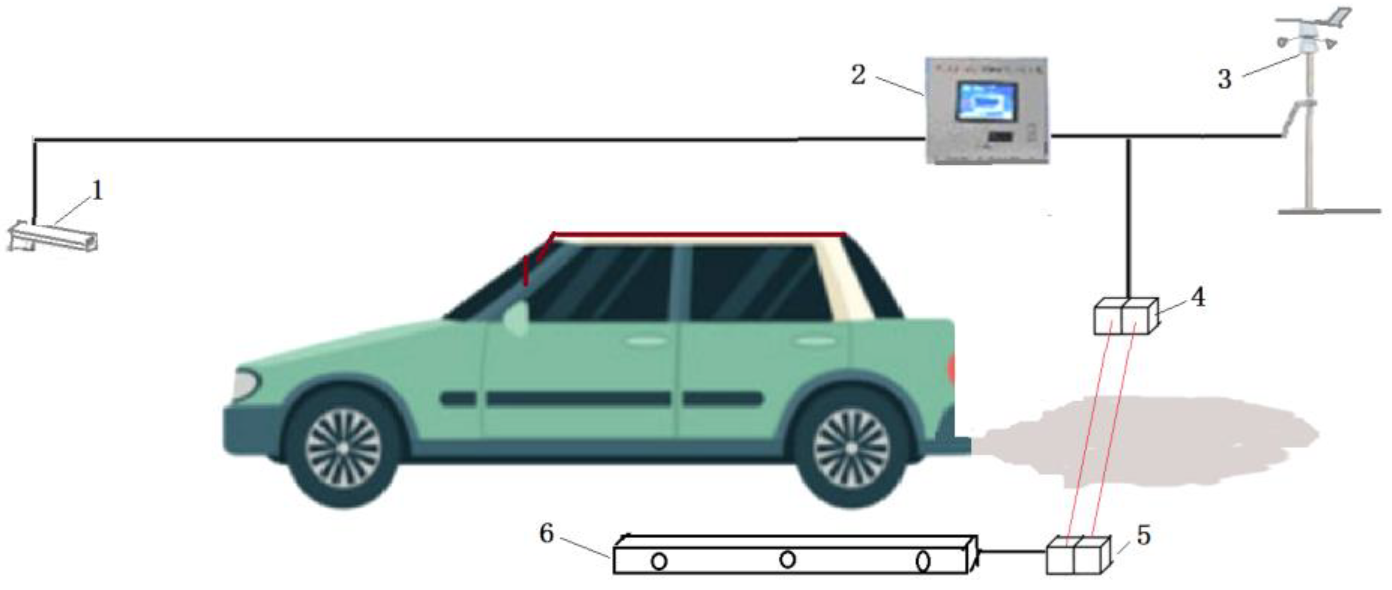
2.1. Vehicle Emission Remote Sensing System

The vehicle emission remote sensing system shown in Figure 1 mainly includes the main control computer, emission remote sensing device, license plate camera, weather station, light source and detector, reflector, and pedometer.
The light source of the remote sensing system emits infrared light (or laser) and ultraviolet light beams, which pass through the vehicle exhaust plume and will be reflected back by the reflector installed on the opposite side of the light source. The light beams will be partially absorbed by the exhaust plume. By processing and calculating the spectral changes of the light received by the receiver, the concentrations of CO, HC, NO, and CO2 in the vehicle exhaust plume can be obtained. At the same time, the vehicle license plate will be recorded by the license plate camera, vehicle speed and acceleration will be measured by the speedometer, and the environmental parameters will be recorded by the meteorological instrument.

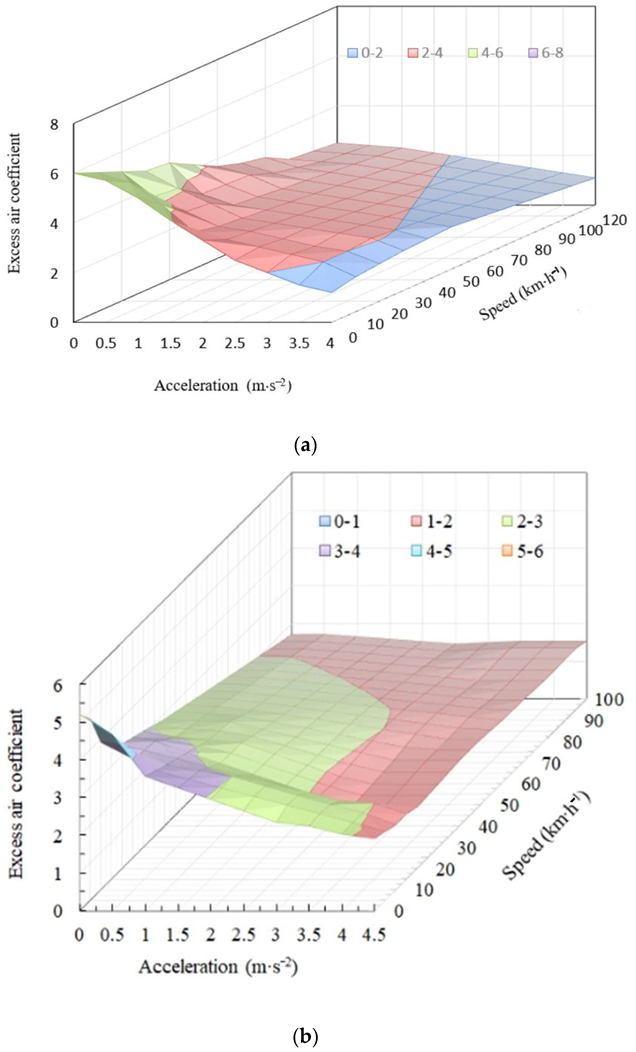
2.2. Inversion Calculation Method for Remote Sensing of Gasoline Vehicle Emissions

Since vehicle exhaust is diluted by the air after being discharged, the concentration of the exhaust plume is affected by many factors such as the ambient wind speed, wind direction, and airflow disturbance. Therefore, the measured concentrations of various emission components in the exhaust plume are not the true exhaust emission concentrations. The usual method of handling this problem is to regard the relative volume concentration ratios of CO, HC, and NO to CO2 in the same exhaust plume unchanged during the exhaust plume diffusion process, and the relative volume concentration ratios of CO, HC, and NO to CO2 in the gasoline vehicle exhaust can be measured. It is generally considered that the combustion of a gasoline engine is a theoretical mixture or rich mixture combustion. Therefore, the combustion equation of a gasoline engine can be expressed as
CH 2 + m 0.21 O 2 + 0.79 N 2 a CO + b H 2 O + c C 4 H 6 + d CO 2 + e NO + 0.79 m e 2 N 2
The volume concentration ratios of CO, HC, and NO to CO2 in the exhaust plume are described as:
Q CO = C CO C CO 2 = a d
Q HC = C HC C CO 2 = c d  
Q NO = C NO C CO 2 = e d
where QCO, QHC and QNO are the concentration ratios of CO, HC, and NO to CO2, respectively, and CCO, CHC, CNO and CCO2 are the measured concentrations of CO, HC, NO, and CO2 in the exhaust plume, respectively [5,6].
Based on the conservation of carbon atoms, hydrogen atoms, and oxygen atoms, the inversion calculation formula of the concentration of CO2 in the gasoline vehicle exhaust is derived as follows:
C C O 2 = 42 2.79 + 2 Q CO + 1.21 Q HC + Q NO
The volume concentrations of CO, HC, and NO in the gasoline vehicle exhaust can be calculated by
C CO = C C O 2 * Q CO
C HC = C C O 2 * Q HC
C NO = C C O 2 * Q NO

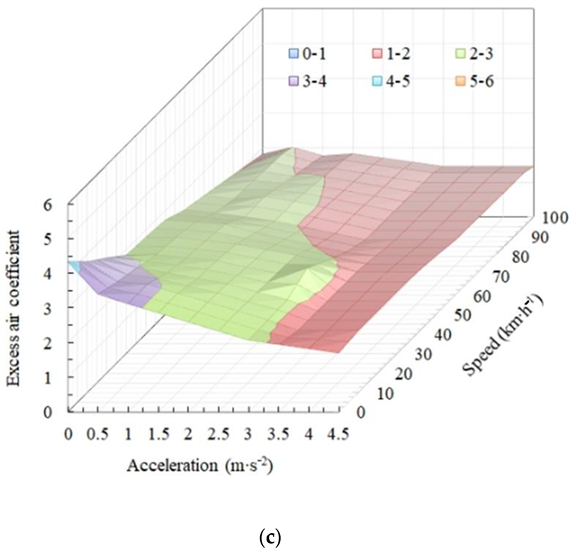
2.3. Inversion Calculation Method for Remote Sensing of Diesel Vehicle Emissions

The combustion characteristics of diesel engines are significantly different from gasoline engines due to the large amount of excess air involved in diesel engine combustion. Formulas (5)–(8), based on the theoretical air–fuel ratio or rich fuel combustion mechanism of the gasoline engine, are not suitable for the remote sensing of gaseous emissions from diesel vehicles [15]. The inversion calculation method of diesel vehicle emission remote sensing results is derived based on the following combustion reaction equation:
CH 2 + m 0.21 O 2 + 0.79 N 2 a CO + b H 2 O + c C 4 H 6 + d CO 2 + e NO + 0.79 m e 2 N 2 + x O 2
The excess air coefficient “α” during the diesel engine combustion process is defined by the following equation:
α   = 0.42 m ( a + b + 2 d + e )
According to the conservation of carbon, hydrogen, and oxygen atoms, the formula for calculating the volume concentration of CO2 in the exhaust of diesel vehicles is calculated as
C C O 2 = 100 0.5 Q HC 0.5 + 2.38 α ( 2 Q CO + Q HC + 3 + Q NO )
where QCO, QHC and QNO are the measured volume concentration ratios of CO, HC, and NO to CO2 in the diesel vehicle exhaust plume, respectively, and are also regarded as constant values during the exhaust plume diffusion process.
The volume concentrations of CO, HC, and NO in the diesel vehicle exhaust can be calculated using the aforementioned Formulas (6)–(8).
Formula (11) shows that for remote sensing of diesel vehicle gaseous emissions, in addition to the relative volume concentration ratios of NO, CO, HC, and CO2 measured by the remote sensing device, it is also necessary to obtain the diesel engine excess air coefficient under the test conditions.
The excess air coefficient of the diesel engine has a good correlation with vehicle driving dynamics. In order to accelerate or decelerate the vehicle, the direct corresponding action is to increase the fuel injection amount or reduce the fuel injection amount, which directly reflects the change in the excess air coefficient. Therefore, it is feasible and applicable to establish the diesel engine excess air coefficient map related to vehicle speed and acceleration, which will be used to interpolate the excess air coefficient map to calculate the engine excess air coefficient under the diesel vehicle driving conditions.
In this study, the statistical maps of diesel engine excess air coefficients as a function of vehicle speed and acceleration were set up for light-duty diesel vehicles (gross vehicle weight (GVW < 4500 kg), medium-duty diesel vehicles (4500 kg ≤ GVW < 12,000 kg), and heavy-duty diesel vehicles (12,000 kg ≤ GVW) [19], from which the diesel engine excess air coefficients are derived from the real road driving emissions of diesel vehicles measured by the Portable Emission Measurement System (PEMS), as shown in Figure 2.
Figure 2 shows the schematic maps of excess air coefficients for three kinds of diesel vehicles based on the PEMS (Portable Emission Measurement System) tested data. For light-duty diesel vehicles, the abscissa vehicle speed changes from 0 to 120 km∙h−1 (at intervals of 10 km∙h−1) and the ordinate acceleration changes from 0 to 4.0m∙s−2 (at intervals of 0.5 m∙s−2). For medium-duty and heavy diesel vehicles, vehicle speed changes from 0 to 100 km∙h−1 at intervals of 5 km∙h−1, and vehicle acceleration changes from 0 to 4.5 m∙s−2 at intervals of 0.5 m∙s−2. The curved surface of the excess air coefficient shows that the excess air coefficient decreases with the increase in diesel engine fuel injection because the engine load increases with the increase in vehicle speed or acceleration.
The formation of the combustion mixture in diesel engines and the combustion condition is also affected by ambient conditions including temperature, wind speed, wind direction, etc. In this study, when the excess air coefficients of diesel vehicle engines were tested by PEMS, the ambient temperature, wind speed, and wind direction changed under the test conditions, and these environmental conditions met the requirements of vehicle emission remote sensing. Therefore, their comprehensive impact on the excess air coefficients of diesel engines is included in the statistical analysis results of the excess air coefficient map. In addition, considering that it is not easy to measure the weight of diesel vehicles using remote sensing test equipment, the diesel engine excess air coefficient map obtained by statistical analysis includes the diesel engine excess air coefficient results tested under different vehicle working conditions such as no-load, half-load, and full-load conditions. In addition, this excess air coefficient model is based on the measurement results after the vehicle engine is fully warmed up, regardless of cold-start emissions. In addition, the excess air coefficient is stored as a lookup table as a function of vehicle speed and acceleration. Each data node is the statistical average of many original data, thus smoothing some transient characteristics while maintaining the most important logical relationship of the original database. Therefore, some errors may be caused by the transient driving conditions of the vehicle.
Although many factors affect vehicle emissions, it is feasible to determine the diesel engine power output and its excess air coefficient according to the speed and acceleration of diesel vehicles. In this way, the excess air coefficient of the diesel vehicle engine under remote sensing test conditions can be obtained. At the same time, the remote sensing test equipment measures the relative volume concentration ratio of CO, HC, NO, and CO2 in the exhaust plume so that the emission concentrations of CO, HC, NO, and CO2 in the diesel vehicle exhaust tailpipe can be calculated and used to evaluate the diesel vehicle emissions.
The remote sensing measurement method of diesel engines’ exhaust smoke is based on the basic principle of the opacimeter. The photoelectric sensor light path is used. One side emits light beams, and the other side receives them. The beam range covers the height of most motor vehicle exhaust pipes, and the measurement results of a vertical section distribution index of motor vehicle exhaust smoke can be obtained. The light transmittance is divided into 100 levels.

2.4. Methods for Identifying High-Emission Vehicles

Because the inversion calculation methods of remote sensing results of gasoline and diesel vehicle emissions are different, for the integrated remote sensing test system of gasoline and diesel vehicles, it is necessary to determine the vehicle category according to the vehicle type and license plate and adopt different inversion calculation methods to obtain the correct remote sensing results of vehicle emissions. If the concentration of a certain pollutant exceeds the remote sensing emission limit, the event that the emission exceeds the emission standard will be recorded as one occurrence. If the number of occurrences of the same emission pollutant exceeding the standard exceeds the specified number of times within the specified detection period, it is determined that the vehicle emission exceeds the legal limit, that is, it is identified as a high-emission vehicle. The Beijing municipal remote sensing standard for in-use gasoline vehicles and the National remote sensing standard for in-use diesel vehicles in China both use a 6-month test period [12,20]. If the same emission pollutant exceeds the standard limit twice within 6 months, the vehicle will be identified as a high-emitter. High-emission vehicles identified by remote sensing emission monitoring must be repaired to ensure their emissions meet the requirements of regulations; otherwise, they will be restricted from driving, and if the emissions seriously exceed the standard and cannot be repaired, they will be ordered to stop their use or be eliminated.
High-emission vehicles can be screened according to the limits of vehicle emission remote sensing detection standards, which can achieve the purpose of emission control of in-use vehicles. However, the revision of emission limits of domestic and foreign standards currently has a prescribed process and a certain time period. Within this time period, emission limits remain unchanged. However, the number of vehicles in use and the composition of the fleet are constantly changing. As new production vehicles continue to be put into use and older vehicles continue to be phased out, overall vehicle emissions exhibit a downward trend. In order to effectively screen and control high-emission vehicles, it is necessary to dynamically optimize and adjust the screening emission limits of high-emission vehicles as the overall emission level of the vehicle changes.
At present, some countries and regions in the world have adopted remote sensing detection systems for vehicle emission monitoring. Nearly 3000 remote sensing systems for vehicle emission monitoring have been built in major cities across China. The remote sensing monitoring network collects vehicle driving conditions and emissions data in real time, forming a huge remote sensing emissions database. Since vehicle emissions are closely related to driving conditions, the emission levels of gasoline vehicles and diesel vehicles can be evaluated according to different operating conditions. For example, in the proposed 2024 vehicle emission standards of the United States, emission control and determination of emission limits are carried out for low-load, medium-load, and high-load conditions of vehicles [21]. Therefore, the vehicle emission remote sensing test data can be statistically analyzed within the vehicle emission control operating condition range to calculate the cumulative distribution probability, and the high-emission vehicle screening threshold can be determined according to the required high-emission vehicle screening ratio. In this way, the high-emission vehicle screening threshold limits can be dynamically adjusted with changes in vehicle ownership and model composition, which effectively overcomes the lag in the update of emission limits due to the time-cycle limitation in the formulation and revision of emission standards, achieves more accurate screening of high-emission vehicles, and optimizes the supervision of vehicle emissions.

2.5. Dynamic Statistical Analysis of Remote Sensing Detection of Vehicle Emission Limits

Massive remote sensing emission data form a huge database, and it is urgent that the dynamic statistical analysis method of big data be adopted.
Before 2018, the statutory periodical inspection emission limits of in-use gasoline vehicles and in-use diesel vehicles followed the principle of determining emission limits by vehicle category and technical level, that is, determining the vehicle emission limits according to the type of vehicle and the level of emission standards that should be met during vehicle production and sales. In 2018, in accordance with the guiding ideology of the State Council of the People’s Republic of China to promote the phasing-out of high-emitting vehicles, which were named yellow-label vehicles, and improve air quality, the newly promulgated and implemented emission standards for in-use gasoline vehicles and in-use diesel vehicles no longer distinguished emission stages and vehicle weights. In-use gasoline vehicle emission standard GB18285-2018 set uniform emission limits for gasoline vehicles of different types and different emission stages [22]. Similarly, in-use diesel vehicle emission standard GB3847-2018 set uniform emission limits for diesel vehicles in use [23].
The remote sensing results of in-use gasoline vehicles and in-use diesel vehicles are processed and analyzed. Taking each piece of remote sensing emission data as a discrete random variable x, x 1 ,   x 2 , ,   x n are the values of variable x and p 1 ,   p 2 , ,   p n are the probabilities corresponding to the above values, namely the probability distribution density. The probability distribution of each piece of discrete data can be expressed as
P x i = p i where   i = 1 ,   2 , ,   n
The cumulative sum of pi satisfies the following conditions
i = 1 n p i = 1
Assuming the cumulative distribution function f(x) of the discrete variable x, the cumulative distribution probability of x is
f x i = 1 i p i
All emissions data are greater than or equal to 0, the cumulative distribution probability curve of f(x) of the emission data x is shown in Figure 3. The cumulative distribution probability function value f(xi) represents the probability that x falls in the interval (0 ≤ xxi). If the proportion of screening high-emission vehicles is defined as y %, the emission data x1 corresponding to the cumulative distribution probability (1−y)% can be used as the primary emission limit as the threshold for screening high-emission vehicles.
In this way, with changes in vehicle ownership, fleet composition, and emission levels, the remote sensing emission monitoring threshold limits of high-emission vehicles can follow the dynamic changes in the vehicle emission database.

3. Results and Discussion

Nearly 6 million sets of in-use gasoline vehicles and 900,000 in-use diesel vehicle emission remote sensing data from 60 remote sensing monitoring sites in Beijing were collected in the first half of 2021 and used for statistical analysis in order to investigate the emission compliance status of in-use gasoline vehicles and in-use diesel vehicles in Beijing.
Due to the different inversion calculation methods for the remote sensing results of emissions from gasoline vehicles and diesel vehicles, in the remote sensing monitoring of vehicle emissions, it is necessary to determine the vehicle category according to the vehicle type and license plate, adopt different inversion calculation methods to obtain the correct vehicle emission remote sensing results, and then perform big data statistical analysis on the massive remote sensing data.

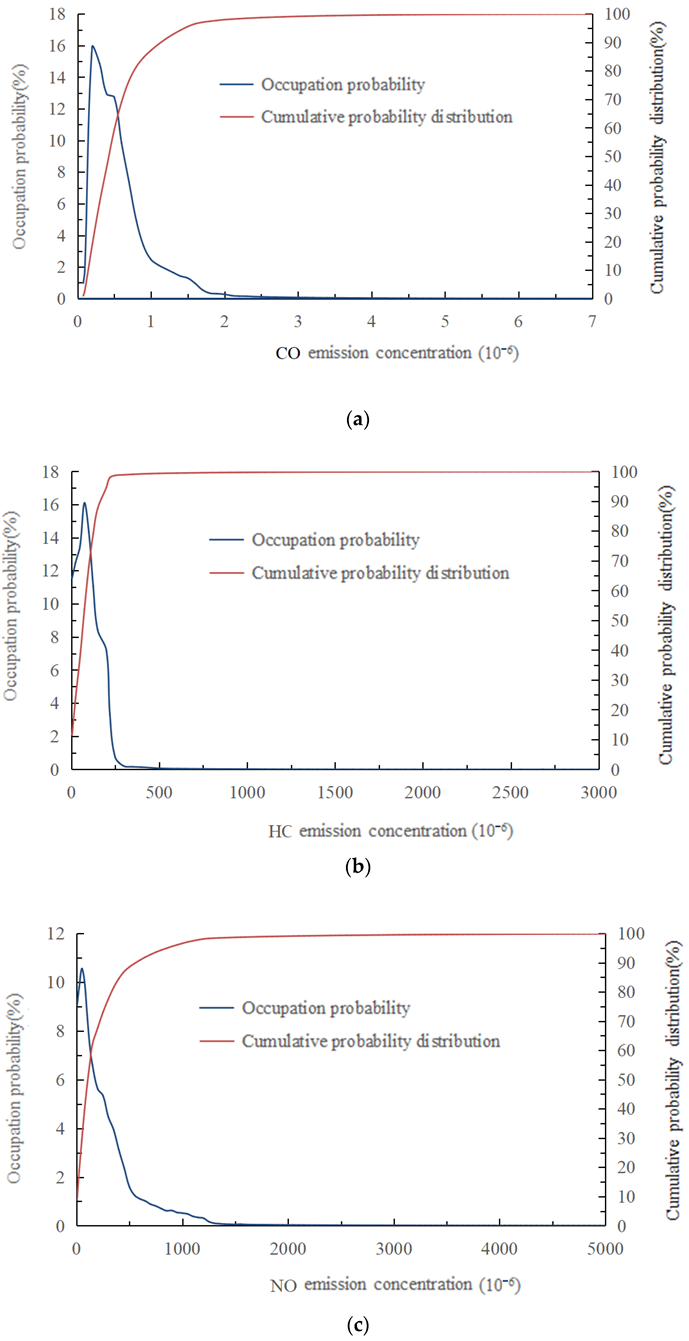
3.1. Statistical Analysis of Remote Sensing Emission Data of Gasoline Vehicles

The discrete variable statistical analysis method was applied to process and analyze the remote sensing data of in-use gasoline vehicle emissions in Beijing. Figure 3 and Table 1 show the results of statistical analysis of remote sensing measurement values of CO, HC, and NO emission concentrations.
From Figure 3 and Table 1, it can be seen that most of the remote sensing measurement results of in-use gasoline vehicle exhaust emissions in Beijing are distributed in the lower emission range, and do not show regular probability distributions. Compared with the remote sensing emission detection standards of gasoline vehicles in use in Beijing, CO, HC, and NO remote sensing detection emission limits (volume concentrations) are 2.0%, 400 ppm (10−6) (the HC concentration is calculated according to n-hexane equivalent), and 1400 ppm (10−6) [20]. Approximately 2.2% of gasoline vehicles in the Beijing CO remote sensing test results exceed emission standards and approximately 1.9% of gasoline vehicle NO remote sensing test results exceed emission standards. The remote sensing measurement results of HC exhaust emissions of gasoline vehicles in use in Beijing are up to standard, and the main reason is that the remote sensing monitoring equipment of 60 detection points in the Beijing area mainly includes products made by Zhejiang Doppler company and Anhui Baolong company. HC currently has two kinds of standard gas (propane and 1,3-butadiene) and the HC remote sensing detection concentration is different. The Beijing gasoline vehicle emission remote sensing detection standards require the HC concentration to be calculated by n-hexane equivalent, and the related equipment is undergoing equipment transformation and HC conversion coefficient calibration. Subsequently, the HC concentration will be strictly implemented according to the n-hexane equivalent limit.
It can be seen from Figure 3 and Table 1 that the number of vehicles with serious emissions is small, but because of their high pollutant emissions, a small number of high-emission vehicles will also produce more pollutant emissions. Therefore, these high-emission vehicles can be accurately identified, and forced maintenance and repairs can improve their emissions and reach the standard. Unqualified vehicles can limit their travel as only a small reduction in the number of high-emission vehicles can effectively reduce the total emissions, obtaining twice the result with half the effort.

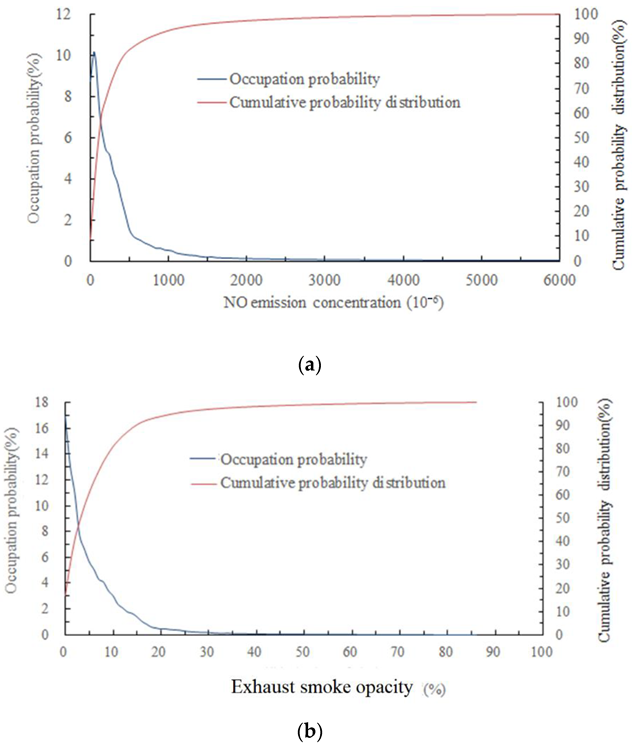
3.2. Statistical Analysis of Remote Sensing Emission Data of Diesel Vehicles

At present, the regular inspection of in-use diesel vehicles in China focuses on testing the exhaust smoke and nitrogen oxides of diesel vehicles. At the same time, in order to eliminate high-emission diesel vehicles, unified emission limits are applied to in-use diesel vehicles of different emission stages and different models [23], that is, the same emission limit requirements are applied to all in-use diesel vehicles. Therefore, this study conducts unified processing and analysis on the measured remote sensing data of diesel vehicle emissions. Figure 4 shows the probability distribution characteristics of the remote sensing test data of diesel vehicle NO and exhaust smoke emissions based on the probability statistical distribution analysis method.
From February to April 2021, approximately 900,000 in-use diesel vehicle emission remote sensing data were collected from 60 remote monitoring sites in Beijing, and diesel vehicle NO and exhaust smoke emissions were statistically analyzed by regarding each remote sensing emission result as a discrete random variable. The probability distribution and cumulative probabilities of remote sensing NO and exhaust smoke data are calculated and shown in Figure 4.
According to the statistical analysis results of the NO emission remote sensing test data in Figure 4a, the cumulative distribution probability of 1500 ppm, which is the national diesel vehicle NO emission remote sensing detection limit [12], is 96.16%. If it is judged as exceeding the standard a single time, the proportion of high-emission diesel vehicles is 3.84%. If the inversion calculation method for the gasoline engine remote sensing data is applied, the proportion of screened high-emission diesel vehicles reaches 13%, leading to a high error rate of high-emission diesel vehicles. Therefore, the remote sensing inversion calculation method of diesel vehicles’ gaseous emissions based on the correction of the excess air coefficient of diesel engines under driving conditions has good practicability.
According to the statistical analysis results of remote sensing results of diesel vehicle smoke emission opacities in Figure 4b, corresponding to 30% of the diesel vehicle exhaust smoke opacity remote sensing limit [12], the cumulative distribution probability is 97.08%. If it is judged as exceeding the standard a single time, the proportion of diesel vehicles exceeding the standard is 2.92%.
The vehicle emission remote sensing database will be updated with the change in vehicle fleet composition due to the increase in low-emission vehicles and the elimination of old vehicles or high-emission diesel vehicles. With the real-time update of vehicle emission remote sensing data in the database, the remote sensing emission limit for screening high-emission vehicles can also be dynamically updated in real time with the change in vehicle fleet composition, so as to effectively screen high-emitting vehicles using remote sensing.

4. Conclusions

The principle of remote sensing detection is to inversely calculate the absolute concentration of gaseous pollutants in vehicle exhaust according to the relative volume concentration ratio of each exhaust component to CO2 in the vehicle exhaust plume. In this paper, integrated remote sensing monitoring equipment designed for gasoline and diesel vehicles was proposed to address the vehicle fuel types separately, that is, different inversion calculation methods are used for the remote sensing measurement of the absolute concentrations of gaseous emissions of gasoline and diesel vehicles, and a dynamic analysis method of big data was proposed for the vehicle remote sensing test data. Finally, the remote sensing results of vehicle exhaust emissions in the Beijing area are analyzed.
Because the combustion mechanism of gasoline engines is different from that of diesel engines, different inversion calculation methods of remote sensing data must be adopted. The absolute concentration of gasoline vehicle gaseous emissions measured by remote sensing can be calculated by the inversion method of gasoline engines based on the theoretical air–fuel ratio combustion mechanism. However, there is a great deal of residual air in the combustion process of diesel engines, so the absolute concentrations of gaseous pollutants such as diesel vehicle NO measured by remote sensing must be obtained by the inversion calculation method based on the correction of excess air coefficient.
From the statistical analysis results of remote sensing results of vehicle exhaust emissions in Beijing, it can be seen that using big data statistical analysis methods can quickly screen high-emission vehicles. According to the remote sensing detection results of gasoline and diesel vehicles in Beijing, based on the current remote sensing detection limit, the screening proportion of high-emission vehicles is 2–5%, which meets the current regulatory needs of high-emission vehicle screening.
With the continuous use of new cars and the continuous elimination and updating of old cars, the composition of vehicle ownership will change, and vehicle emissions will gradually decrease. The remote sensing detection limit value of vehicle emissions needs to be updated over time; otherwise, it will not fulfil its role in vehicle emissions supervision. However, the updating of emission standards has a certain periodicity, in which case the big data dynamic statistical analysis method of emission remote sensing results can dynamically determine the emission screening threshold of high-emission vehicles so as to achieve dynamic and accurate screening of high-emission vehicles.

Author Contributions

Conceptualization, X.R., Y.L. and L.H.; data curation, W.L. and L.H.; funding acquisition, X.R., N.J., Y.L. and W.L.; investigation, N.J., W.L. and Z.Z.; methodology, N.J. and Z.Z.; project administration, X.R.; writing—original draft, L.H. All authors have read and agreed to the published version of the manuscript.

Funding

This work was supported by the National Key R&D Plan funded by the Ministry of Science and Technology (2018YFE0106800-001) and funding from Weichai Power Co., Ltd.

Institutional Review Board Statement

Not applicable.

Informed Consent Statement

Not applicable.

Data Availability Statement

The data presented in this study are available at the request of readers.

Acknowledgments

The authors are grateful to all participants in the experiment and the anonymous reviewers for their valuable and helpful comments.

Conflicts of Interest

The authors declare no conflict of interest.

References

  1. Shindell, D.; Faluvegi, G.; Walsh, M.; Anenberg, S.C.; Van Dingenen, R.; Muller, N.Z.; Austin, J.; Koch, D.; Milly, G. Climate, health, agricultural and economic impacts of tighter vehicle-emission standards. Nat. Clim. Change 2011, 1, 59–66. [Google Scholar] [CrossRef]
  2. Strak, M.; Janssen, N.; Beelen, R.; Schmitz, O.; Vaartjes, I.; Karssenberg, D.; van den Brink, C.; Bots, M.L.; Dijst, M.; Brunekreef, B.; et al. Long-term exposure to particulate matter, NO2 and the oxidative potential of particulates and diabetes prevalence in a large national health survey. Environ. Int. 2017, 108, 228–236. [Google Scholar] [CrossRef] [PubMed]
  3. Carslaw, D.C.; Rhys-Tyler, G. New insights from comprehensive on-road measurements of NOx, NO2 and NH3 from vehicle emission remote sensing in London, UK. Atmos. Environ. 2013, 81, 339–347. [Google Scholar] [CrossRef] [Green Version]
  4. Liu, J.; Yin, H.; Ge, Y.; Wang, X.; Huang, Y. Remote sensing method for evaluation of vehicle actual road pollution status. Environ. Sci. Res. 2017, 30, 1607–1612. (In Chinese) [Google Scholar]
  5. Bishop, G.A.; Starkey, J.R.; Ihlenfeldt, A.; Williams, W.J.; Stedman, D.H. IR long-path photometry: A remote sensing tool for automobile emissions. Anal. Chem. 1989, 61, 671A–677A. [Google Scholar] [CrossRef] [PubMed]
  6. Popp, P.J.; Bishop, G.A.; Stedman, D.H. Development of a high-speed ultraviolet spectrometer for remote sensing of mobile source nitric oxide emissions. J. Air Waste Manag. Assoc. 1999, 49, 1463–1468. [Google Scholar] [CrossRef] [PubMed]
  7. USEPA.Epa/Aa/Amd/Eig/96-01; User Guide and description For Interim Remote Sensing Program Credit Utility. U.S. Environmental Protection Agency: Washington, DC, USA, 1996.
  8. USEPA.Epa420-P-98-007; Program User Guide for Interim Vehicle Clean Screen Credit Utility. U.S. Environmental Protection Agency: Washington, DC, USA, 1998.
  9. Huang, Y.; Yam, Y.; Lee, C.K.C.; Organ, B.; Zhou, J.L.; Surawski, N.C.; Chan, E.F.C.; Hong, G. Tackling nitric oxide emissions from dominant diesel vehicle models using on-road remote sensing technology. Environ. Pollut. 2018, 243, 1177–1185. [Google Scholar] [CrossRef] [PubMed]
  10. Zheng, L.; Ge, Y.; Liu, J.; Liu, Z. Application of Remote Sensing Method in Vehicle Emission Testing. Automot. Eng. 2015, 37, 150–154. (In Chinese) [Google Scholar]
  11. Ministry of Ecology and Environment of the People’s Republic of China (MEEPRC). China Mobile Source Environmental Management Annual Report (2021); Ministry of Ecology and Environment of the People’s Republic of China (MEEPRC): Beijing, China, 2021. [Google Scholar]
  12. Ministry of Ecology and Environment of the People’s Republic of China (MEEPRC). HJ 845-2017 Measurement Method and Specifications for Exhaust Pollutants from In-Use Diesel Vehicles by Remote Sensing Method; Ministry of Ecology and Environment of the People’s Republic of China (MEEPRC): Beijing, China, 2017. [Google Scholar]
  13. Huang, Y.; Organ, B.; Zhou, J.L.; Surawski, N.C.; Hong, G.; Chan, E.F.; Yam, Y.S. Remote sensing of on-road vehicle emissions: Mechanism, applications and a case study from Hong Kong. Atmos. Environ. 2018, 182, 58–74. [Google Scholar] [CrossRef]
  14. Lee, T.; Frey, H.C. Evaluation of representativeness of site-specific fuel-based vehicle emission factors for route average emissions. Environ. Sci. Technol. 2012, 46, 6867–6873. [Google Scholar] [CrossRef] [PubMed]
  15. Hao, L.; Yin, H.; Wang, J.; Wang, X.; Ge, Y. Remote sensing of NO emission from light-duty diesel vehicle. Atmos. Environ. 2020, 242, 117799. [Google Scholar] [CrossRef]
  16. Pujadas, M.; Domínguez-S aez, A.; De la Fuente, J. Real-driving emissions of circulating Spanish car fleet in 2015 using RSD. Technology. Sci. Total Environ. 2017, 576, 193–209. [Google Scholar] [CrossRef] [PubMed]
  17. Huang, Y.; Organ, B.; Zhou, J.L.; Surawski, N.C.; Yam, Y.; Chan, E.F.C. Characterisation of diesel vehicle emissions and determination of remote sensing cutpoints for diesel highemitters. Environ. Pollut. 2019, 252, 31–38. [Google Scholar] [CrossRef] [PubMed]
  18. Hao, L.; Yin, H.; Wang, J.; Tian, M.; Wang, X.; Ge, Y.; Bernard, Y.; Sjödin, Å. Research on Analysis Method of Remote Sensing Results of NO Emission from Diesel Vehicles. Atmosphere 2022, 13, 1100. [Google Scholar] [CrossRef]
  19. Ministry of Public Security of the People’s Republic of China (MPSPRC). GA 804-2014. Types of Motor Vehicle–Terms and Definitions; Ministry of Public Security of the People’s Republic of China (MPSPRC): Beijing, China, 2014. [Google Scholar]
  20. Beijing Municipal Bureau of Ecology and Environment. Limits and Measurement Method for Exhaust Pollutants from In-Use Gasoline Vehicle by Remote Sensing; Beijing Municipal Bureau of Ecology and Environment: Beijing, China, 2022. [Google Scholar]
  21. Environmental Protection Agency (EPA). Control of Air Pollution from New Motor Vehicles: Heavy-Duty Engine and Vehicle Standards. Federal Register/Vol. 87, No. 59/Monday, March 28, 2022/Proposed Rules; U.S. Environmental Protection Agency: Washington, DC, USA, 2022. [Google Scholar]
  22. GB18285-2018; Limits and Measurement Methods for Emissions from Gasoline Vehicles under Two-Speed Idle Conditions and Simple Driving Mode Conditions. Ministry of Ecology and Environment of the People’s Republic of China (MEEPRC): Beijing, China, 2018.
  23. GB3847-2018; Limits and Measurement Methods for Emissions from Diesel Vehicles Under Free Acceleration and Lugdown Cycle. Ministry of Ecology and Environment of the People’s Republic of China (MEEPRC): Beijing, China, 2018.
Figure 1. Schematic of vehicle emission remote sensing system. 1. License plate camera; 2. main control computer; 3. weather station; 4. light source and detector; 5. reflector; 6. speedometer.
Atmosphere 13 01862 g001
Figure 2. Excess air coefficient map as a function of vehicle speed and acceleration. (a) Excess air coefficient map for light-duty diesel vehicle. (b) Excess air coefficient map for medium-duty diesel vehicle. (c) Excess air coefficient map for heavy-duty diesel vehicle.
Atmosphere 13 01862 g002aAtmosphere 13 01862 g002b
Figure 3. Statistical analysis of emissions from in-use gasoline vehicles. (a) CO emissions; (b) HC emissions; (c) NO emissions.
Atmosphere 13 01862 g003
Figure 4. Statistical analysis of remote sensing test data of diesel vehicle emissions. (a) NO emissions. (b) Exhaust smoke opacity.
Atmosphere 13 01862 g004
Table 1. Statistical analysis results of in-use gasoline vehicle emissions.
ItemExhaust Emission Concentration
CO (%)HC (10−6)NO (10−6)
Mean0.80150.332204.003
Standard deviation0.719117.032417.138
Minimum0.0000.0000.000
Maximum10.03014,040.86010,932.260
Cumulative distribution probability25%0.2208.13024.680
50%0.54017.00055.000
75%1.07456.800170.000
85%1.49076.330309.240
95%2.340139.000841.050
Publisher’s Note: MDPI stays neutral with regard to jurisdictional claims in published maps and institutional affiliations.

