

Intertropical Convergence Zone as the Possible Source Mechanism for Southward Propagating Medium-Scale Traveling Ionospheric Disturbances over South American Low-Latitude and Equatorial Region
 , , , , , , , and
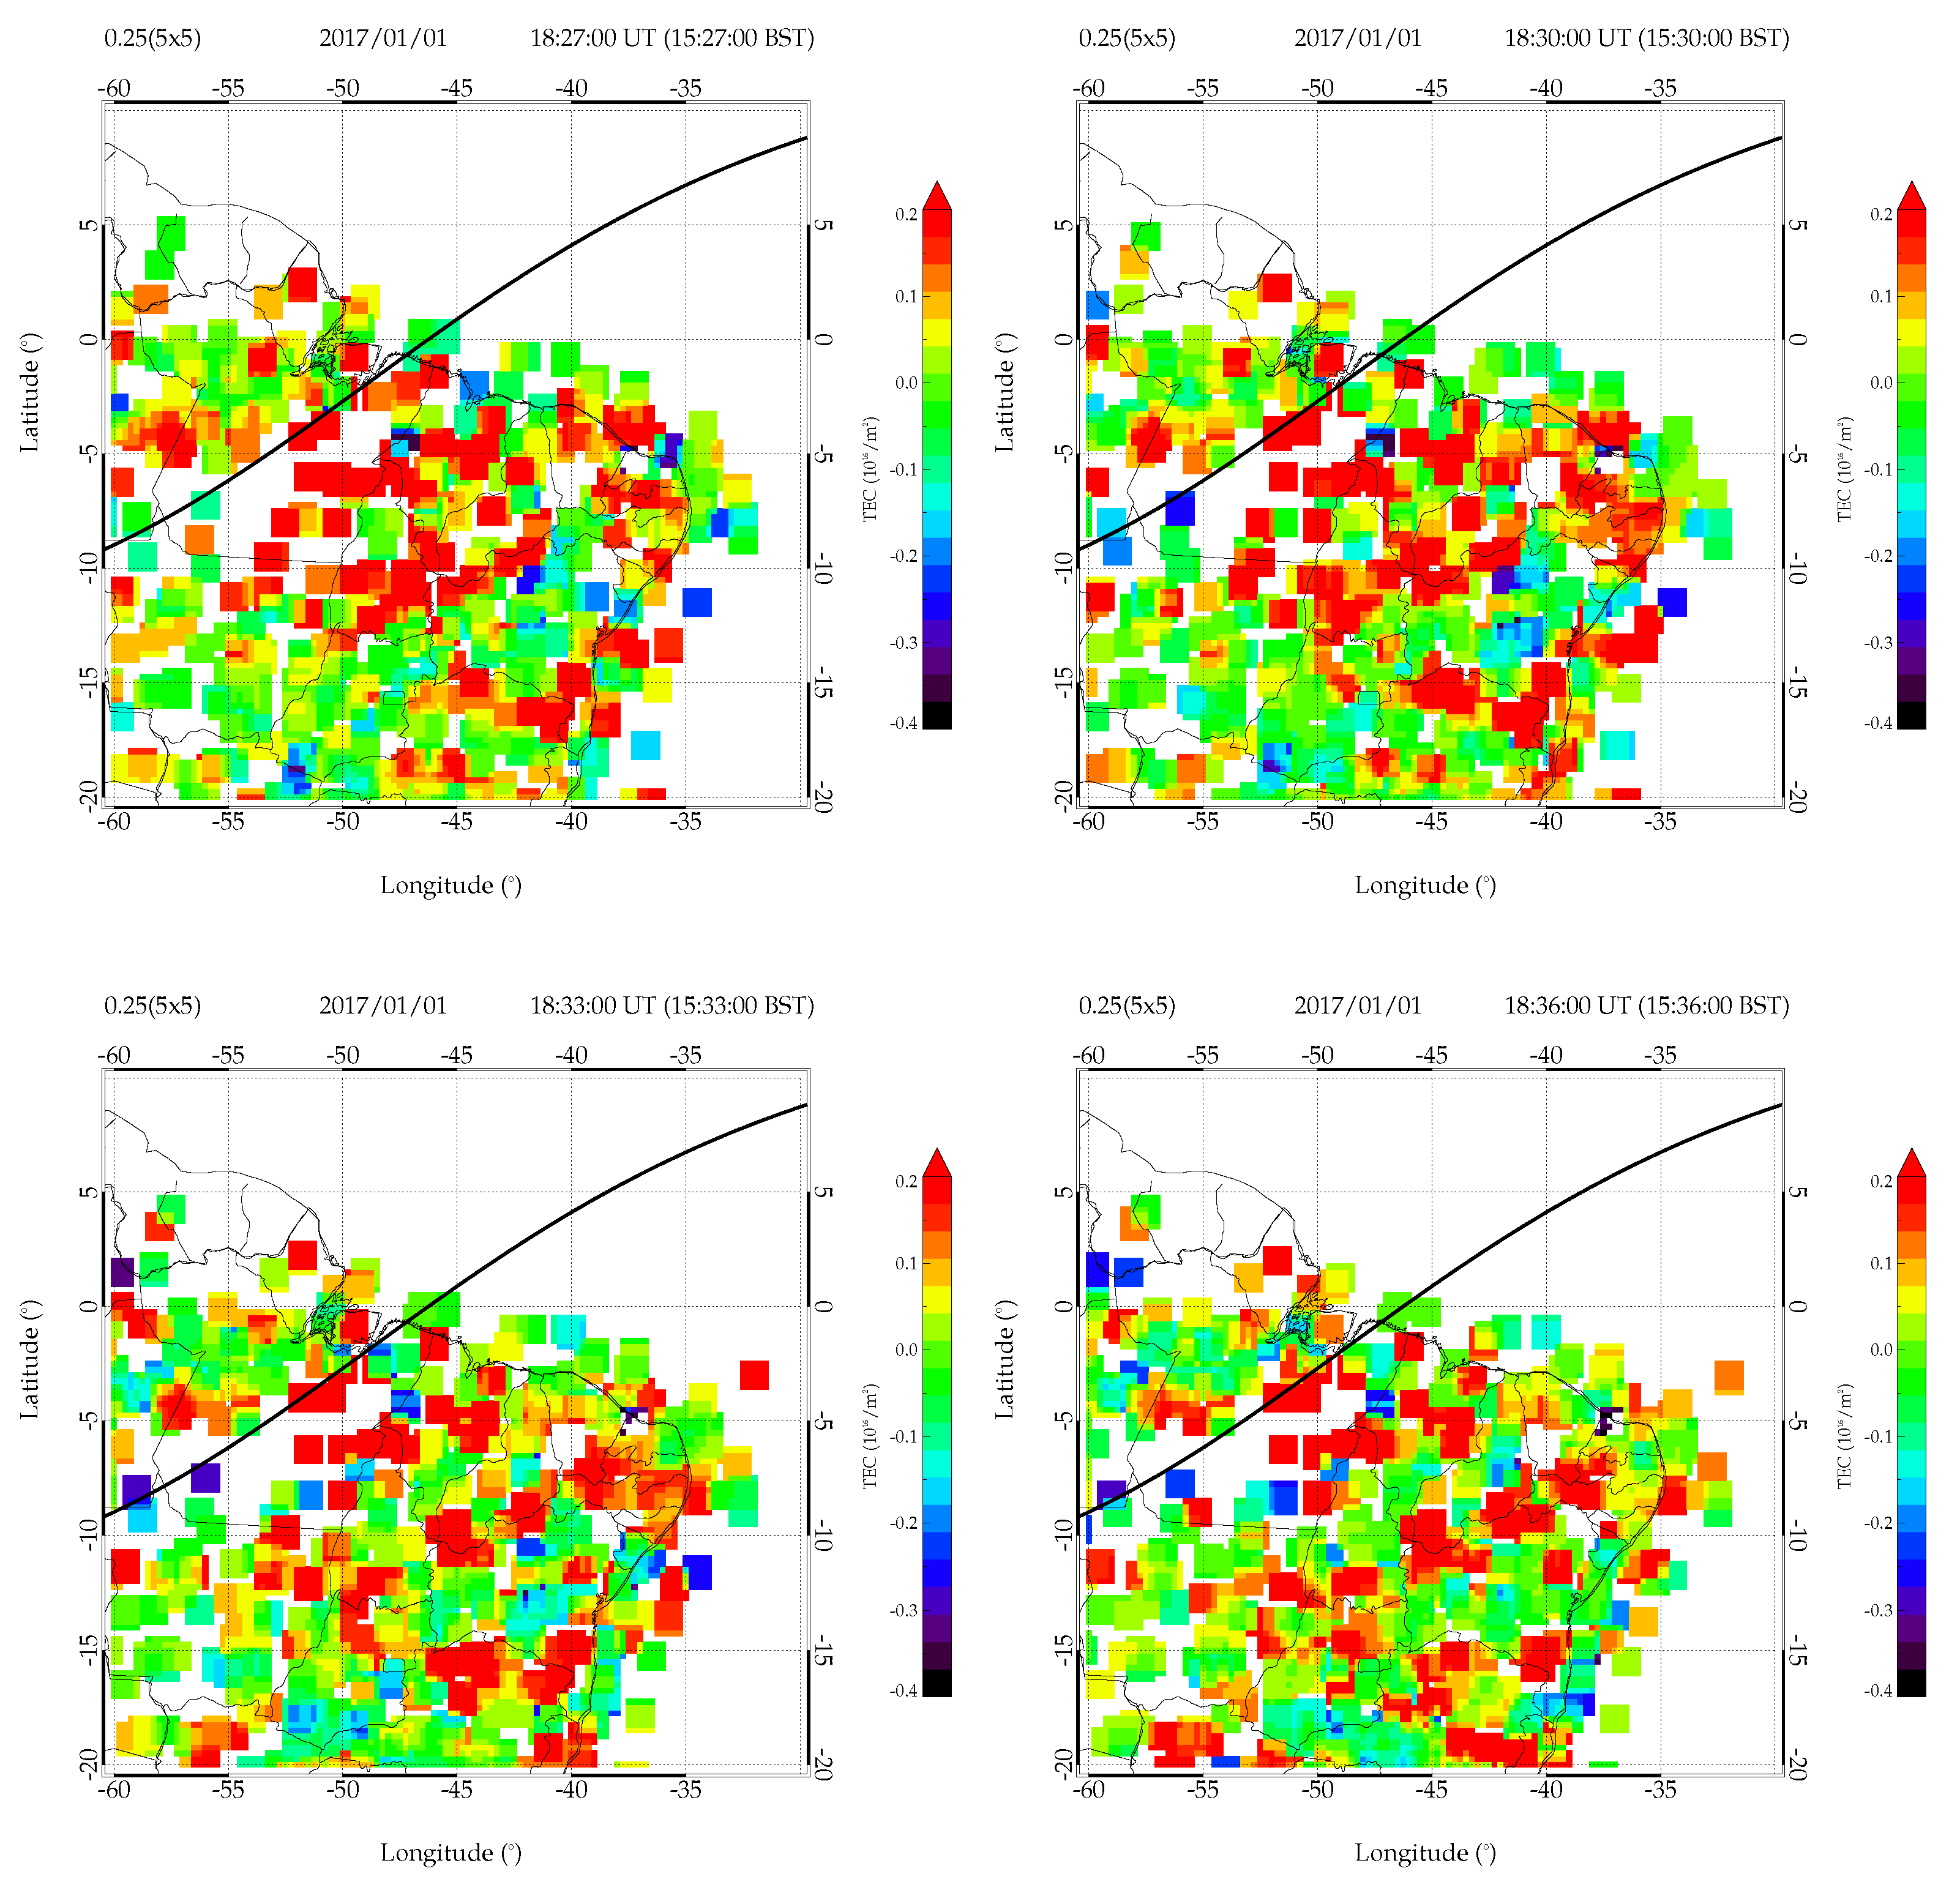
Abstract
:1. Introduction
2. Materials and Methods
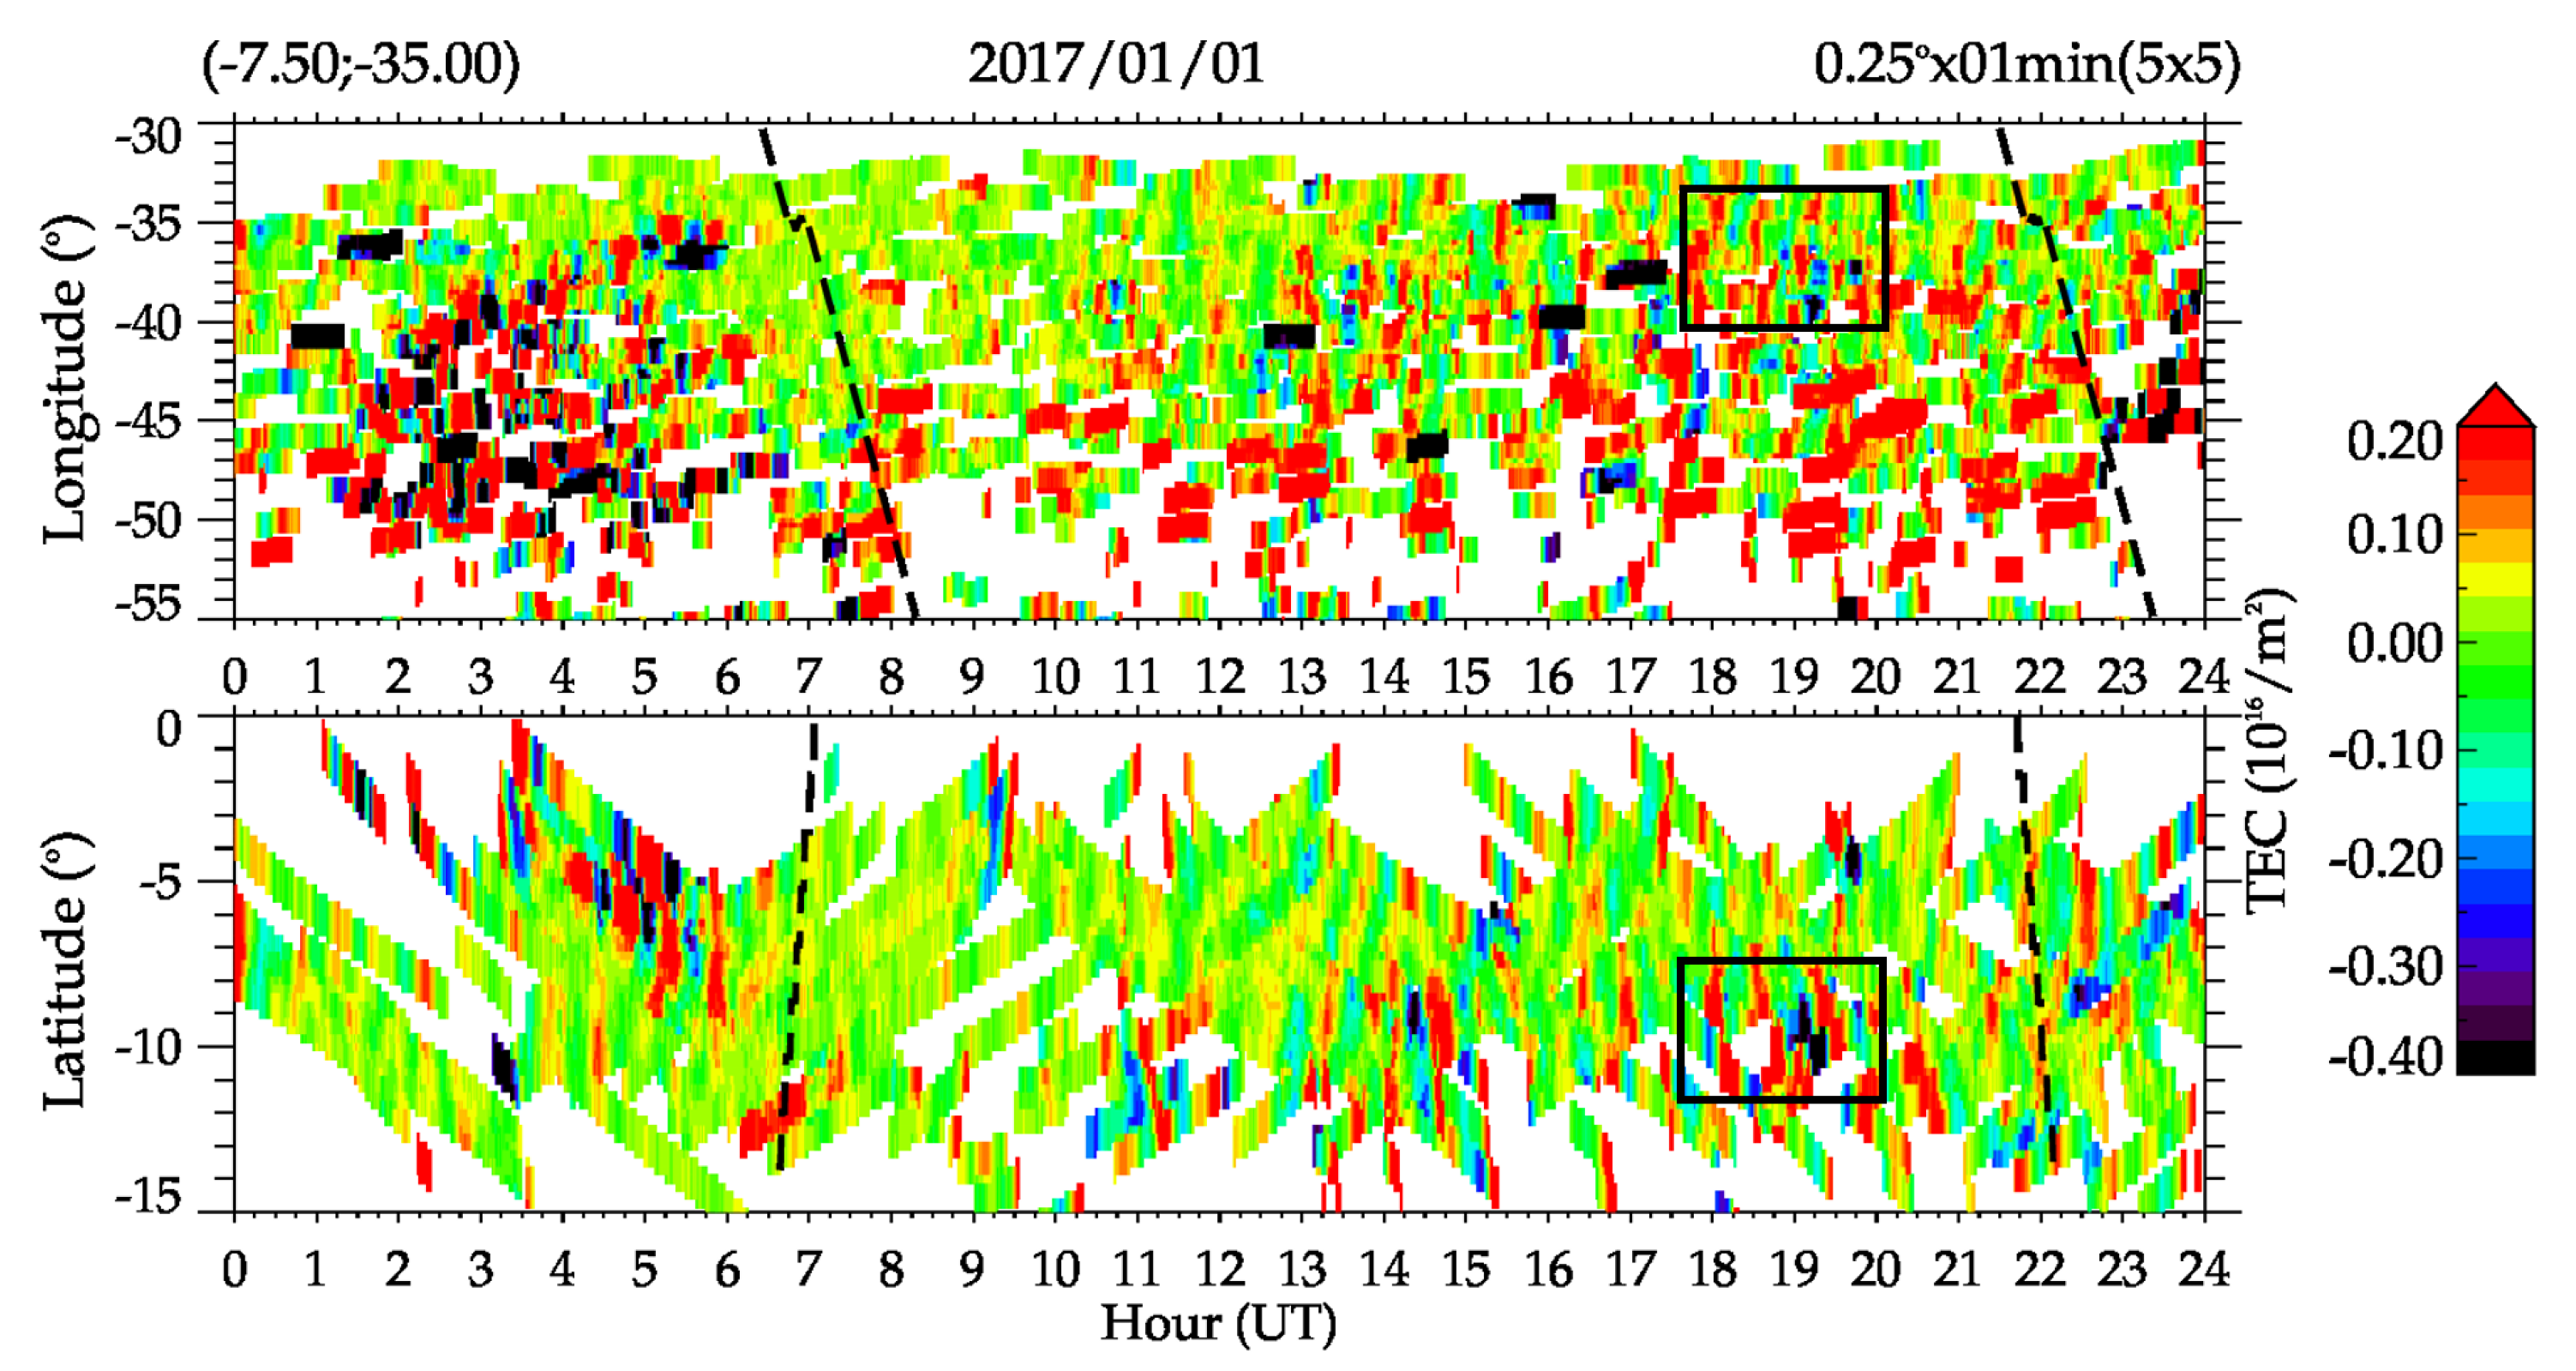
2.1. Method of Calculating MSTID Characteristics
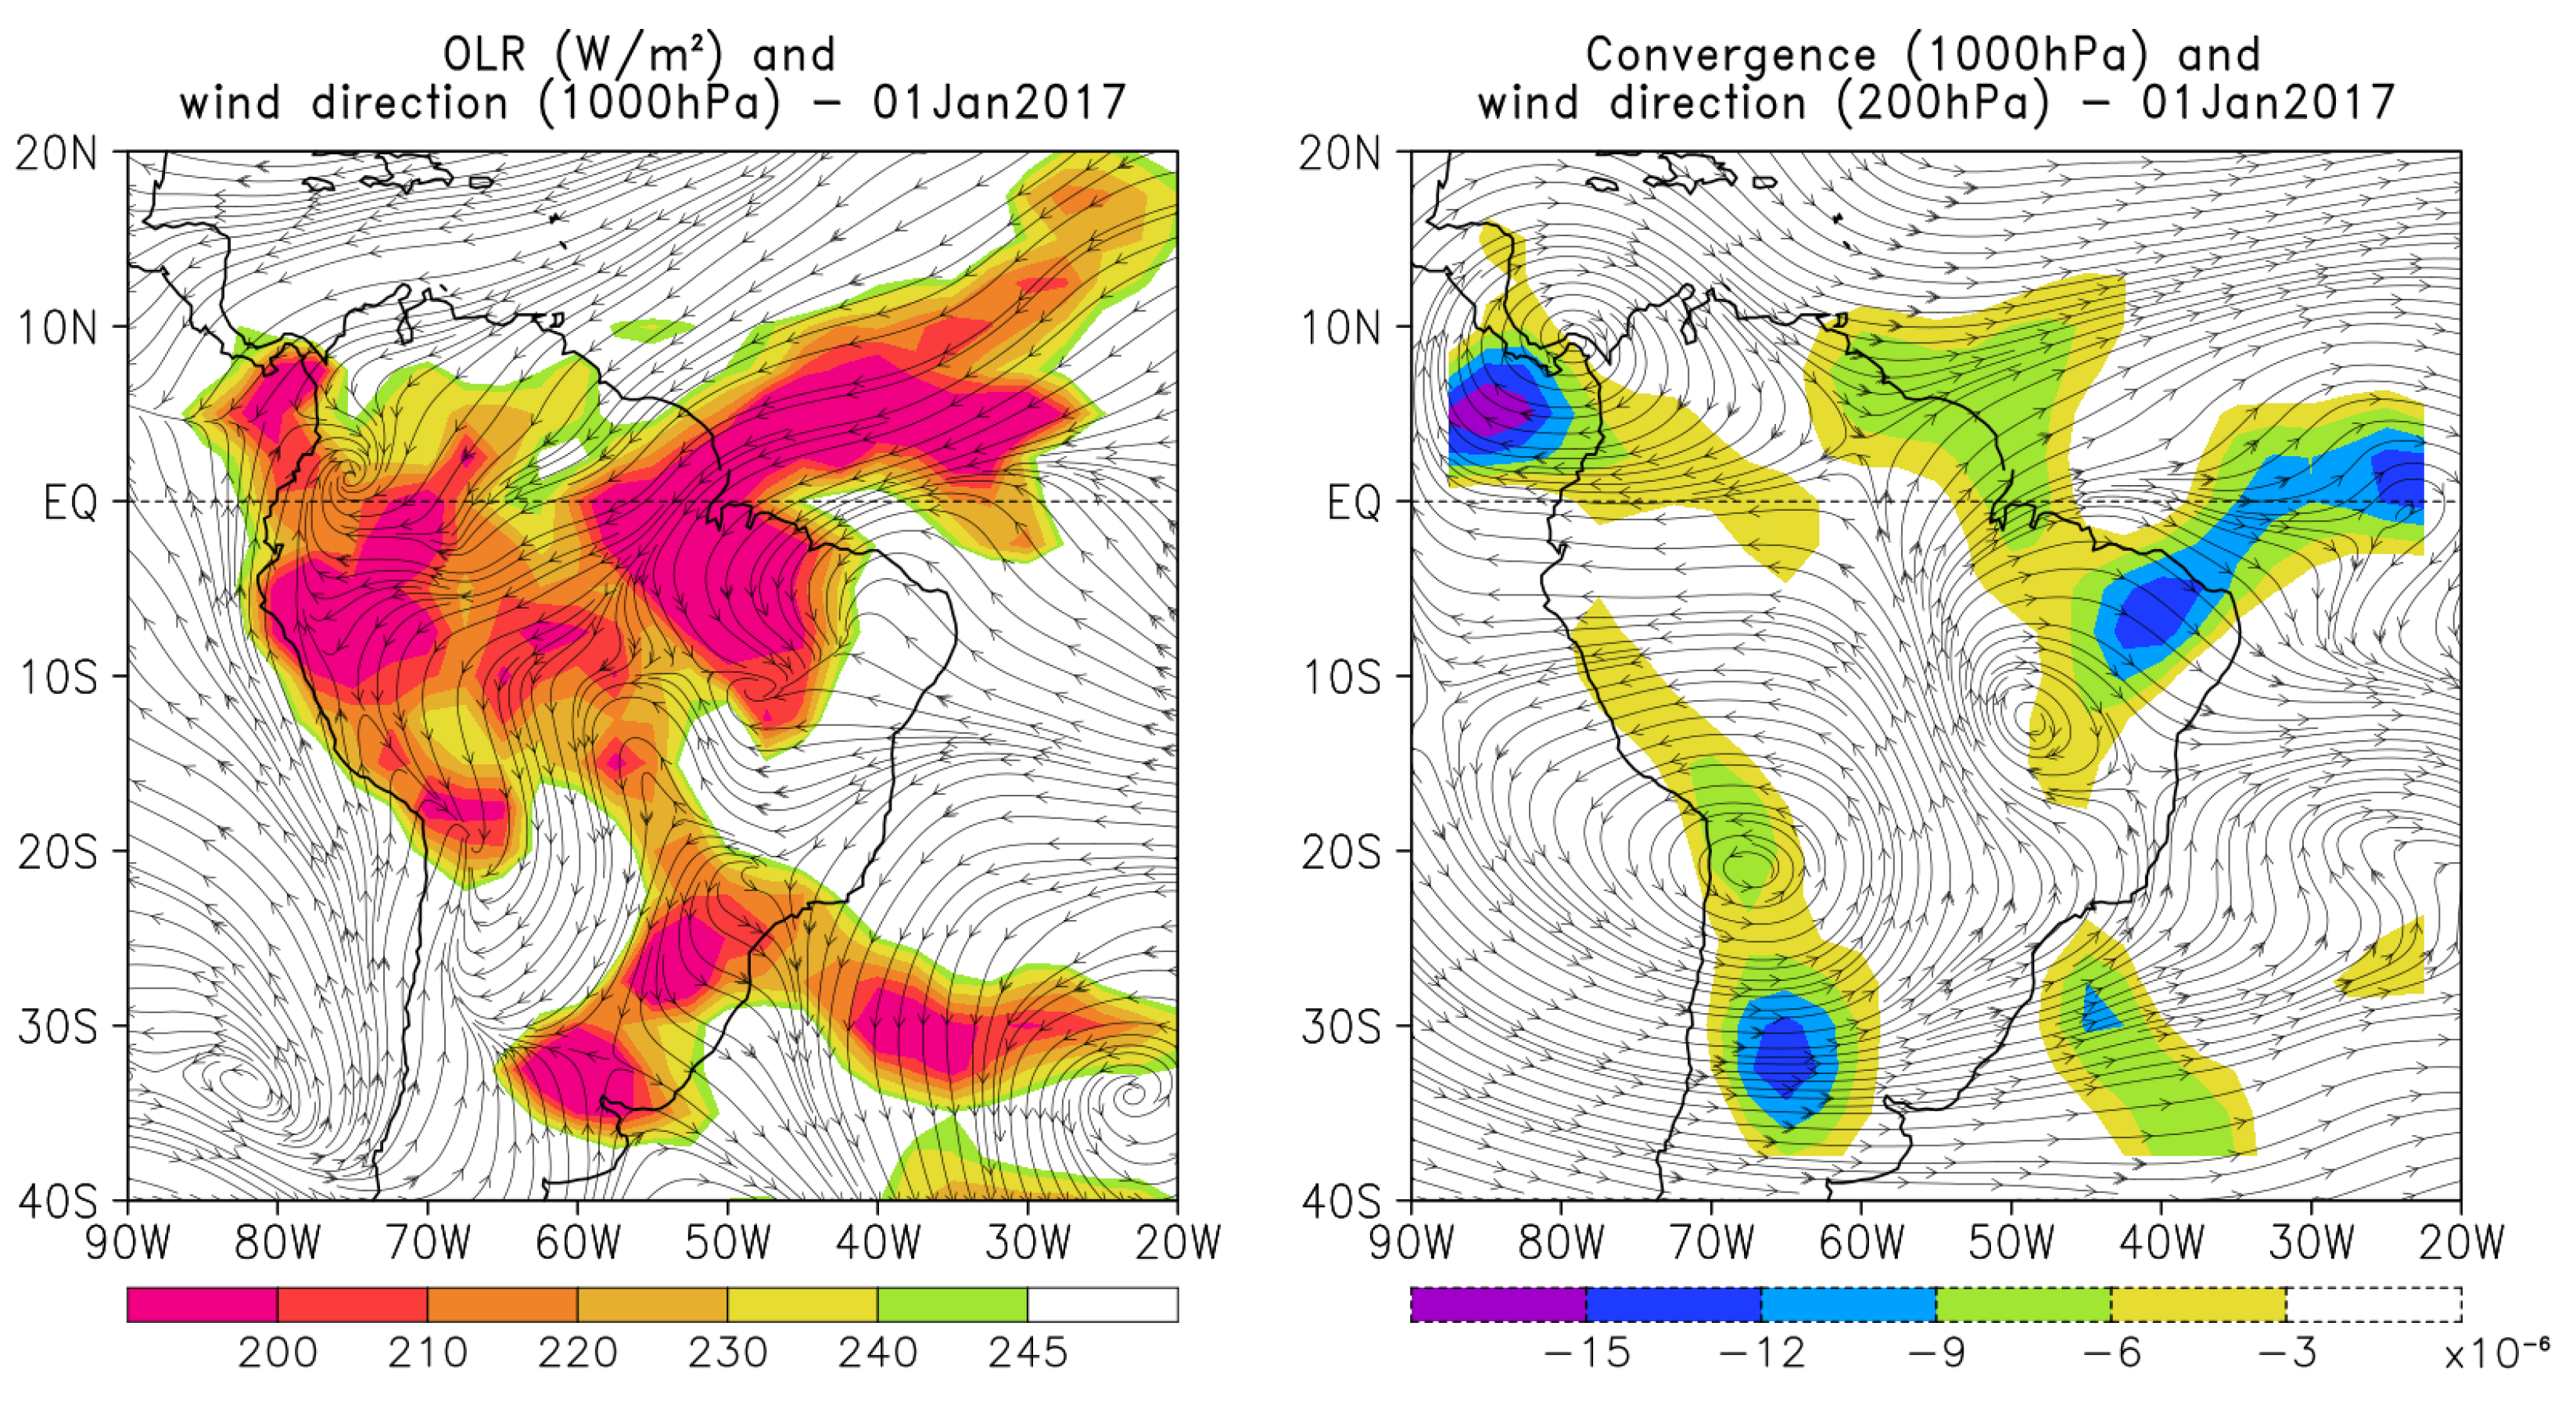
2.2. Method of Identifying the ITCZ
3. Results and Discussion
3.1. Characteristics of MSTIDs Propagating Southeastward
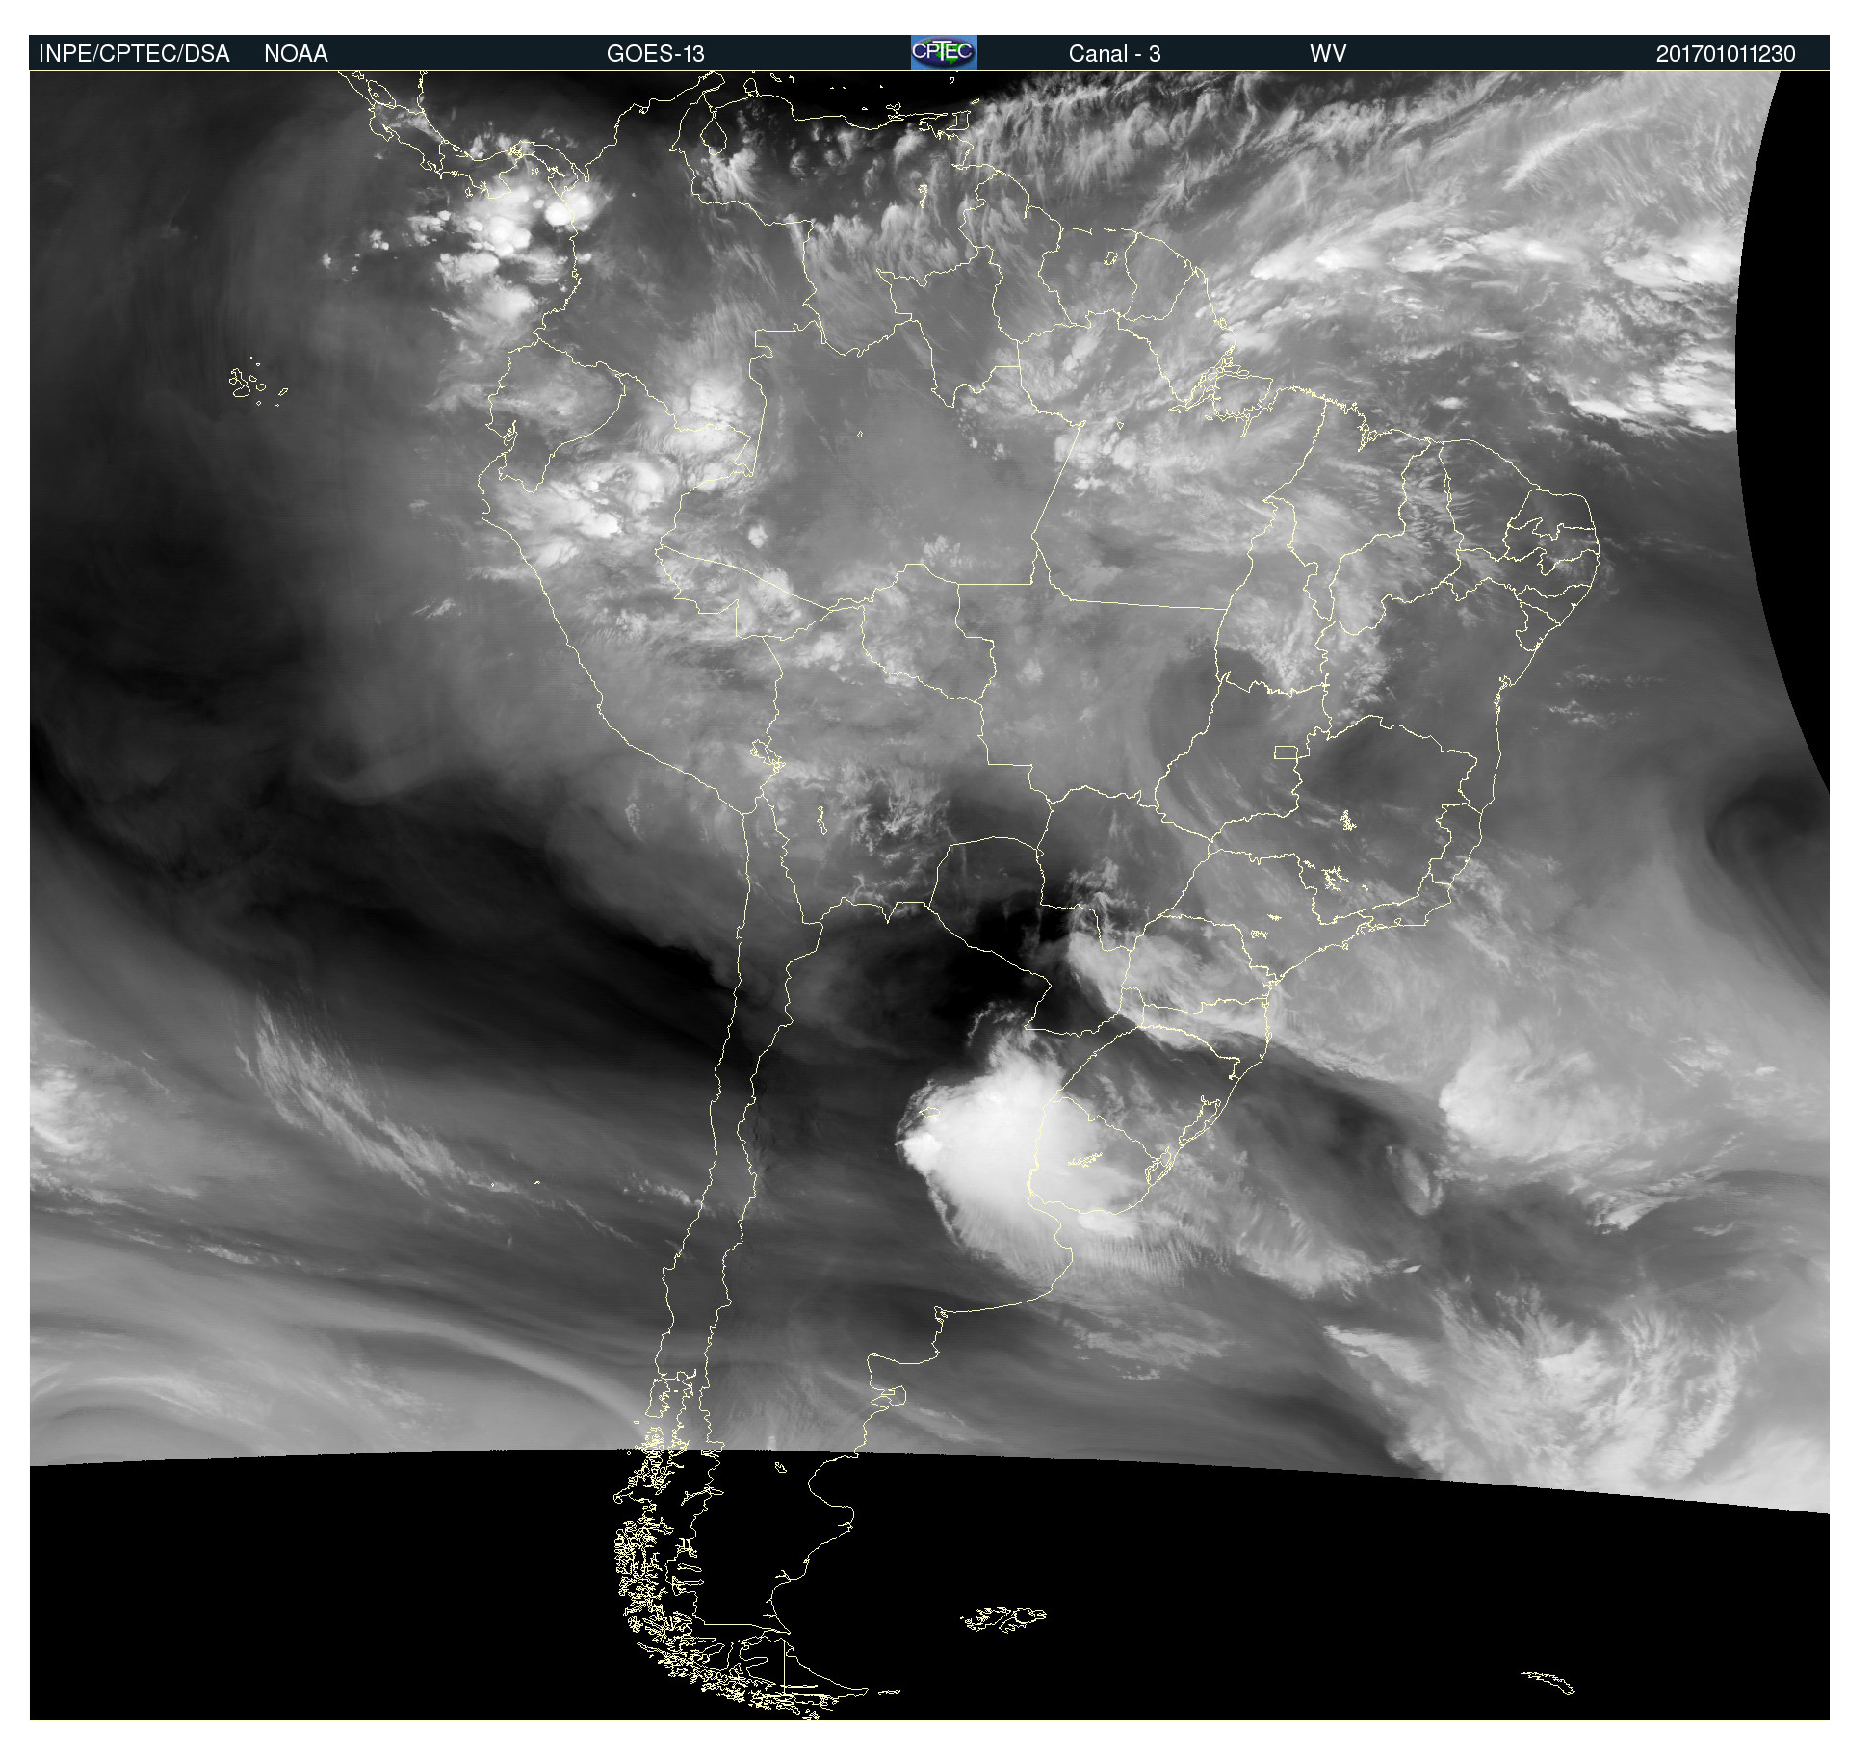
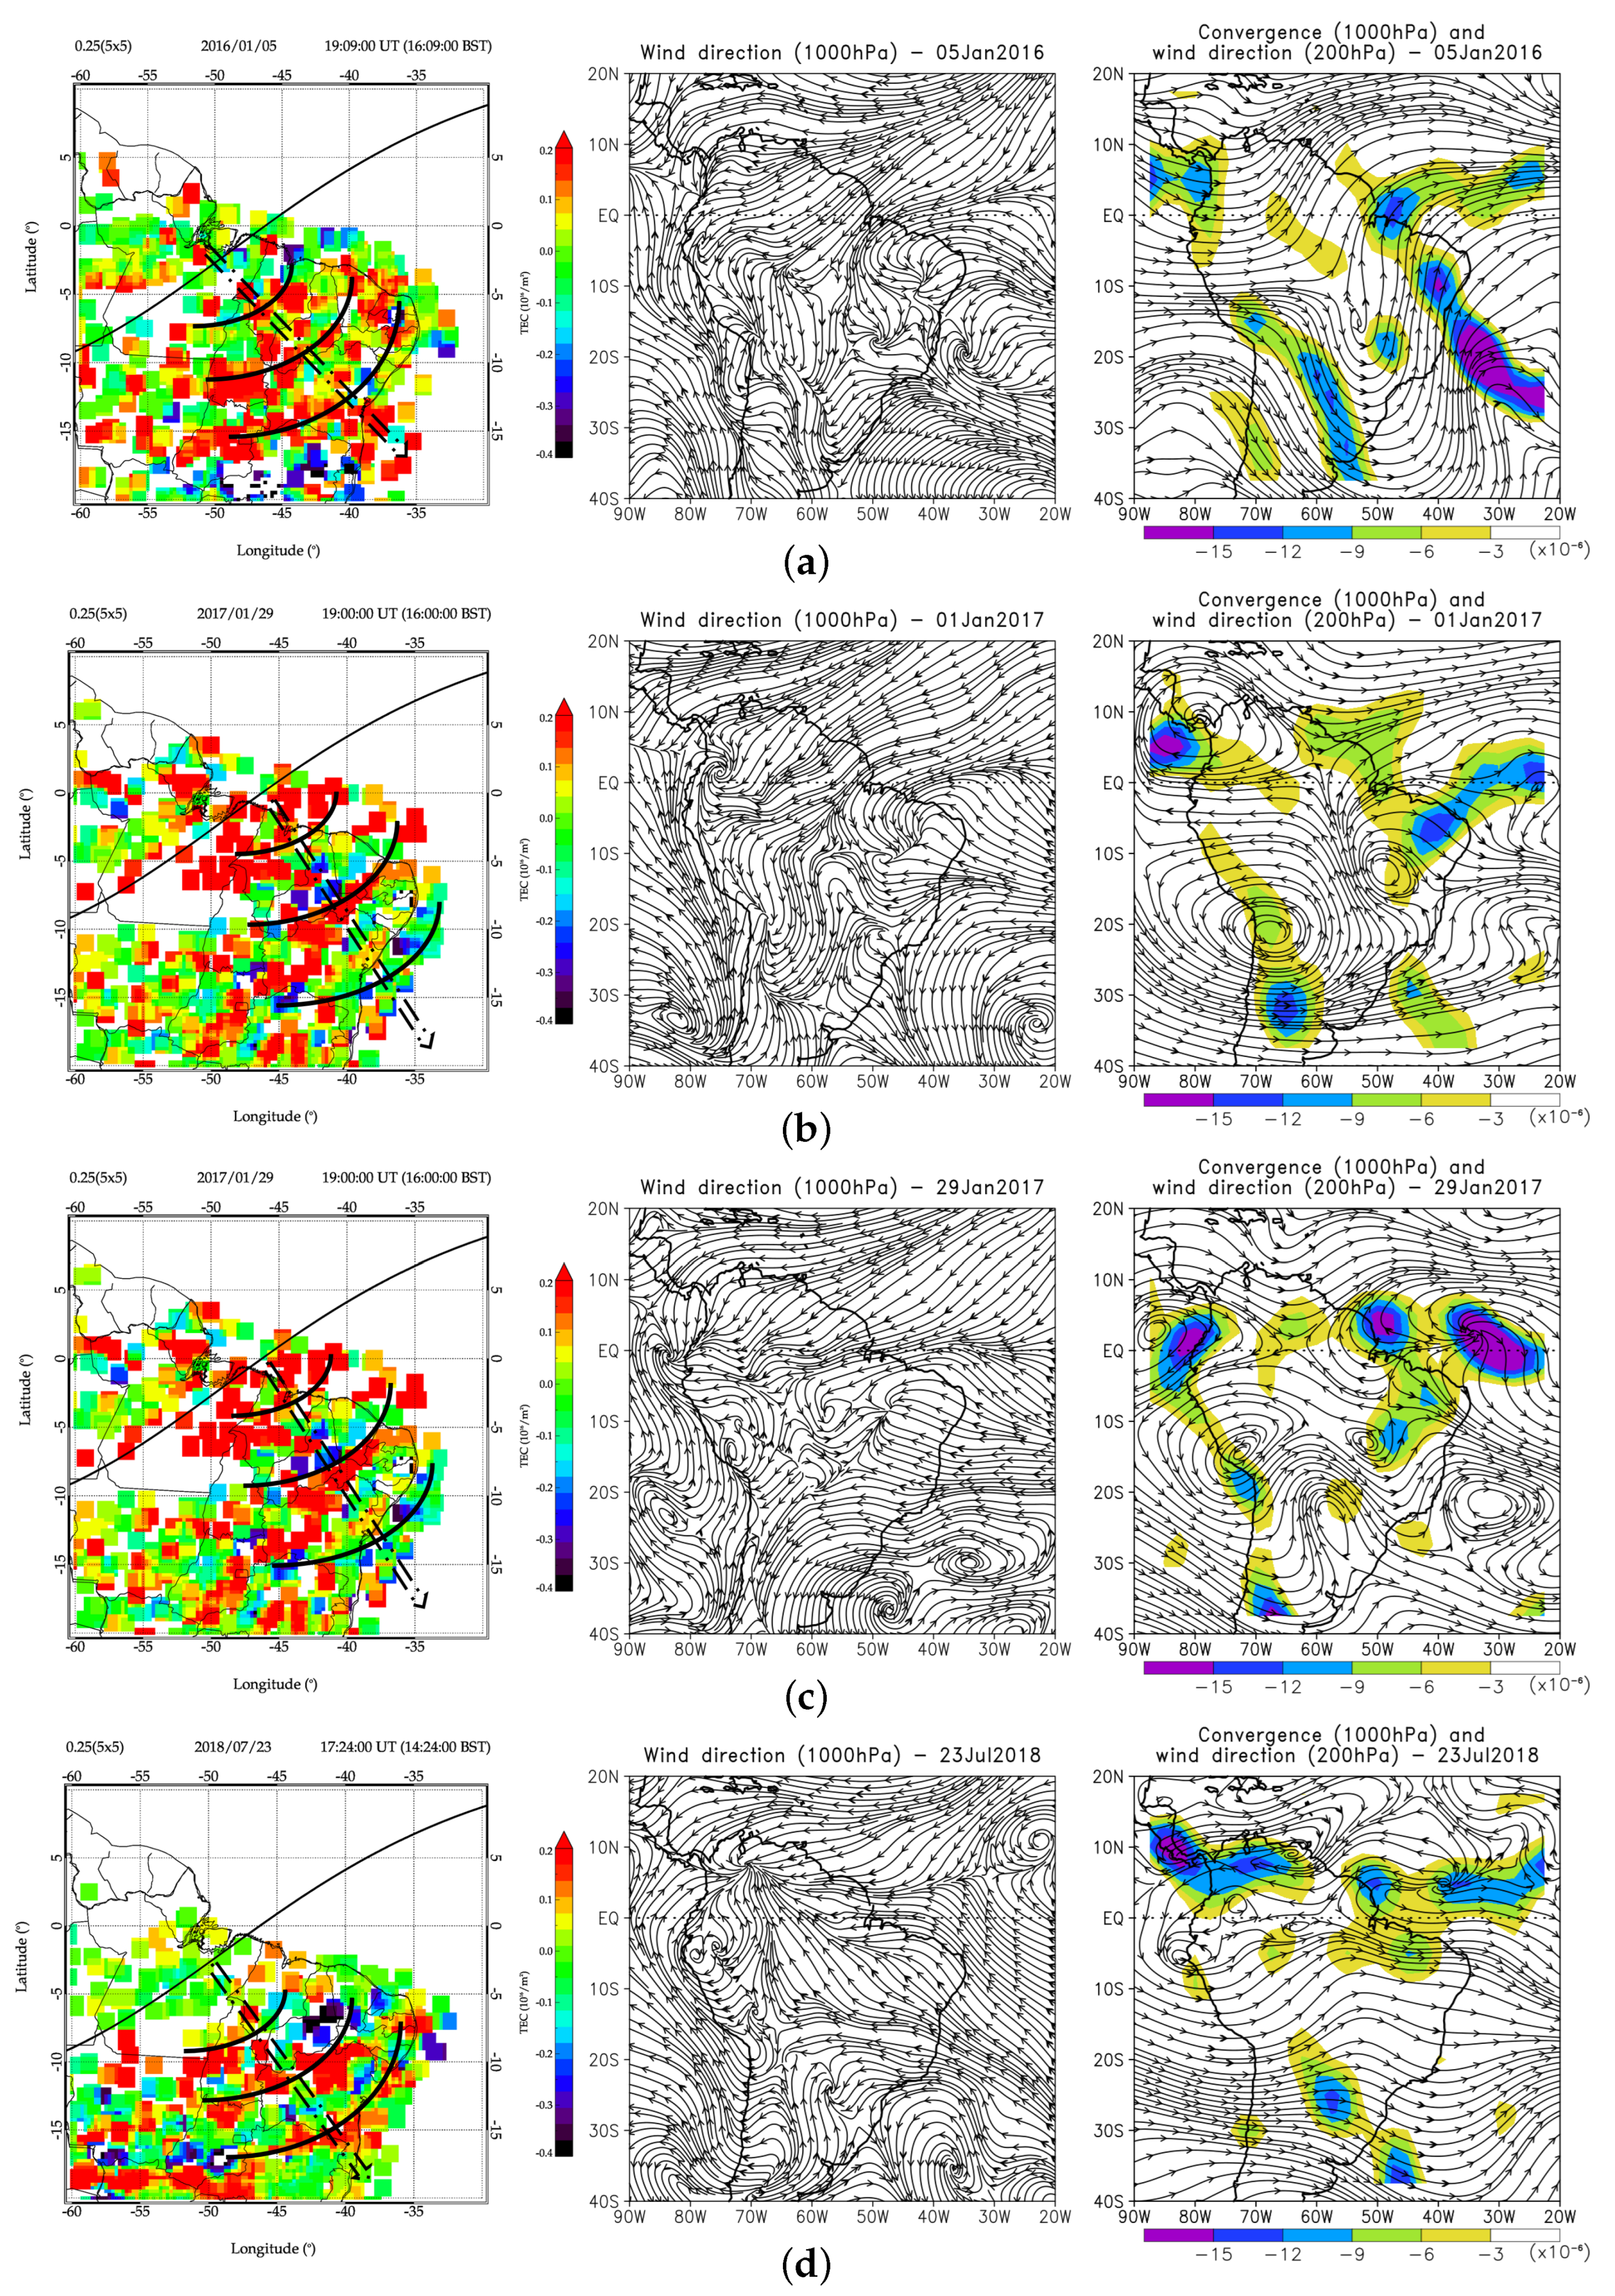
3.2. Case Study of MSTIDs and ITCZ Positions
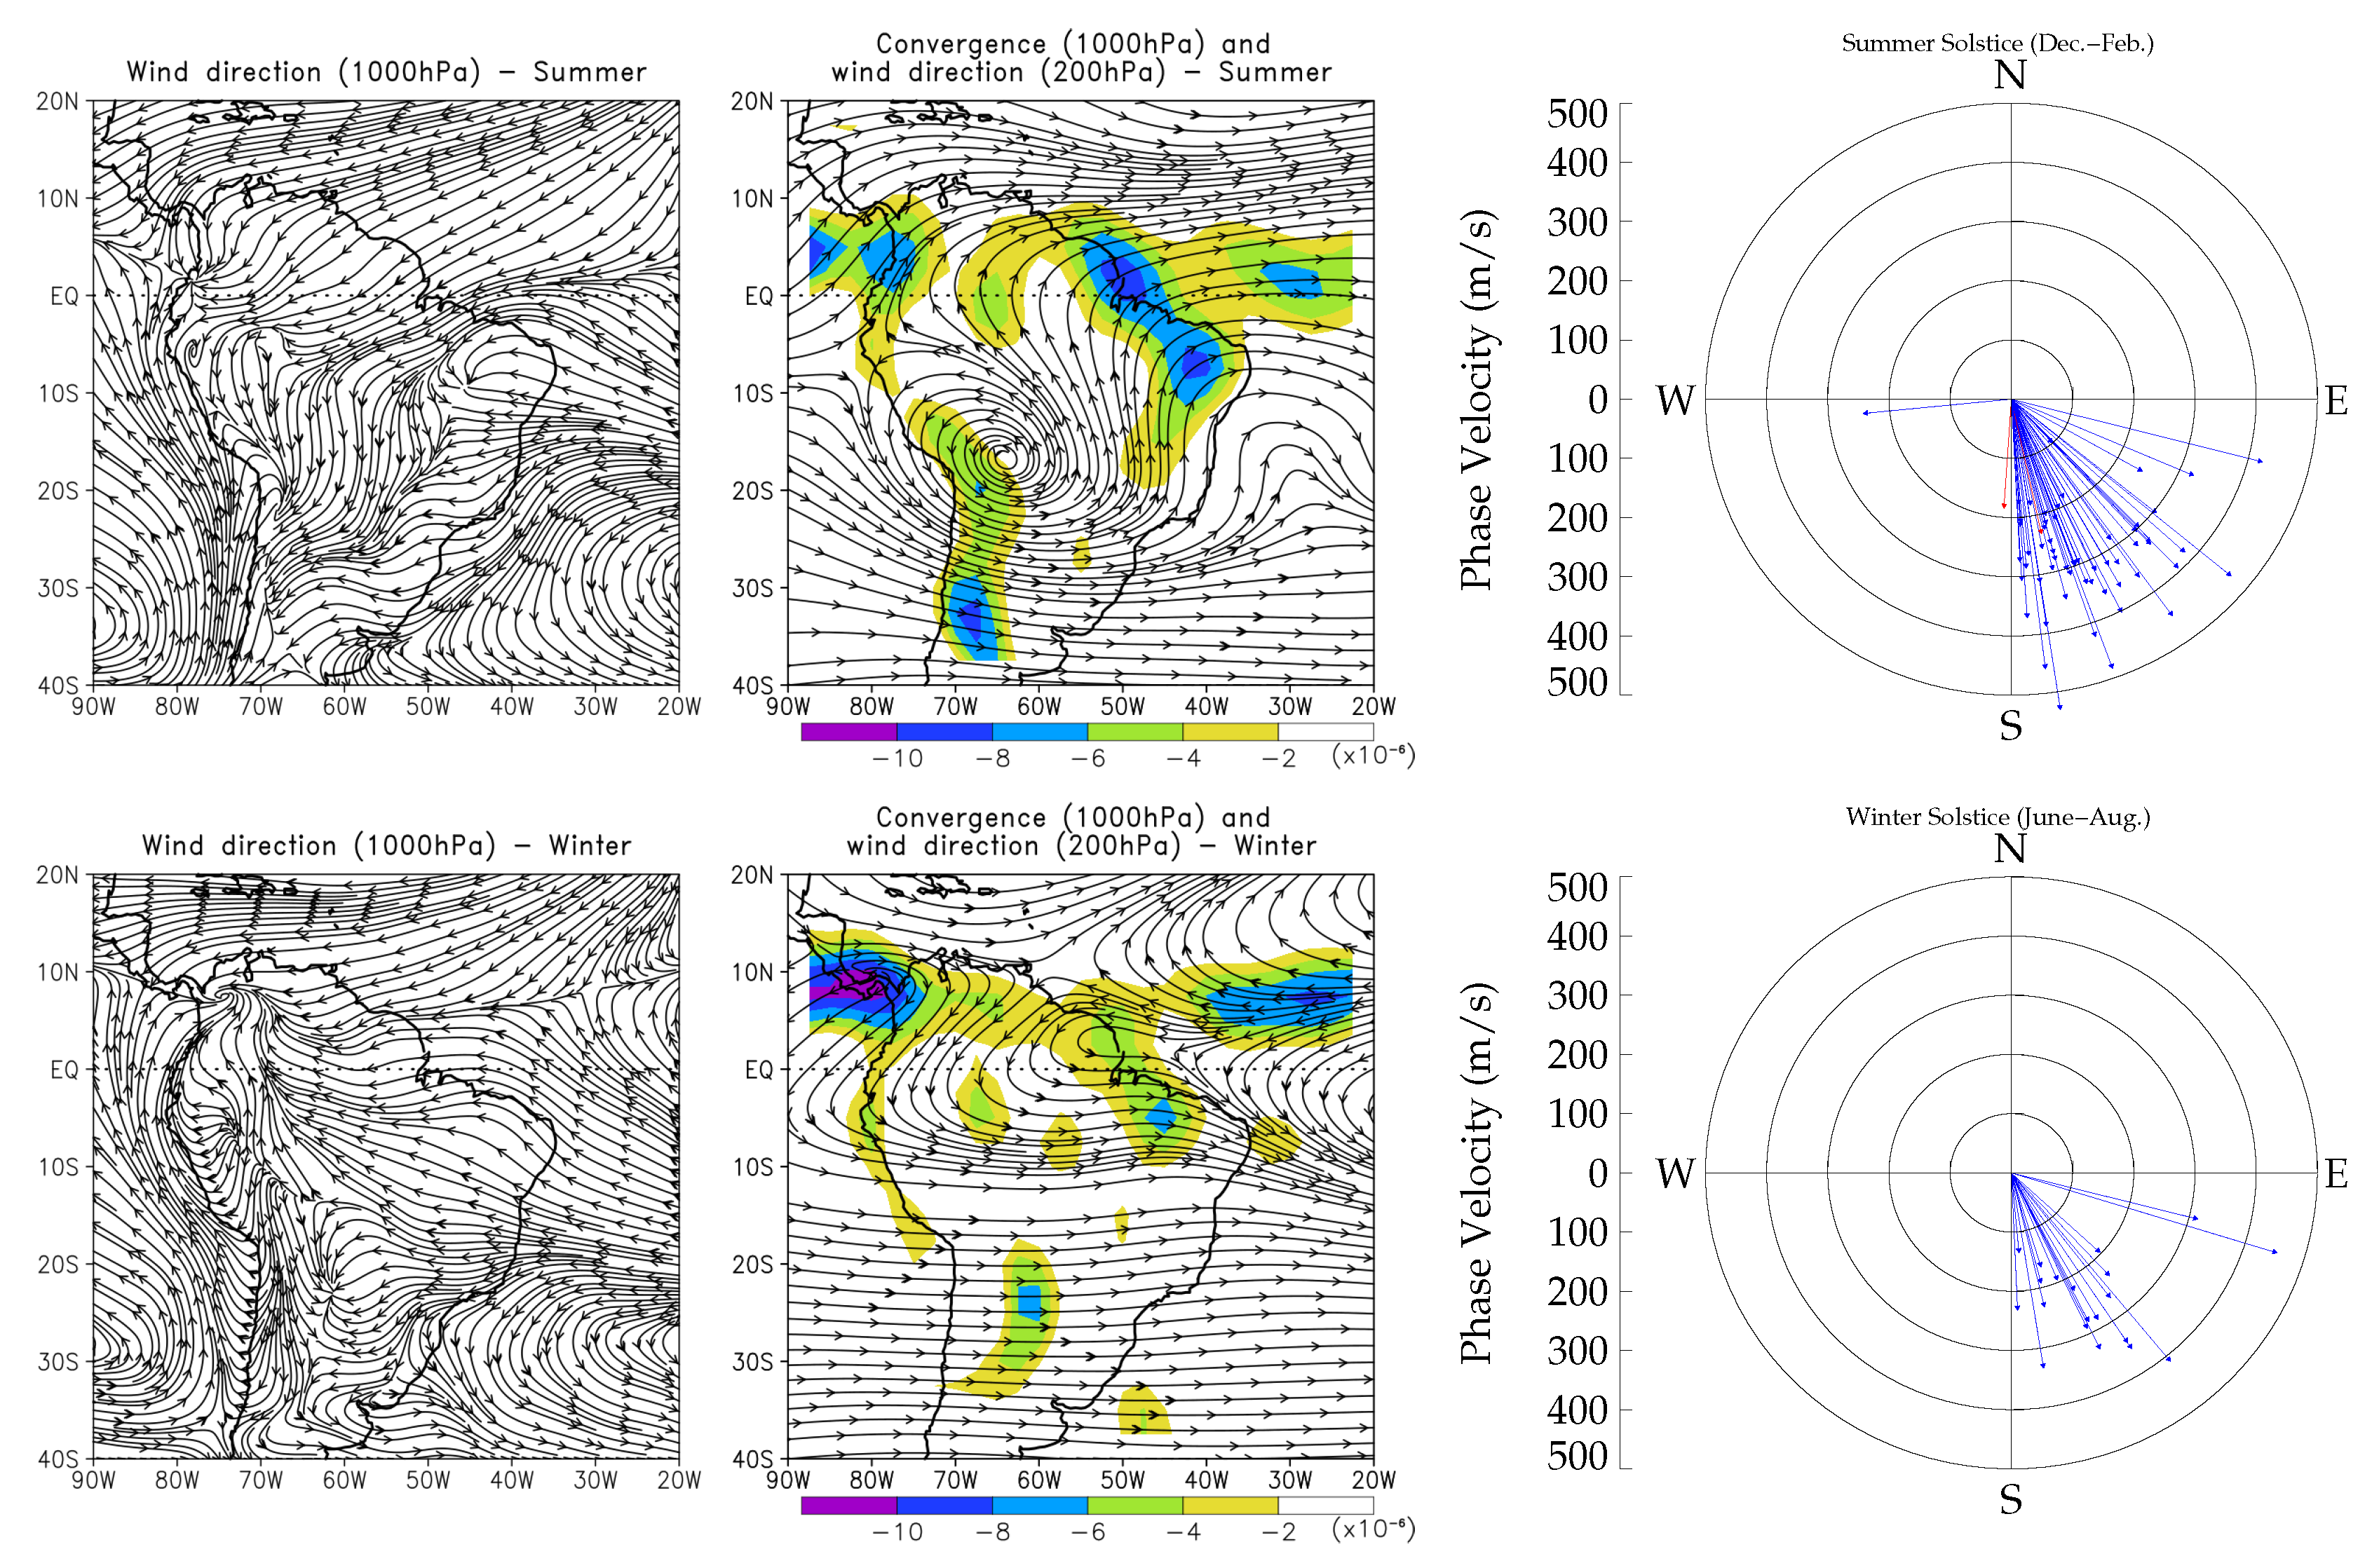
3.3. Seasonal Migration of ITCZ and Variations in MSTIDs Propagation Direction
4. Conclusions
- The propagation direction of a total of 144 MSTIDs was observed during the days the ITCZ was active, and the statistical analysis of the seasonal variability of the MSTIDs was thoroughly recorded. We found that in the winter and equinoxes, 20 and 44 MSTIDs were observed, respectively. Moreover, in summer, 80 MSTIDs were observed propagating southeastward.
- The seasonal variation in the occurrence of the observed MSTIDs propagating to the southeast direction coincided with the ITCZ occurrences. The ITCZ lies to the north of the equator, between 10° and 15° N during winter, which decreased the occurrence of MSTIDs propagating southeastward. However, in summer, the ITCZ migrated to the Southern Hemisphere (0° to 5° S), which triggered more MSTIDs propagating southeastward.
- In the winter, when the ITCZ migrates to the Northern Hemisphere between 10° N and 15° N, 20 MSTIDs propagated southeastward. We realized that during summer when the ITCZ lies within the continent, between 0° S and S, 80 MSTIDs were observed propagating southeastward.
- We found and showed for the first time that the day-to-day observation of the ITCZ position and MSTID propagation directions are consistent.
- With regard to the above new findings, we report that the MSTIDs propagating southeastward over the South American region are induced by the atmospheric gravity waves generated by the ITCZ in the troposphere.
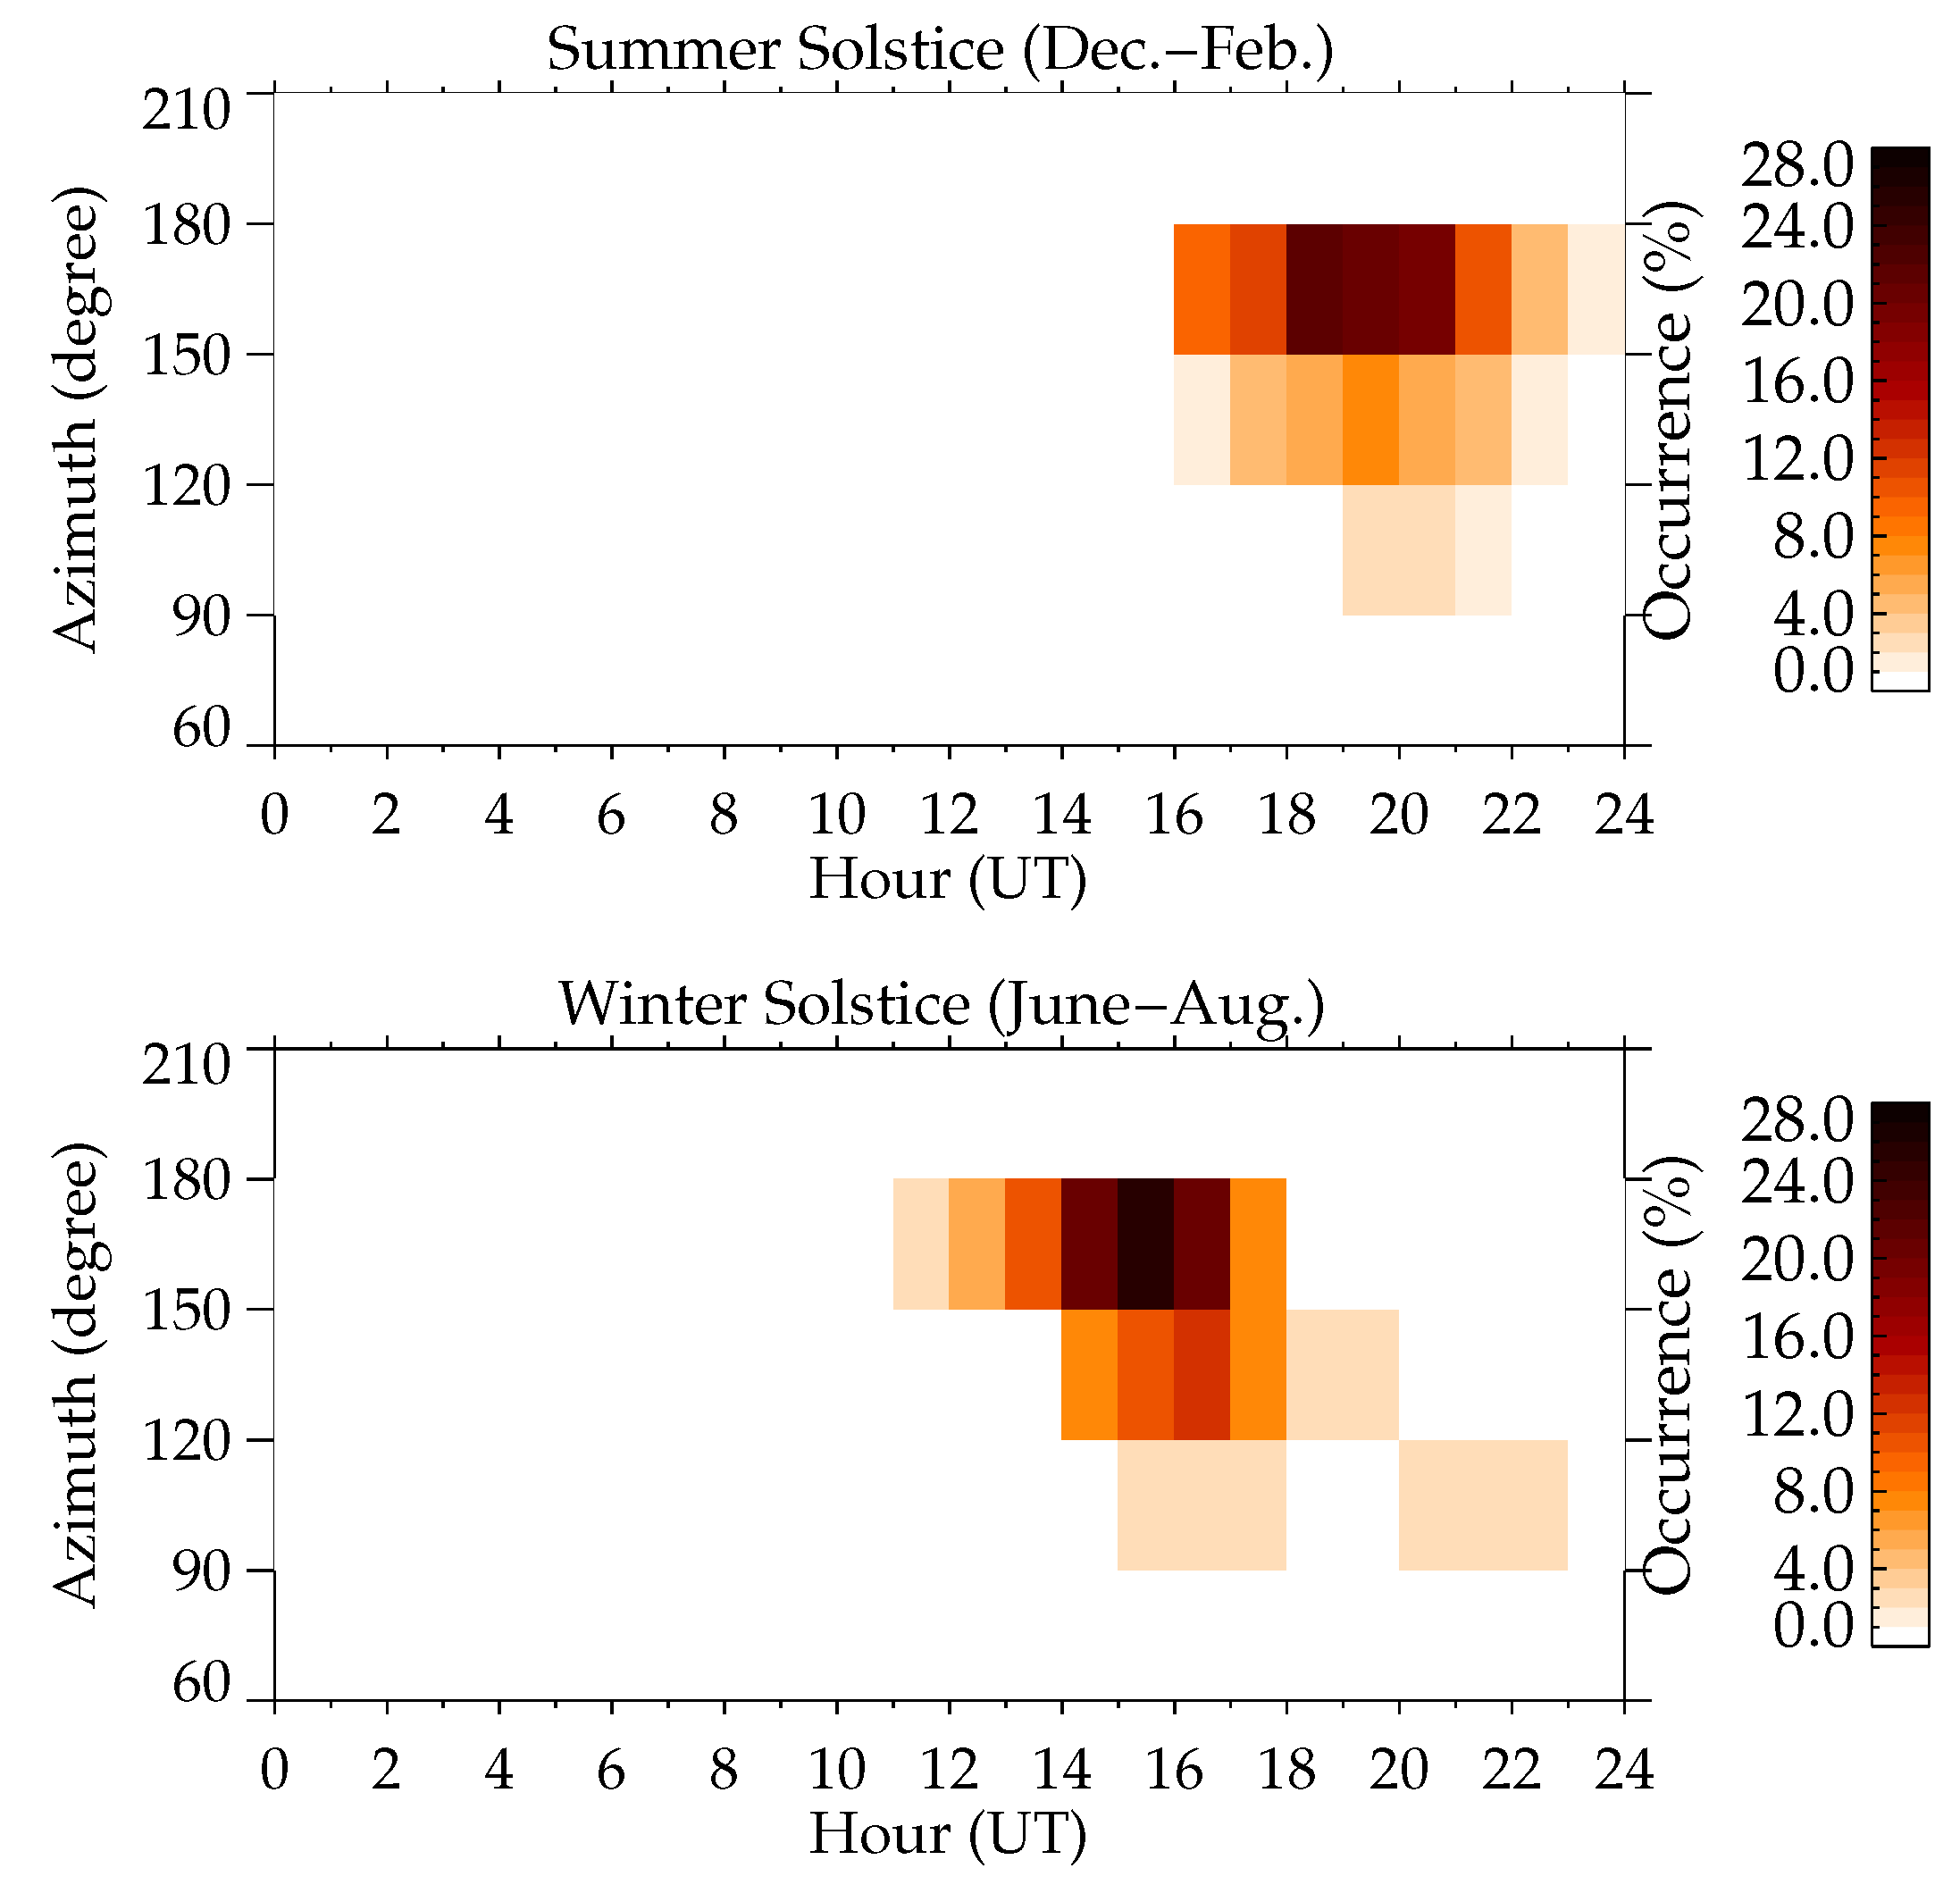
- We also discovered that the MSTIDs propagating southeastward show a clear seasonality of their local time dependence. In summer, the MSTIDs frequently occurred in the evening hours; those in winter occurred during the daytime.
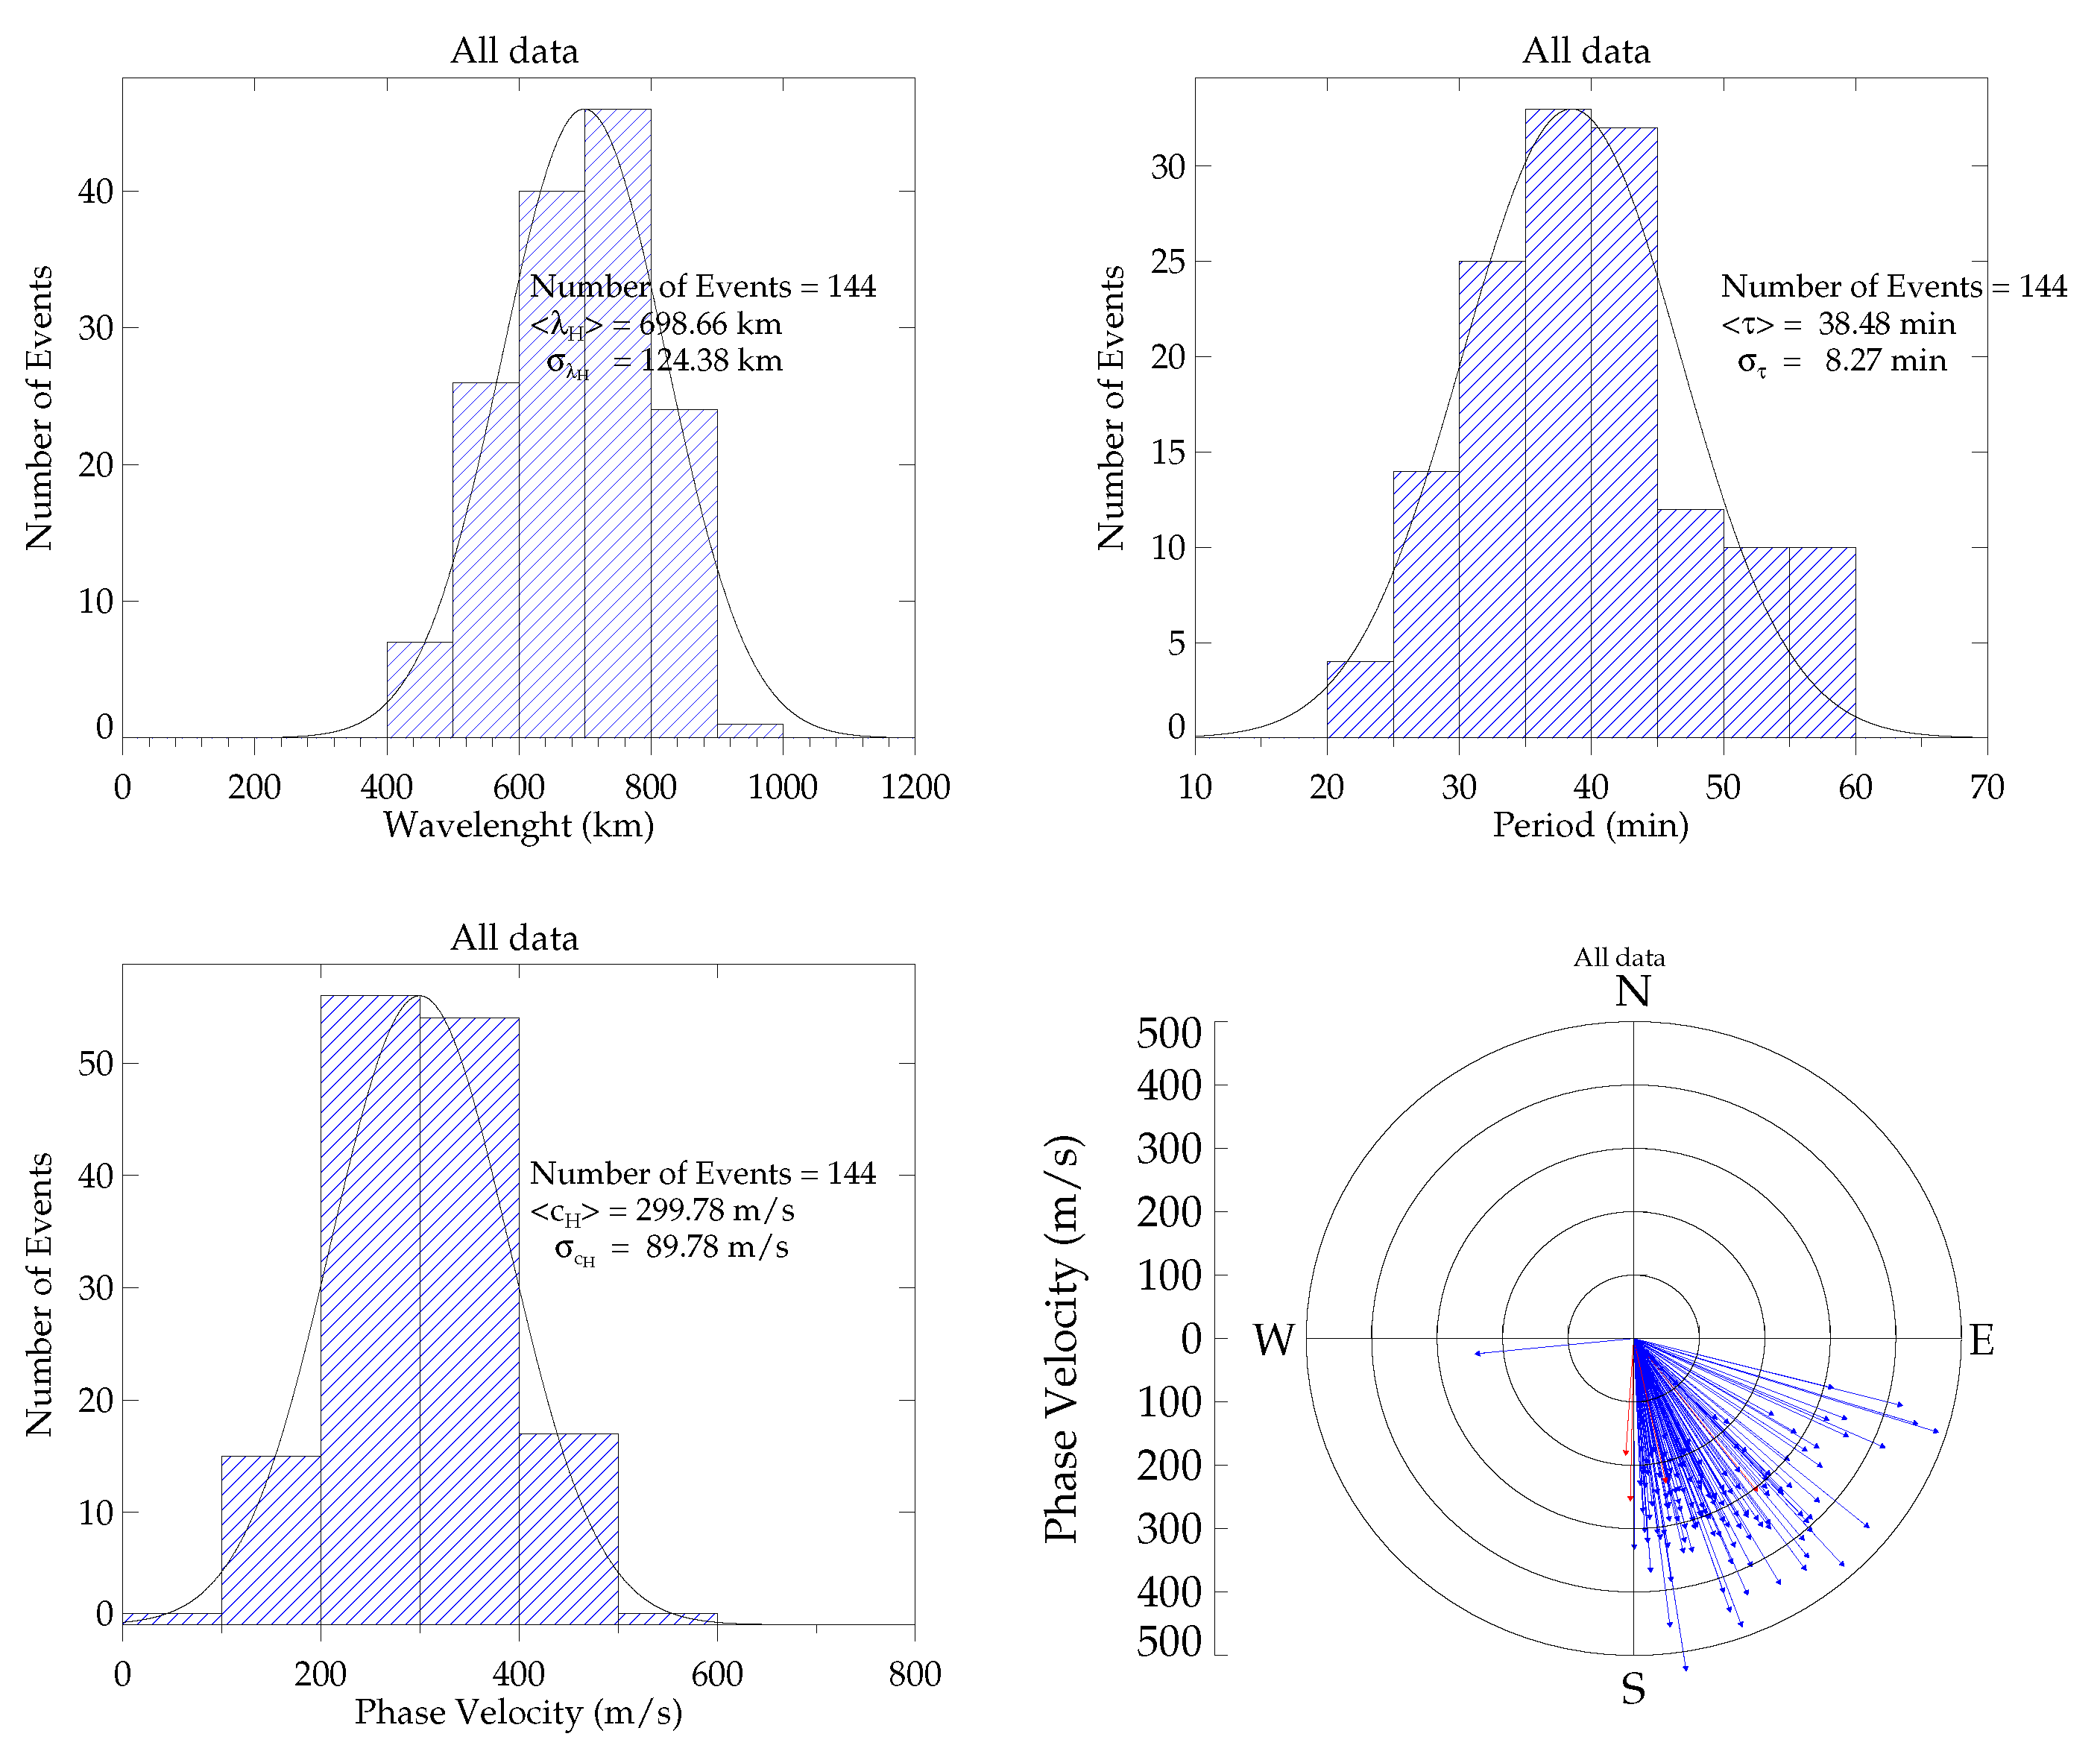
- The mean of the horizontal wavelength, period, and phase velocity were 698 ± 124 km, 38 ± 8 , and 299 ± 89 −1, respectively.
Author Contributions
Funding
Data Availability Statement
Acknowledgments
Conflicts of Interest
References
- Astafyeva, E. Ionospheric Detection of Natural Hazards. Rev. Geophys. 2019, 57, 1265–1288. [Google Scholar] [CrossRef]
- Abdu, M.A.; Kherani, E.A.; Batista, I.S.; de Paula, E.R.; Fritts, D.C.; Sobral, J.H.A. Gravity wave initiation of equatorial spread F/plasma bubble irregularities based on observational data from the SpreadFEx campaign. Ann. Geophys. 2009, 27, 2607–2622. [Google Scholar] [CrossRef] [Green Version]
- Earle, G.D.; Musumba, A.M.; Vadas, S.L. Satellite-based measurements of gravity wave-induced midlatitude plasma density perturbations. J. Geophys. Res. Space Phys. 2008, 113. [Google Scholar] [CrossRef] [Green Version]
- Crowley, G.; Azeem, I. Extreme Ionospheric Storms and Their Effects on GPS Systems. In Extreme Events in Geospace; Elsevier: Amsterdam, The Netherlands, 2018; pp. 555–586. [Google Scholar]
- Hines, C.O. Internal atmospheric gravity waves at ionospheric heights. Can. J. Phys. 1960, 38, 1441–1481. [Google Scholar] [CrossRef]
- Hooke, W.H. Ionospheric irregularities produced by internal atmospheric gravity waves. J. Atmos. Terr. Phys. 1968, 30, 795–823. [Google Scholar] [CrossRef]
- Georges, T.M.; Hooke, W.H. Wave-induced fluctuations in ionospheric electron content: A model indicating some observational biases. J. Geophys. Res. 1970, 75, 6295–6308. [Google Scholar] [CrossRef]
- Tsunoda, R.T. On seeding equatorial spread F: Circular gravity waves. Geophys. Res. Lett. 2010, 37. [Google Scholar] [CrossRef]
- Su, S.Y.; Wu, C.L.; Liu, C.H. Correlation between the global occurrences of ionospheric irregularities and deep atmospheric convective clouds in the intertropical convergence zone (ITCZ). Earth Planets Space 2014, 66, 134. [Google Scholar] [CrossRef] [Green Version]
- MacDougall, J.; Abdu, M.A.; Batista, I.; Buriti, R.; Medeiros, A.F.; Jayachandran, P.T.; Borba, G. Spaced transmitter measurements of medium scale traveling ionospheric disturbances near the equator. Geophys. Res. Lett. 2011, 38. [Google Scholar] [CrossRef] [Green Version]
- Otsuka, Y.; Suzuki, K.; Nakagawa, S.; Nishioka, M.; Shiokawa, K.; Tsugawa, T. GPS observations of medium-scale traveling ionospheric disturbances over Europe. Ann. Geophys. 2013, 31, 163–172. [Google Scholar] [CrossRef]
- Paulino, I.; Medeiros, A.F.; Vadas, S.L.; Wrasse, C.M.; Takahashi, H.; Buriti, R.A.; Leite, D.; Filgueira, S.; Bageston, J.V.; Sobral, J.H.A.; et al. Periodic waves in the lower thermosphere observed by OI630 nm airglow images. Ann. Geophys. 2016, 34, 293–301. [Google Scholar] [CrossRef] [Green Version]
- Figueiredo, C.; Takahashi, H.; Wrasse, C.M.; Otsuka, Y.; Shiokawa, K.; Barros, D. Investigation of Nighttime MSTIDS Observed by Optical Thermosphere Imagers at Low Latitudes: Morphology, Propagation Direction, and Wind Filtering. J. Geophys. Res. Space Phys. 2018, 123, 7843–7857. [Google Scholar] [CrossRef]
- Otsuka, Y.; Kotake, N.; Shiokawa, K.; Ogawa, T.; Tsugawa, T.; Saito, A. Statistical study of medium-scale traveling ionospheric disturbances observed with a GPS receiver network in Japan. In Aeronomy of the Earth’s Atmosphere and Ionosphere; Abdu, M.A., Pancheva, D., Eds.; Springer: Dordrecht, The Netherlands, 2011; pp. 291–299. [Google Scholar]
- Kotake, N.; Otsuka, Y.; Ogawa, T.; Tsugawa, T.; Saito, A. Statistical study of medium-scale traveling ionospheric disturbances observed with the GPS networks in Southern California. Earth Planets Space 2007, 59, 95–102. [Google Scholar] [CrossRef] [Green Version]
- Kelley, M.C.; Makela, J.J.; Saito, A.; Aponte, N.; Sulzer, M.; González, S.A. On the electrical structure of airglow depletion/height layer bands over Arecibo. Geophys. Res. Lett. 2000, 27, 2837–2840. [Google Scholar] [CrossRef]
- Liu, Y.; Li, Z.; Fu, L.; Wang, J.; Zhang, C. Studying the ionospheric responses induced by a geomagnetic storm in September 2017 with multiple observations in America. GPS Solut. 2020, 24, 3. [Google Scholar] [CrossRef]
- Röttger, J. Travelling disturbances in the equatorial ionosphere and their association with penetrative cumulus convection. J. Atmos. Terr. Phys. 1977, 39, 987–998. [Google Scholar] [CrossRef]
- Figueiredo, C.; Takahashi, H.; Wrasse, C.M.; Otsuka, Y.; Shiokawa, K.; Barros, D. Medium-scale traveling ionospheric disturbances observed by detrended total electron content maps over Brazil. J. Geophys. Res. Space Phys. 2018, 123, 2215–2227. [Google Scholar] [CrossRef]
- Essien, P.; Figueiredo, C.A.O.B.; Takahashi, H.; Wrasse, C.M.; Barros, D.; Klutse, N.A.B.; Lomotey, S.O.; Ayorinde, T.T.; Gobbi, D.; Bilibio, A.V. Long-term study on medium-scale traveling ionospheric disturbances observed over the South American Equatorial Region. Atmosphere 2021, 12, 1409. [Google Scholar] [CrossRef]
- Kousky, V.E. Pentad outgoing longwave radiation climatology for the South American sector. Rev. Bras. Meteorol. 1988, 3, 217–231. [Google Scholar]
- Hastenrath, S.; Greischar, L. The monsoonal current regimes of the tropical Indian Ocean: Observed surface flow fields and their geostrophic and wind-driven components. J. Geophys. Res. Ocean. 1991, 96, 12619–12633. [Google Scholar] [CrossRef]
- Gan, M.A.; Kousky, V.; Ropelewski, C. The South America monsoon circulation and its relationship to rainfall over west-central Brazil. J. Clim. 2004, 17, 47–66. [Google Scholar] [CrossRef]
- Kousky, V.E.; Alonso Gan, M. Upper tropospheric cyclonic vortices in the tropical South Atlantic. Tellus 1981, 33, 538–551. [Google Scholar] [CrossRef] [Green Version]
- Silva, V.B.; Kousky, V.E. The South American monsoon system: Climatology and variability. Mod. Climatol. 2012, 123, 152. [Google Scholar]
- DeMaria, M. Linear response of a stratified tropical atmosphere to convective forcing. J. Atmos. Sci. 1985, 42, 1944–1959. [Google Scholar] [CrossRef]
- Figueroa, S.N.; Satyamurty, P.; Da Silva Dias, P.L. Simulations of the summer circulation over the South American region with an eta coordinate model. J. Atmos. Sci. 1995, 52, 1573–1584. [Google Scholar] [CrossRef]
- Kodama, Y. Large-scale common features of subtropical precipitation zones (the Baiu frontal zone, the SPCZ, and the SACZ) Part I: Characteristics of subtropical frontal zones. J. Meteorol. Soc. Jpn. Ser. II 1992, 70, 813–836. [Google Scholar] [CrossRef] [Green Version]
- Lenters, J.D.; Cook, K.H. Simulation and diagnosis of the regional summertime precipitation climatology of South America. J. Clim. 1995, 8, 2988–3005. [Google Scholar] [CrossRef]
- Kousky, V.E. Frontal influences on northeast Brazil. Mon. Weather. Rev. 1979, 107, 1140–1153. [Google Scholar] [CrossRef]
- Reboita, M.S.; Gan, M.A.; Rocha, R.P.d.; Ambrizzi, T. Regimes de precipitação na América do Sul: Uma revisão bibliográfica. Rev. Bras. Meteorol. 2010, 25, 185–204. [Google Scholar] [CrossRef]
- Gutman, G.J.; Schwerdtfeger, W. The role of latent and sensible heat for the development of a high pressure system over the subtropical Andes. Meteorol. Rundsch. 1965, 18. [Google Scholar]
- Virji, H. A preliminary study of summertime tropospheric circulation patterns over South America estimated from cloud winds. Mon. Weather Rev. 1981, 109, 599–610. [Google Scholar] [CrossRef]
- Lenters, J.D.; Cook, K.H. On the origin of the Bolivian high and related circulation features of the South American climate. J. Atmos. Sci. 1997, 54, 656–678. [Google Scholar] [CrossRef]
- Vuille, M. Atmospheric circulation over the Bolivian Altiplano during dry and wet periods and extreme phases of the Southern Oscillation. Int. J. Climatol. J. R. Meteorol. Soc. 1999, 19, 1579–1600. [Google Scholar] [CrossRef]
- Quadro, M.F.L.d. Estudo de episódios de Zona de Convergência do Atlântico Sul (ZCAS) sobre a América do sul. Master’s Thesis, INPE, São José dos Campos, Brazil, 1994; 99p. [Google Scholar]
- Hastenrath, S.; Lamb, P. On the dynamics and climatology of surface flow over the equatorial oceans. Tellus 1978, 30, 436–448. [Google Scholar] [CrossRef] [Green Version]
- Horel, J.D.; Hahmann, A.N.; Geisler, J.E. An investigation of the annual cycle of convective activity over the tropical Americas. J. Clim. 1989, 2, 1388–1403. [Google Scholar] [CrossRef]
- Waldock, J.; Jones, T. Source regions of medium scale travelling ionospheric disturbances observed at mid-latitudes. J. Atmos. Terr. Phys. 1987, 49, 105–114. [Google Scholar] [CrossRef]
- Essien, P.; Paulino, I.; Wrasse, C.M.; Campos, J.A.V.; Paulino, A.R.; Medeiros, A.F.; Buriti, R.A.; Takahashi, H.; Agyei-Yeboah, E.; Lins, A.N. Seasonal characteristics of small-and medium-scale gravity waves in the mesosphere and lower thermosphere over the Brazilian equatorial region. In Annales Geophysicae; Copernicus GmbH: Gottingen, Germany, 2018; Volume 36, pp. 899–914. [Google Scholar]
- Takahashi, H.; Wrasse, C.; Figueiredo, C.; Barros, D.; Paulino, I.; Essien, P.; Abdu, M.; Otsuka, Y.; Shiokawa, K. Equatorial plasma bubble occurrence under propagation of MSTID and MLT gravity waves. J. Geophys. Res. Space Phys. 2020, 125, e2019JA027566. [Google Scholar] [CrossRef]
- Takahashi, H.; Essien, P.; Figueiredo, C.; Wrasse, C.; Barros, D.; Abdu, M.; Otsuka, Y.; Shiokawa, K.; Li, G. Multi-instrument study of longitudinal wave structures for plasma bubble seeding in the equatorial ionosphere. Earth Planet. Phys. 2021, 5, 368–377. [Google Scholar] [CrossRef]
- Perrett, J.A.; Wright, C.J.; Hindley, N.P.; Hoffmann, L.; Mitchell, N.J.; Preusse, P.; Strube, C.; Eckermann, S.D. Determining Gravity Wave Sources and Propagation in the Southern Hemisphere by Ray-Tracing AIRS Measurements. Geophys. Res. Lett. 2021, 48, e2020GL088621. [Google Scholar] [CrossRef]
- Fritts, D.C.; Wang, L.; Werne, J.; Lund, T.; Wan, K. Gravity wave instability dynamics at high Reynolds numbers. Part I: Wave field evolution at large amplitudes and high frequencies. J. Atmos. Sci. 2009, 66, 112–1148. [Google Scholar] [CrossRef]
- Gardner, C.S. Introduction to ALOHA/ANLC-93: The 1993 airborne lidar and observations of the Hawaiian airglow/airborne noctilucent cloud campaigns. Geophys. Res. Lett. 1995, 22, 2789–2792. [Google Scholar] [CrossRef]
- Qian, J.; Gu, Y.Y.; Papen, G.C.; Gardner, C.S.; Espy, P.J. Horizontal wave number spectra of density and temperature perturbations in the mesosphere measured during the 4 August flight of ANLC-93. Geophys. Res. Lett. 1995, 22, 2865–2868. [Google Scholar] [CrossRef]
- Vadas, S.L.; Fritts, D.C. Thermospheric responses to gravity waves arising from mesoscale convective complexes. J. Atmos. Sol.-Terr. Phys. 2004, 66, 781–804. [Google Scholar] [CrossRef]
- Hines, C.O.; Reddy, C.A. On the propagation of atmospheric gravity waves through regions of wind shear. J. Geophys. Res. 1967, 72, 1015–1034. [Google Scholar] [CrossRef]
- Gossard, E.E. Vertical flux of energy into the lower ionosphere from internal gravity waves generated in the troposphere. J. Geophys. Res. 1962, 67, 745–757. [Google Scholar] [CrossRef]
- Waliser, D.; Jiang, X. Tropical Meteorology and Climate: Intertropical Convergence Zone; Elsevier: Amsterdam, The Netherlands, 2015. [Google Scholar]
- Giresse, P. Tropical and Sub-Tropical West Africa-Marine and Continental Changes during the Late Quaternary; Elsevier: Amsterdam, The Netherlands, 2007. [Google Scholar]
- Utida, G.; Cruz, F.W.; Etourneau, J.; Bouloubassi, I.; Schefuß, E.; Vuille, M.; Novello, V.F.; Prado, L.F.; Sifeddine, A.; Klein, V.; et al. Tropical South Atlantic influence on Northeastern Brazil precipitation and ITCZ displacement during the past 2300 years. Sci. Rep. 2019, 9, 1698. [Google Scholar] [CrossRef] [Green Version]
- Madden, R.A. Tropical Meteorology and Climate: Intraseasonal Oscillation (Madden-Julian Oscillation). In Encyclopedia of Atmospheric Sciences; Elsevier: Amsterdam, The Netherlands, 2015; pp. 132–136. [Google Scholar]
- Vadas, S.L.; Becker, E. Numerical modeling of the generation of tertiary gravity waves in the mesosphere and thermosphere during strong mountain wave events over the Southern Andes. J. Geophys. Res. Space Phys. 2019, 124, 7687–7718. [Google Scholar] [CrossRef]
- Hernandez-Pajares, M.; Juan, J.M.; Sanz, J. Medium-scale traveling ionospheric disturbances affecting GPS measurements: Spatial and temporal analysis. J. Geophys. Res. Space Phys. 2006, 111. [Google Scholar] [CrossRef]


Publisher’s Note: MDPI stays neutral with regard to jurisdictional claims in published maps and institutional affiliations. |
© 2022 by the authors. Licensee MDPI, Basel, Switzerland. This article is an open access article distributed under the terms and conditions of the Creative Commons Attribution (CC BY) license (https://creativecommons.org/licenses/by/4.0/).
Share and Cite
Essien, P.; Figueiredo, C.A.O.B.; Takahashi, H.; Klutse, N.A.B.; Wrasse, C.M.; Afonso, J.M.d.S.; Quispe, D.P.; Lomotey, S.O.; Ayorinde, T.T.; Sobral, J.H.A.; et al. Intertropical Convergence Zone as the Possible Source Mechanism for Southward Propagating Medium-Scale Traveling Ionospheric Disturbances over South American Low-Latitude and Equatorial Region. Atmosphere 2022, 13, 1836. https://doi.org/10.3390/atmos13111836
Essien P, Figueiredo CAOB, Takahashi H, Klutse NAB, Wrasse CM, Afonso JMdS, Quispe DP, Lomotey SO, Ayorinde TT, Sobral JHA, et al. Intertropical Convergence Zone as the Possible Source Mechanism for Southward Propagating Medium-Scale Traveling Ionospheric Disturbances over South American Low-Latitude and Equatorial Region. Atmosphere. 2022; 13(11):1836. https://doi.org/10.3390/atmos13111836
Chicago/Turabian StyleEssien, Patrick, Cosme Alexandre Oliveira Barros Figueiredo, Hisao Takahashi, Nana Ama Browne Klutse, Cristiano Max Wrasse, João Maria de Sousa Afonso, David Pareja Quispe, Solomon Otoo Lomotey, Tunde Toyese Ayorinde, José H. A. Sobral, and et al. 2022. "Intertropical Convergence Zone as the Possible Source Mechanism for Southward Propagating Medium-Scale Traveling Ionospheric Disturbances over South American Low-Latitude and Equatorial Region" Atmosphere 13, no. 11: 1836. https://doi.org/10.3390/atmos13111836