Article

Some Results of Photometric Measurements of Ionospheric Artificial Airglow at 557.7 and 630 nm Lines of Atomic Oxygen Caused by High-Frequency Radio Emission of the SURA Facility during Development of Sporadic E Layer

1
Institute of Solar–Terrestrial Physics SB RAS, Lermotova Street, 126A, a/b 291, 664033 Irkutsk, Russia
2
Institute of Physics, Kazan Federal University, Kremlevkaya Street, 16a, 420008 Kazan, Russia
3
Faculty of Radiophysics, Lobachevky State University, Gagarina Avenue, 23, 603022 Nizhny Novgorod, Russia
*
Author to whom correspondence should be addressed.
Atmosphere 2022, 13(11), 1794; https://doi.org/10.3390/atmos13111794
Submission received: 17 September 2022 / Revised: 21 October 2022 / Accepted: 26 October 2022 / Published: 30 October 2022

Abstract

:
The results of analysis of the experimental data collected on 5 September 2021 on 557.7 and 630 nm artificial airglow of the ionosphere induced by powerful HF radio waves at the SURA facility are presented. For optical measurements, a photometric suite located directly next to the SURA facility was used. Fast variations in the atmospheric emission intensity at 557.7 nm, 630 nm, and 391.4 nm with a three-channel photometer and spatial–temporal variations in the 557.7 nm with a CCD camera were measured. An ionospherically reflected pump wave and the stimulated electromagnetic emission (SEE) were recorded. Background ionospheric conditions were registered with ionosonde. For the first time, an increase in the 557.7 nm emission intensity induced by the SURA facility radiation was found concurrently with a partial blocking ionosphere in the F-region and suppression HF-induced phenomena in the F-region (the 630 nm airglow increase and SEE generation, powerful radio wave anomalous absorption) during the sporadic E-layer ( E s ) development. Additionally, we managed to obtain images showing moving spots of the SURA-induced 557.7 nm emission increased intensity at the E s layer heights.

1. Introduction

The impact of high-power radio waves on ionospheric airglow has been widely studied in experiments since the 1970s [1,2,3,4,5,6,7,8,9,10,11,12,13,14,15,16,17,18,19,20,21,22,23,24,25,26,27,28,29,30,31,32,33,34], including the SURA facility experiments [20,21,22,23,24,25,26,27,28,29,30,31,32,33,34]. The airglow occurs when the electrons transit from excited levels of the ionospheric atoms, molecules, and ions to the lower energy levels. The corresponding energy levels become excited during collisions of the atoms with the electrons whose energy exceeds level excitation potential, as well as a result of ion-molecular reactions, where energy is released sufficient to excite one of the atoms, in particular, during the dissociative recombination process.
The main measurements of airglow are performed in the red ( λ = 630 nm) and green ( λ = 557.7 nm) lines of atomic oxygen associated with transitions of the electrons from the level O ( 1 D ) to the ground state O ( 3 P ) and from the level O ( 1 S ) to the level O ( 1 D ) , respectively. The excitation energies of the levels O ( 1 D ) and O ( 1 S ) are 1.96 and 4.17 eV, respectively, and their radiative lifetimes are τ r O ( 1 D ) = 107 s and τ r O ( 1 S ) = 0.7 s, respectively. In addition, violet-line ( λ = 427.8 nm) measurements of the molecular nitrogen ion N 2 + with a molecule ionization threshold of 18.75 eV and an ion lifetime of about 10 6 s were performed [35,36]. Recording of artificial ionospheric airglow can be used for the solution of a variety of problems such as estimation of the distribution function and number density of accelerated electrons, study of the drift motions in the perturbed region, examination of the airglow spot characteristics as functions of different ionospheric and hardware conditions (orientation of the pump beam, characteristics of the resulting excited region, etc.), recording of artificial ionization in the excited region, and exploration of the large-scale structure of the perturbed ionospheric region [14,18,23,24,26,28].
It is commonly adopted that the stimulated airglow is generated in the F–region at altitudes of 220–270 km, where the number density of oxygen atoms is high enough and the energy of plasma waves parametrically excited near the pump wave reflection region is sufficient to accelerate electrons to the energies exceeding the excitation levels. However, in experiments performed in January 1998 at the Arecibo heating facility, the high-frequency (HF) induced enhancement of the green line ( 557.7 nm) airglow generated in the sporadic E-layer ( E s ) was observed [37,38].
In the present work, we describe observations of the HF-induced noticeable enhancement of 557.7 nm emissions in E s at the SURA heating facility near Nizhny Novgorod, Russia in September 2021. During the experiment in parallel with optical measurements, we used HF diagnostics, i.e., measurements of the pump wave (PW) ionospherically reflected signal and Stimulated (secondary) Electromagnetic Emission (SEE). The experiment was aimed at complex study of the artificial (HF-induced) ionospheric turbulence in the F-region, which includes different quasi-electrostatic plasma waves (Langmuir and upper hybrid), plasma irregularities in the HF-pumped volume of the F-region, electron acceleration by plasma waves, and peculiarities of the optical emission at different wavelengths, which are generated due to collision of the accelerated electrons with neutral particles.
Section 2 describes the experimental equipment and methods; the results obtained from the airglow measurements and HF diagnostics are presented in the Section 3; and Section 4 discusses the obtained results. Basic conclusions of the research are presented in Section 5.

2. Experimental Equipment and Methods

The experiment was performed at the SURA heating facility situated near Nizhny Novgorod, Russia (56.1° N, 46.1° E) during 17:30–20:15 UTC (LT = UTC + 3 h) on 5 September 2021. The SURA facility radiated the O-polarized pump wave beam vertically at a frequency of 4300 kHz. The effective radiated power was ∼100 MW. The operational mode on the observational night was as follows. One working cycle took 6 min: 1st min—pulses (pulse duration 50 ms, interpulse period 3 s), then 2.5 min of continuous pumping, afterward—a 2.5 min pause. The pulses did not exert any influence on the results reported, so we do not discuss them below in detail. The experiment was aimed for studying the HF-induced airglow generated in the upper ionosphere (F-region).
The artificial airglow of the ionosphere was measured continuously during the whole time of the SURA facility operation in the night time after sunset with a cloudless sky in the period close to the new moon. The optical measurements were provided by a photometric suite from the Institute of Solar Terrestrial Physics of the Siberian Branch of the Russian Academy of Sciences (ISTP SB RAS). The suite comprised a three-channel photometer (channels with an interference filter transmission center 391.4 nm, 557.7 nm, and 630 nm; filter half-widths being 10 nm), and a CCD camera with an ∼17° FOV (filter with a transmission center 557.7 nm and a half-width of 10 nm). The photometer channels temporal resolution is 10 ms. The photomultiplier tube (PMT) cathode diameter is 25 mm. The PMT was equipped with a photon counter, a high-voltage power supply circuit, and a microprocessor. The PMT operational spectral range is 300–850 nm with a 420 nm sensitivity peak. The photometer FOV is ∼10°. A three-channels photometer allows one to record fast variations in the ionospheric airglow intensity. A CCD–camera started at second 0 and second 30 with a 27 s exposure (dead time between frames being 3 s). Figure 1 shows a frame of the photometric suite 557.7 nm CCD camera, and the 557.7 nm photometer channel FOV (black circle).
The use of different types of optical equipment in such experiments makes it possible to obtain more complete and reliable experimental data. Photometers record the intensity of atmospheric emissions with a high temporal resolution (10 ms) and high sensitivity. CCD cameras make it possible to obtain a spatial pattern of the observed disturbances but with worse temporal resolution. The simultaneous registration of disturbances by different types of optical equipment has made it possible to reliably distinguish the HF-induced moving structures.
It should be noted that the overwhelming majority of measurements of artificial airglow of the ionosphere in the blue line was carried out at 428.7 nm (see for example [14]). However, it is well known that the blue region (bands U and B) is dominated by the N 2 second positive ( 2 P ) and N 2 + first negative ( 1 N ) bands, while the strongest emission of molecular nitrogen is observed at the line 391.4 nm ( 1 N bands of N 2 + ) [39]. For this reason, the third photometric channel used in our measurements operated at the 391.4 nm line. However the data analysis had not shown any HF-induced variations in our experiment.
During the experiment, the background ionospheric conditions (ionograms) were registered with ionosonde CADI one minute prior to the switching on continuous pumping. We also recorded the ionospherically reflected pump wave and the SEE. SEE is generated via conversion of HF pump-driven electrostatic plasma modes into electromagnetic waves with amplitudes smaller than the reflected PW by 50–90 dB [40,41]. The prominent SEE spectral features have long been used as indicators of specific nonlinear interactions responsible for the excitation of plasma waves and electron acceleration near the O-mode reflection height in the F-region [42]. Note that the SURA facility and the HF receiver equipment belong to Lobachevsky State University of Nizhni Novgorod, Russia.

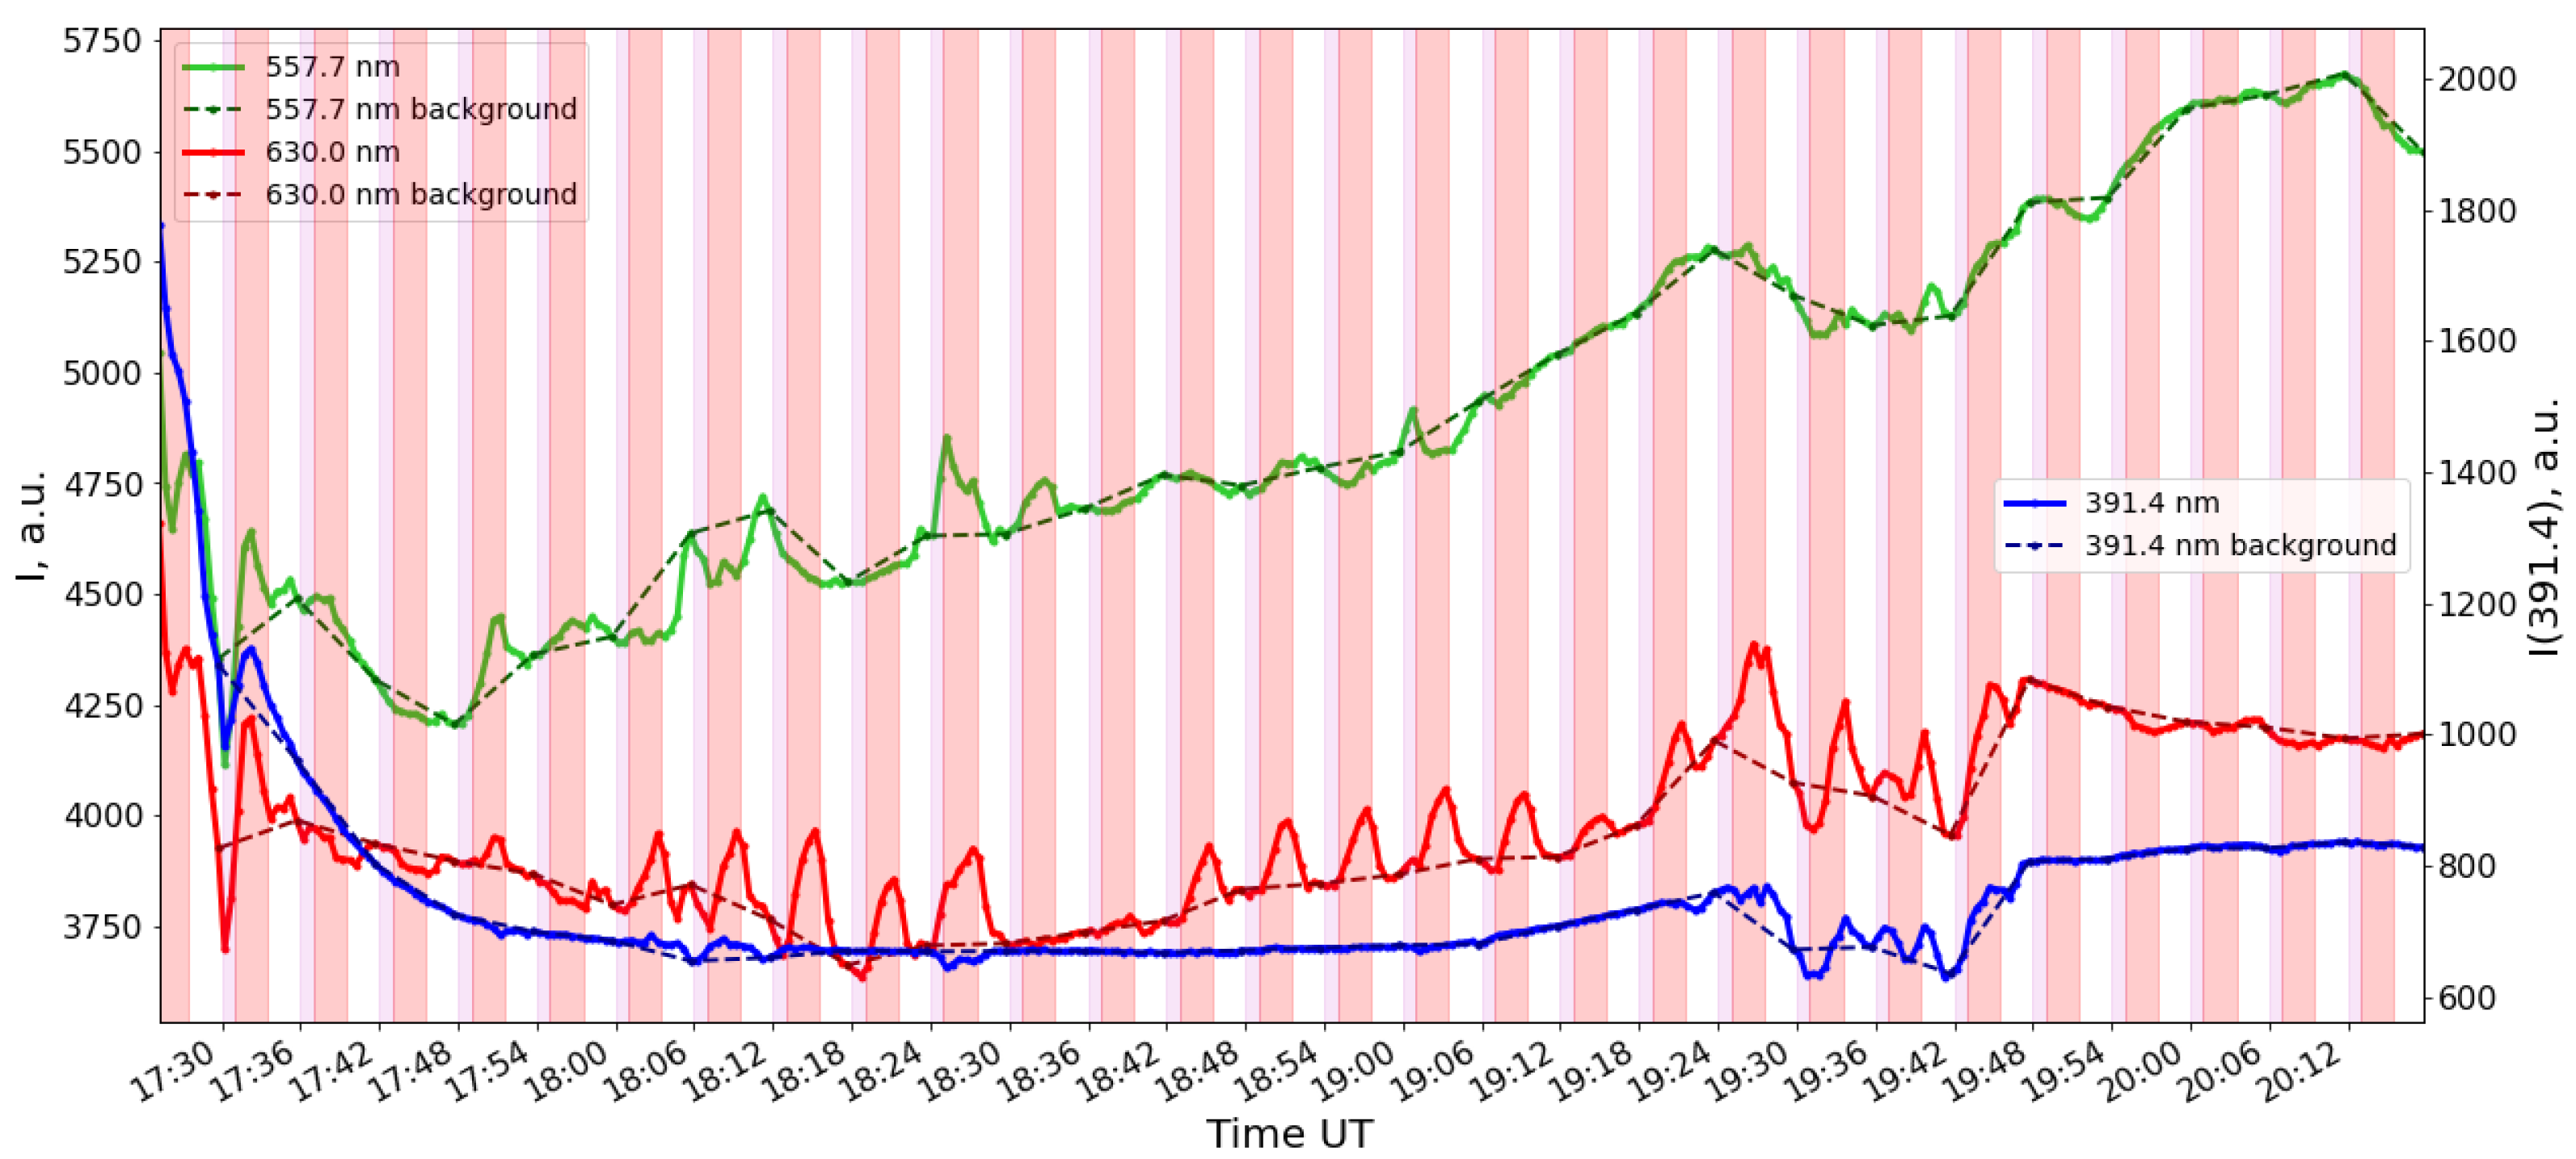
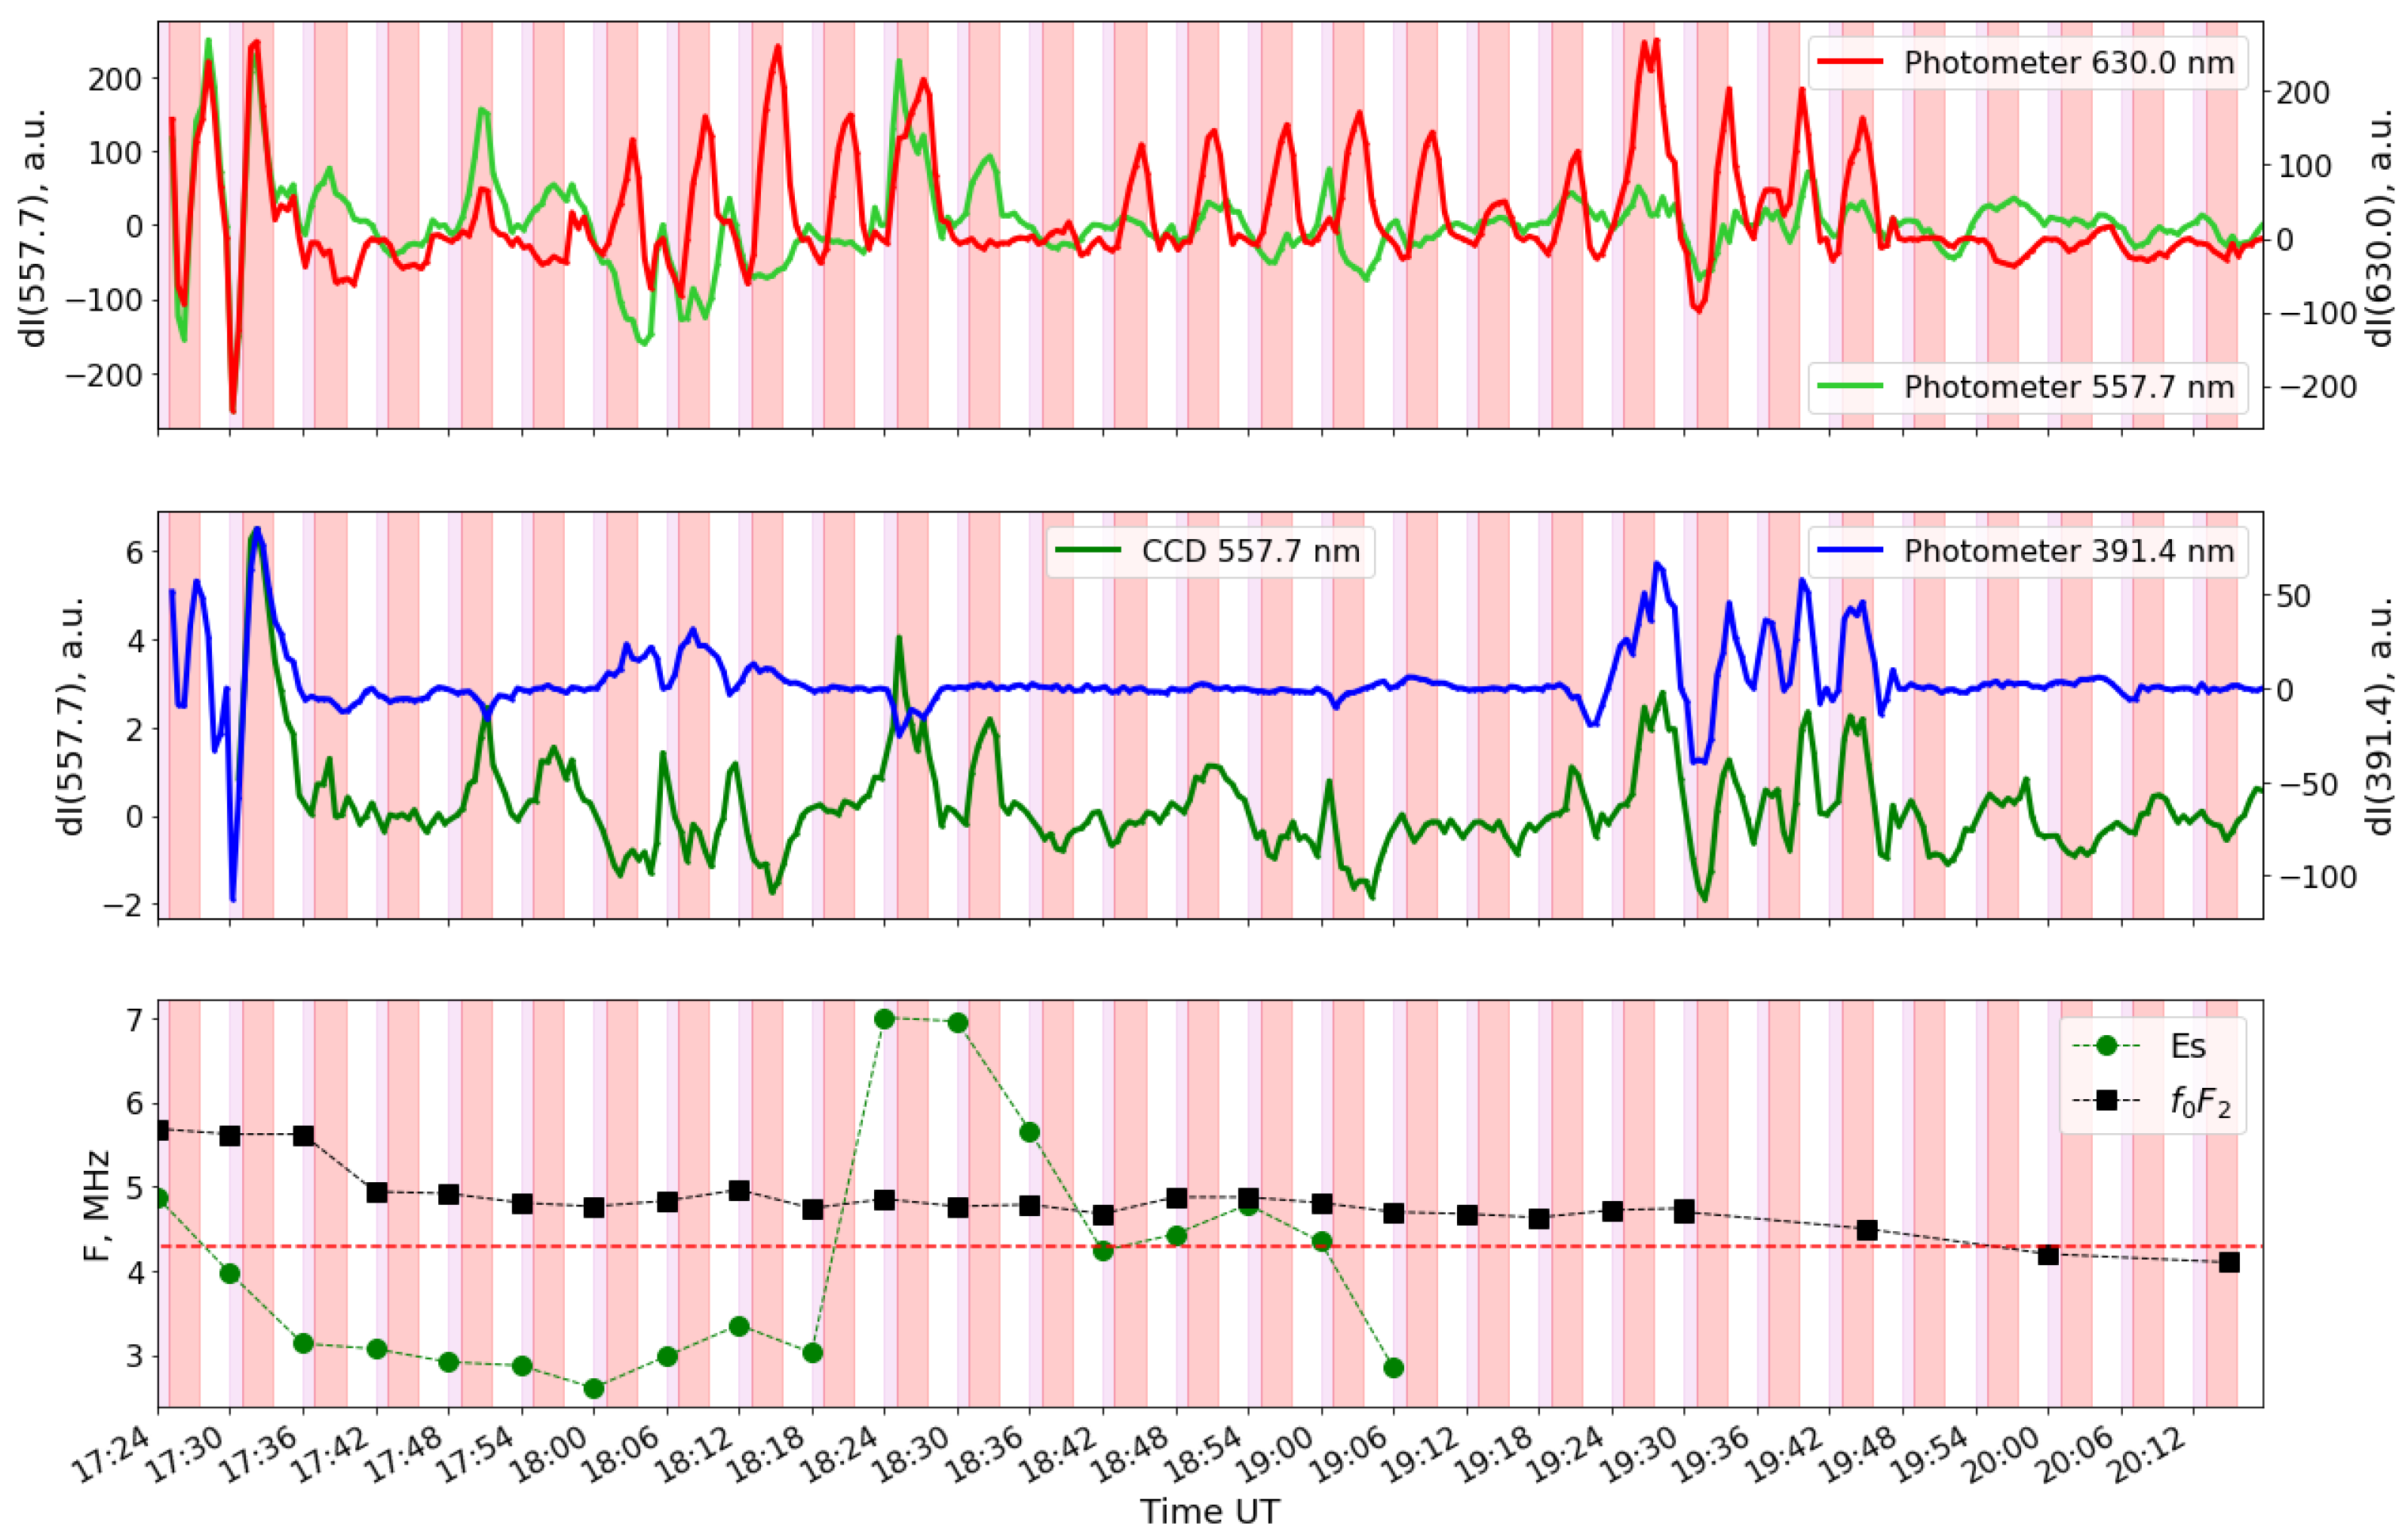
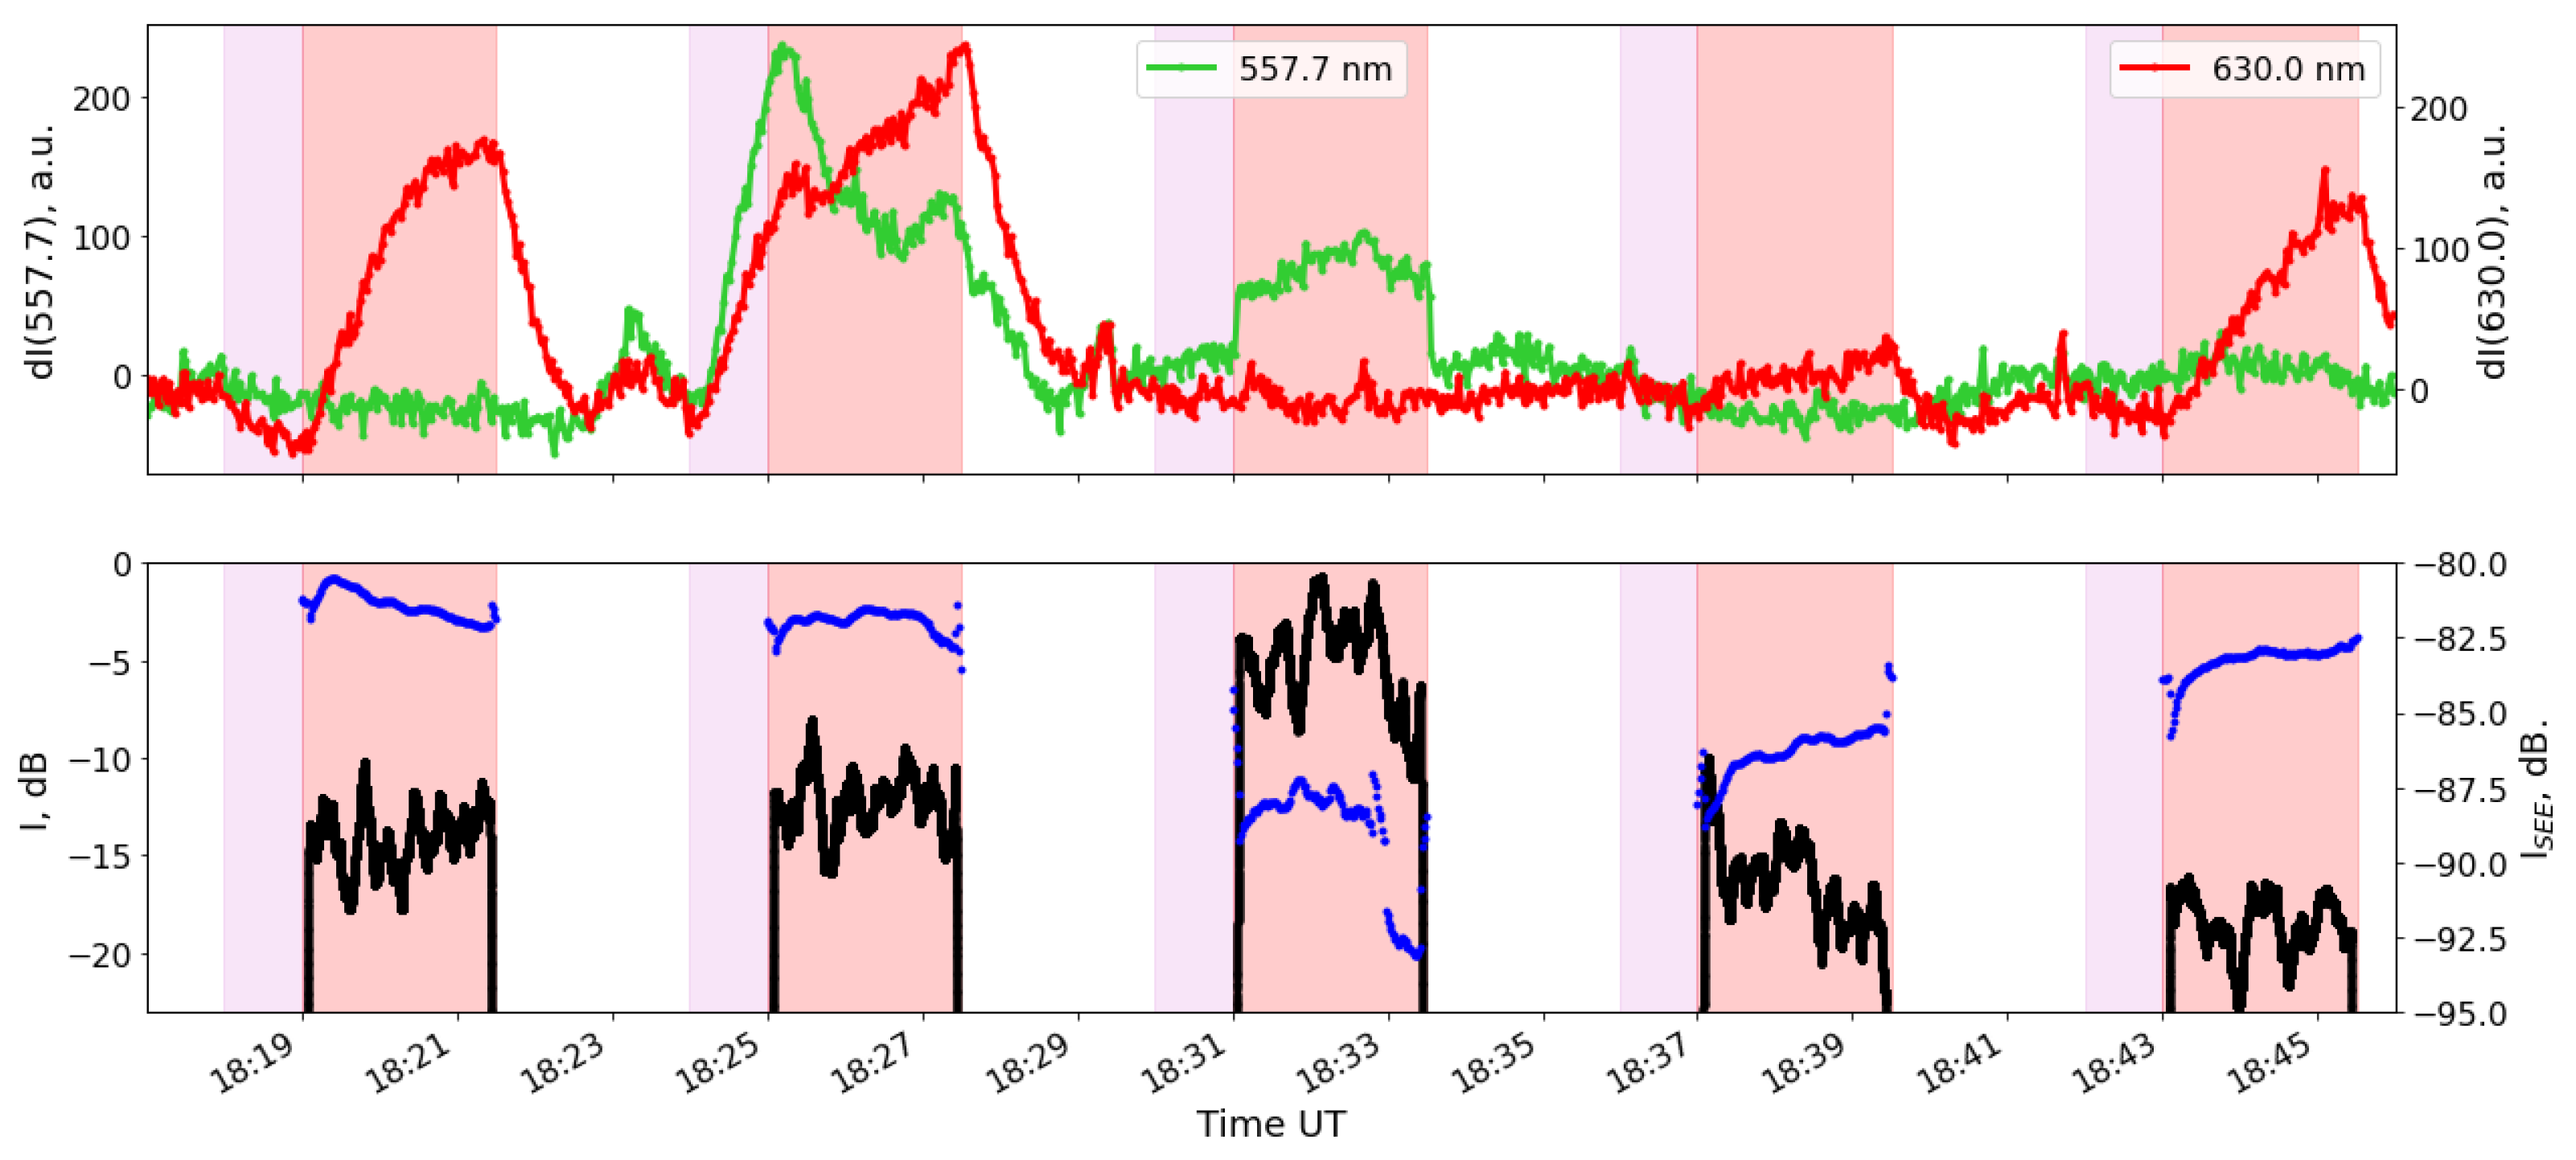
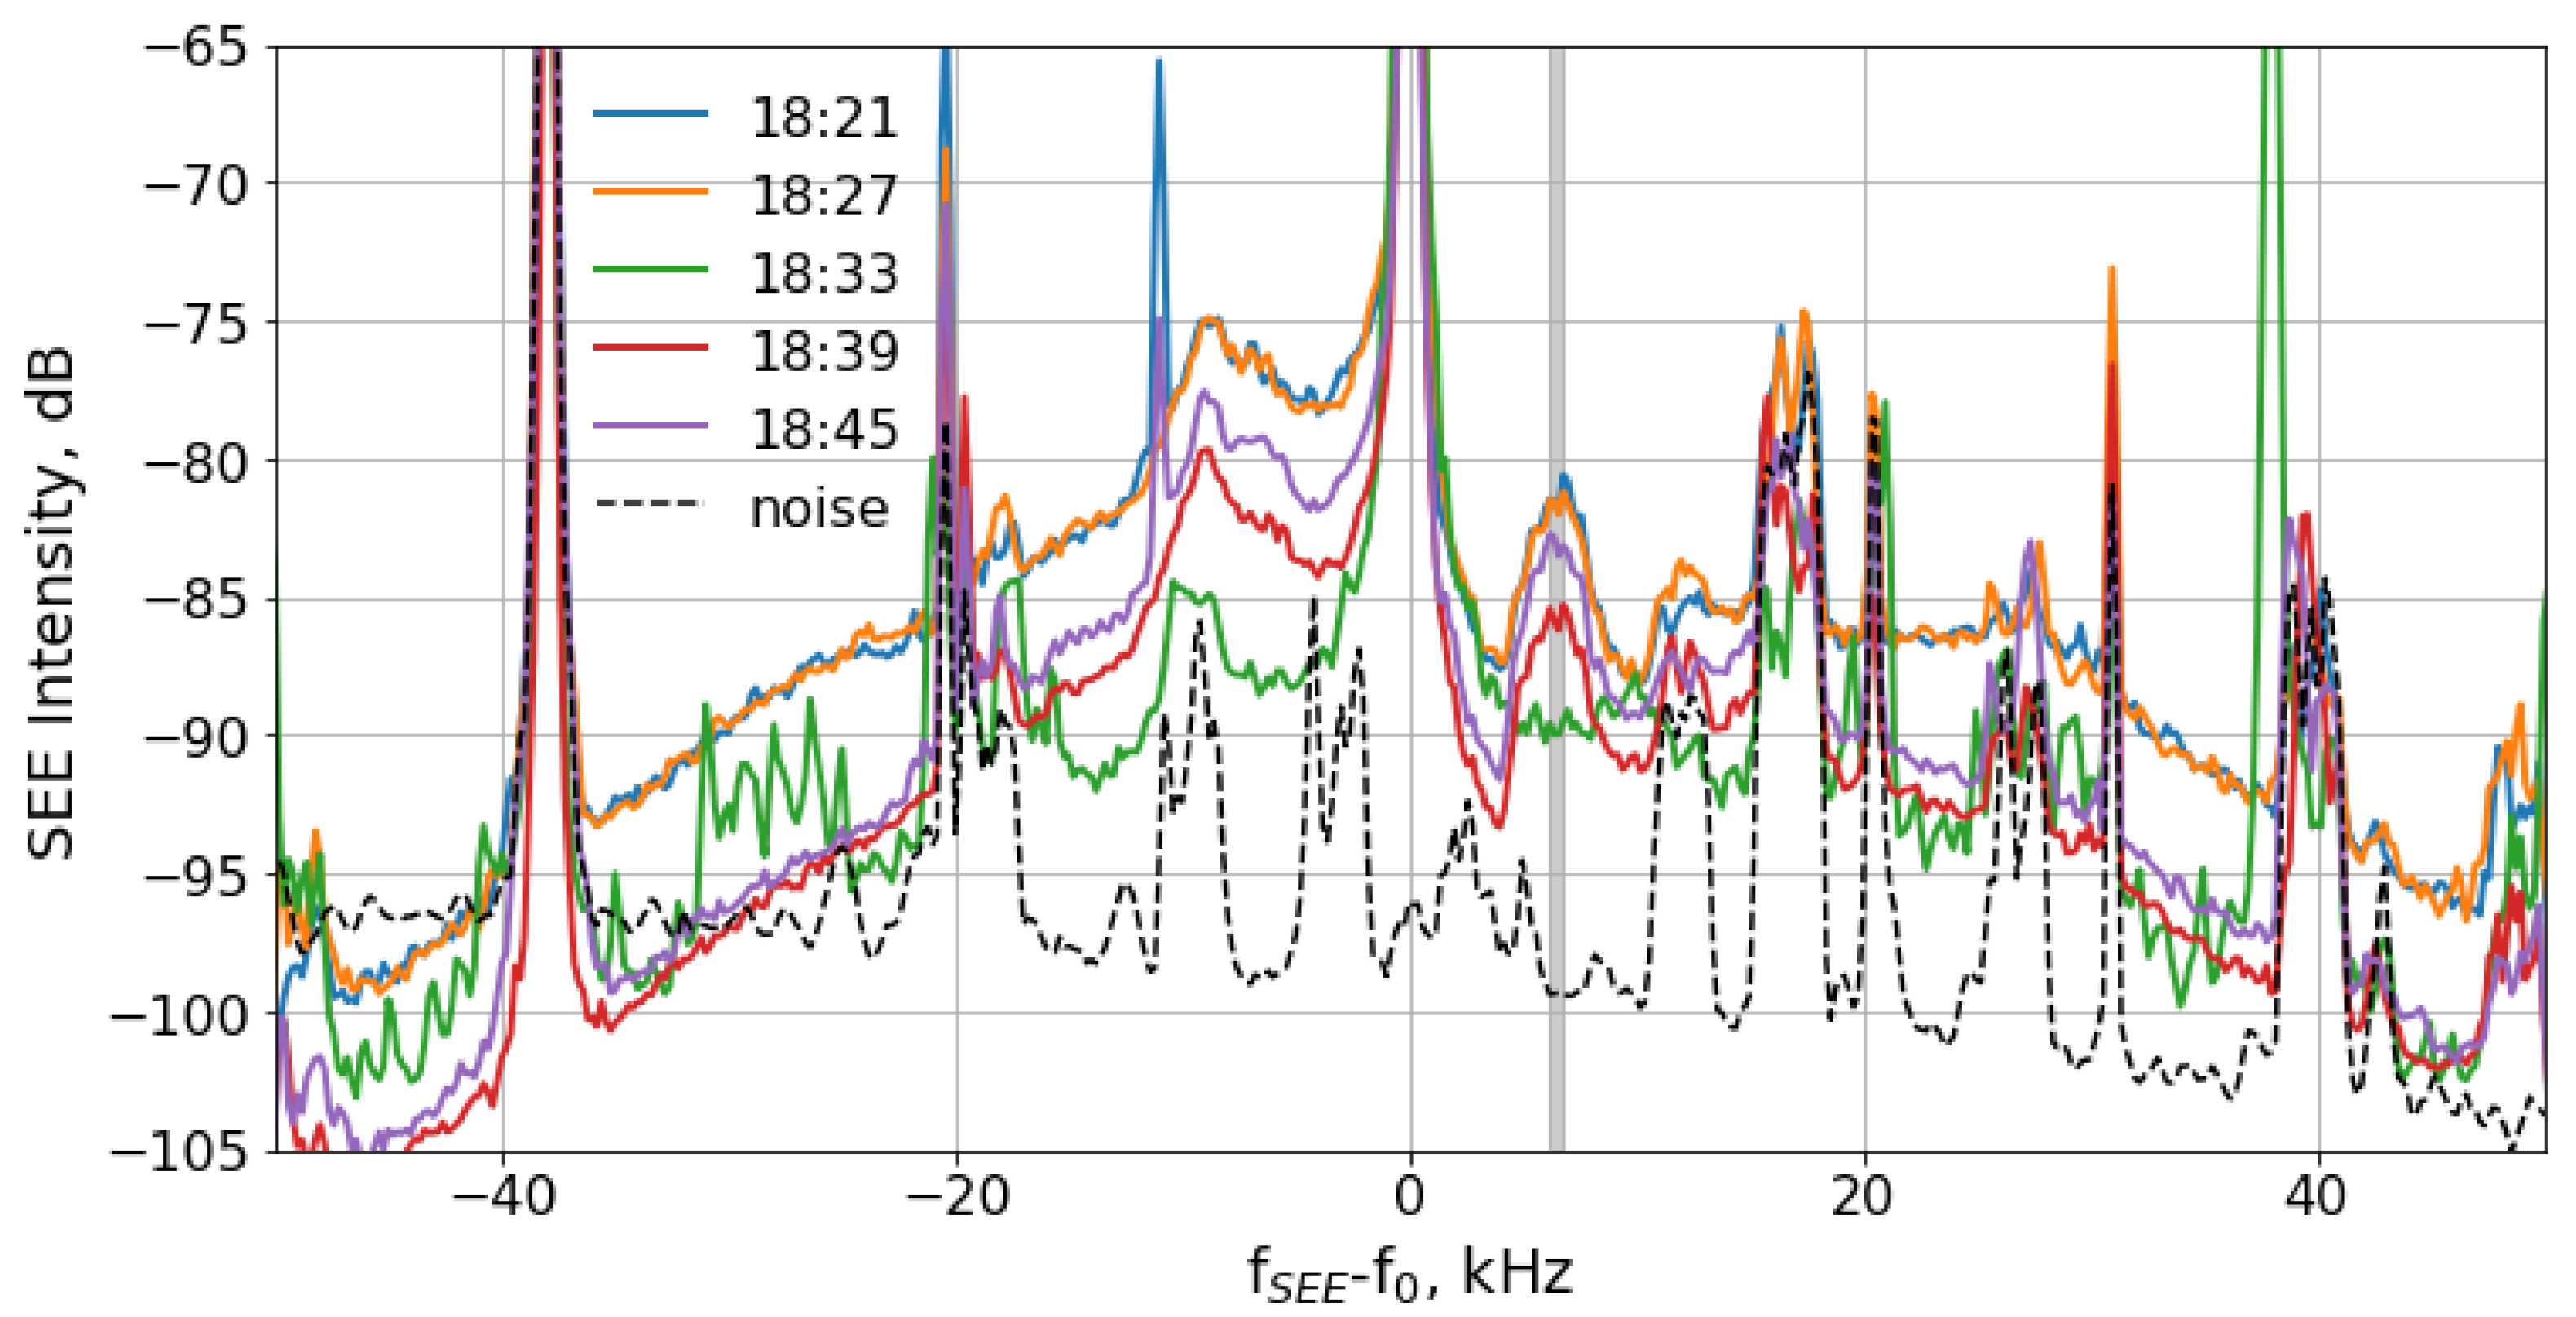
3. Experimental Results

Figure 2 shows time series for the 557.7 nm and 630 nm emission intensity recorded by the photometric suite on 5 September 2021 during the whole time of measurements.
Figure 3 shows variations in the 557.7 nm and 630 nm emission intensities, from the same data, but with a removed natural trend. For the CCD camera and for the photometer channels, we used the same scheme when calculating the trend. Reference frames were obtained for the CCD camera; intensity values were averaged over 27 s (corresponding to the camera exposure) for the photometer. The reference points were chosen for the instants before the facility pumping was energized, i.e., at the instants with a minimal effect from the facility radiation on the ionosphere. Furthermore, for each instant between two reference points, we calculated the background value I b .
I b = k 0 I b 0 + k 1 I b 1 ,
where I b 0 is the intensity of the reference point or frame before the current pumping cycle; I b 1 is the reference point intensity or frame before the next pumping cycle
k 0 = ( t t 0 ) / ( t 1 t 0 ) ,
k 1 = ( t 1 t ) / ( t 1 t 0 ) ,
where t is the time of the current reference I b ; t 0 is reference frame time I b 0 ; and t 1 is reference frame time I b 1 .
From Figure 3, it is seen that throughout almost the entire period of the experiment, the typical pump-induced behavior of the 630 nm emission generated in the F region is observed: namely, the emission intensity slowly and noticeably grows after the pump wave switches on, and it drops faster after its switches off. In the majority of the pumping cycles, any HF-correlated behavior of the emission in 557.7 nm and 391.4 nm lines is not resolved. Note that fast variations of the emission intensity in 557.7 nm and 391.4 nm lines in the intervals 18:04–18:15 UTC, 18:24–18:28 UTC and 19:32–19:48 UTC are related, most probably, to weak passing clouds or haze. The exceptions are observed during the pumping cycles at 18:30 UT and 18:36 UT, which are most likely related to F-region shielding by the sporadic E layer observed during these cycles according to the ionosonde data (Figure 3 lower panel). In the ionograms taken in 18:24, 18:30 and 18:36, the E s layer with a critical frequency much higher than the 4.3 MHz pump wave frequency was observed. At the same time, during the cycle when the continuous pumping started at 18:31 UT, a a sharp increase in the 557.7 nm emission intensity simultaneously at the photometer and at the CCD camera was observed (Figure 3 upper and middle panels, Figure 4 upper panel). During this cycle, the 630 nm emission enhancement is absent. During the other 29 cycles of pumping, the green line emission enhancements (as well as moving structures) were not observed.
In addition to a zoomed fragment of the photometer data presented in Figure 3 (upper panel) for green (557.7 nm) and red (630 nm) lines, the ionospherically reflected PW signal and SEE intensity averaged over the frequency range 6.2 f S E E f 0 6.8 kHz are shown in the lower panel of the Figure 4. This range belongs to the prominent SEE spectral feature, so-called Upshifted Maximum (see e.g., [42]). The whole SEE spectra registered at two minutes after the continuous pumping was switched on and averaged over 1 s for 5 successive pumping cycles, as shown in Figure 5. Note that at some frequencies, the SEE spectra are contaminated by interference from radio stations, which is illustrated by the “noise’’ line (dashed) in the Figure 5. This line corresponds to the spectrum registered during the pause in the PW radiation. Particularly, this concerns the frequency range 10 f S E E f 0 7.5 kHz, where the most prominent SEE spectral feature, the Downshifted Maximum, exists. This is why we have chosen the frequency range 6.2 f S E E f 0 6.8 kHz, which belongs to other prominent SEE spectral features, the Upshifted Maximum, for Figure 4, which is interference free. This range is highlighted by gray in Figure 5. From Figure 4 (lower panel) and Figure 5, it is seen that the reflected PW signal is stronger (by ∼10–15 dB), while the SEE is weaker by ∼5–10 dB during the cycle with continuous pumping at 18:31–18:33:30 UT rather than during other cycles. A strong decrease of the reflected PW signal during continuous pumping (so-called anomalous absorption), the SEE generation, as well as the red line emission enhancement are known to be related to the processes occurring near the reflection altitude of the PW in the F-region where plasma (Langmuir and/or upper hybrid) waves are effectively excited by the pump wave (e.g., [42]). Therefore, it is confirmed that during this cycle, the degradation of the F-region-related phenomena (anomalous absorption, SEE generation and 630 nm intensity enhancement) are related to blocking of the upper layers from the PW by sporadic E while the HF-induced 557.7 nm line emission generation occurs in the E s .
Figure 6 shows (in more detail) the intensity variations in the 557.7 nm and 391.4 nm emissions with a 100 ms time integration. The black circles in Figure 6 show the on/off instants for the SURA continuous pumping.
The time of the green line excitation and relaxation during and after the cycle 18:31–18:33:30 UT are close to the radiative lifetime τ r ( O 1 S ) = 0.7 s (Figure 6, middle panel). This is an additional evidence of the green line HF-induced origin.
Within the 18:24–18:27:30 UT pumping cycle, one observes emission intensity variations caused by, presumably, an emergence of a transparent haze. A decrease in the 391.4 nm photometer channel intensity and the simultaneous increase in the 557.7 nm and 630 nm emission intensity evidences this. In the mid-latitude upper atmosphere, the 391.4 nm emission is not observed under normal conditions. It is characteristic of auroras during the precipitation of high-energy particles [36], and it can also be observed when the ionosphere is heated by powerful radio emission [6,7,8,43]. That is, the night-sky radiation recorded in this spectral range will decrease when the haze emerges. The 557.7 nm and 630 nm atmospheric emissions are always visible at mid-latitudes. When the haze occurs, there is a possible effect of radiation scattering on the haze from the entire upper hemisphere. Accordingly, in this case, the photometer records not only the radiation of the atmosphere in its FOV but also the radiation of atmospheric emissions scattered on the haze beyond its FOV.
In both cycles in Figure 6, we note a similar sharp change in the intensity at the addressed instants. This may indicate an increase in the 557.7 nm emission intensity within the 18:24–18:27:30 UT pumping cycle, caused by the radiation from the SURA, against the atmosphere transparency change. However, this cannot be stated unambiguously since anticorrelated time behavior is observed for the violet line. Note also that during this cycle, strong red line enhancement, anomalous absorption and SEE are observed (Figure 4 and Figure 5). Therefore, although the E s critical frequency is high (∼7 MHz, the E s does not provide the F-region shielding.
Within the 18:37–18:39:30 UT pumping cycle, the HF-induced green line enhancement is not observed. The red line enhancement is very weak, although there is anomalous absorption and SEE (the latter is weaker than in 18:21, 18:27, and 18:45 UT). The reason is probably that the E s with a critical frequency of 5.8 MHz is semitransparent and dense enough to provide degradation of the F-region phenomena, but it is not dense enough to provide the green line excitation.
The CCD camera recorded moving weak lighter spots during the facility continuous pumping within the 18:31–18:33:30 UT cycle. The Figure 6 top panel shows such frames.

4. Discussion

An influence of the powerful radio waves on the emission of atomic oxygen lines at 630 nm and 557.7 nm has been studied at the SURA facility since 1983. The 557.7 nm pump-induced emission at the ionospheric F-layer heights by using photometers with PMTs were registered in only a few cases [22,24,28]. In the experiment on 5 September 2021, an increase in the 557.7 nm emission at the sporadic E-layer heights was recorded at the SURA for the first time.
The emission was registered during one 2.5 min long cycle of continuous HF ionosphere pumping 18:31–18:33:30 UT) simultaneously with the existence of the sporadic E layer with critical frequency exceeding the PW frequency. In addition, the strong decrease of the SEE intensity (by 5–10 dB), total suppression of the 630 nm (red line) HF-induced emissions and strong decrease of the PW anomalous absorption (by 10–15 dB) were observed during this cycle. All these phenomena are related to the excitation of the artificial ionospheric turbulence (Langmuir and upper hybrid waves, and plasma irregularities of different scales) in the F-region near the PW reflection height. Therefore, the presence of E s in this particular cycle of pumping leads to the blocking of the major part of the PW energy flux from penetration to the F-region.
During the other 29 cycles of the pumping, the pump-induced green line emission was not registered despite the presence of a quite strong E s at least in two neighboring cycles (started at 18:25 and 18:37 UT). In these cycles, the PW radiation is not blocked completely (strong anomalous absorption and SEE and red line airglow enhancement, see Figure 4 and Figure 5), which can be related to spatial configuration of the E s layer and the difference in the antenna patterns of the ionosonde and optical equipment.
Particularly, in the cycle with the start of continuous pumping at 18:25 UT, a noticeable increase of green and red line intensity are observed. The characteristic decay time after PW switches off for the green line is close to the cycle 18:31–18:33:30 UT; the typical red line decay time is close to one to many cycles with an HF-induced red line. However, the presence of the HF-induced emission cannot be stated unambiguously, since a concurrent increase of the green and red airglow started a minute earlier, at 18:24, together with pulse pumping and the anticorrelated temporal behavior of the violet line. Most probably, the emission behavior during this cycle is related to the influence of both HF pumping and the emergence of the transparent haze.
In the cycle with the start of continuous pumping at 18:37 UT, the HF-induced green line emission is absent, but the red line emission and SEE intensities are noticeably weaker than in other cycles except for 18:31 UT. Possibly, in this cycle, an intermediate case occurs; i.e., the E s with a critical frequency of 5.8 MHz is semitransparent and dense enough to provide degradation of the F-region phenomena, but it is not dense enough to provide the green line excitation.
Previously, an appearance of the 557.7 nm emission at the E s -layer heights was registered both by photometers and CCD imagers during the experiments in January 1998 at the Arecibo heating facility [37,38]. In these cases, the airglow increase was greater than that from the pumped ionospheric F-region.
According to Figure 4, lower panel, black curve, not more than 50% of the PW energy flux is spent for the excitation of the plasma disturbances and electron acceleration in the E s in the cycle stared at 18:31 UT, while in the F-region, the relative PW energy losses during the other cycles achieve ∼90% (anomalous absorption). However, the PW electric field at the E s altitudes (∼100 km) is significantly greater than in the F-region due to spherical divergence, and the pump wave energy flux appears to be large enough for an absolute parametric decay instability to develop the Langmuir waves [37,44]. Although the initial study of the instability provides important insight into the instability process, a self-consistent description of the electron acceleration process arising from HF-excited Langmuir oscillations up to now remains a major theoretical goal.
In [38,45], the authors assumed that horizontal neutral winds near E s height might be detected by patches of ionospheric airglow moving, because the plasma motions in the E region are mainly due to motions of neutral molecules. Based on this method, it is possible to make some estimations of the speed of neutral wind at the E s layer height. On 5 September 2021, 18:32 UT through 18:33 UT, the airglow spot at 557.7 nm observed by the CCD camera is displaced to ∼2.2° (Figure 6, upper panel). Thus, for a height of 100 km, we have a displacement of the airglow spot by ∼3.8 km in 60 s. Accordingly, the estimated zonal neutral wind speed is ∼−49.5 m/s and the meridional one is ∼39.6 m/s. Unfortunately, we could not find some data on horizontal wind at the time of registration of weak green airglow spots. The zonal and meridional horizontal winds for ranges of the Es heights calculated by the HWM14 model (https://github.com/rilma/pyHWM14, accessed on 17 September 2022), as well as the zonal and meridional winds estimated by the motions of weak airglow spots, are listed in Table 1.
The obtained magnitudes of the zonal neutral wind (Table 1) for height ∼120 km are close to the simulation results of a horizontal wind model (HWM14). The Es layer height at that time according to the ionosonde data was ∼115 km. The magnitudes of meridional winds obtained in a similar way are directed oppositely. It should be noted that the estimates of the zonal and meridional velocities of the neutral horizontal wind at the heights of the E-layer deduced in this article are preliminary. This issue seems very important to the authors and, therefore, it will be addressed in more detail in our further papers.

5. Conclusions

During the experiment on Sepember 5, 2021 for the first time, an increase in the 557.7 nm emission intensity induced by the SURA facility radiation was found during the sporadic E-layer layer development, partially blocking the F-region heating of the ionosphere. The latter was determined by a strong decrease of the measured SEE intensity, disappearance of the 630 nm emission generation as well as a strong decrease of the PW anomalous absorption. Using the CCD camera, we managed to obtain frames showing moving regions of the 557.7 nm emission increased intensity at the E s layer heights and to estimate the neutral wind speed (∼70 m/s) and direction (northwest, the azimuth ∼320°) at the E s height.
Previously, similar green line emission enhancement during E s was obtained in January, 1998 at the Arecibo heating facility [37,38]. Since that, such results were not reported in literature. According to [37], the excitation of the 557.7 nm emission will be attributed to the fact that at the E s altitudes (∼100–∼120 km), the pump wave energy flux appears to be large enough for an absolute parametric decay instability to develop the Langmuir waves [37], and it accelerates electrons until energies >4.17 eV, which is sufficient to excite the level O ( 1 S ) responsible for the green line emission generation.
The values of the zonal neutral wind obtained during the measurements are close to the results of modeling the horizontal wind for an altitude of 120 km, which are calculated by the HWM14 model. The values of meridional winds obtained in a a similar way are directed oppositely.

Author Contributions

Conceptualization, S.M.G., I.A.N. and A.B.B.; methodology, S.M.G.; software, A.B.B. and I.D.T.; validation, D.A.K. and A.V.S.; formal analysis, A.B.B. and I.D.T.; investigation, A.B.B., I.D.T., S.M.G. and I.A.N.; writing—original draft preparation, A.B.B., S.M.G. and I.A.N.; writing—review and editing, A.B.B., S.M.G., I.A.N. and R.V.V.; visualization, A.B.B.; funding acquisition, S.M.G. All authors have read and agreed to the published version of the manuscript.

Funding

The experimental data were obtained with the financial support from the Russian Science Foundation grant No. 20-12-00197 by using the Angara Multi-access Center facilities at the ISTP SB RAS http://ckp-rf.ru/ckp/3056/, accessed on 17 September 2022. Data analysis was performed with the financial support from the Ministry of Science and Higher Education of the Russian Federation (Subsidy No. 075-GZ/C3569/278).

Institutional Review Board Statement

The study do not require any ethical approval.

Informed Consent Statement

Informed consent was obtained from all subjects involved in the study.

Data Availability Statement

Not applicable.

Conflicts of Interest

The authors declare no conflict of interest.

References

  1. Biondi, A.A.; Sipler, D.P.; Hake, R.D. Optical (λ6300) detection of radio frequency heating of electrons in theFregion. J. Geophys. Res. 1970, 75, 6421–6424. [Google Scholar] [CrossRef]
  2. Utlaut, W.F.; Cohen, R. Modifying the ionosphere with intense radio waves. Science 1971, 174, 245–254. [Google Scholar] [CrossRef] [PubMed]
  3. Sipler, D.P.; Biondi, M.A. Equatorial F-region neutral winds from nightglow OI 630.0 nm Doppler shifts. Geophys. Res. Lett. 1978, 5, 373–376. [Google Scholar] [CrossRef]
  4. Carlson, H.C.; Wickwar, V.B.; Mantas, G.P. Observations of fluxes of suprathermal electrons accelerated by HF excited instabilities. J. Atmos. Terr. Phys. 1982, 44, 1089–1100. [Google Scholar] [CrossRef]
  5. Bernhardt, P.A.; Duncan, L.M.; Tepley, C.A. Heater-induced cavities as optical tracers of plasma drifts. J. Geophys. Res. Space Phys. 1989, 94, 7003–7010. [Google Scholar] [CrossRef]
  6. Bernhardt, P.A.; Tepley, C.A.; Duncan, L.M. Airglow enhancements associated with plasma cavities formed during ionospheric heating experiments. J. Geophys. Res. Space Phys. 1989, 94, 9071–9092. [Google Scholar] [CrossRef]
  7. Kosch, M.J.; Rietveld, M.T.; Hagfors, T.; Leyser, T.B. High-latitude HF-induced airglow displaced equatorwards of the pump beam. Geophys. Res. Lett. 2000, 27, 2817–2820. [Google Scholar] [CrossRef]
  8. Pedersen, T.R.; Carlson, H.C. First observations of HF heater-produced airglow at the high frequency active auroral research program facility: Thermal excitation and spatial structuring. Radio Sci. 2001, 36, 1013–1026. [Google Scholar] [CrossRef]
  9. Gustavsson, B.; Sergienko, T.; Rietveld, M.T.; Honary, F.; Steen, A.; Brändström, B.U.E.; Leyser, T.B.; Aruliah, A.L.; Aso, T.; Ejiri, M.; et al. First Tomographic estimate of volume distribution of HF-pump enhanced airglow emission. J. Geophys. Res. Space Phys. 2001, 106, 29105–29123. [Google Scholar] [CrossRef] [Green Version]
  10. Kosch, M.J.; Rietveld, M.T.; Kavanagh, A.J.; Davis, C.; Yeoman, T.K.; Honary, F.; Hagfors, T. High-latitude pump-induced optical emissions for frequencies close to the third electron gyro-harmonic. Geophys. Res. Lett. 2002, 29, 27. [Google Scholar] [CrossRef]
  11. Rietveld, M.T.; Kosch, M.J.; Blagoveshchenskaya, N.F.; Kornienko, V.A.; Leyser, T.B.; Yeoman, T.K. Ionospheric electron heating, optical emissions, and striations induced by powerful HF radio waves at high latitudes: Aspect angle dependence. J. Geophys. Res. Space Phys. 2003, 108. [Google Scholar] [CrossRef] [Green Version]
  12. Kosch, M.J.; Rietveld, M.T.; Senior, A.; McCrea, I.W.; Kavanagh, A.J.; Isham, B.; Honary, F. Novel artificial optical annular structures in the high latitude ionosphere over EISCAT. Geophys. Res. Lett. 2004, 31, L12805. [Google Scholar] [CrossRef]
  13. Djuth, F.T.; Pedersen, T.R.; Gerken, E.A.; Bernhardt, P.A.; Selcher, C.A.; Bristow, W.A.; Kosch, M.J. Ionospheric modification at twice the electron cyclotron frequency. Phys. Rev. Lett. 2005, 94, 125001. [Google Scholar] [CrossRef] [Green Version]
  14. Gustavsson, B.; Sergienko, T.; Kosch, M.J.; Rietveld, M.T.; Brändström, B.U.E.; Leyser, T.B.; Isham, B.; Gallop, P.; Aso, T.; Ejiri, M.; et al. The electron energy distribution during HF pumping, a picture painted with all colors. Ann. Geophys. 2005, 23, 1747–1754. [Google Scholar] [CrossRef] [Green Version]
  15. Gustavsson, B.; Newsome, R.; Leyser, T.; Kosch, M.; Norin, L.; McCarrick, M.; Pedersen, T.; Watkins, B. First observations of X-mode suppression of O-mode HF enhancements at 6300 Å. Geophys. Res. Lett. 2009, 36. [Google Scholar] [CrossRef] [Green Version]
  16. Kendall, E.; Marshall, R.; Parris, R.T.; Bhatt, A.; Coster, A.; Pedersen, T.; Bernhardt, P.; Selcher, C. Decameter structure in heater-induced airglow at the High frequency Active Auroral Research Program facility. J. Geophys. Res. Space Phys. 2010, 115. [Google Scholar] [CrossRef] [Green Version]
  17. Pedersen, T.; Gustavsson, B.; Mishin, E.; MacKenzie, E.; Carlson, H.C.; Starks, M.; Mills, T. Optical ring formation and ionization production in high-power HF heating experiments at HAARP. Geophys. Res. Lett. 2009, 36. [Google Scholar] [CrossRef]
  18. Kosch, M.J.; Bryers, C.; Rietveld, M.T.; Yeoman, T.K.; Ogawa, Y. Aspect angle sensitivity of pump-induced optical emissions at EISCAT. Earth Planets Space 2014, 66, 1–9. [Google Scholar] [CrossRef] [Green Version]
  19. Blagoveshchenskaya, N.; Borisova, T.; Kosch, M.; Sergienko, T.; Brändström, U.; Yeoman, T.K.; Häggström, I. Optical and ionospheric phenomena at EISCAT under continuous X-mode HF pumping. J. Geophys. Res. Space Phys. 2014, 119, 10483–10498. [Google Scholar] [CrossRef] [Green Version]
  20. Bernhardt, P.A.; Scales, W.A.; Grach, S.M.; Keroshtin, A.N.; Kotik, D.S.; Polyakov, S.V. Excitation of artificial airglow by high power radio waves from the “Sura” Ionospheric Heating Facility. Geophys. Res. Lett. 1991, 18, 1477–1480. [Google Scholar] [CrossRef]
  21. Bernhardt, P.A.; Wong, M.; Huba, J.D.; Fejer, B.G.; Wagner, L.S.; Goldstein, J.A.; Selcher, C.A.; Frolov, V.L.; Sergeev, E.N. Optical remote sensing of the thermosphere with HF pumped artificial airglow. J. Geophys. Res. Space Phys. 2000, 105, 10657–10671. [Google Scholar] [CrossRef]
  22. Gumerov, R.I.; Kapkov, V.B.; Komrakov, G.P.; Nasyrov, A.M. Artificial ionospheric glow caused by the short-term effect of high-power RF radiation. Radiophys. Quantum Electron. 1999, 42, 463–465. [Google Scholar] [CrossRef]
  23. Kosch, M.J.; Pedersen, T.; Mishin, E.; Starks, M.; Gerken-Kendall, E.; Sentman, D.; Oyama, S.; Watkins, B. Temporal evolution of pump beam self-focusing at the high-frequency active auroral research program. J. Geophys. Res. Space Phys. 2007, 112. [Google Scholar] [CrossRef] [Green Version]
  24. Grach, S.M.; Sergeev, E.N.; Nasyrov, A.M.; Gumerov, R.I.; Shaimukhametov, R.R.; Nasyrov, I.A.; Komrakov, G.P. Simultaneous observations of the 557.7 nm airglow and stimulated electromagnetic emission during HF pumping of the ionosphere with diagnostic schedule: First results. Adv. Space Res. 2004, 34, 2422–2427. [Google Scholar] [CrossRef]
  25. Grach, S.M.; Sergeev, E.N.; Komrakov, G.P.; Kotov, P.V.; Nasyrov, A.M.; Gumerov, R.I.; Shaimukhametov, R.R.; Nasyrov, I.A. Studies of artificial airglow emission at 557.7 nm (green line) of upper atmosphere caused by “Sura” facility. Proc. SPIE-Int. Soc. Opt. Eng. 2006, 6522, 598–605. [Google Scholar] [CrossRef]
  26. Grach, S.; Kosch, M.; Yashnov, V.; Sergeev, E.; Atroshenko, M.; Kotov, P. On the location and structure of the artificial 630-nm airglow patch over Sura facility. Ann. Geophys. 2007, 25, 689–700. [Google Scholar] [CrossRef] [Green Version]
  27. Kalogerakis, K.S.; Slanger, T.G.; Kendall, E.A.; Pedersen, T.R.; Kosch, M.J.; Gustavsson, B.; Rietveld, M.T. Remote oxygen sensing by Ionospheric excitation (ROSIE). Ann. Geophys. 2009, 27, 2183–2189. [Google Scholar] [CrossRef] [Green Version]
  28. Grach, S.; Klimenko, V.; Shindin, A.; Nasyrov, I.; Sergeev, E.; Yashnov, V.; Pogorelko, N. Airglow during ionospheric modifications by the sura facility radiation. Experimental results obtained in 2010. Radiophys. Quantum Electron. 2012, 55, 33–50. [Google Scholar] [CrossRef]
  29. Shindin, A.; Grach, S.; Klimenko, V.; Nasyrov, I.; Sergeev, E.; Beletski, A.; Taschilin, M.; I.Gumerov, R. The 630 nm and 557.7 nm Airglow during HF Ionosphere Pumping by the SURA Facility Radiation for Pump Frequencies Near the Fourth Electron Gyroharmonic. Radiophys. Quantum Electron. 2015, 57, 759–772. [Google Scholar] [CrossRef]
  30. Klimenko, V.; Grach, S.; Sergeev, E.; Shindin, A. Features of the Ionospheric Artificial Airglow Caused by Ohmic Heating and Plasma Turbulence-Accelerated Electrons Induced by HF Pumping of the Sura Heating Facility. Radiophys. Quantum Electron. 2017, 60, 431–449. [Google Scholar] [CrossRef]
  31. Grach, S.; Nasyrov, I.; Kogogin, D.; Shindin, A.; Dementiev, V.; Sergeev, E.; Akchurin, A. On the Connection between the Spatial Behavior of the Total Electron Content of the Ionosphere on the GPS Signal Path and the Ionospheric Artificial Airglow in the 630 nm Line. Radiophys. Quantum Electron. 2018, 61, 161–175. [Google Scholar] [CrossRef]
  32. Grach, S.; Nasyrov, I.; Kogogin, D.; Shindin, A.; Sergeev, E.; Razi Mousavi, S. Mutual Allocation of the Artificial Airglow Patches and Large-Scale Irregularities in the HF-Pumped Ionosphere. Geophys. Res. Lett. 2018, 45, 12749–12756. [Google Scholar] [CrossRef]
  33. Shindin, A.; Klimenko, V.; Kogogin, D.; Beletsky, A.; Grach, S.; Nasyrov, I.; Sergeev, E. Spatial Characteristics of the 630-nm Artificial Ionospheric Airglow Generation Region During the Sura Facility Pumping. Radiophys. Quantum Electron. 2018, 60, 849–865. [Google Scholar] [CrossRef]
  34. Kogogin, D.; Nasyrov, I.; Shindin, A.; Grach, S.; Maksimov, D.; Zagretdinov, R.; Dementiev, V. Dynamic Changes of the Ionospheric Artificial Airglow Region Caused by High-Power Radio Waves Based on a Joint Analysis of Night-Sky Snapshots in the 630 nm Line and Total Electron Content Variation Maps. Radiophys. Quantum Electron. 2020, 63, 83–96. [Google Scholar] [CrossRef]
  35. McEwan, M.; Phillips, L. Chemistry of the Atmosphere; Arnold: London, UK, 1975. [Google Scholar]
  36. Khomich, V.Y.; Semenov, A.I.; Shefov, N.N. Airglow as an Indicator of Upper Atmospheric Structure and Dynamics; Springer: Berlin/Heidelberg, Germany, 2008. [Google Scholar] [CrossRef]
  37. Djuth, F.; Bernhardt, P.; Tepley, C.; Gardner, J.; Kelley, M.; Broadfoot, A.; Kagan, L.; Sulzer, M.; Elder, J.; Selcher, C.; et al. Large airglow enhancements produced via wave-plasma interactions in sporadic E. Geophys. Res. Lett. 1999, 26, 1557–1560. [Google Scholar] [CrossRef]
  38. Kagan, L.; Kelley, M.; Garcia, F.; Bernhardt, P.; Djuth, F.; Sulzer, M.; Tepley, C. Structure of electromagnetic wave induced 557.7 nm emission associated with a sporadic E event over Arecibo. Phys. Rev. Lett. 2000, 85, 218–221. [Google Scholar] [CrossRef]
  39. Sims, G.; Ashley, M.C.B.; Cui, X.; Everett, J.R.; Feng, L.L.; Gong, X.; Hengst, S.; Hu, Z.; Lawrence, J.S.; Luong-Van, D.M.; et al. Airglow and Aurorae at Dome A, Antarctica. Publ. Astron. Soc. Pac. 2012, 124, 637–649. [Google Scholar] [CrossRef]
  40. Thide, B.; Kopka, H.; Stubbe, P. Observations of stimulated scattering of a strong high–frequency radio wave in the ionosphere. Phys. Rev. Lett. 1982, 49, 1561–1564. [Google Scholar] [CrossRef]
  41. Stubbe, P.; Kopka, H.; Thide, B.; Derblom, H. Simulated electromagnetic emission: A new technique to study the parametric decay instability in the ionosphere. J. Geophys. Res. 1984, 89, 7523–7536. [Google Scholar] [CrossRef]
  42. Grach, S.; Sergeev, E.; Mishin, E.; Shindin, A. Dynamic properties of ionospheric plasma turbulence driven by high-power high-frequency radiowaves. Physics-Uspekhi 2016, 59, 1091–1128. [Google Scholar] [CrossRef]
  43. Gurevich, A. Nonlinear effects in the ionosphere. Physics-Uspekhi 2007, 50, 1091–1121. [Google Scholar] [CrossRef]
  44. Newman, D.; Goldman, M.; Djuth, F.; Bernhardt, P. Langmuir turbulence associated with ionospheric modification: Challenge associated with recent observations during a sporadic-E event. Phys. Space Plasmas 1998, 15, 259. [Google Scholar]
  45. Kagan, L.; Bakhmet’eva, N.; Belikovich, V.; Tolmacheva, A.; Kelley, M. Structure and dynamics of sporadic layers of ionization in the ionospheric E region. Radio Sci. 2002, 37, 18-1–18-12. [Google Scholar] [CrossRef]
Figure 1. Photometric model CCD camera frame oriented to the cardinal points. The elevation angles are plotted along the axes (zenith is 90°). The black circle marks the 557.7 nm photometer channel FOV. The white rectangle is the region with the greatest response to pumping during the E s layer evolution.
Atmosphere 13 01794 g001
Figure 2. Data from the 557.7 nm, 630 nm, and 391.4 nm photometer channels. The data are integrated over the CCD camera exposure time (27 s). The dotted line shows the trend for the corresponding photometer channels. The SURA pulse emission and continuous pumping periods are highlighted in gray and pink colors, respectively, as well as in the following figures.
Atmosphere 13 01794 g002
Figure 3. Variations in the intensity of the night sky glow in the 557.7 nm and 630 nm emissions from the photometer data with a removed trend (upper panel). Photometer data were integrated by the CCD camera exposure (27 s). The (middle panel) shows the time dependence for the 557.7 nm emission obtained with a CCD camera (averaged over the frame area (see Figure 1), with a removed trend), and the 391.4 nm emission from the photometer data. The (lower panel) shows the critical frequencies f o E s and f o F 2 . The red dotted line shows the SURA radiation frequency.
Atmosphere 13 01794 g003
Figure 4. Upper panel: a fragment of data presented in Figure 3. Variations in the emissions intensity at 557.7 nm and 630.0 nm (upper panel) from the photometer data (integration time 1 s). Lower panel: the ionospherically reflected PW signal (black) and SEE intensity averaged over the frequency range 6.2 f S E E f 0 6.8 kHz (blue).
Atmosphere 13 01794 g004
Figure 5. SEE spectra obtained at two minutes after continuous pumping switch on during the cycles shown in the Figure 4. Black dashed line corresponds to the spectrum of the background noise and interference.
Atmosphere 13 01794 g005
Figure 6. Photometric curves of ionospheric airglow at the 557.7 (middle panel) and 391.4 nm (low panel) obtained on 5 September 2021. The pumping mode is shown by colored rectangles. The (top panel) shows the CCD camera frames at 557.7 nm. The time moments for these on the (upper panel) frames are shown by arrows drawn to the curve in the (middle panel). The black arrows on the top panel show the luminous spot.
Atmosphere 13 01794 g006
Table 1. Comparison of zonal and meridional winds according to different data.
Altitude, kmHWM14Light Spots
Zonal
Wind, m/s
Meridional
Wind, m/s
Zonal
Wind, m/s
Meridional
Wind, m/s
100−6.7−9.3−49.539.6
105−17.8−19.6−5241.6
110−4.8−17−54.543.6
115−27.4−17.5−5745.6
120−50−23.1−59.447.6
125−49.9−28−61.949.5
130−43.3−26.3−64.451.5
Publisher’s Note: MDPI stays neutral with regard to jurisdictional claims in published maps and institutional affiliations.

