
Comparison of Atmospheric Turbulence Characteristics over Sea Surface and Land Surface before, during, and after Typhoons
 ,
,
Abstract
:1. Introduction
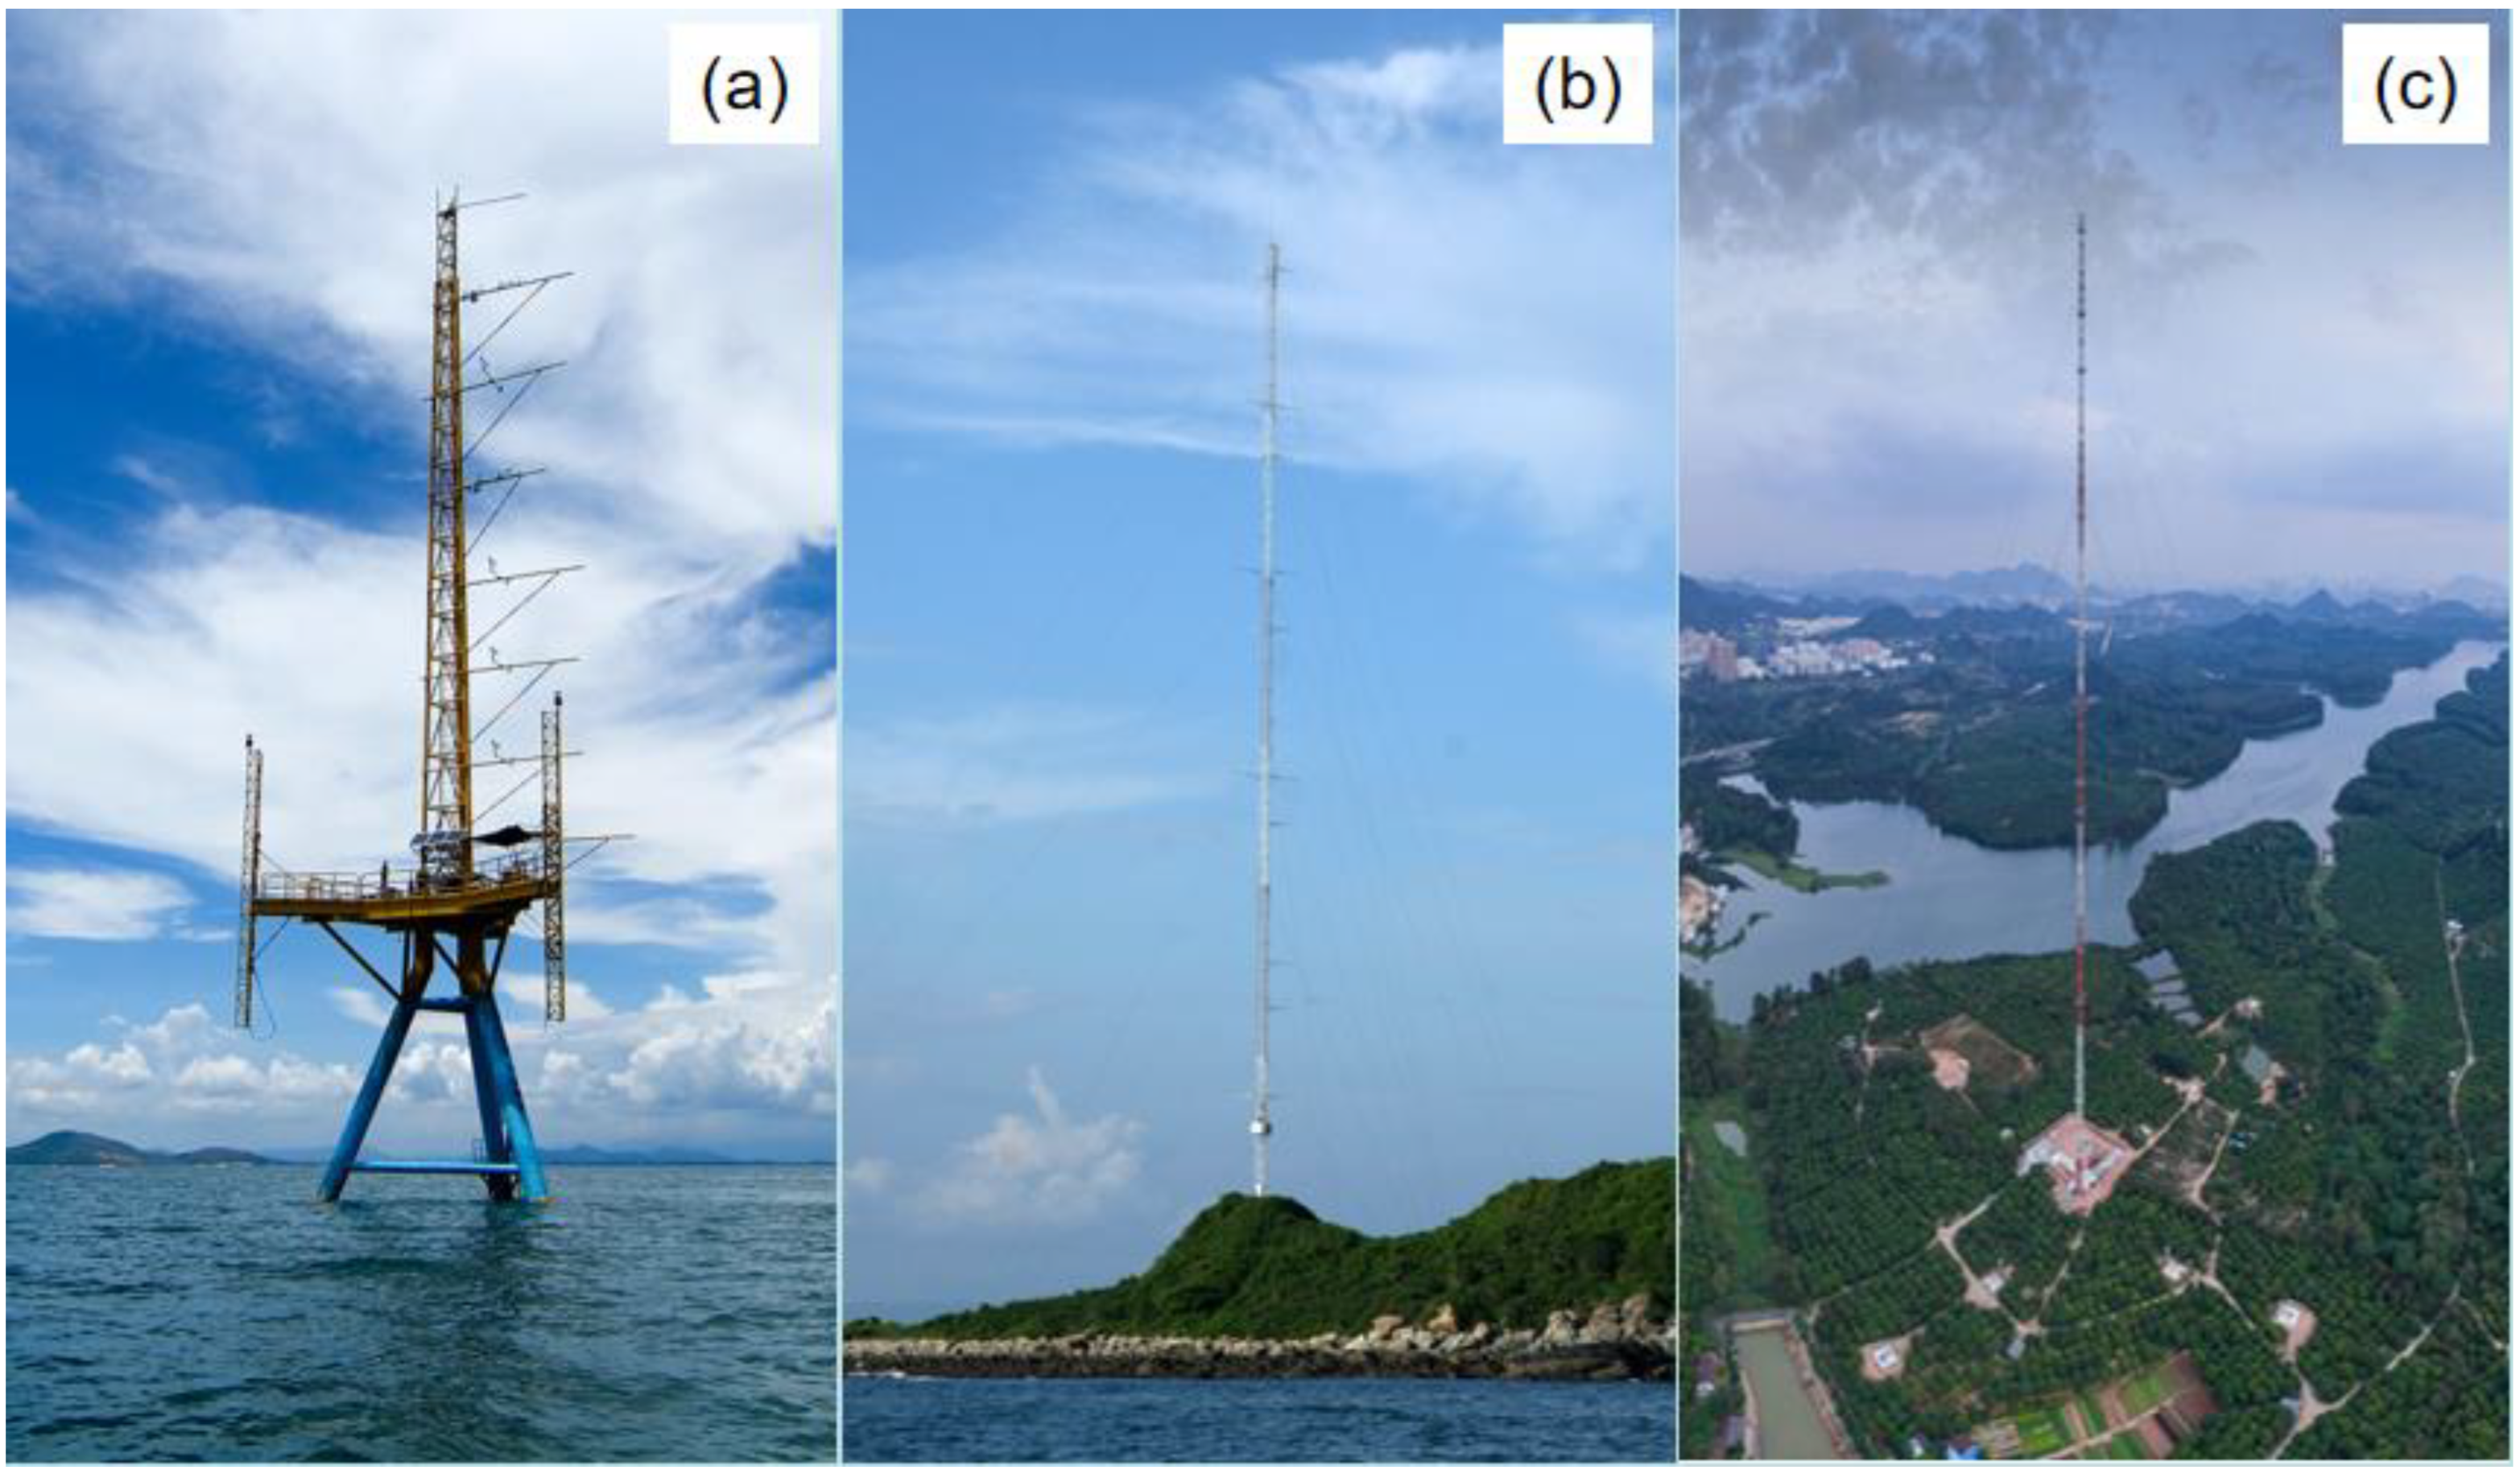
2. Experimental Setup
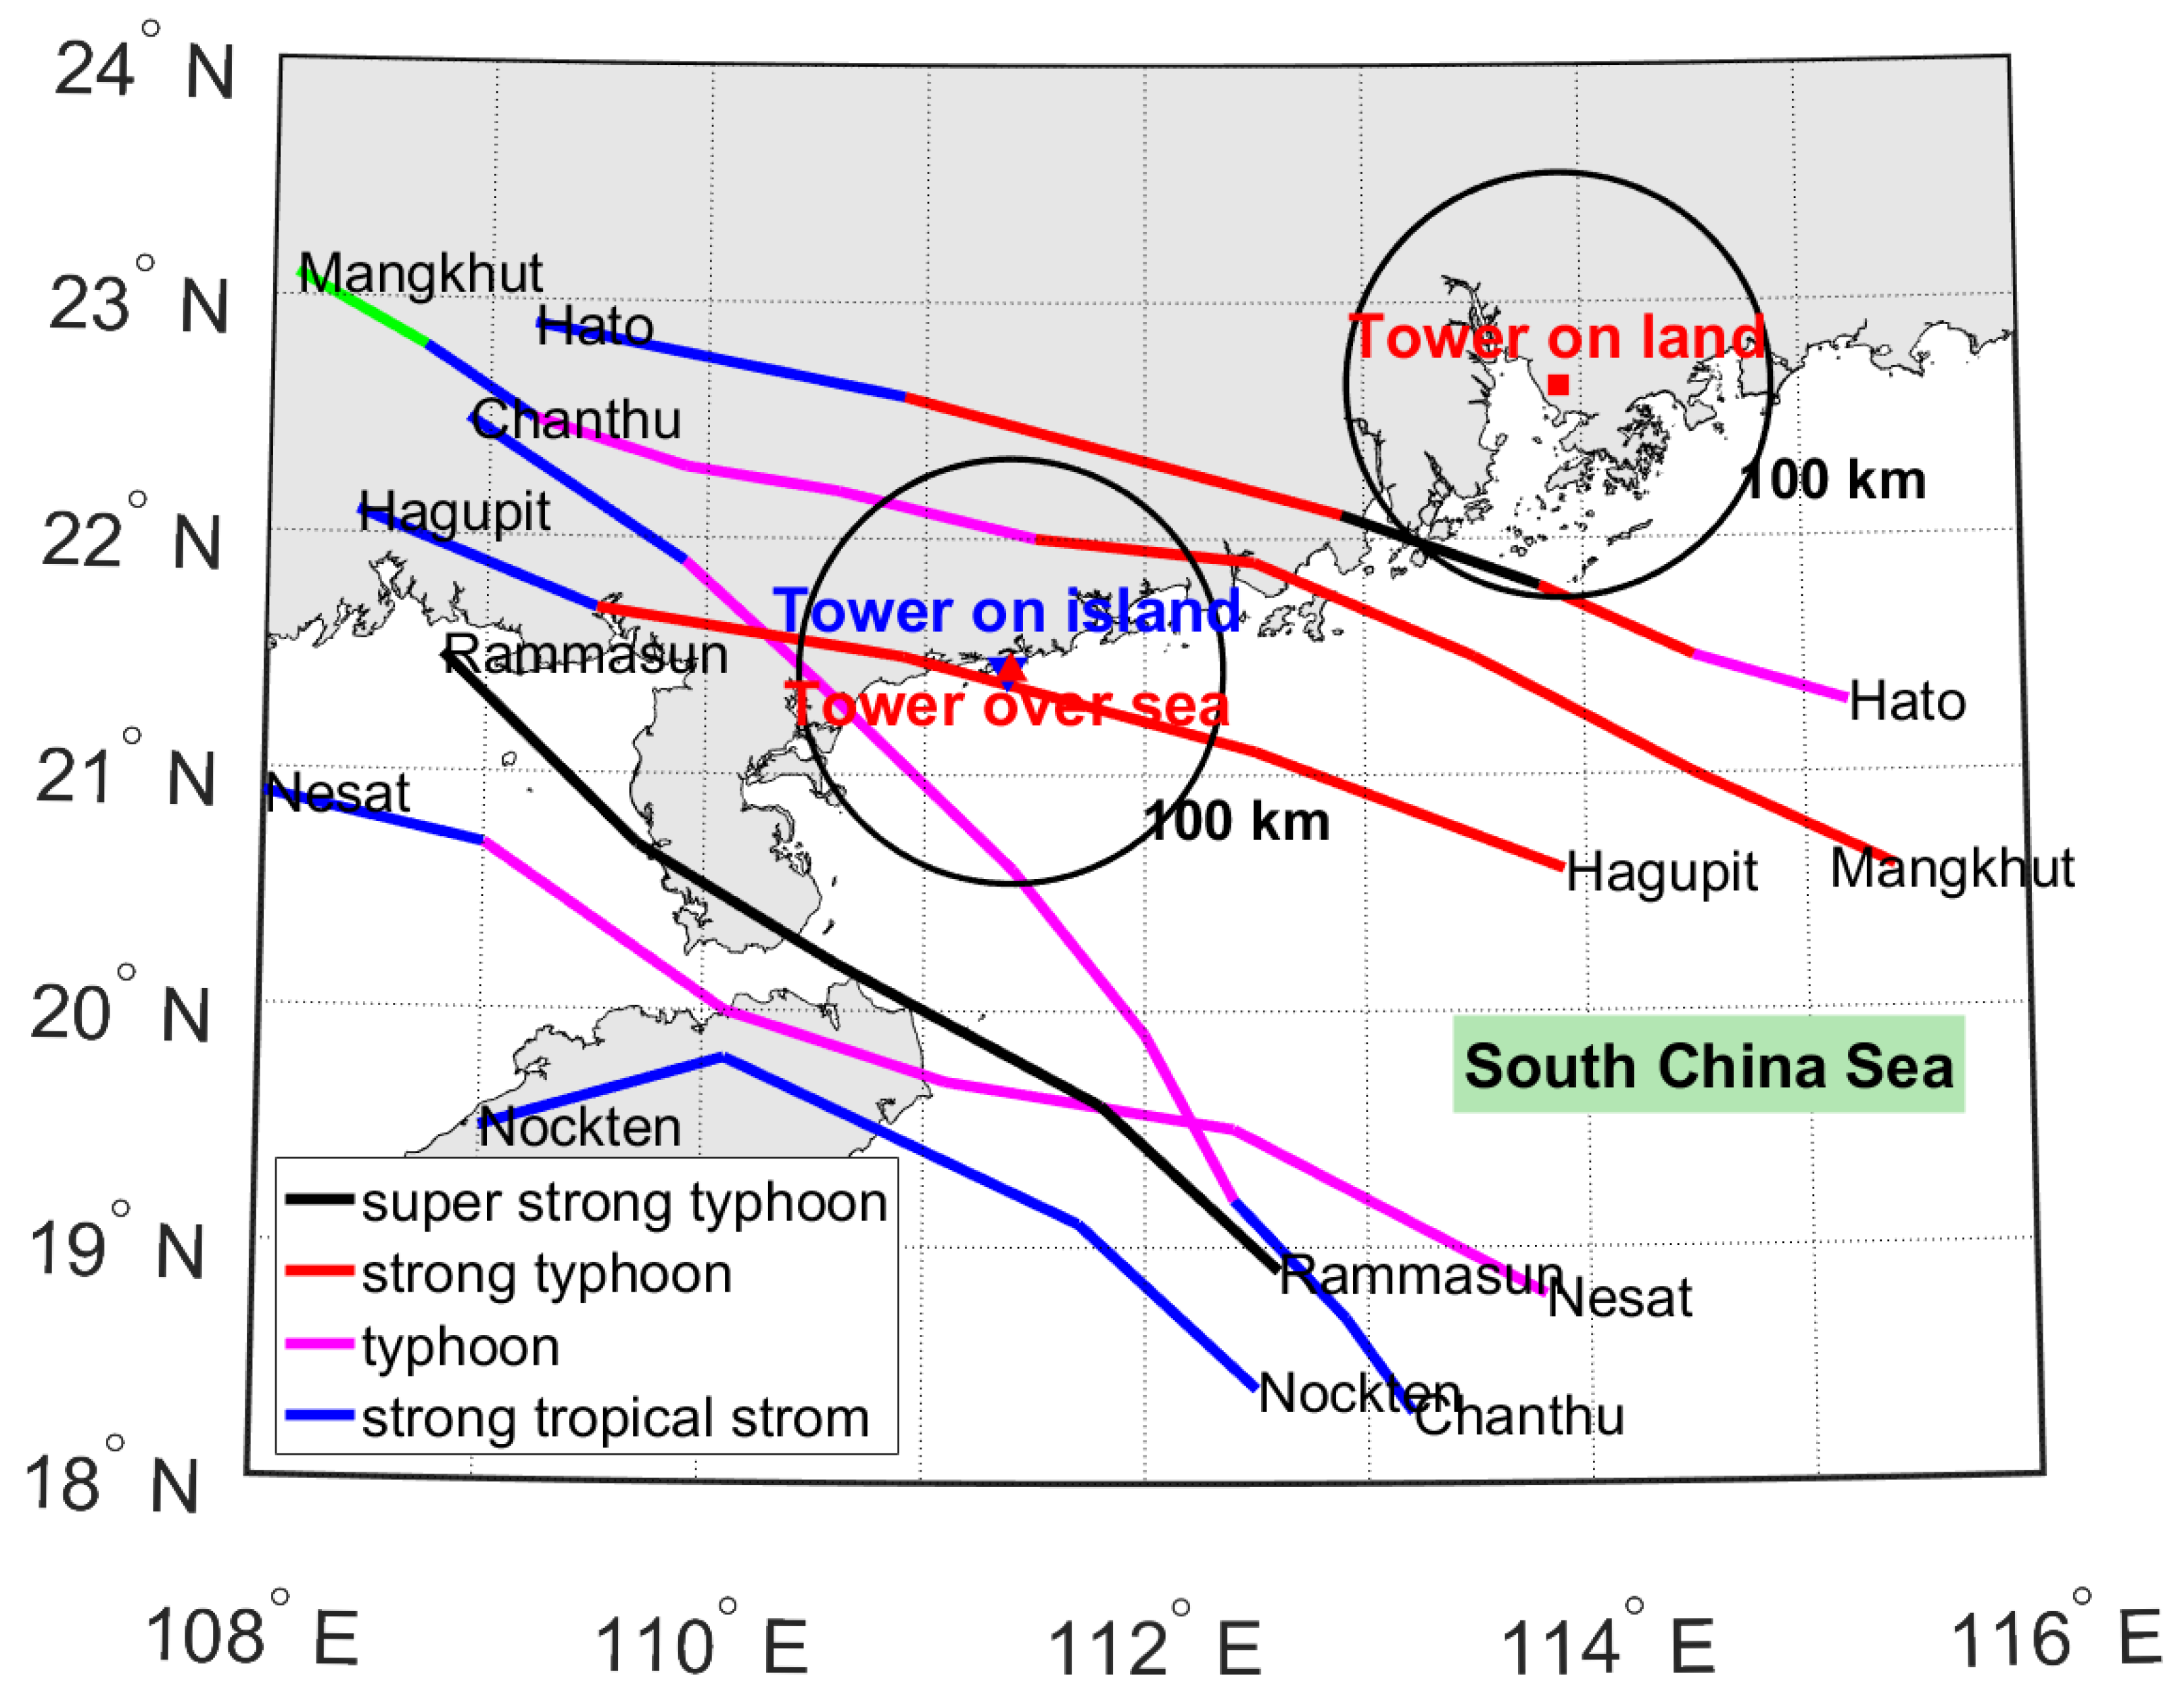
3. Characteristics of the Typhoons
4. Methodology
4.1. Atmospheric Stability Parameter
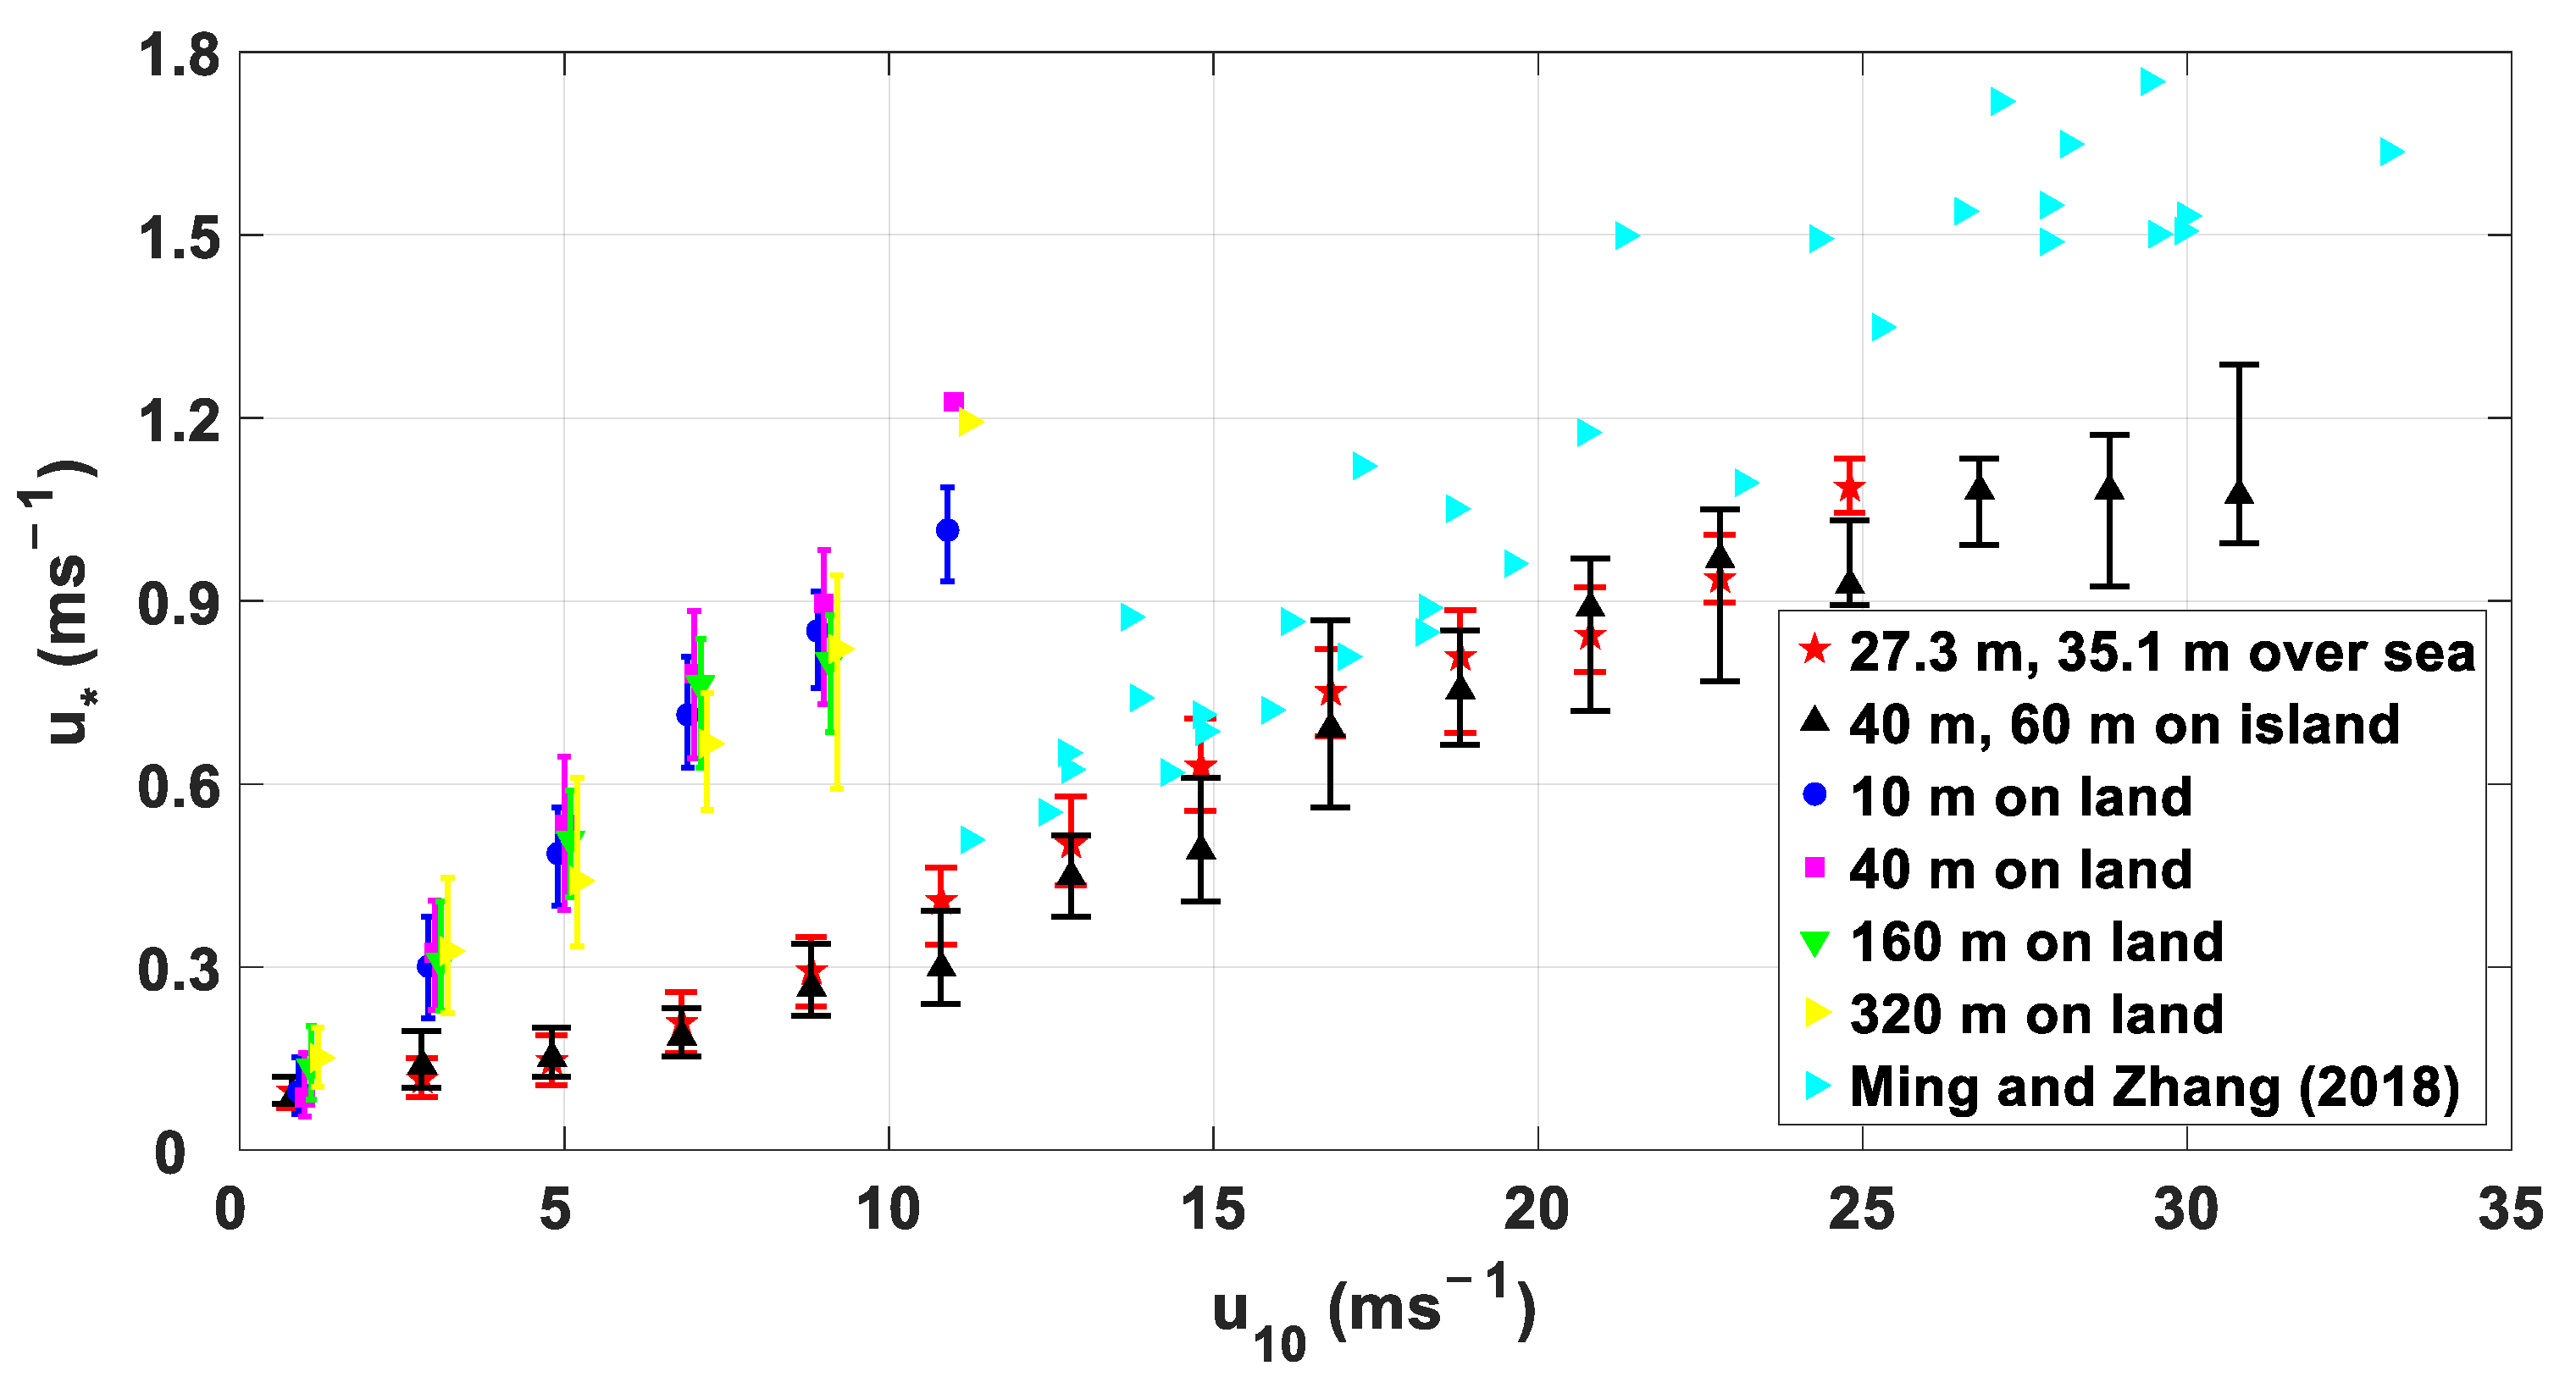
4.2. Friction Velocity ()
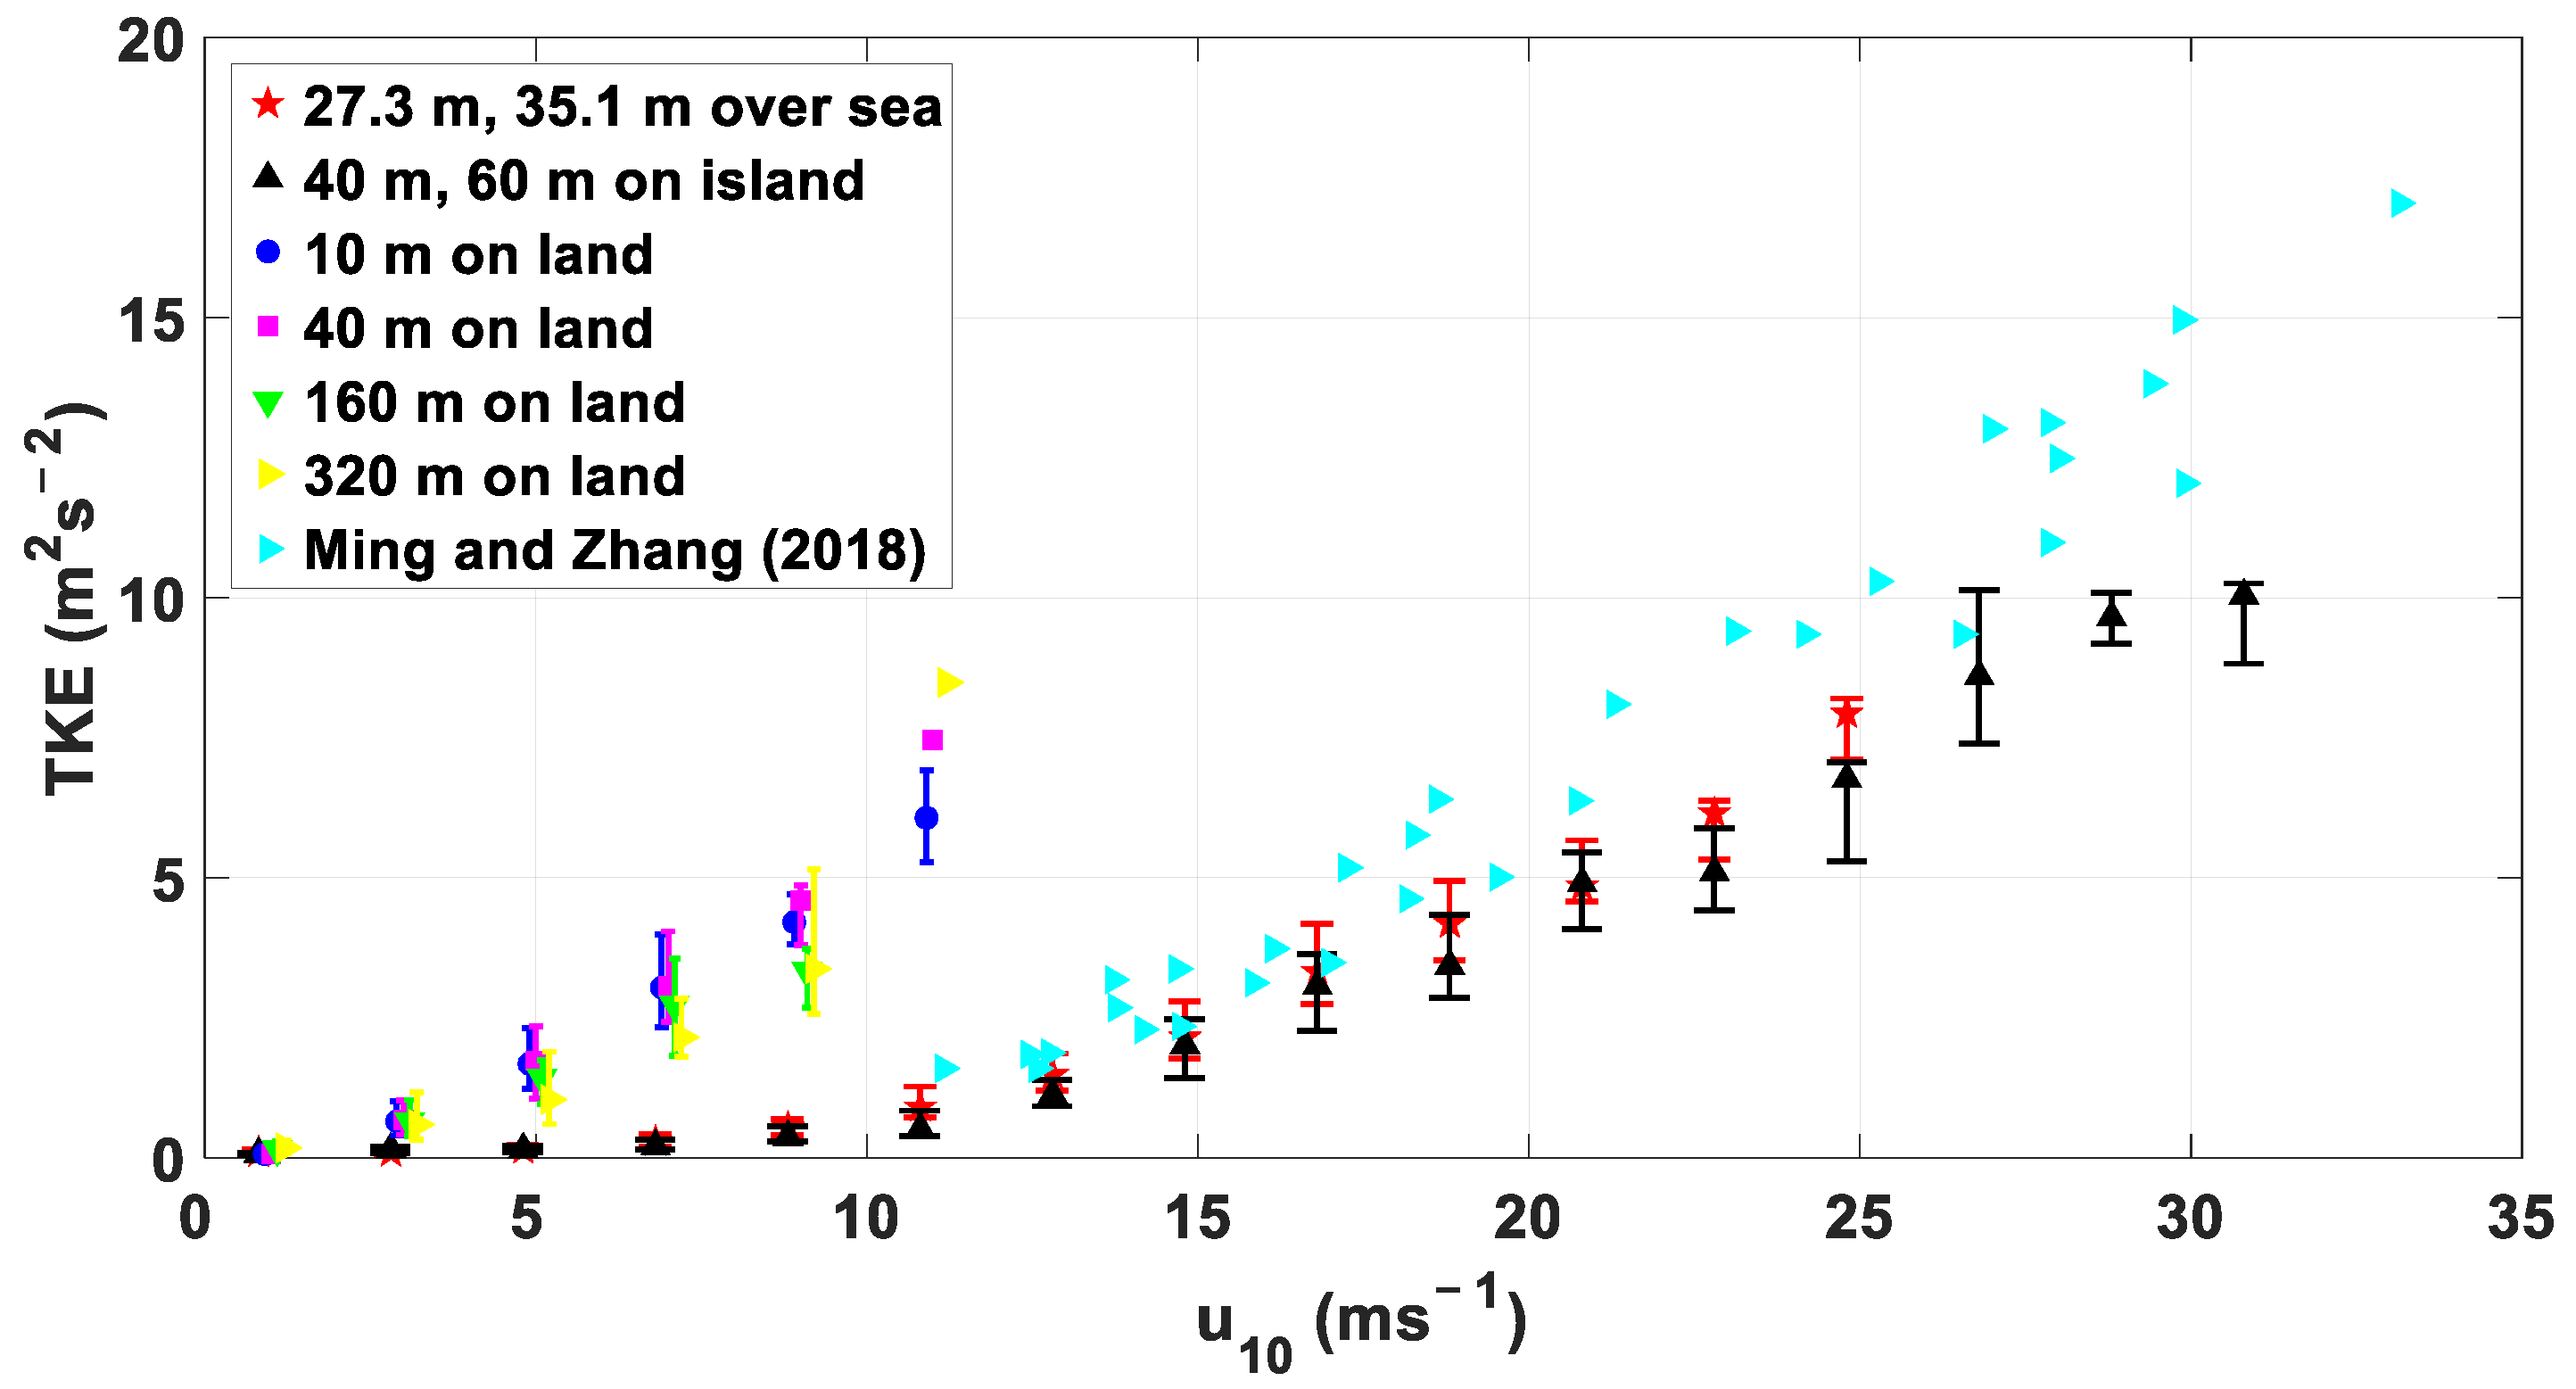
4.3. Turbulent Kinetic Energy ()
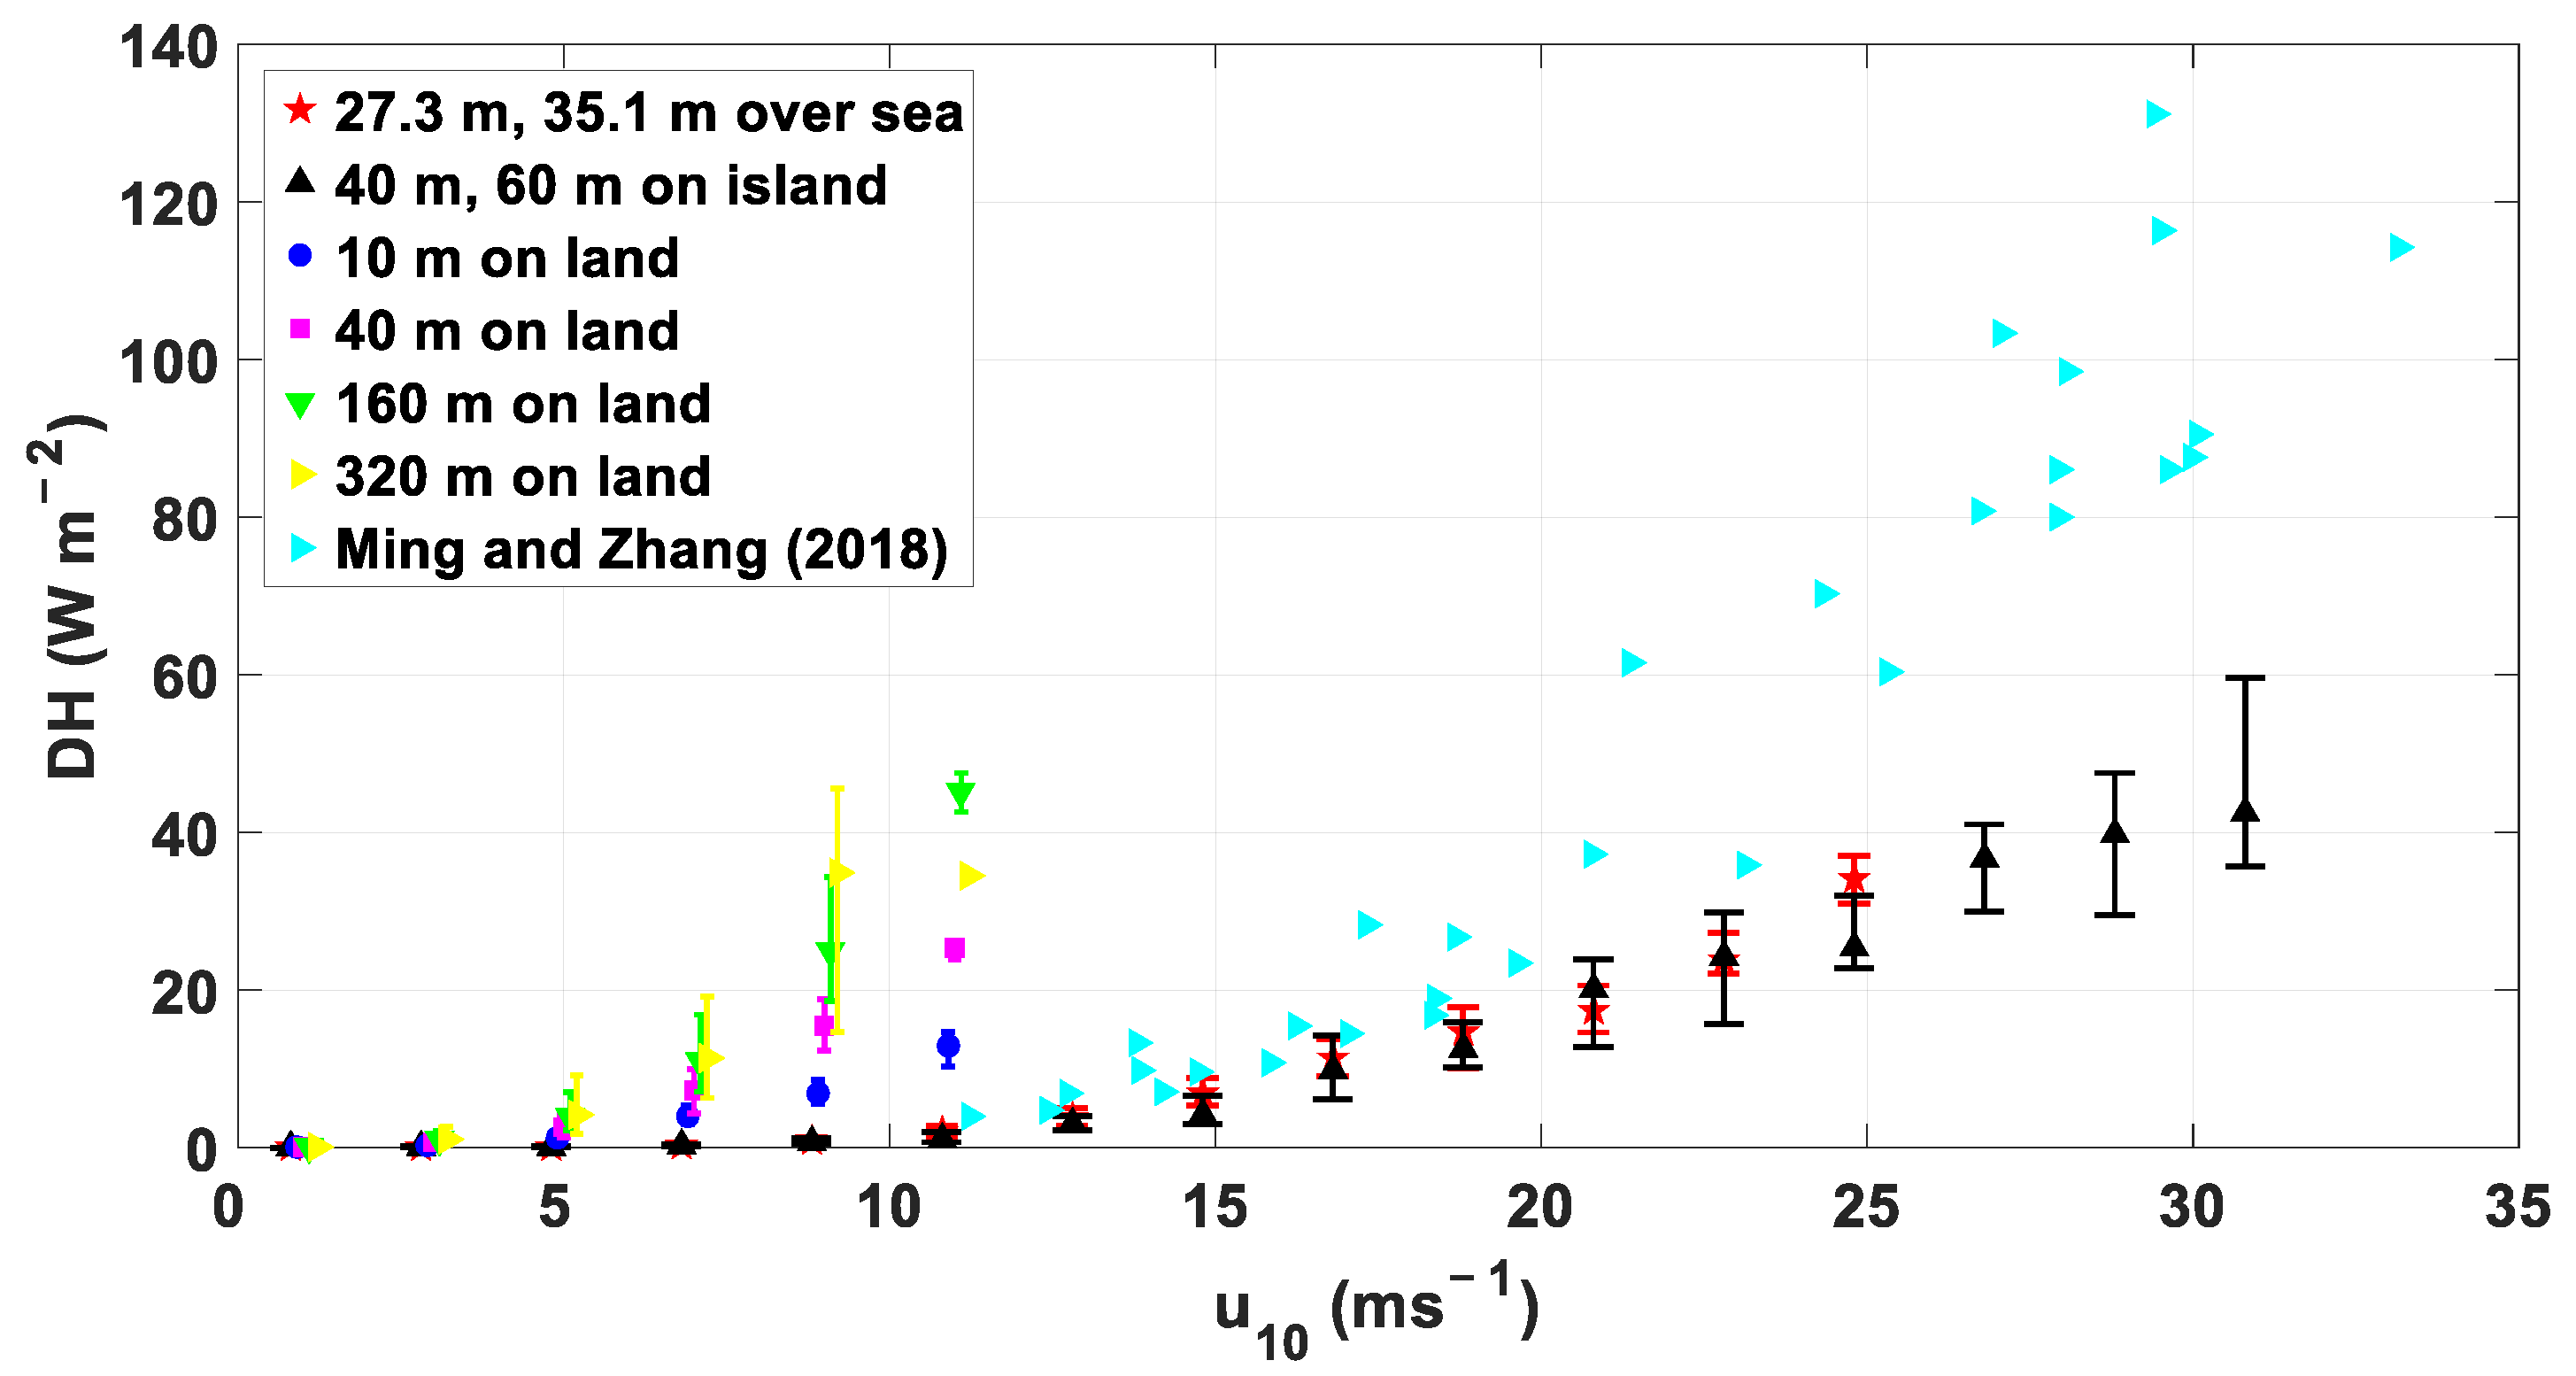
4.4. Dissipative Heating ()
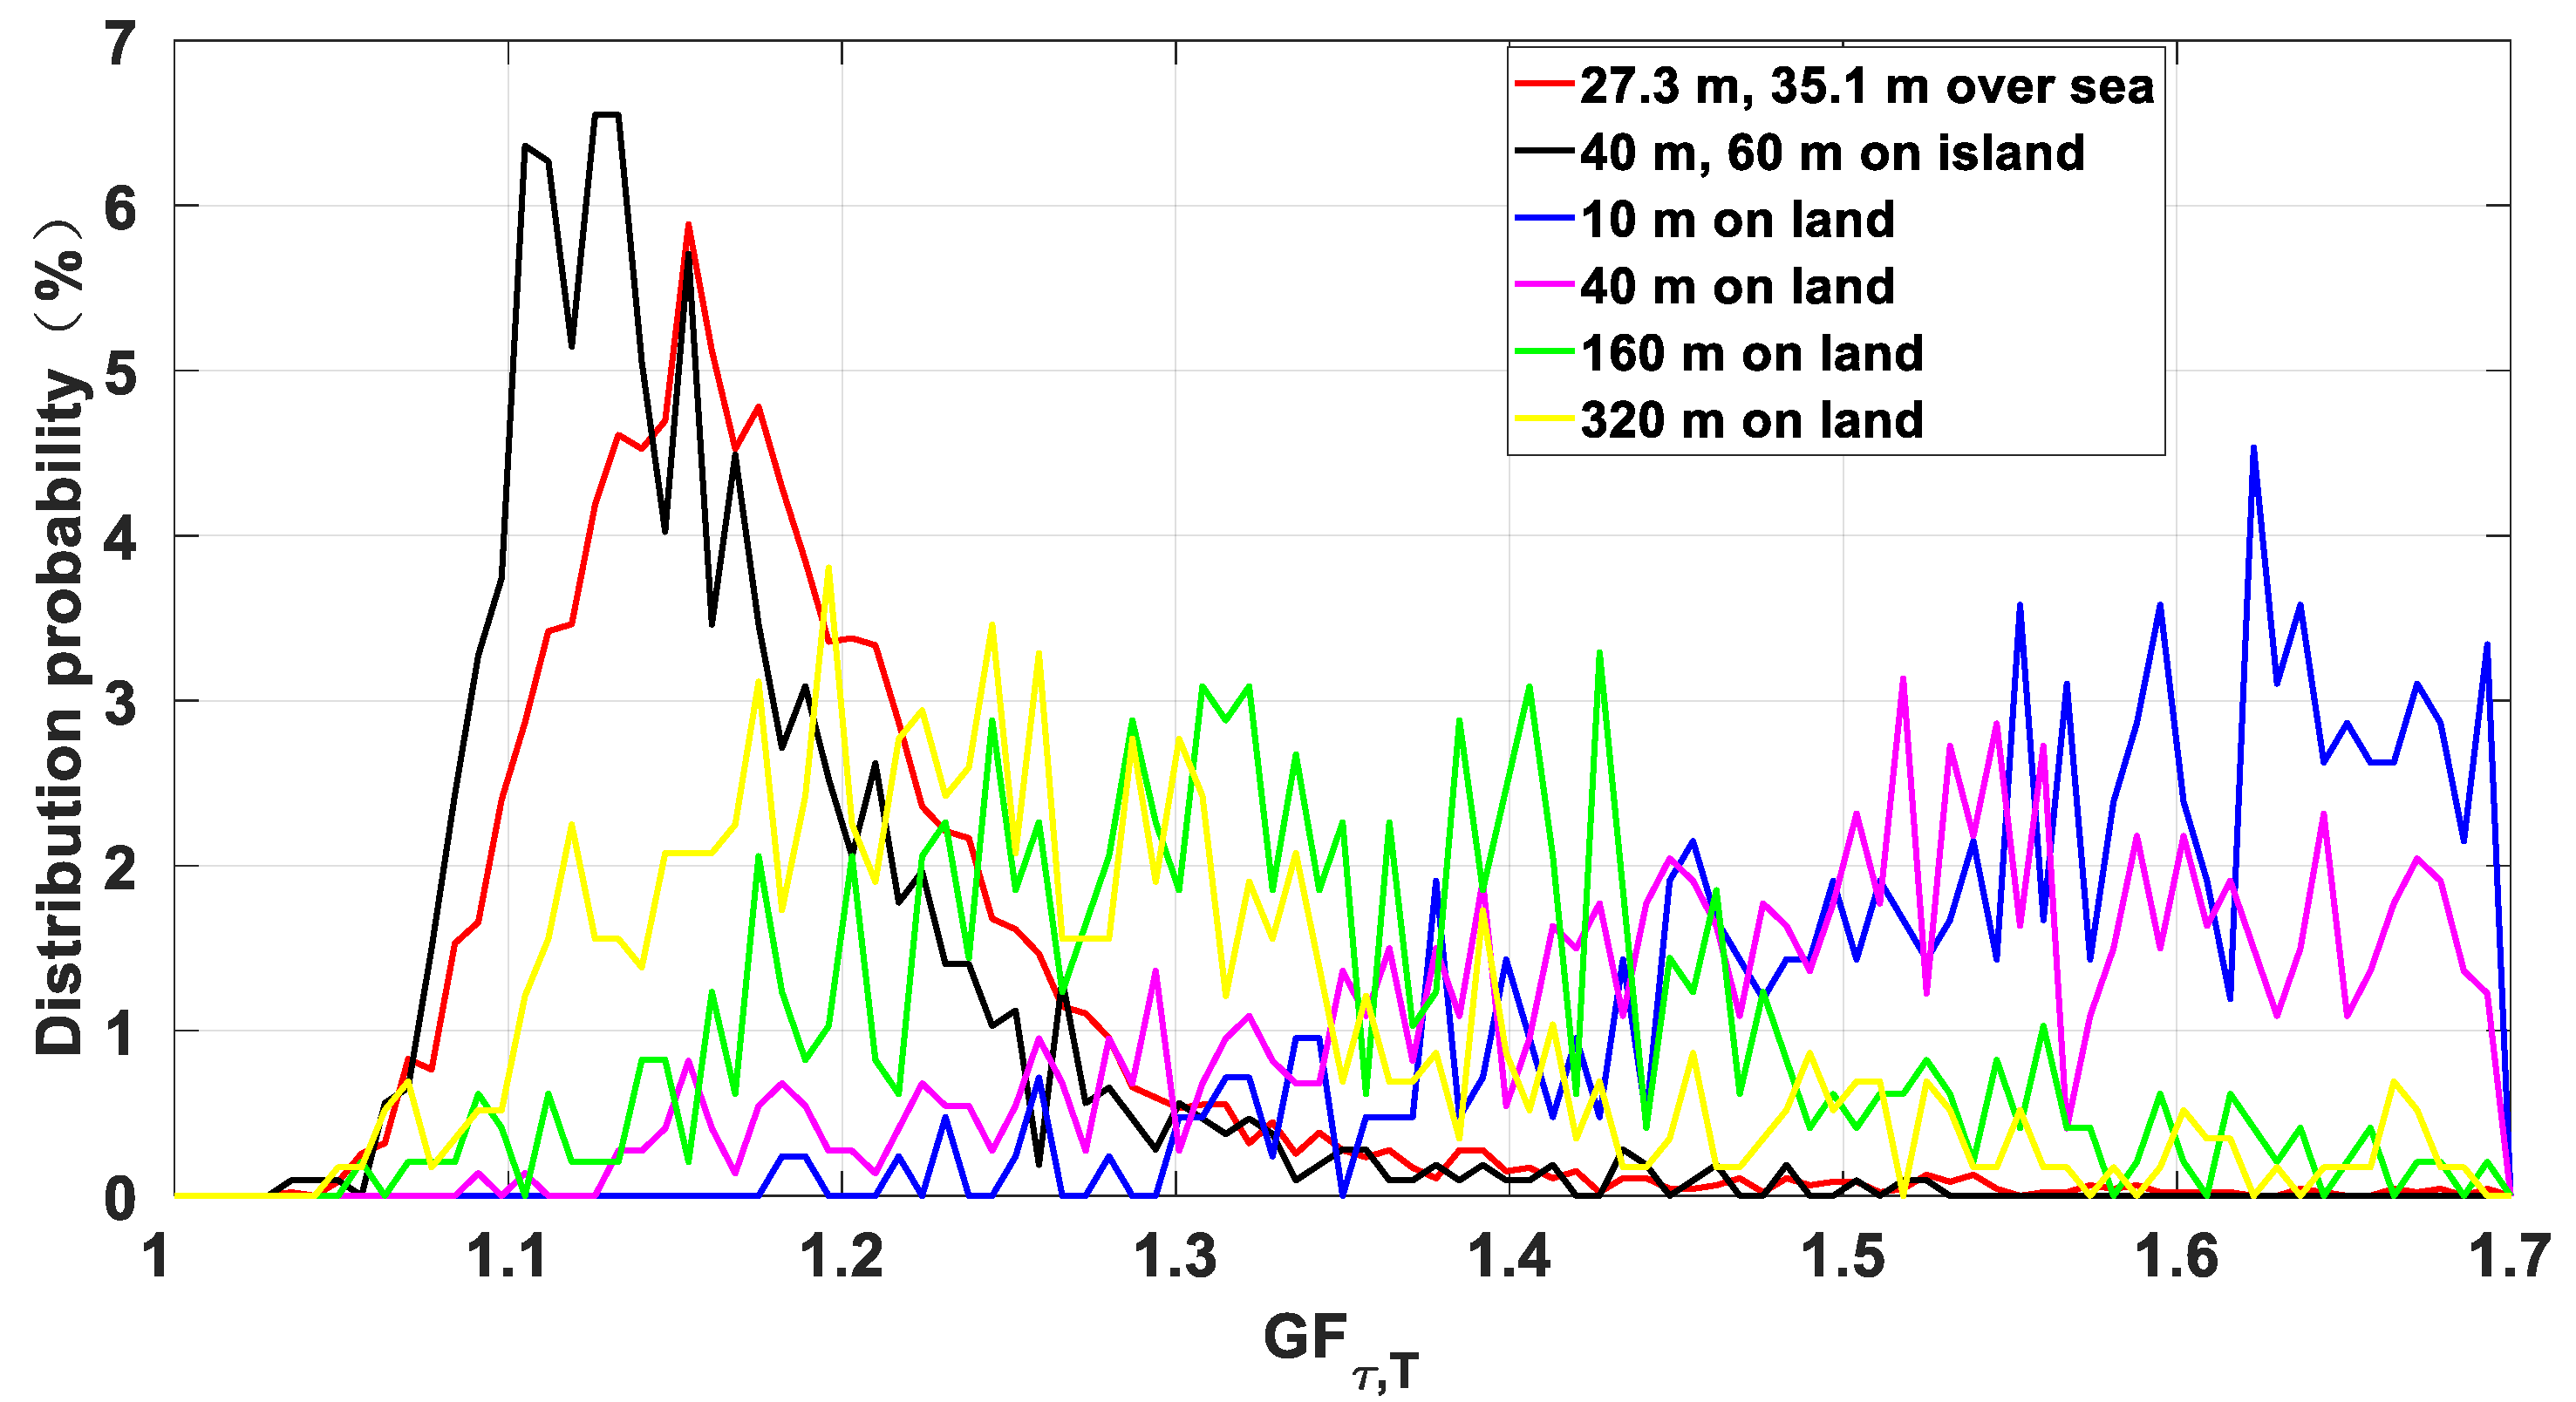
4.5. Gust Factor ()
5. Data Processing and Quality Control
6. Results
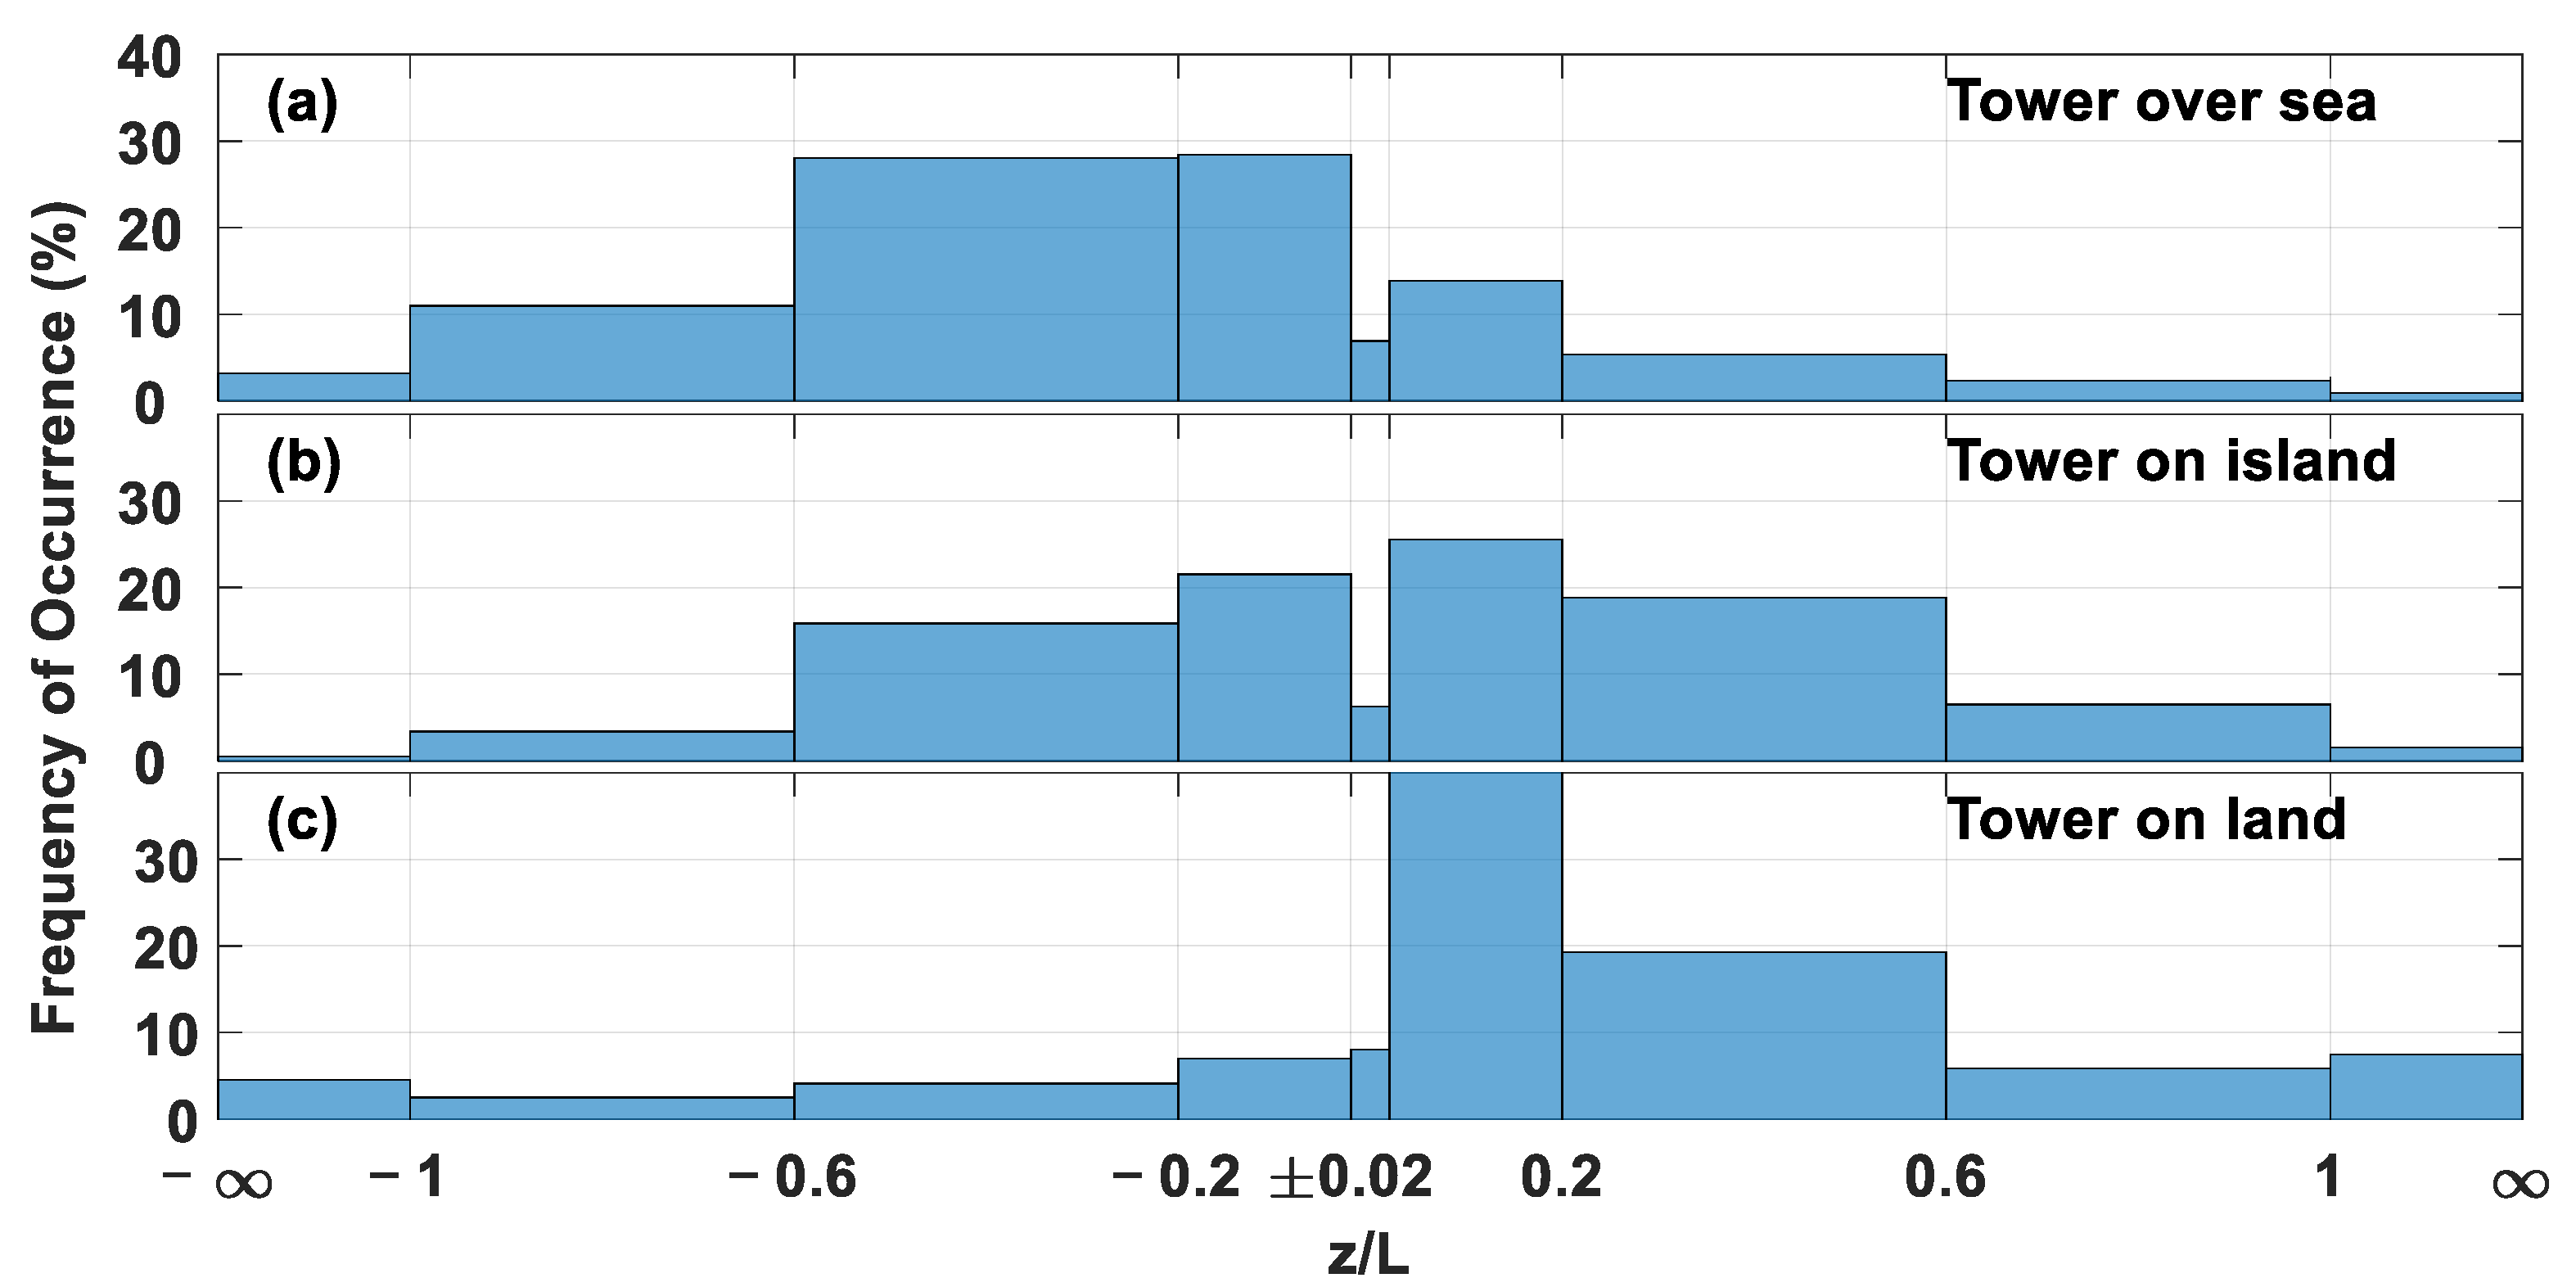
6.1. Atmospheric Stability
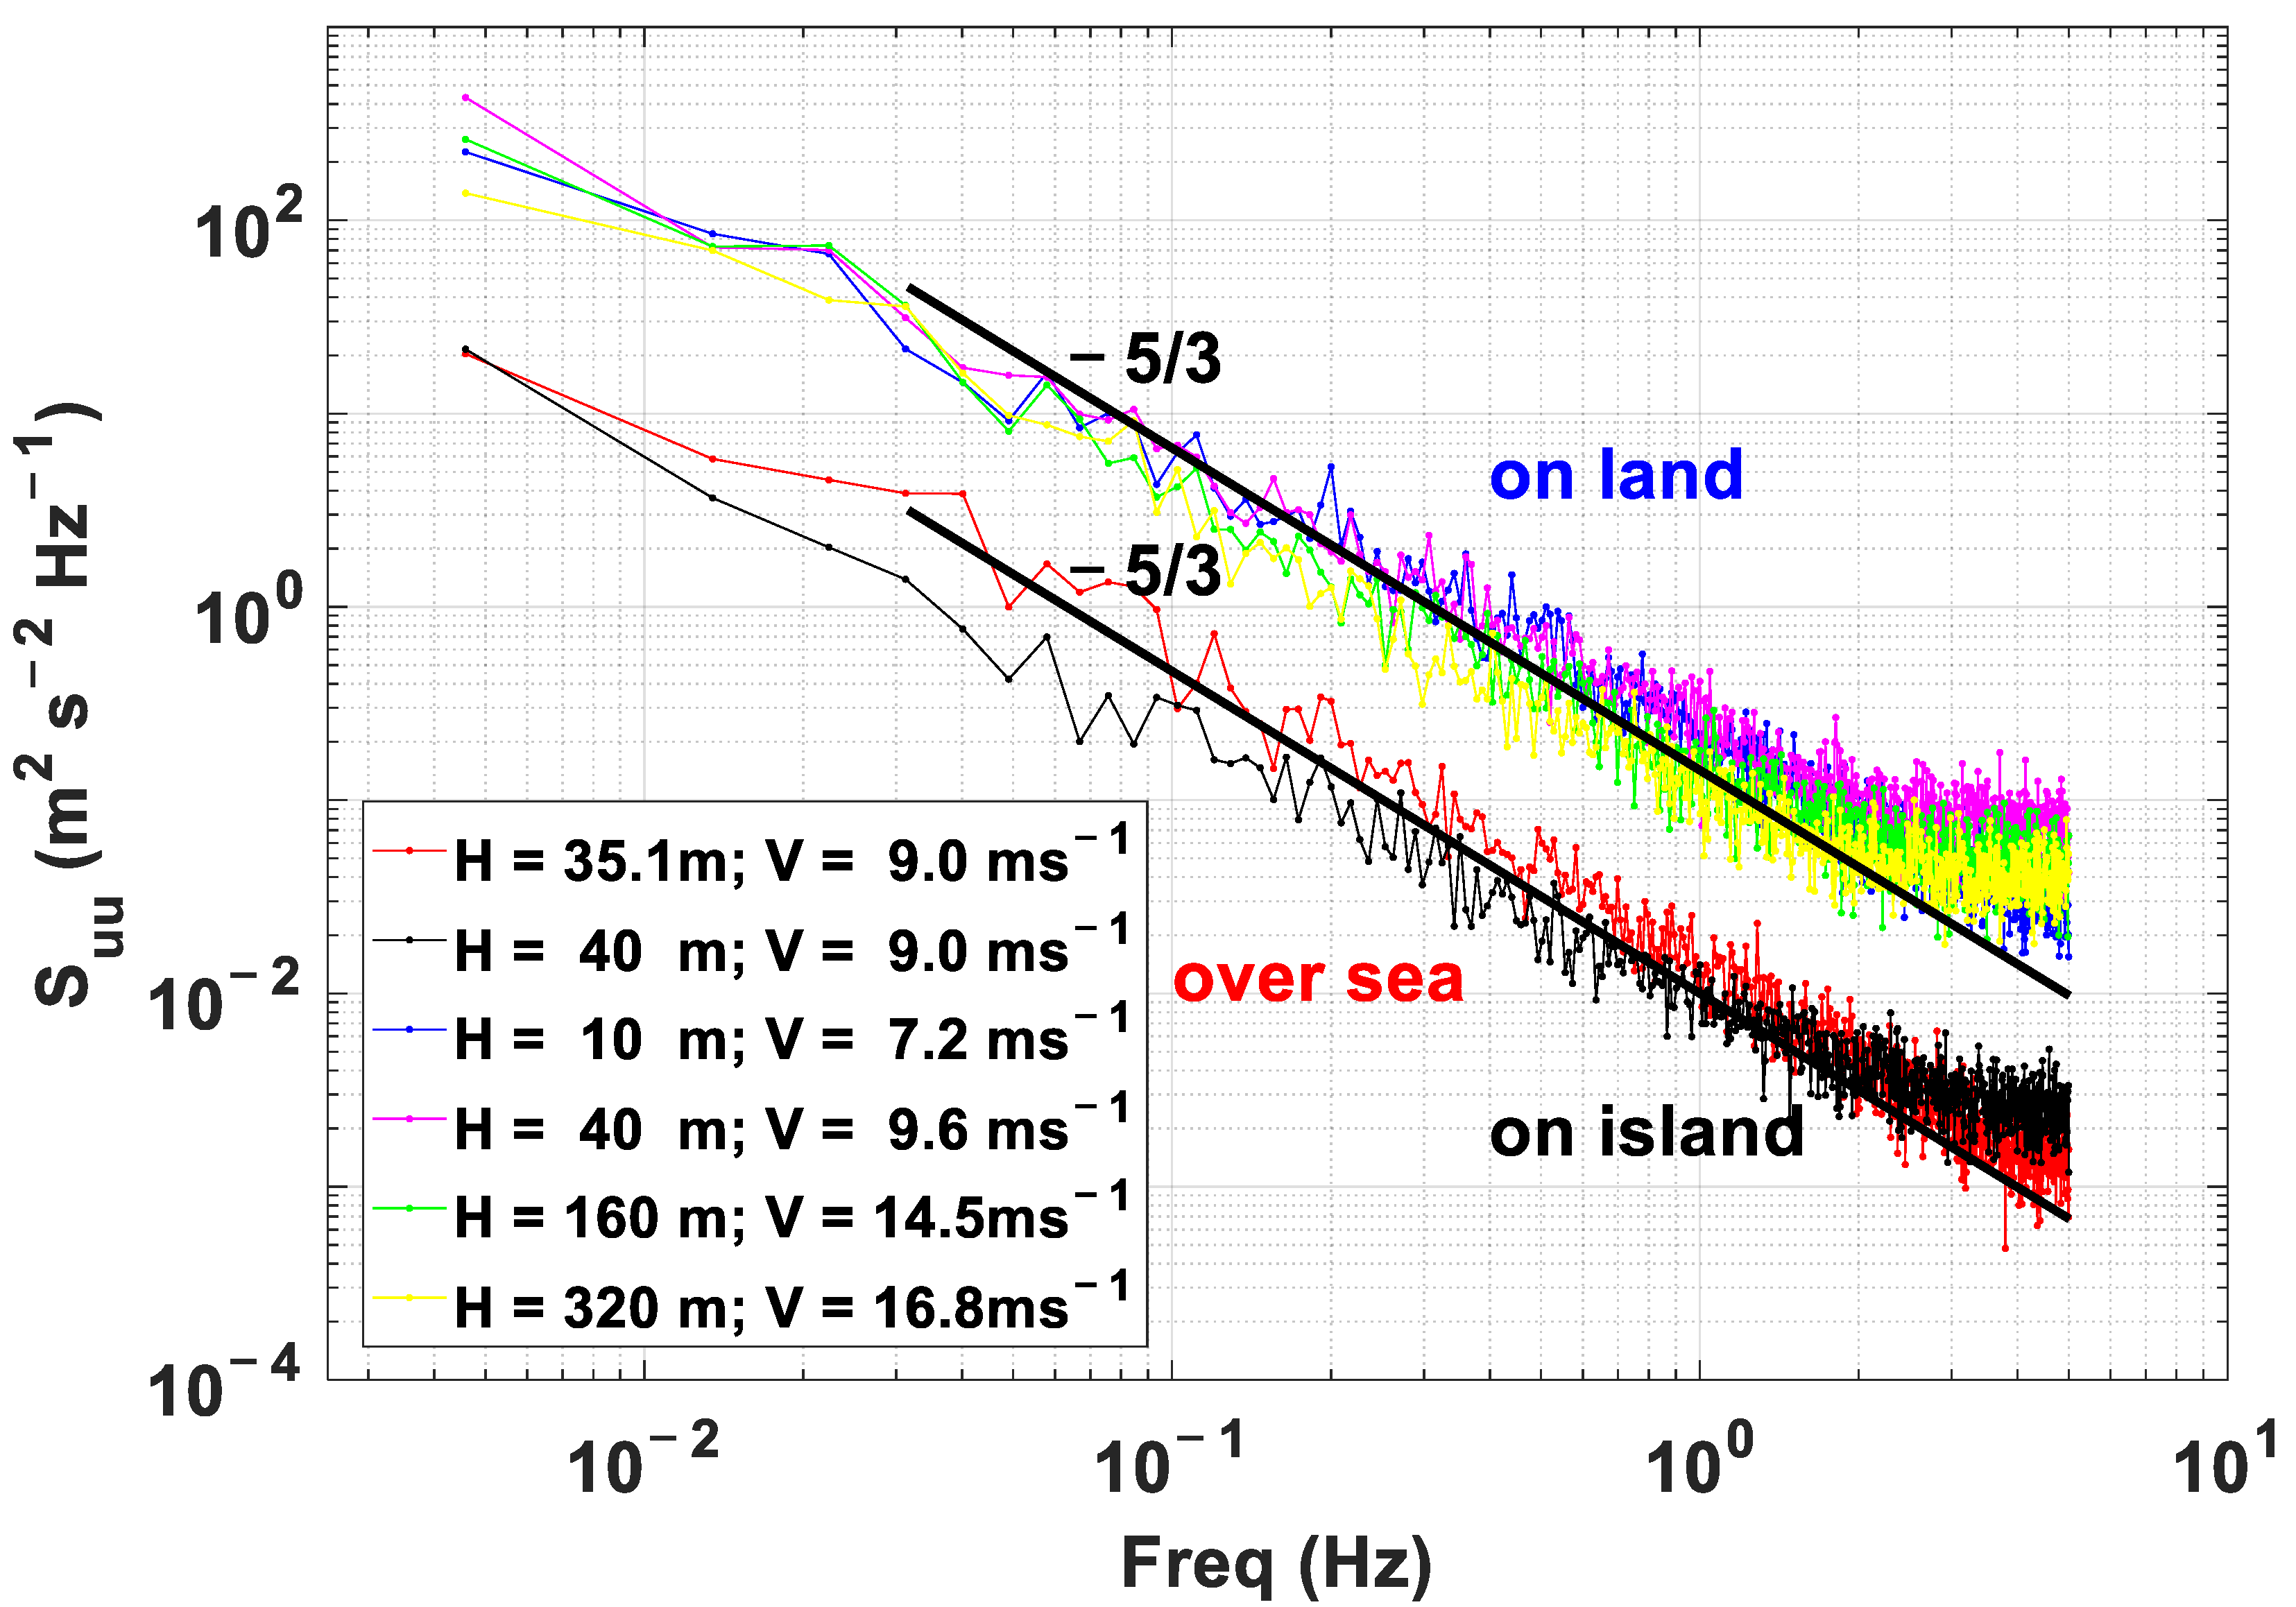
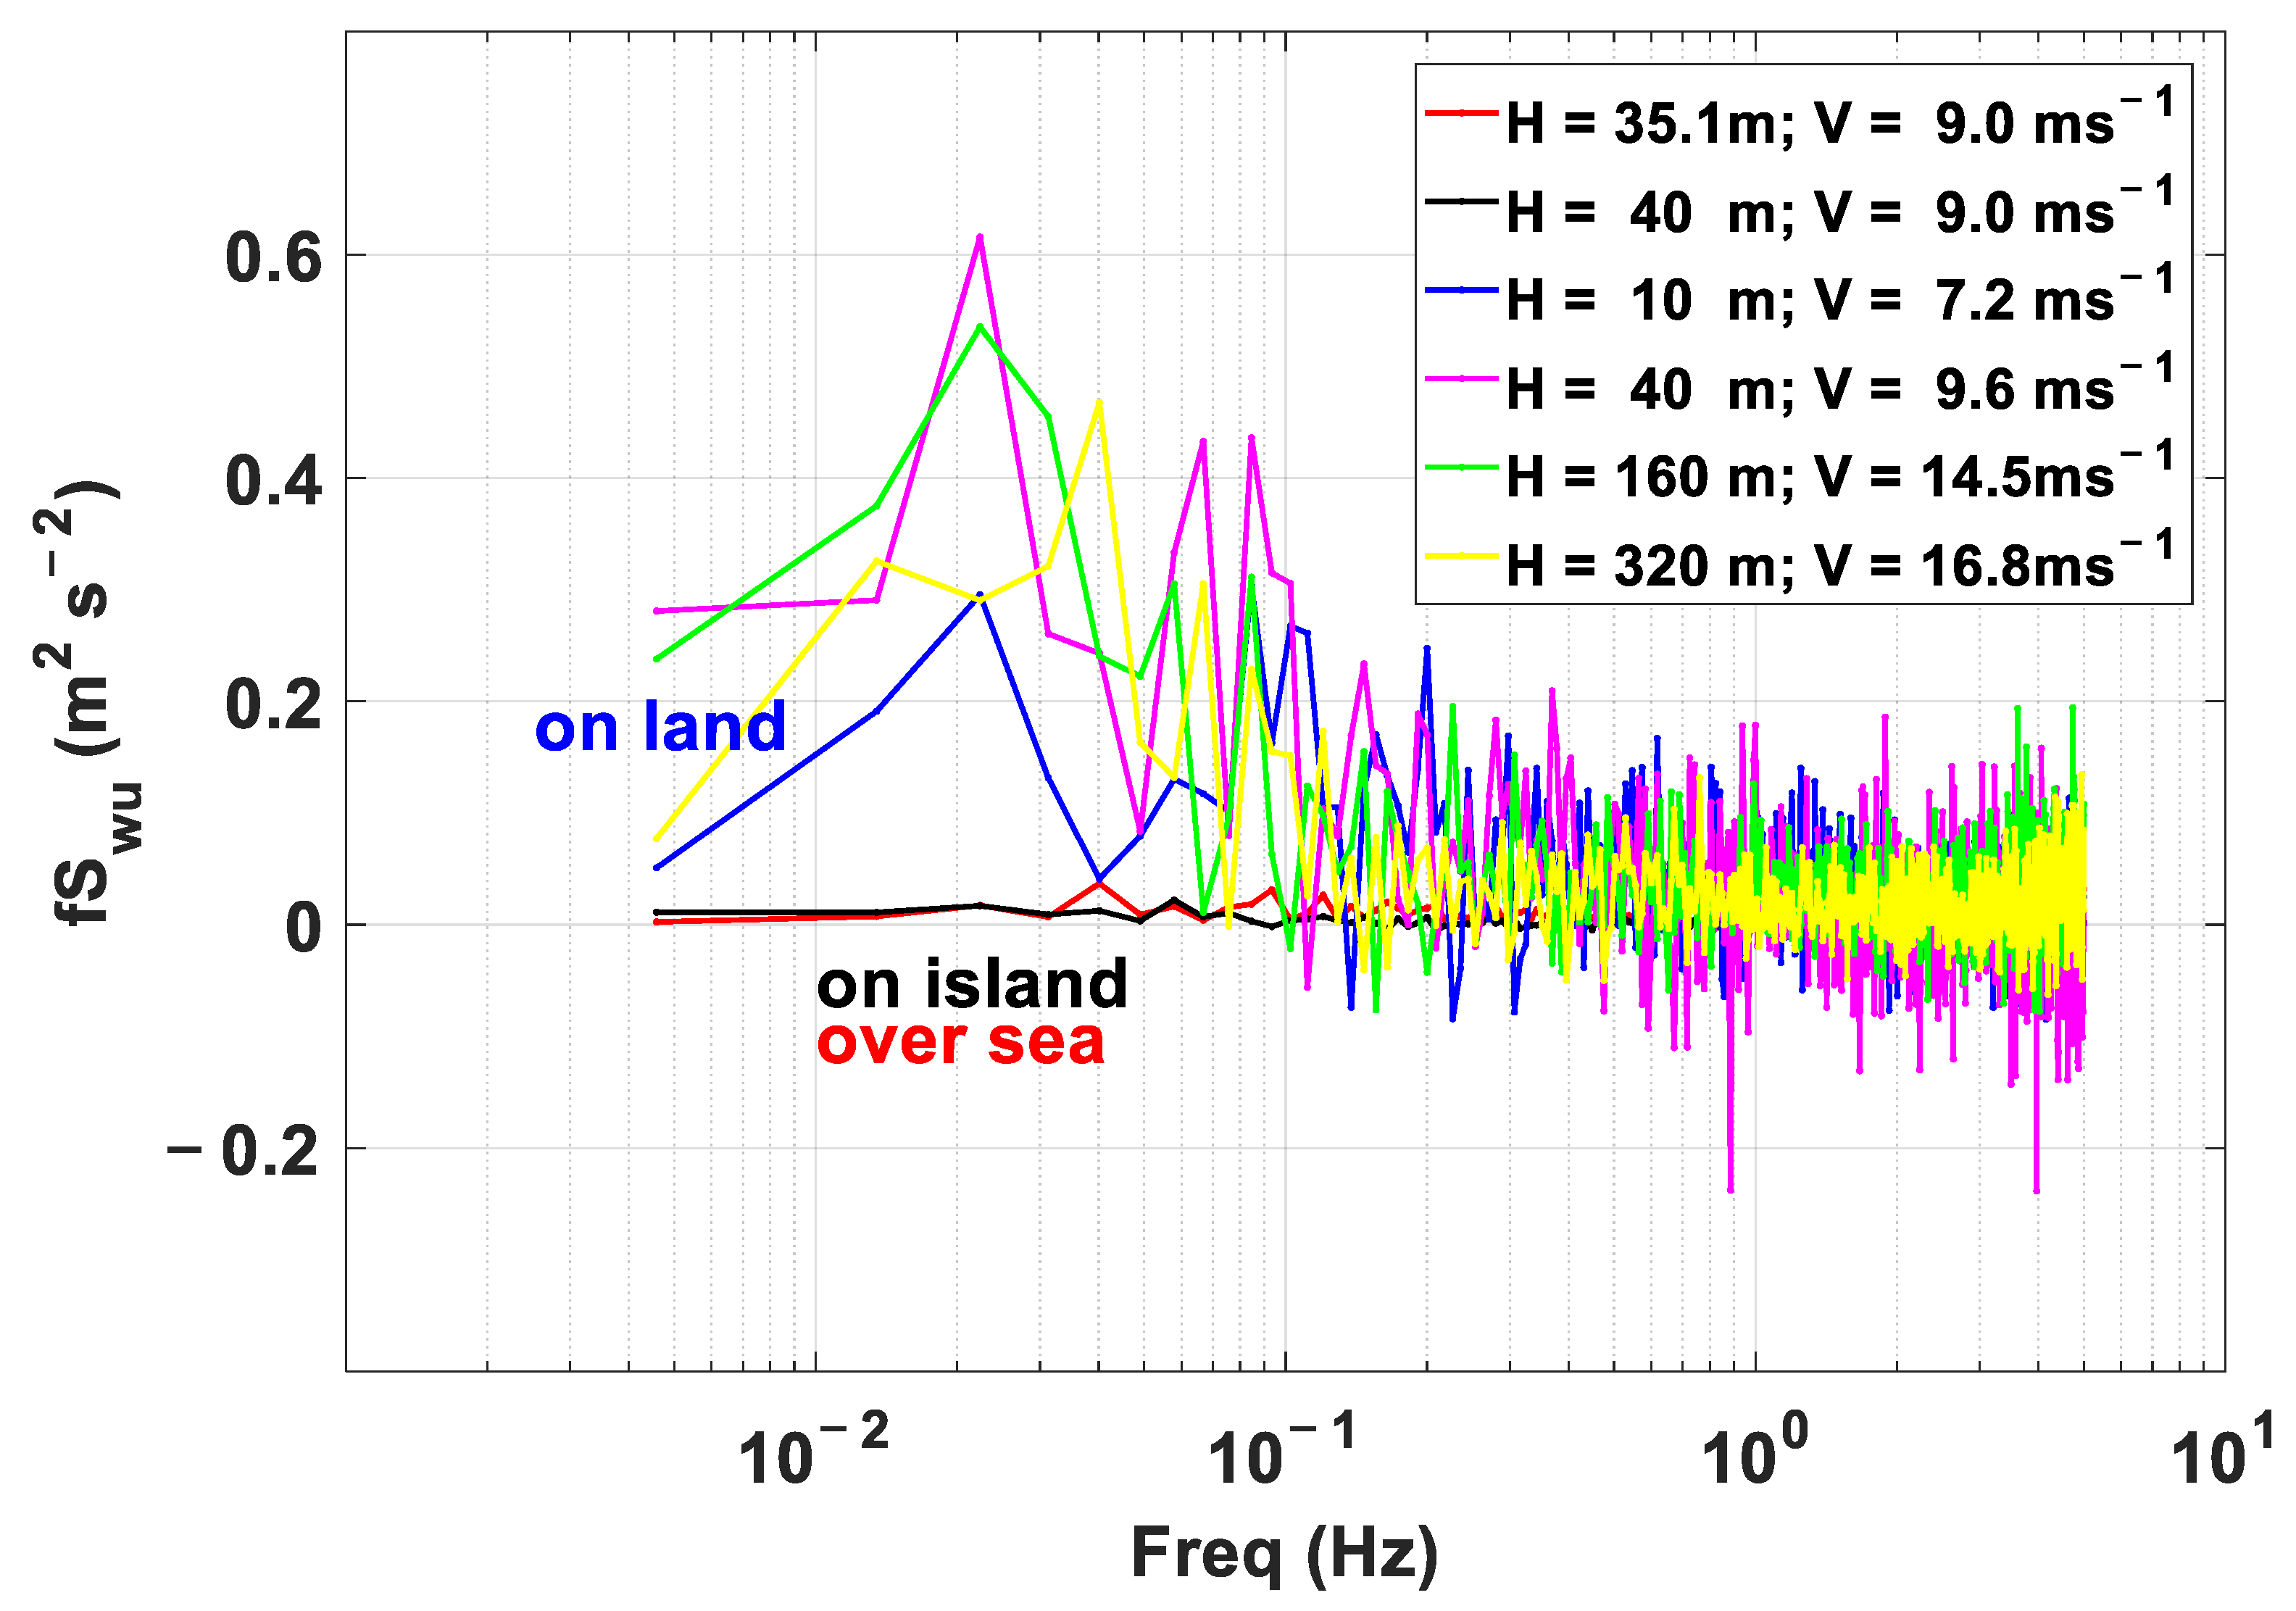
6.2. Spectra Analysis
6.3. Friction Velocity, Turbulent Kinetic Energy, and Dissipative Heating
6.4. Gust Factor
7. Conclusions and Discussions
Author Contributions
Funding
Institutional Review Board Statement
Informed Consent Statement
Data Availability Statement
Acknowledgments
Conflicts of Interest
References
- Pryor, S.C.; Conrick, R.; Miller, C.; Tytell, J.; Barthelmie, R.J. Intense and extreme wind speeds observed by anemometer and seismic networksAn eastern U.S. case study. J. Appl. Meteor. Climatol. 2014, 53, 2417–2429. [Google Scholar] [CrossRef]
- Suomi, I.; Vihma, T.; Gryning, S.-E.; Fortelius, C. Windgust parametrizations at heights relevant for wind energy: A study based on mast observations. Quart. J. Roy. Meteor. Soc. 2013, 139, 1298–1310. [Google Scholar] [CrossRef]
- Garratt, J. The Atmospheric Boundary Layer; Cambridge University Press: Cambridge, UK, 1994; pp. 316–335. [Google Scholar]
- Santana, R.A.; Dias-Júnior, C.Q.; do Vale, R.S.; Tóta, J.; da Silva, R.; Tapajós, R.; Manzi, A.O.; Beldini, T.P. Comparing the Air Turbulence above Smooth and Rough Surfaces in the Amazon Region. Atmosphere 2021, 12, 1043. [Google Scholar] [CrossRef]
- Argyle, P.; Watson, S.J. Assessing the dependence of surface layer atmospheric stability on measurement height at offshore locations. J. Wind. Eng. Ind. Aerodyn. 2014, 131, 88–99. [Google Scholar] [CrossRef] [Green Version]
- Platis, A.; Hundhausen, M.; Lampert, A.; Emeis, S.; Bange, J. The Role of Atmospheric Stability and Turbulence in Offshore Wind-Farm Wakes in the German Bight. Bound. -Layer Meteorol. 2022, 182, 441–469. [Google Scholar] [CrossRef]
- Balderrama, J.A.; Masters, F.J.; Gurley, K.R. Peak factor estimation in hurricane surface winds. J. Wind Eng. Ind. Aerodyn. 2012, 102, 1–13. [Google Scholar] [CrossRef]
- Moraes, O.L.; Fitzjarrald, D.R.; Acevedo, O.C.; Sakai, R.K.; Czikowsky, M.J.; Degrazia, G.A. Comparing spectra and cospectra of turbulence over different surface boundary conditions. Phys. A-Stat. Mech. Its Appl. 2008, 387, 4927–4939. [Google Scholar] [CrossRef]
- Møller, M.; Domagalski, P.; Sætran, L.R. Comparing abnormalities in onshore and offshore vertical wind profiles. Wind Energ. Sci. 2020, 5, 391–411. [Google Scholar] [CrossRef] [Green Version]
- Ryu, G.H.; Kim, Y.-G.; Kwak, S.J.; Choi, M.S.; Jeong, M.-S.; Moon, C.-J. Atmospheric Stability Effects on Offshore and Coastal Wind Resource Characteristics in South Korea for Developing Offshore Wind Farms. Energies 2022, 15, 1305. [Google Scholar] [CrossRef]
- Monin, A.S.; Obukhov, A.M. Basic laws of turbulent mixing in the atmosphere near the ground. Tr. Akad. Nauk SSSR Geofiz. Inst. 1954, 24, 163–187. [Google Scholar]
- Edson, J.B.; Fairall, C.W. Similarity relationships in themarine atmospheric surface layer for terms in the TKE and scalarvariance budgets. J. Atmos. Sci. 1998, 55, 2311–2328. [Google Scholar] [CrossRef]
- Holtslag, M.; Bierbooms, W.; van Bussel, G. Validation of surface layer similarity theory to describe far offshore marine conditions in the Dutch North Sea in scope of wind energy research. J. Wind. Eng. Ind. Aerodyn. 2015, 136, 180–191. [Google Scholar] [CrossRef]
- Huang, J.; Chan, P.-W. Progress of Marine Meteorological Observation Experiment at Maoming of South China. J. Trop. Meteorol. 2011, 17, 418–429. [Google Scholar] [CrossRef]
- Wang, B.; Song, L.; Chen, W. Drag Coefficient during Strong Typhoons. Adv. Meteorol. 2013, 2013, 8. [Google Scholar] [CrossRef] [Green Version]
- Luo, Y.; Li, Q.; Chan, P.; He, Y. Observation of Typhoon Hato based on the 356-m high meteorological gradient tower at Shenzhen. J. Wind Eng. Ind. Aerod. 2020, 207, 104408. [Google Scholar] [CrossRef]
- Ying, M.; Zhang, W.; Yu, H.; Lu, X.; Feng, J.; Fan, Y.; Zhu, Y.; Chen, D. An Overview of the China Meteorological Administration Tropical Cyclone Database. J. Atmos. Oceanic Technol. 2014, 31, 287–301. [Google Scholar] [CrossRef] [Green Version]
- Zhao, Z.K.; Liu, C.X.; Li, Q.; Dai, G.F.; Song, Q.T.; Lv, W.H. Observed drag coefficients in high winds in the near offshore of the South China Sea. J. Geophys. Res. Atmospheres 2015, 120, 2015JD023172. [Google Scholar] [CrossRef]
- Foken, T. 50 years of the Monin–Obukhov similarity theory. Bound.-Lay. Meteorol. 2006, 119, 431–447. [Google Scholar] [CrossRef]
- Stull, R. Neutral Boundary Layer Similarity Relationship Lists. In An Introduction to Boundary Layer Meteorology; Stull, R., Ed.; Springer: Dordrecht, The Netherlands, 1988. [Google Scholar]
- Bister, M.; Emanuel, K.A. Dissipative Heating and Hurricane Intensity. Meteorol. Atmos. Phys. 1998, 65, 233–240. [Google Scholar] [CrossRef]
- Brasseur, O. Development and Application of a Physical Approach to Estimating Wind Gusts. Mon. Weather. Rev. 2001, 129, 5–25. [Google Scholar] [CrossRef]
- Suomi, S.-E.; Floors, G.R.; Vihma, T.; Fortelius, C. On the vertical structure of wind gusts. Quart. J. Roy. Meteor. Soc. 2015, 141, 1658–1670. [Google Scholar] [CrossRef]
- Hojstrup, J. A statistical data screening procedure. Meas. Sci. Technol. 1993, 4, 153. [Google Scholar] [CrossRef]
- Lee, X.; Law, B.; Massman, W. Handbook of Micrometeorology: A Guide for Surface Flux Measurement and Analysis; Springer Science & Business Media: Dordrecht, The Netherlands, 2005. [Google Scholar]
- Bi, X.Y.; Wen, B.; Zhao, Z.K.; Huang, J.; Liu, C.X.; Huang, H.J.; Mao, W.K.; Wen, G.H. Evaluation of corrections on turbulent fluxes obtained by eddy covariance method in high winds. J. Trop. Meteorol. 2018, 24, 176–184. [Google Scholar] [CrossRef]
- Kaimal, J.C.; Finnigan, J.J. Atmospheric Boundary Layer Flows: Their Structure and Measurement; Oxford University Press: New York, NY, USA, 1994; p. 289. [Google Scholar]
- Sorbjan, Z.; Grachev, A.A. An Evaluation of the Flux–Gradient Relationship in the Stable Boundary Layer. Bound.-Layer Meteorol. 2010, 135, 385–405. [Google Scholar] [CrossRef]
- Ming, J.; Zhang, J.A. Direct measurements of momentum flux and dissipative heating in the surface layer of tropical cyclones during landfalls. J. Geophys. Res. Atmos. 2018, 123, 4926–4938. [Google Scholar] [CrossRef]
- Zhang, J.A.; Zhu, P.; Masters, F.J.; Rogers, R.F.; Marks, F.D. On Momentum Transport and Dissipative Heating during Hurricane Landfalls. J. Atmos. Sci. 2011, 68, 1397–1404. [Google Scholar] [CrossRef]


| Typhoon | Time Period | The Closest Distance to the Tower at Sea/the Tower on Land (km) | Central Pressure (hPa) | Tower over Sea | Tower on Island | Tower on Land | |||
|---|---|---|---|---|---|---|---|---|---|
| Instrument Height (m) | Max u10 (m s−1) | Instrument Height (m) | Max u10 (m s−1) | Instrument Height (m) | Max u10 (m s−1) | ||||
| Hagupit | 23−24 September 2008 | 0 | 940 | × | × | 60 | 23.8 | × | × |
| Chanthu | 21−23 July 2010 | 65 | 970 | × | × | 40 | 32.1 | × | × |
| Nockten | 29−30 July 2011 | 220 | 980 | 35.1 | 18.7 | × | × | × | × |
| Nesat | 29−30 September 2011 | 195 | 950 | 35.1 | 25.7 | × | × | × | × |
| Rammasun | 18−19 July 2014 | 160 | 910 | 27.3 | 23.4 | × | × | × | × |
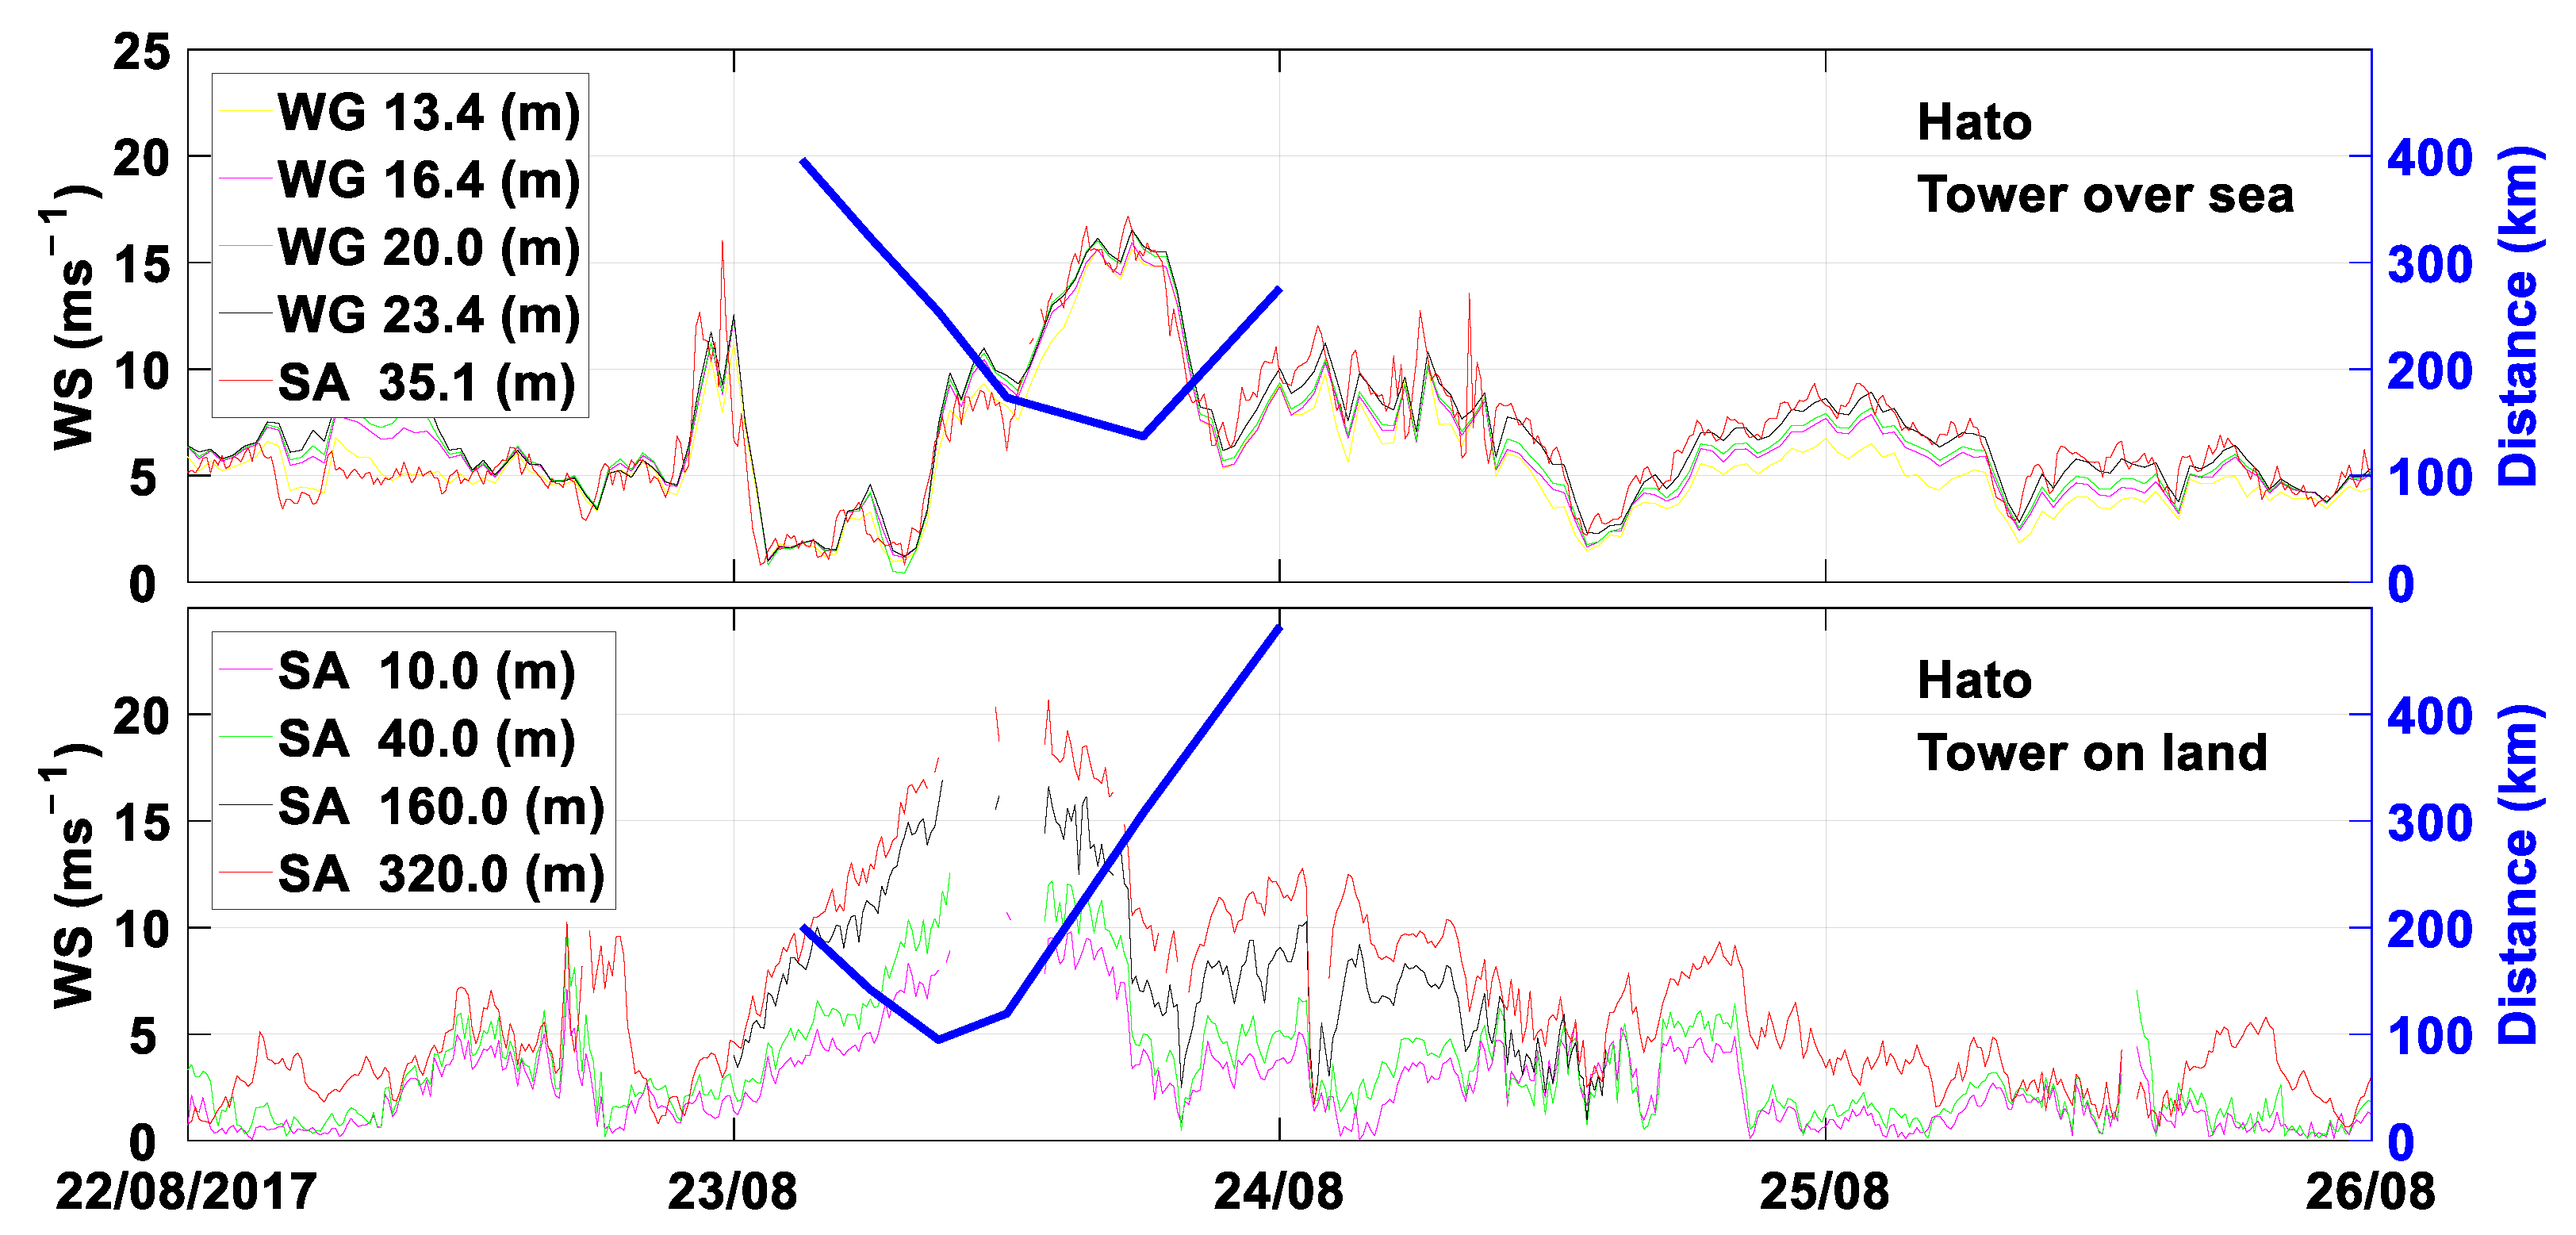
| Hato | 22–25 August 2017 | 137/95 | 935 | 27.3 | 15.1 | × | × | 10, 40, 160, 320 | 11.1 |
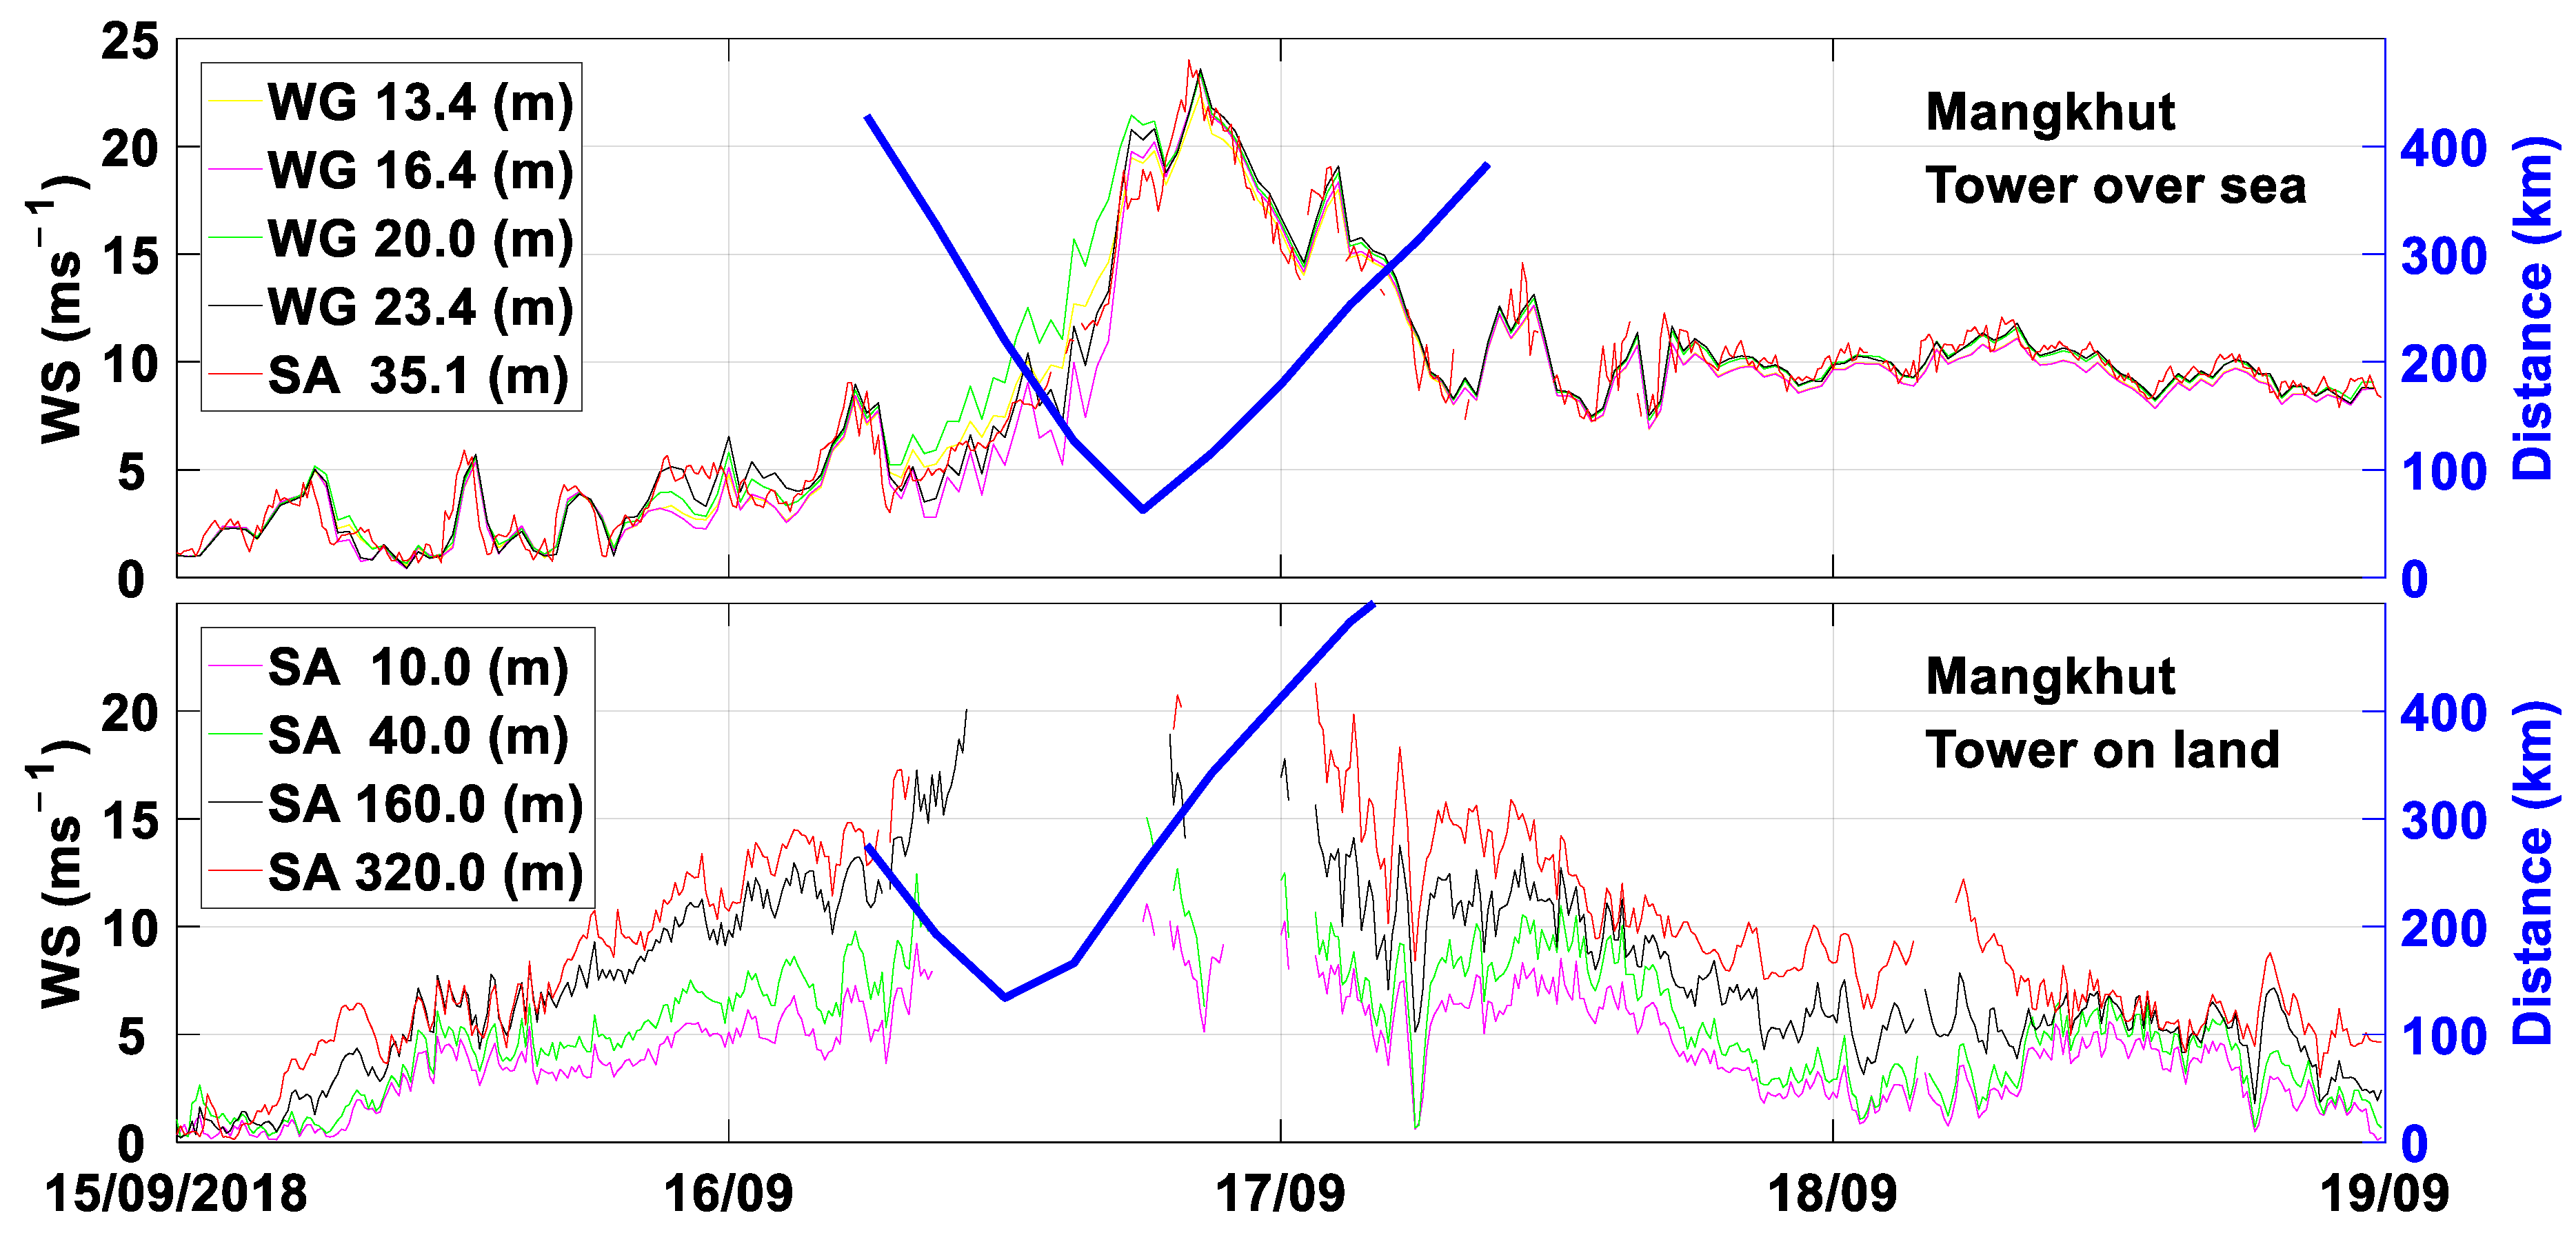
| Mangkhut | 15−18 September 2018 | 63/134 | 945 | 27.3 | 21.7 | × | × | 10, 40, 160, 320 | 10.7 |
| Stability Class | Stability Class | Stability Class | |||
|---|---|---|---|---|---|
| extremely unstable | < −1 | weakly unstable | −0.2 < < −0.02 | stable | 0.2 < < 0.6 |
| very unstable | −1 < < −0.6 | nearly neutral | −0.02 < < 0.02 | very stable | 0.6 < < 1 |
| unstable | −0.6 < < −0.2 | weakly stable | 0.02 < < 0.2 | extremely stable | > 1 |
Publisher’s Note: MDPI stays neutral with regard to jurisdictional claims in published maps and institutional affiliations. |
© 2022 by the authors. Licensee MDPI, Basel, Switzerland. This article is an open access article distributed under the terms and conditions of the Creative Commons Attribution (CC BY) license (https://creativecommons.org/licenses/by/4.0/).
Share and Cite
Bi, X.; Lu, C.; Liu, C.; Huang, J.; Yang, H.; Zhao, Z.; Song, Q. Comparison of Atmospheric Turbulence Characteristics over Sea Surface and Land Surface before, during, and after Typhoons. Atmosphere 2022, 13, 1827. https://doi.org/10.3390/atmos13111827
Bi X, Lu C, Liu C, Huang J, Yang H, Zhao Z, Song Q. Comparison of Atmospheric Turbulence Characteristics over Sea Surface and Land Surface before, during, and after Typhoons. Atmosphere. 2022; 13(11):1827. https://doi.org/10.3390/atmos13111827
Chicago/Turabian StyleBi, Xueyan, Chao Lu, Chunxia Liu, Jian Huang, Honglong Yang, Zhongkuo Zhao, and Qingtao Song. 2022. "Comparison of Atmospheric Turbulence Characteristics over Sea Surface and Land Surface before, during, and after Typhoons" Atmosphere 13, no. 11: 1827. https://doi.org/10.3390/atmos13111827