
A Comparative Analysis of Changes in Temperature and Precipitation Extremes since 1960 between China and Greece
 , ,
, ,
Abstract
:1. Introduction
2. Data and Methods
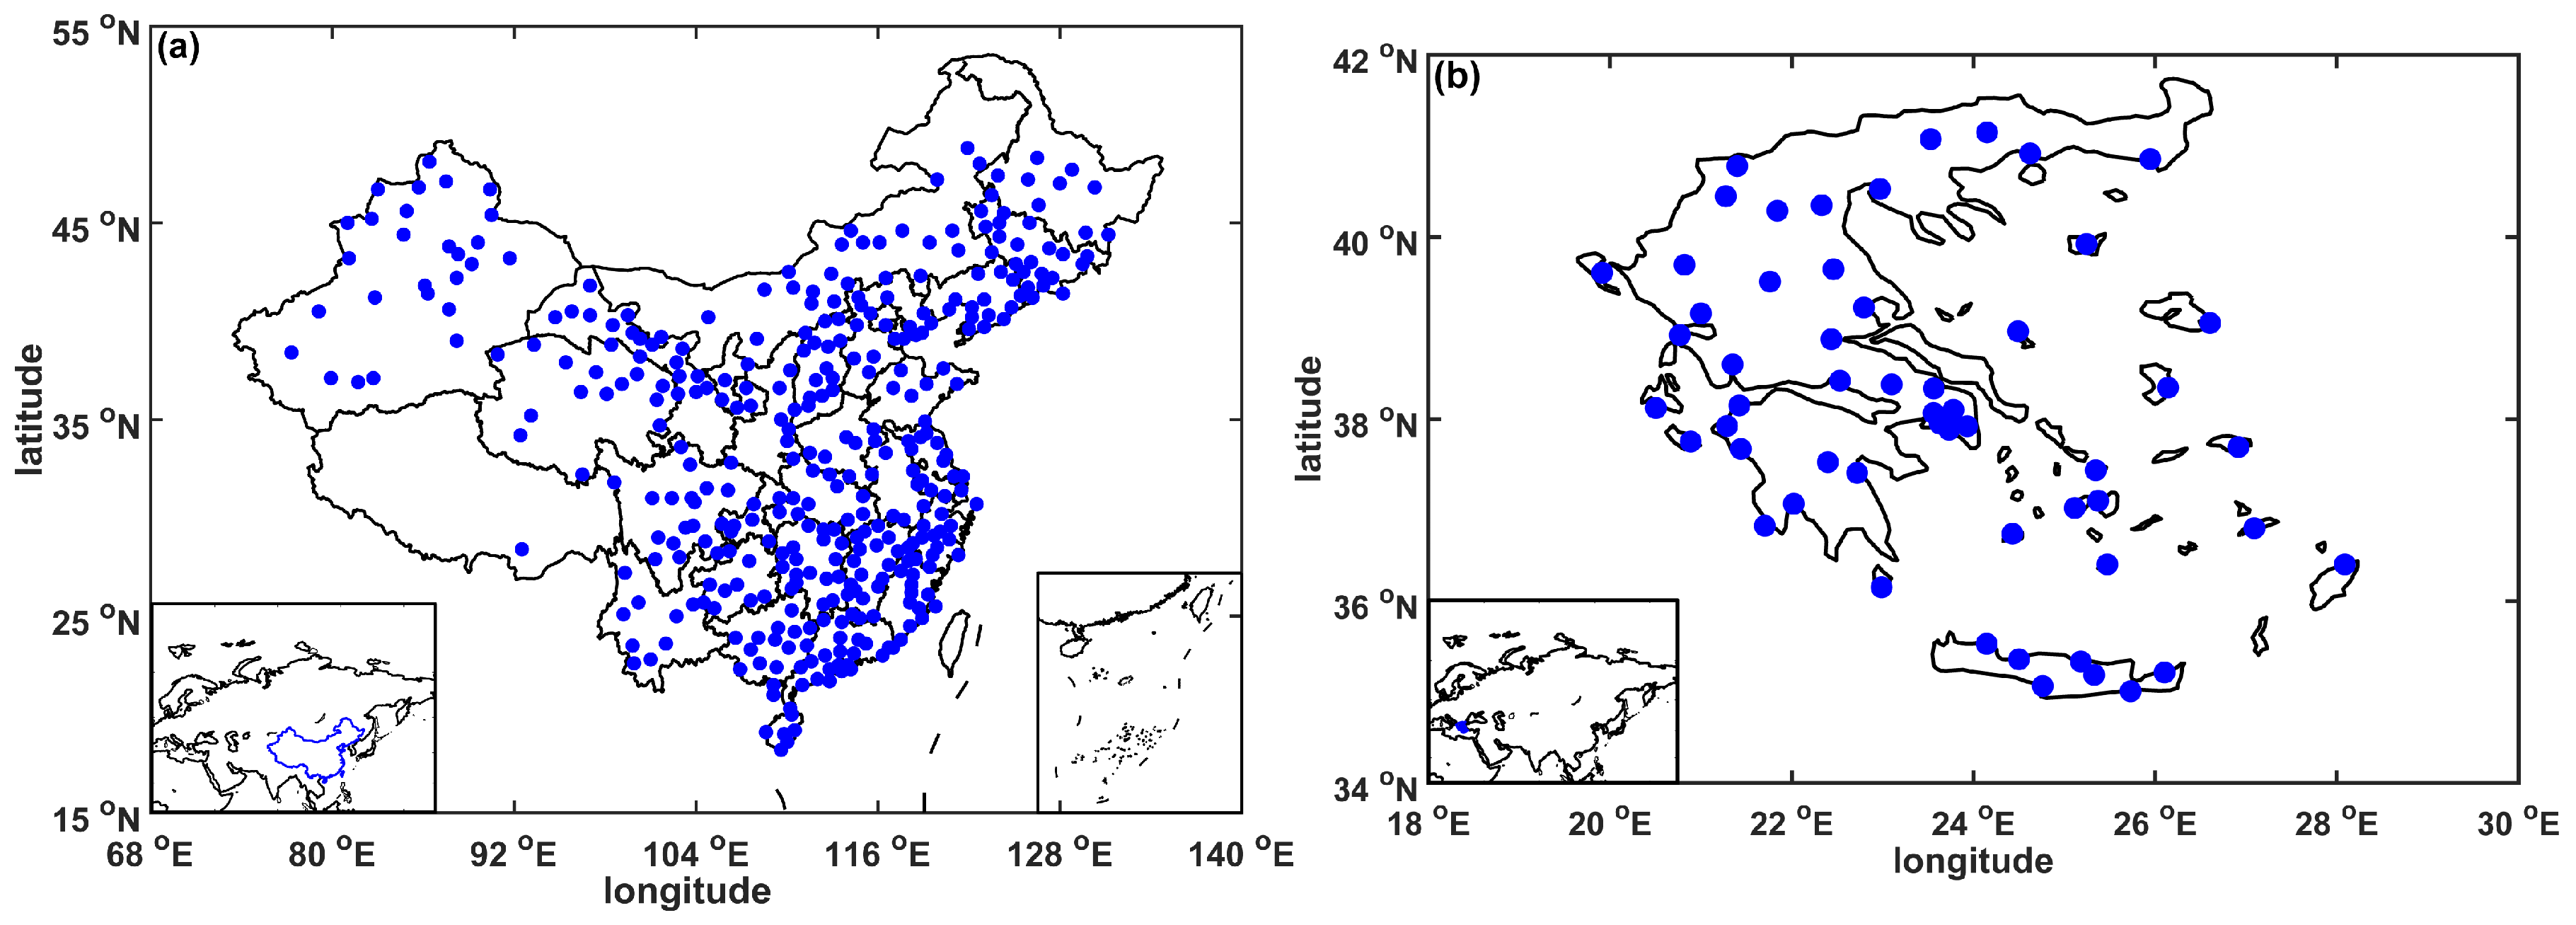
2.1. Data
2.1.1. Observations
2.1.2. Reanalysis Data
2.2. Methods
2.2.1. Calculation of Climate Indices
2.2.2. Trend Estimation Method
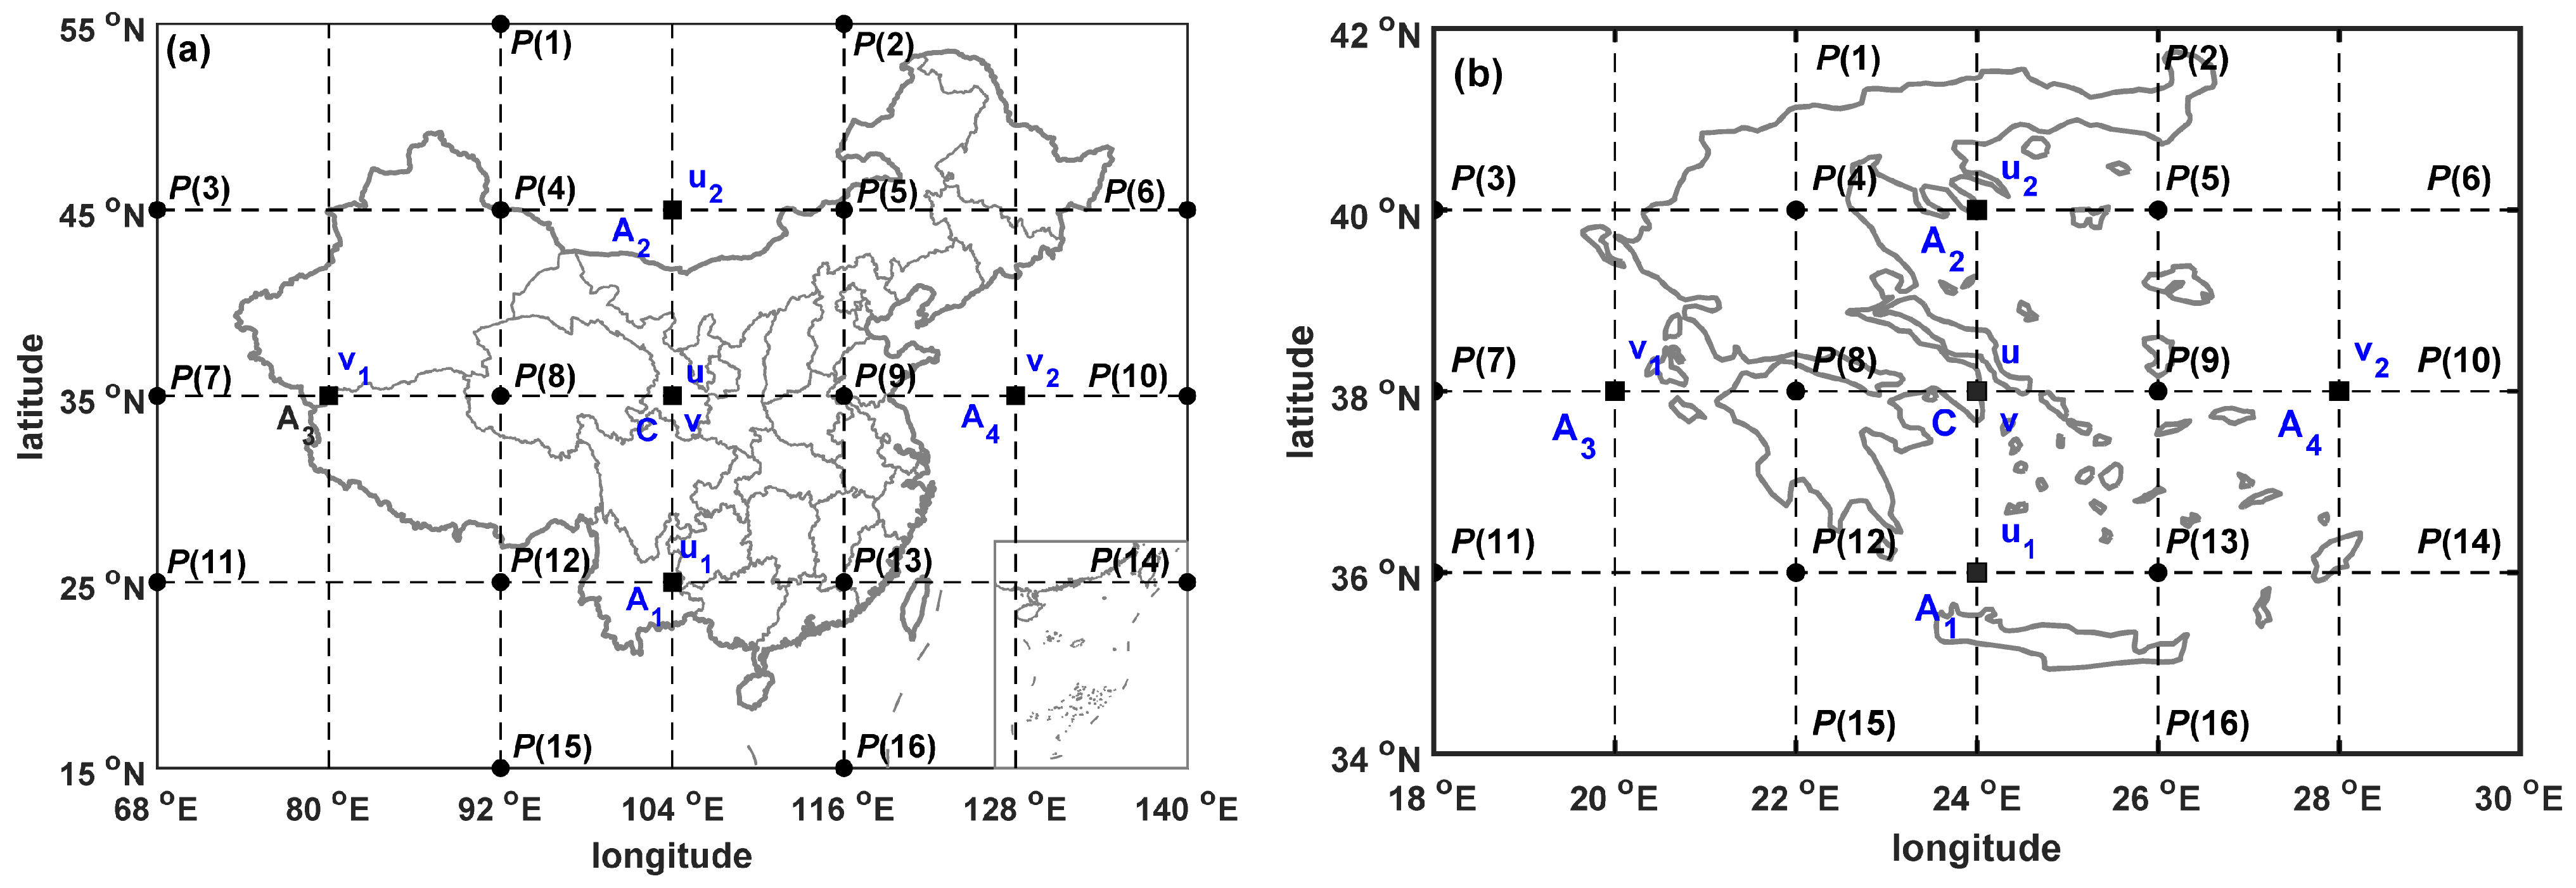
2.2.3. Lamb–Jenkinson Circulation Type Classification System
2.2.4. Multiple Linear Regression
3. Results
3.1. Comparison of Temporal Variation in Climate Extreme Indices since 1960
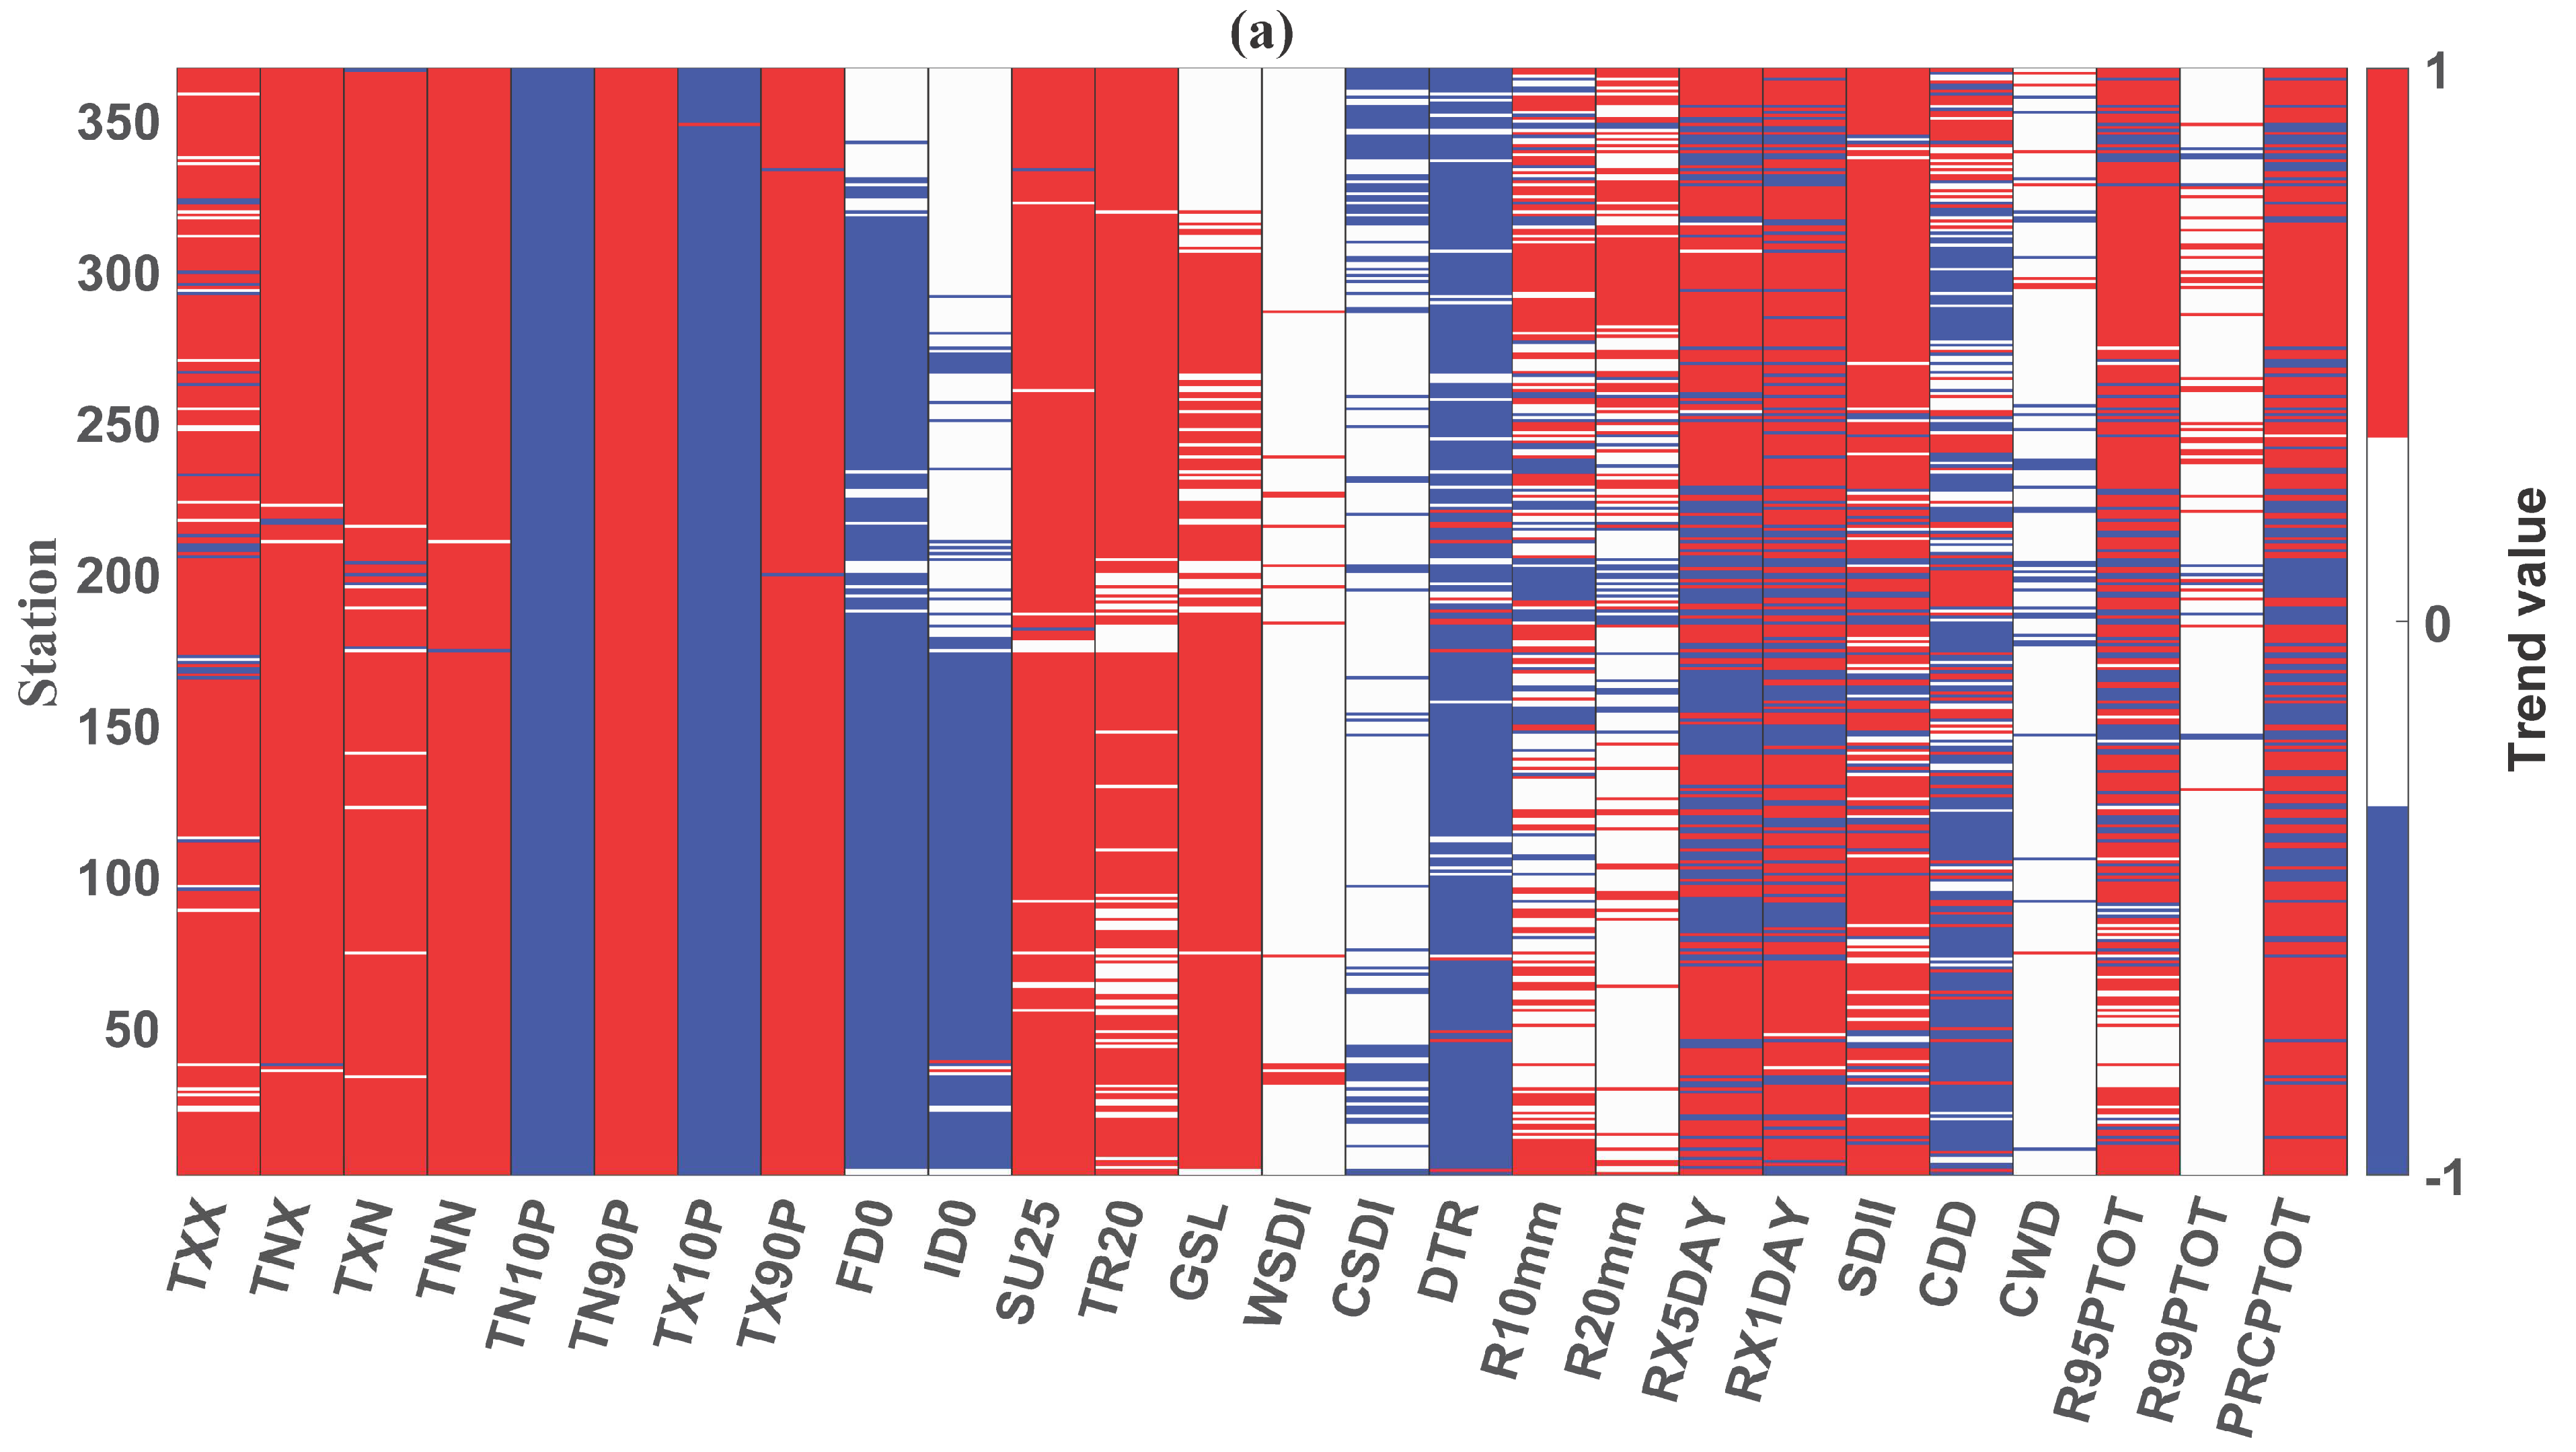
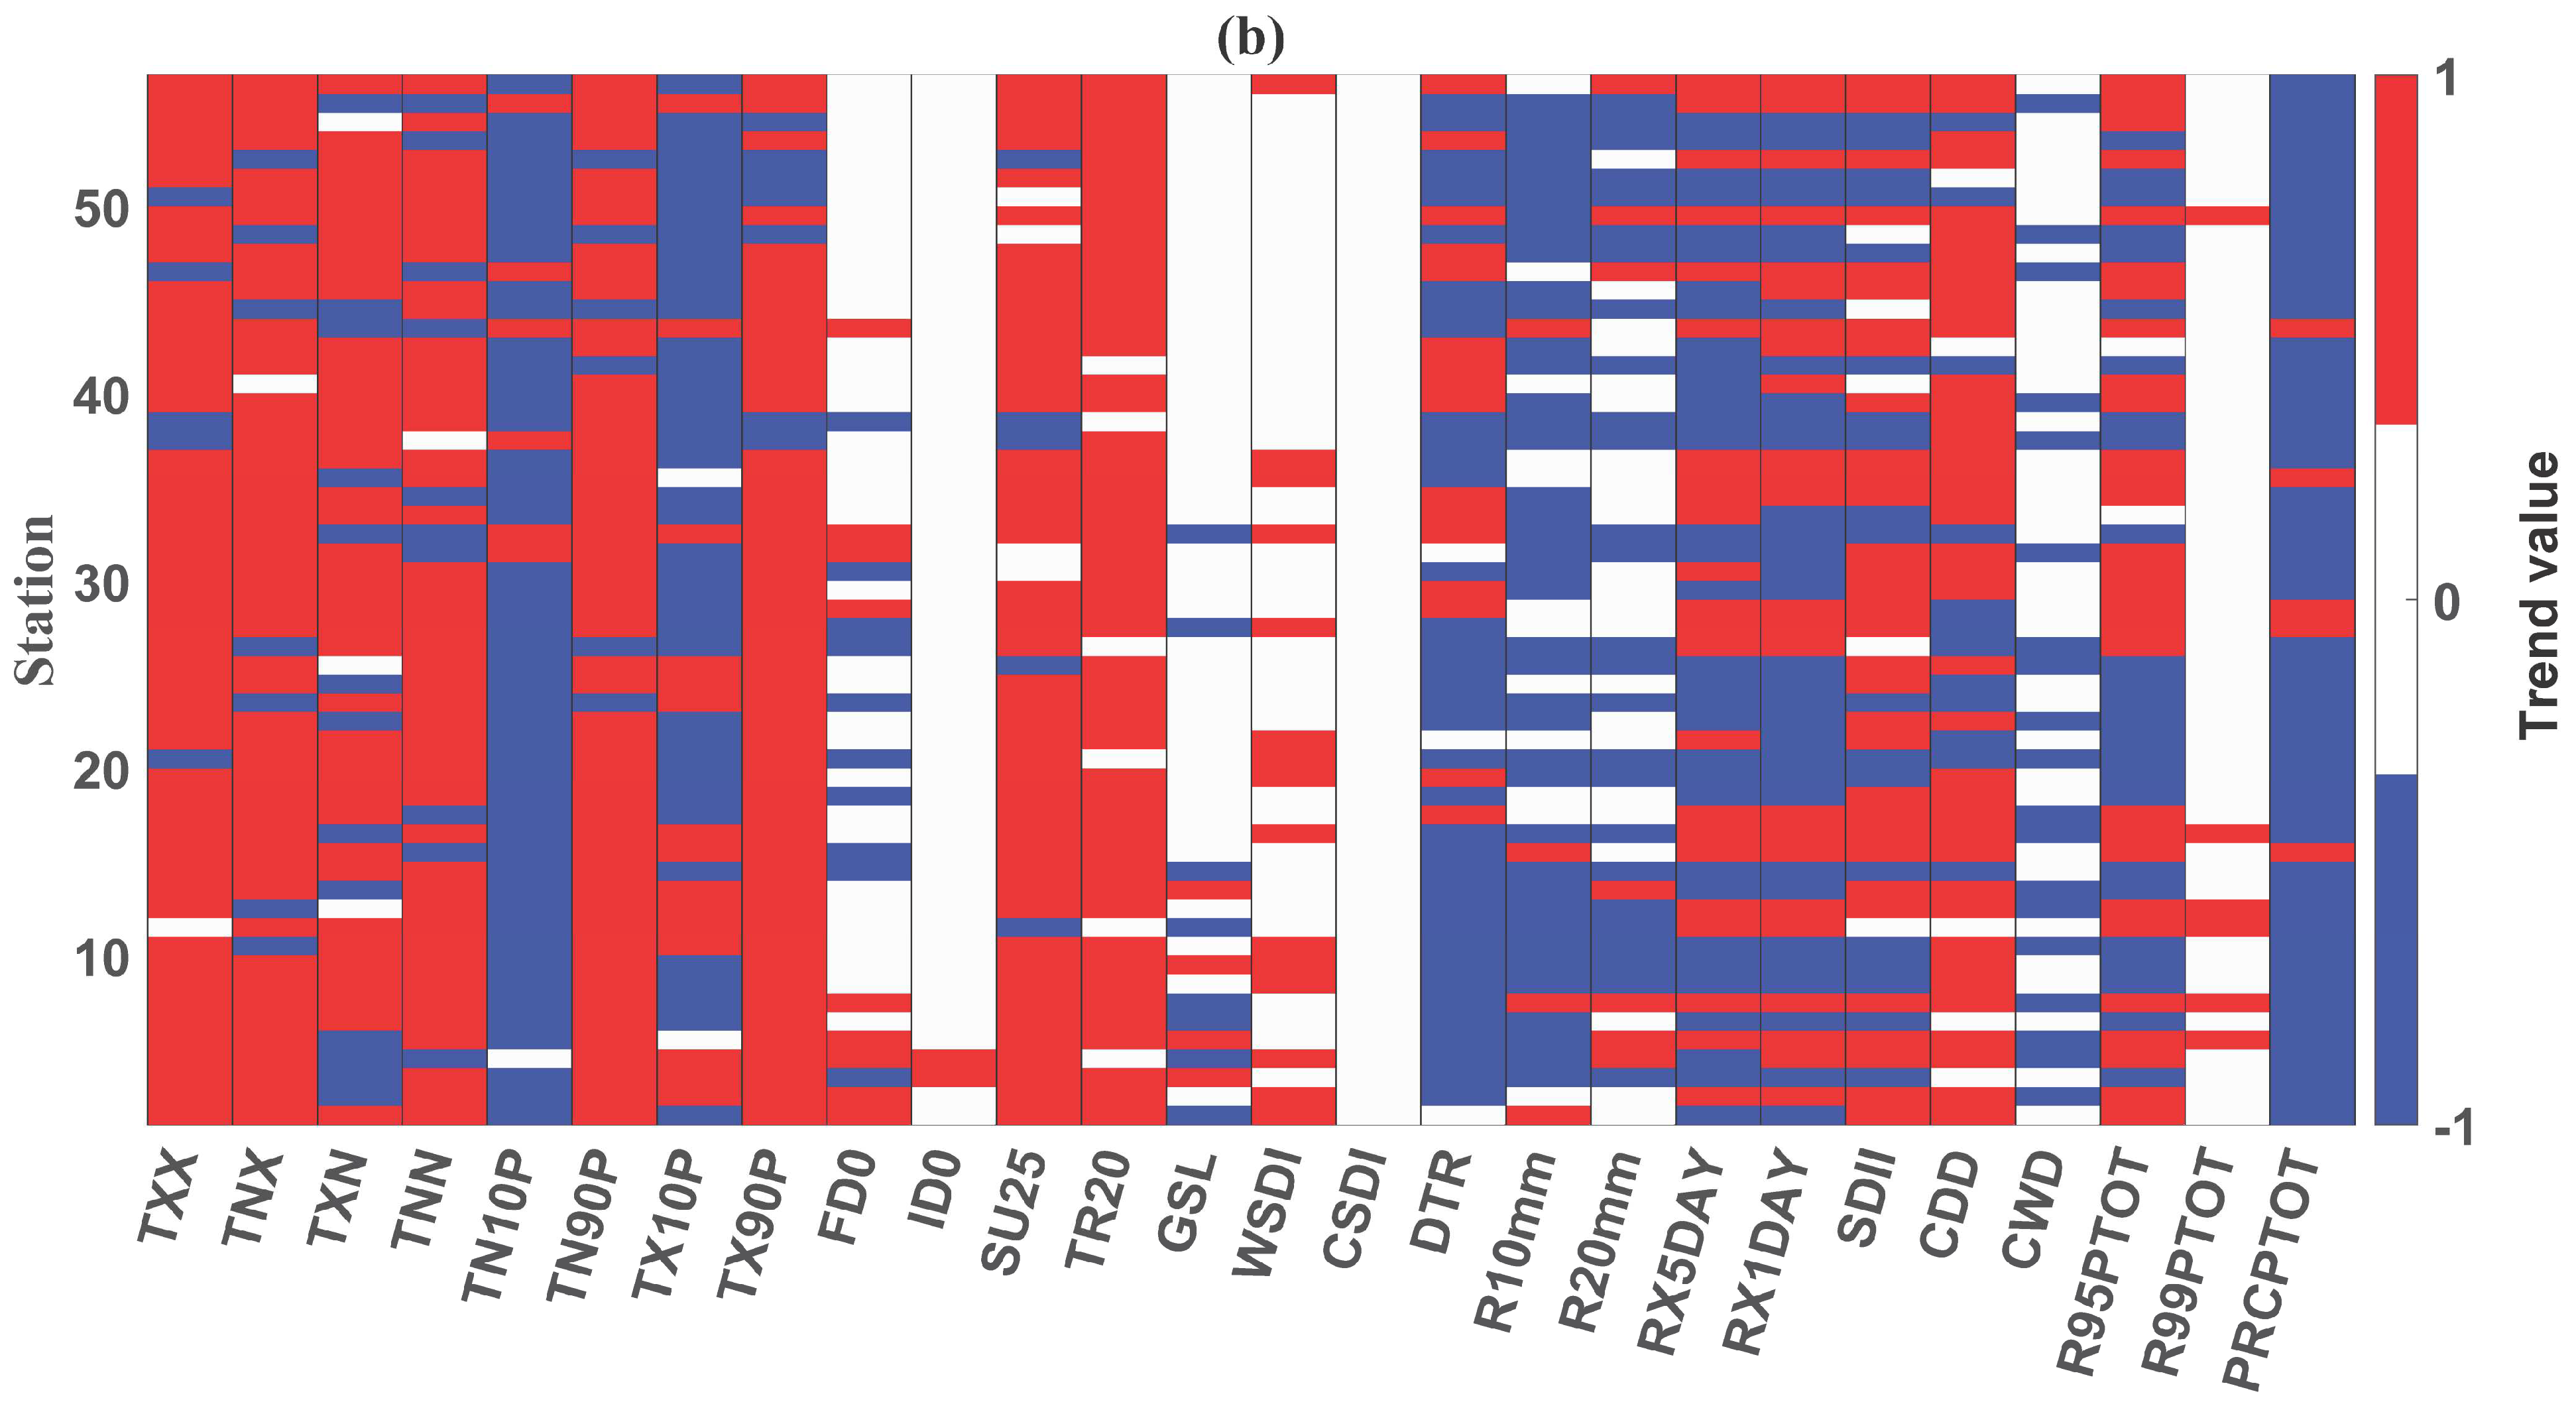
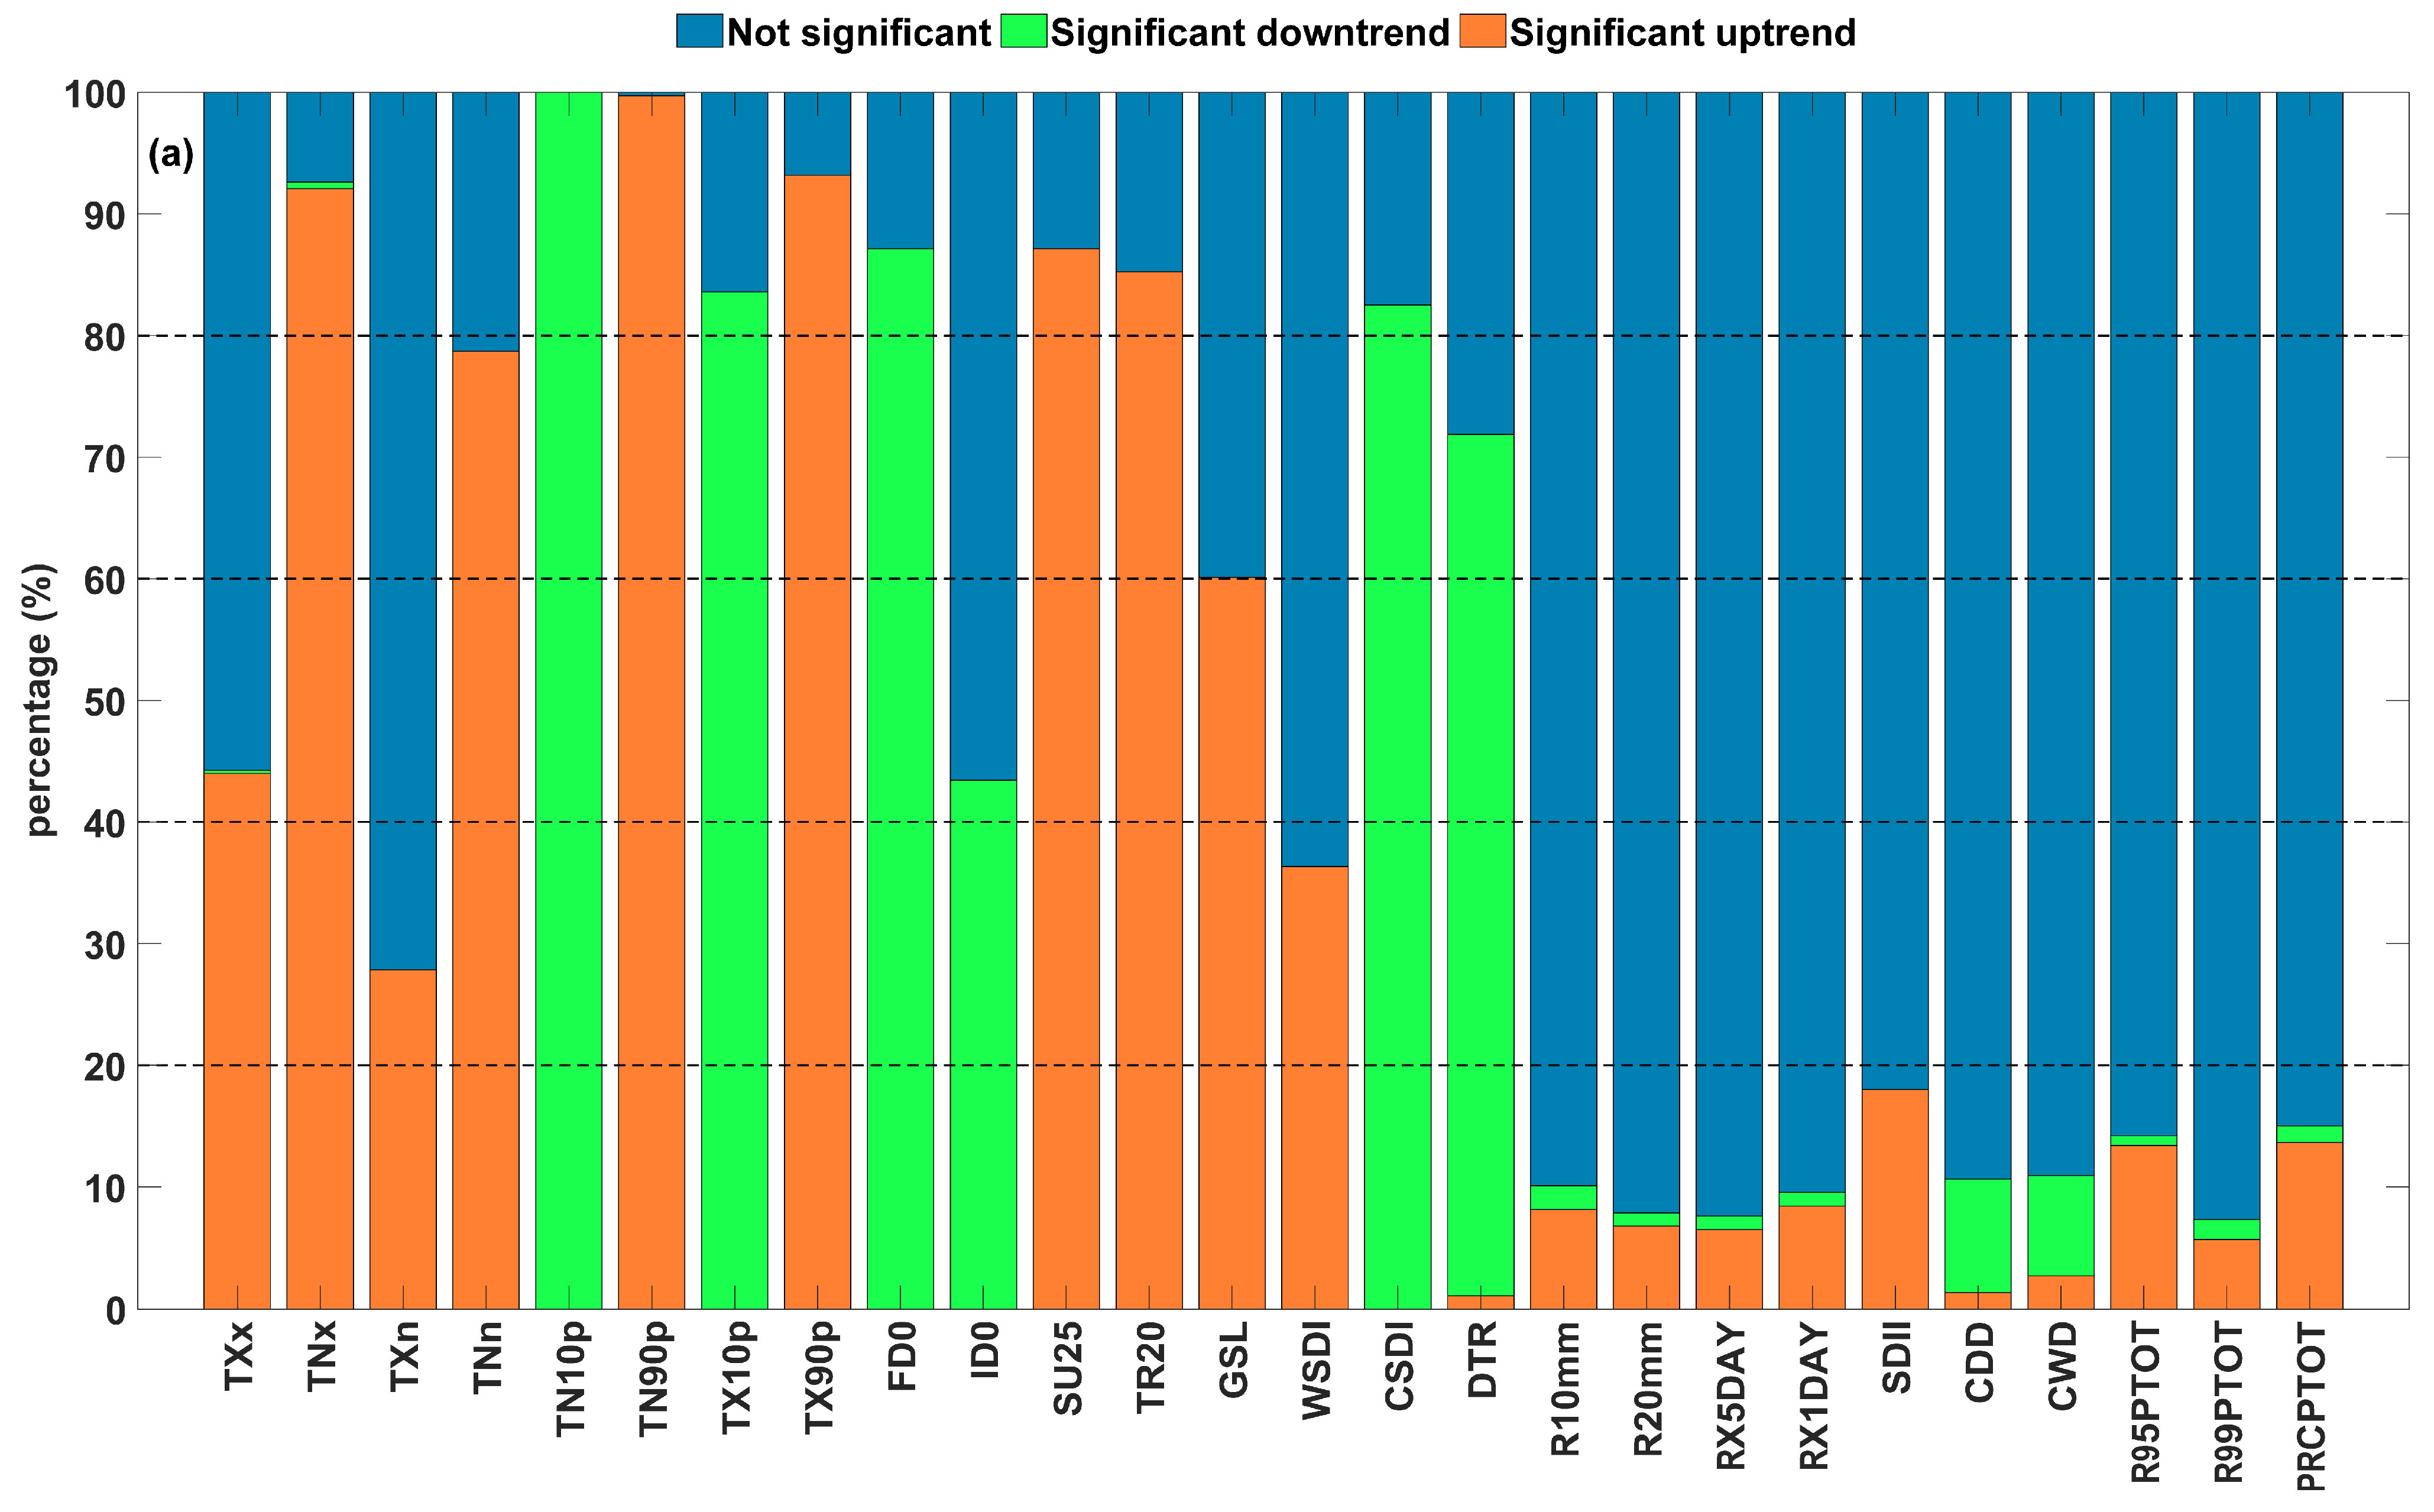
3.1.1. Statistics of Estimated Trends since 1960 at All Stations
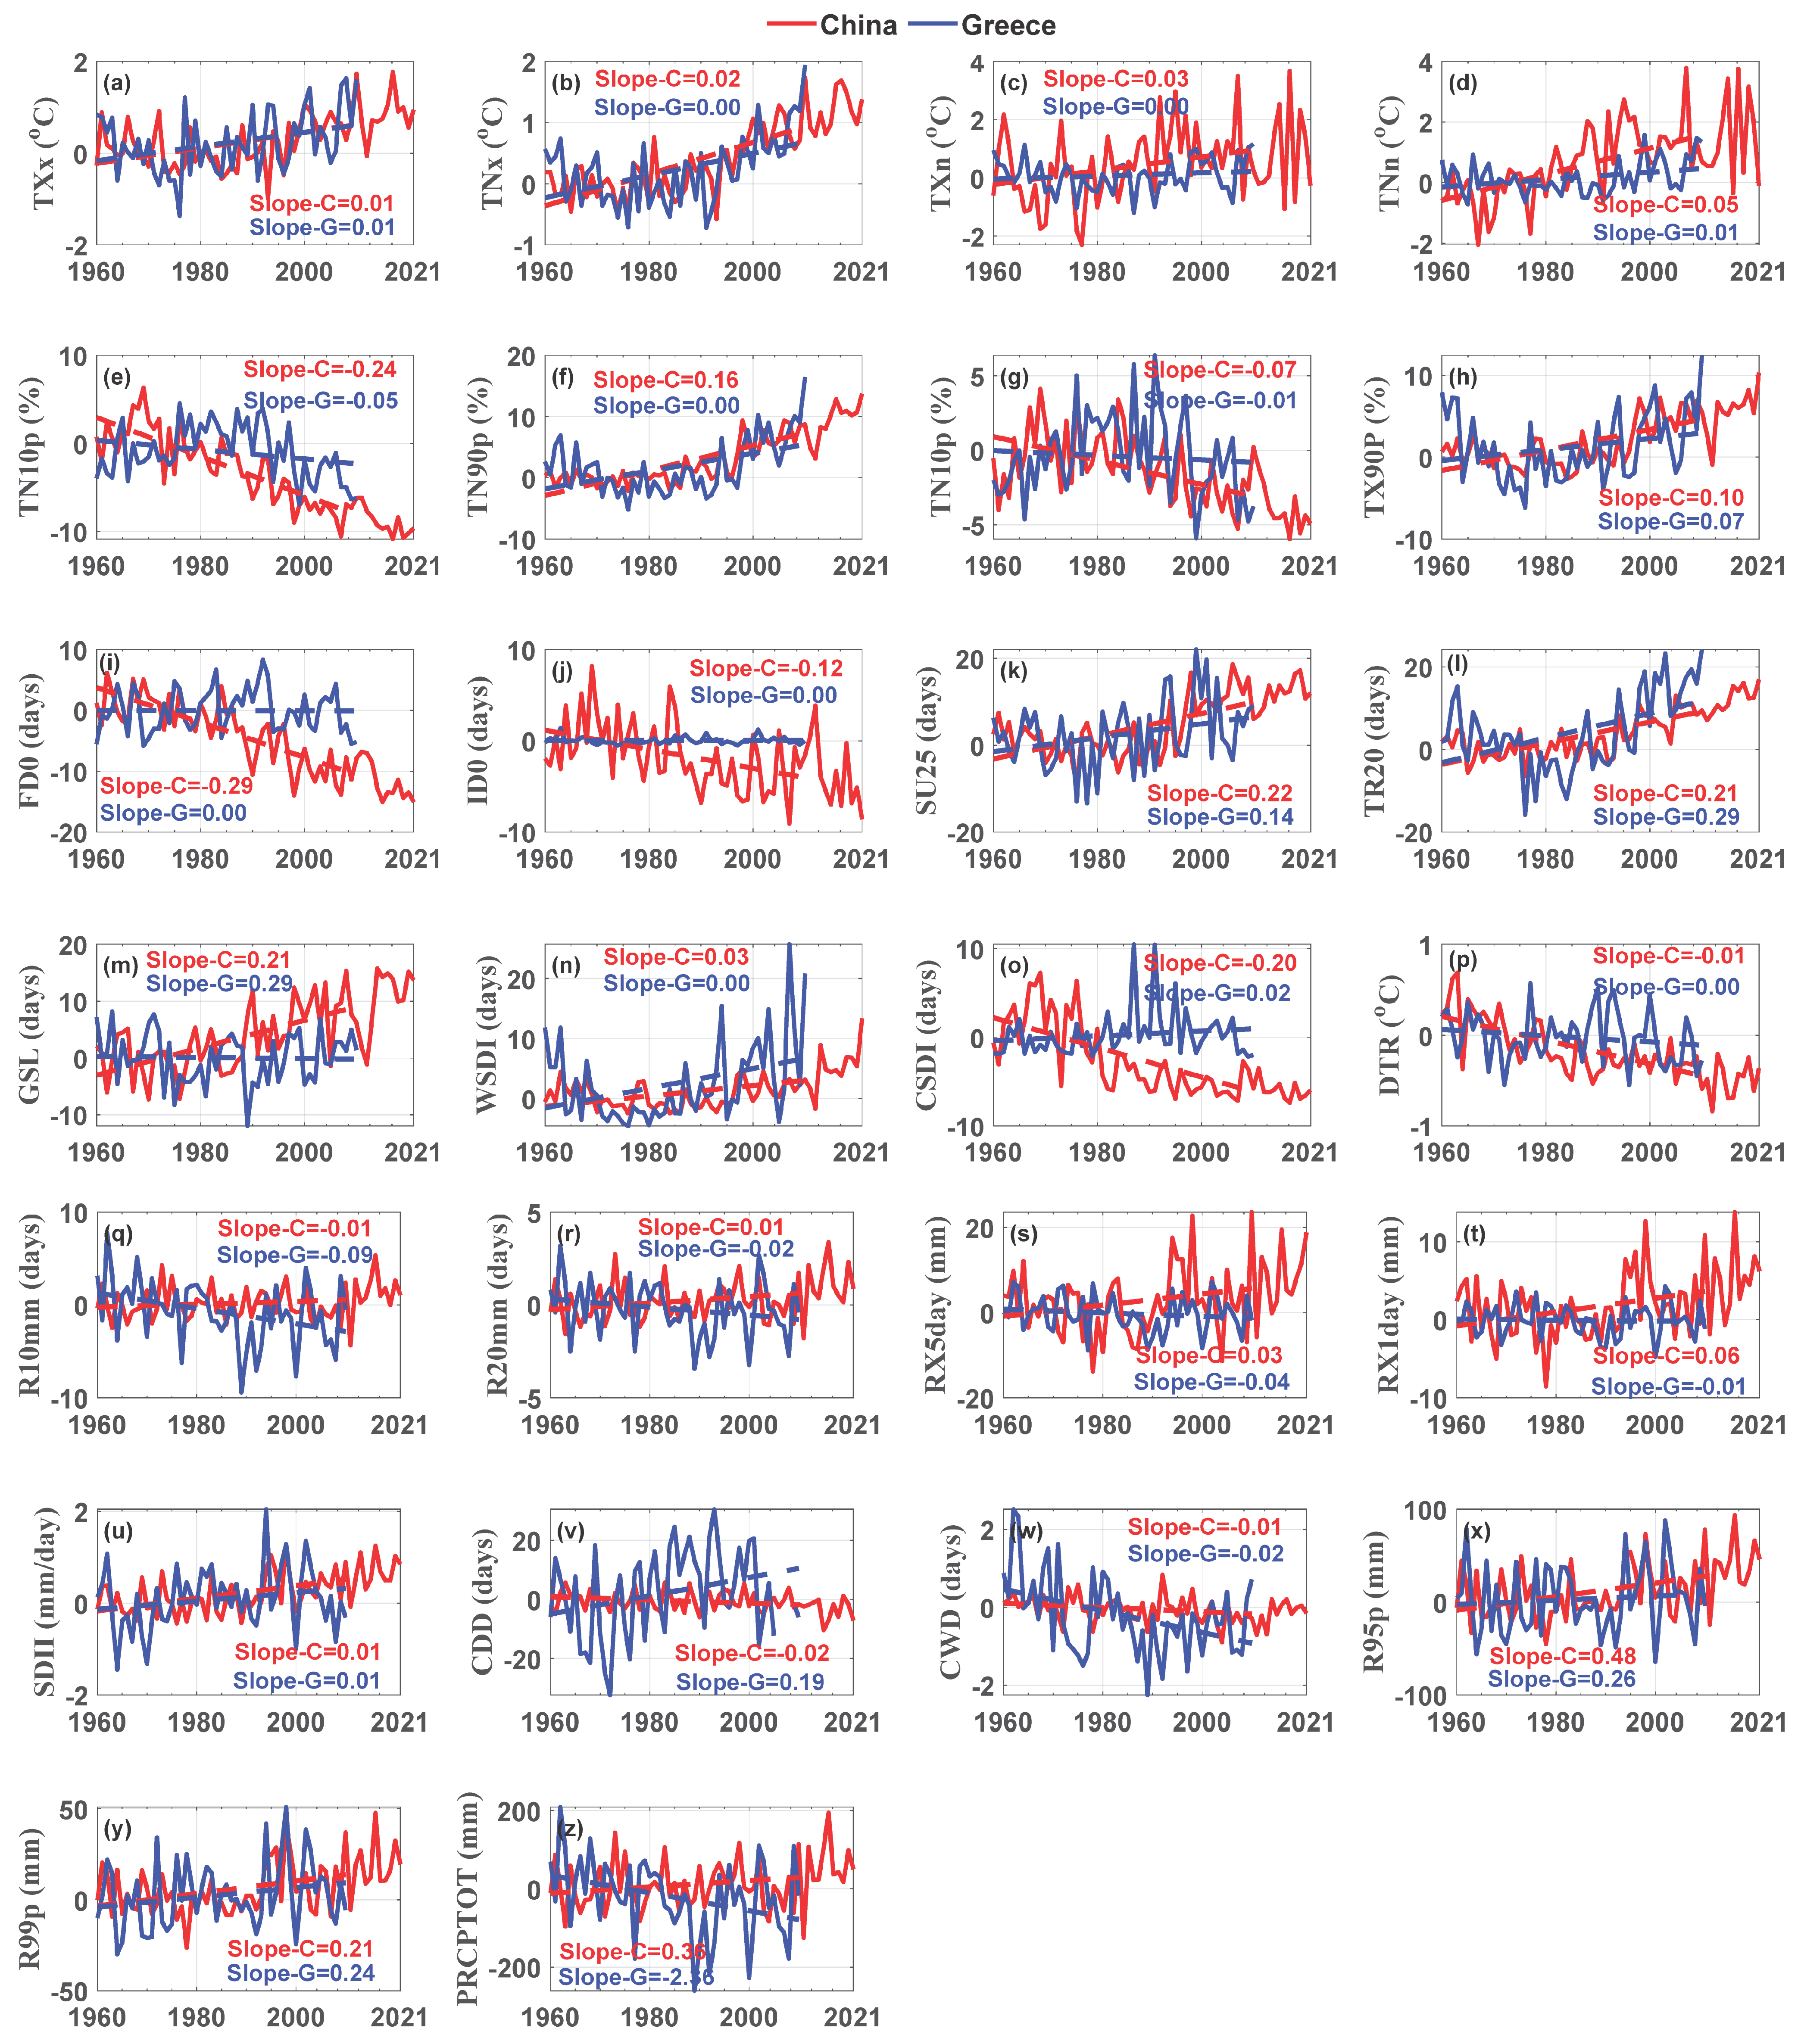
3.1.2. Comparison of Temporal Variation Characteristics of Regional Mean Climate Extreme Index Series between 1960 and 2010
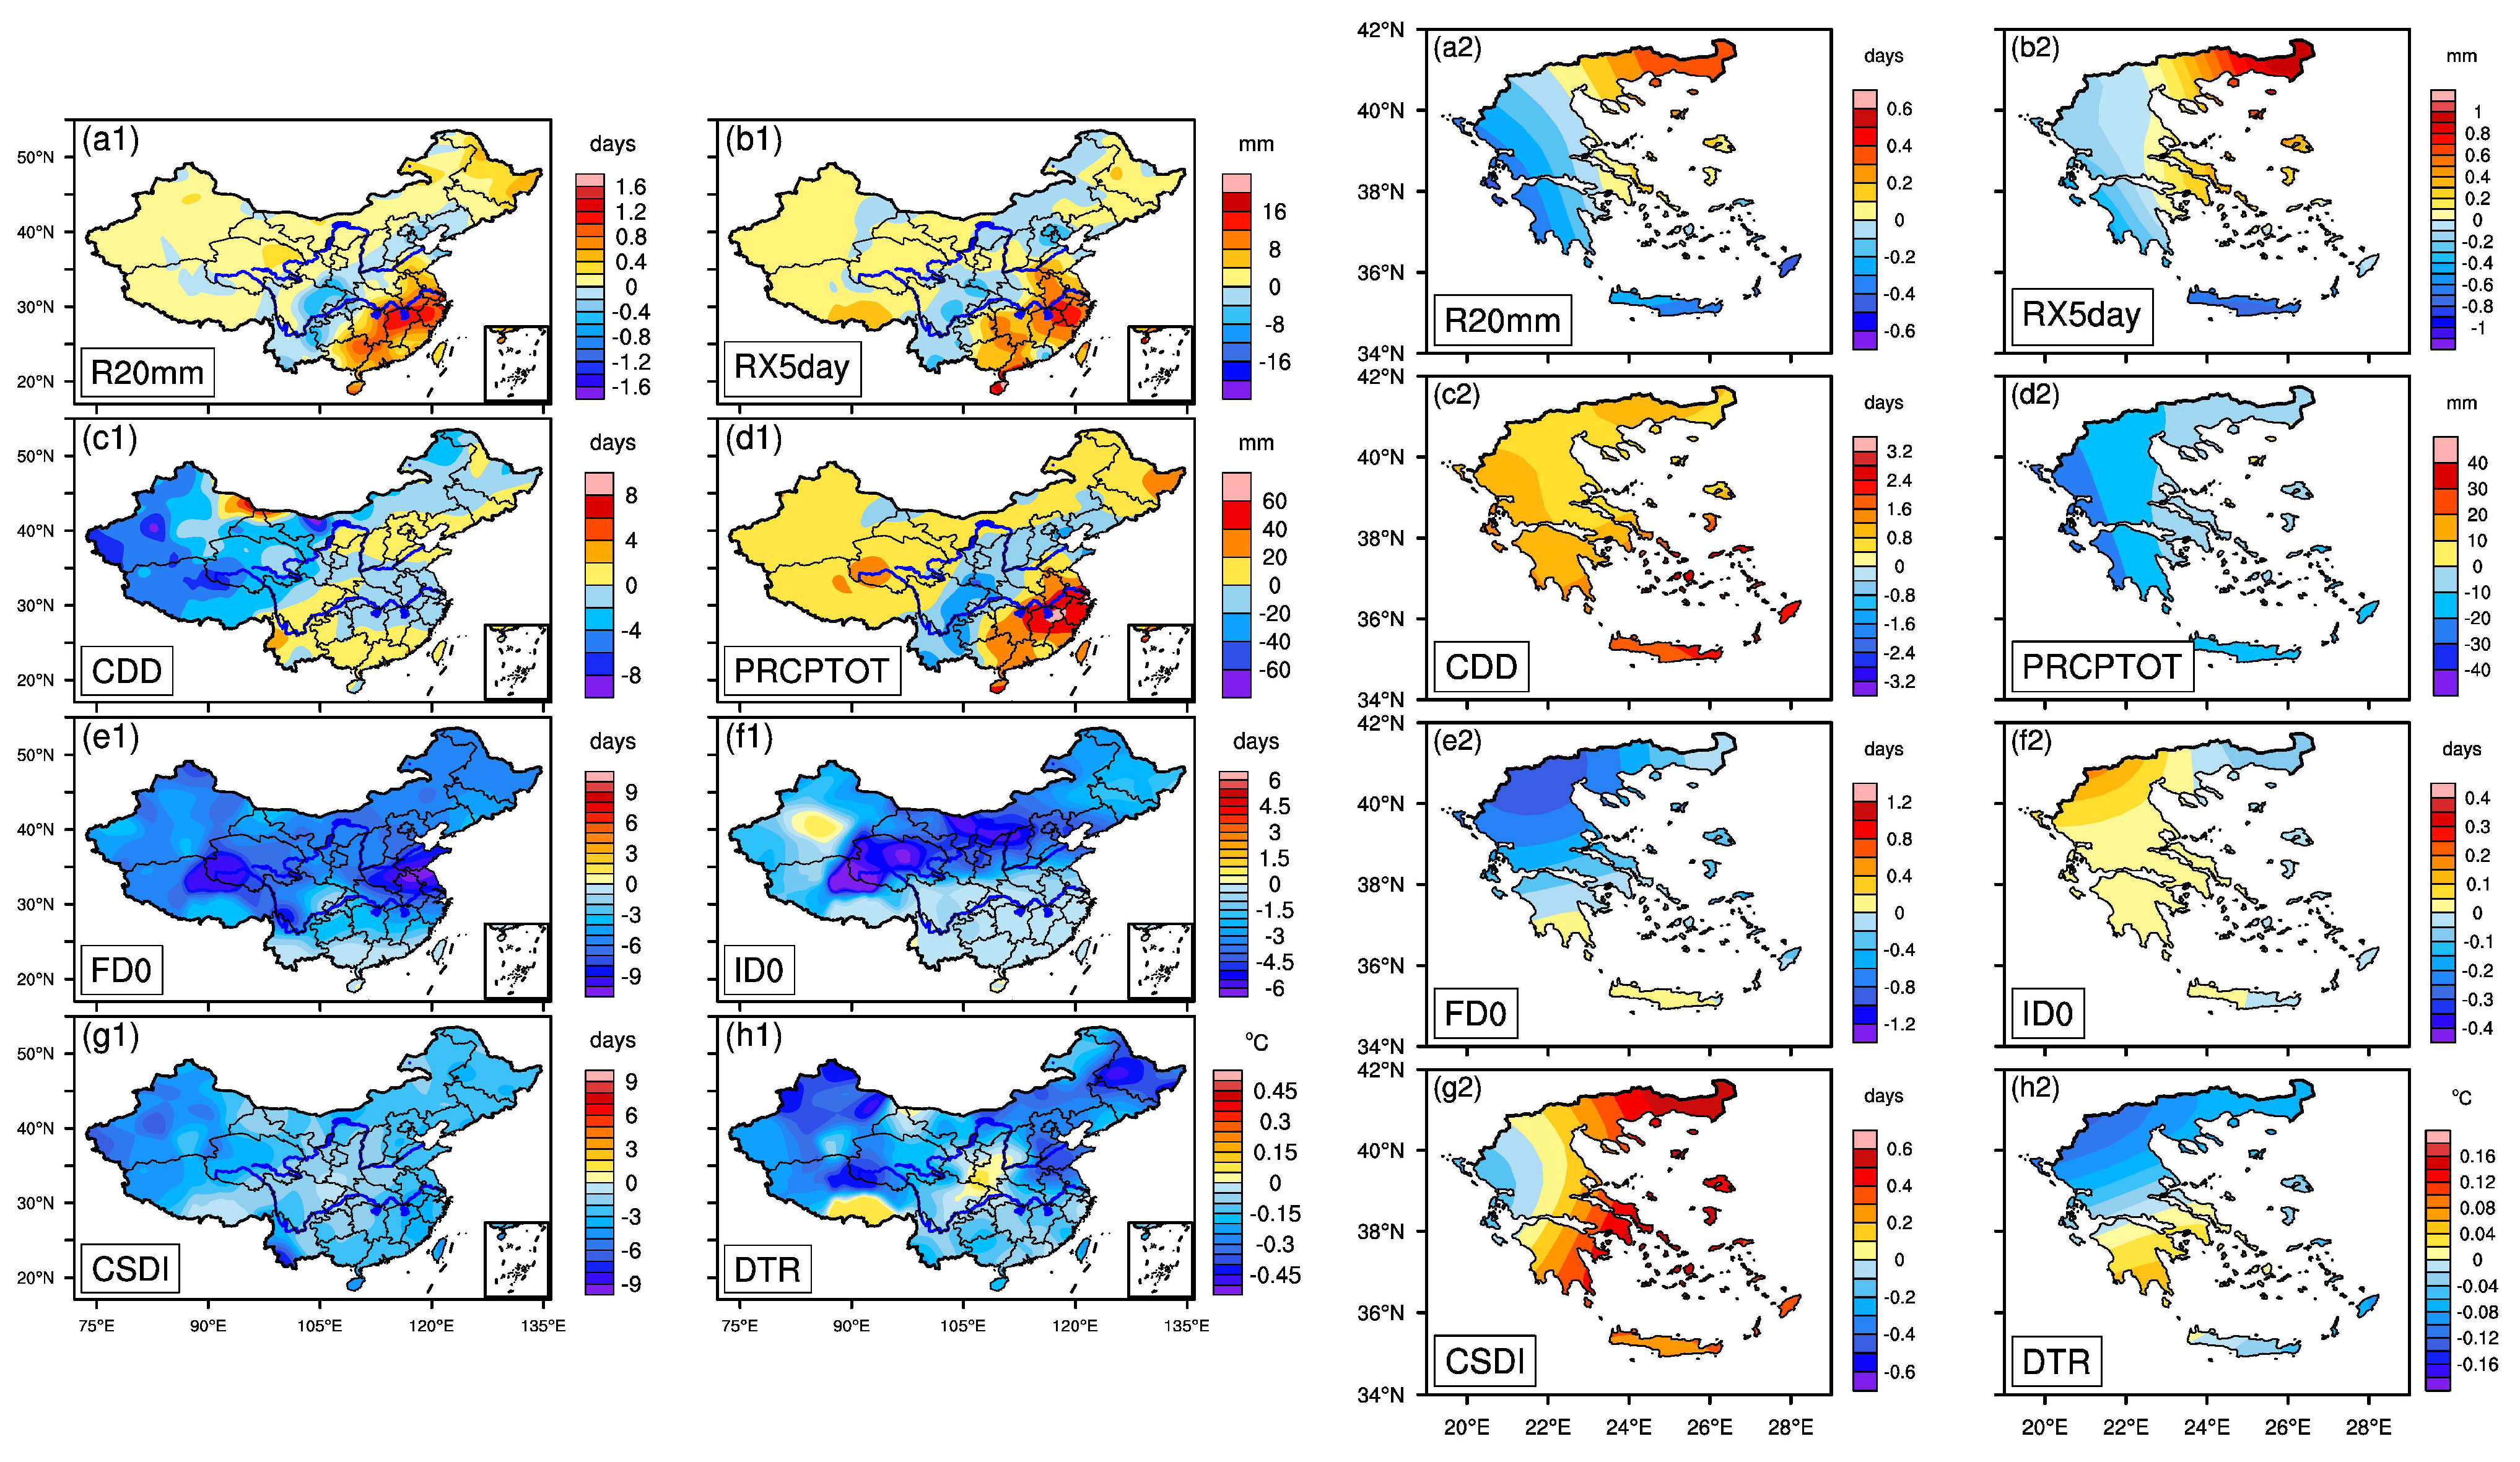
3.2. Comparison of Geographical Patterns of Climate Extreme Indices between 1960 and 2010
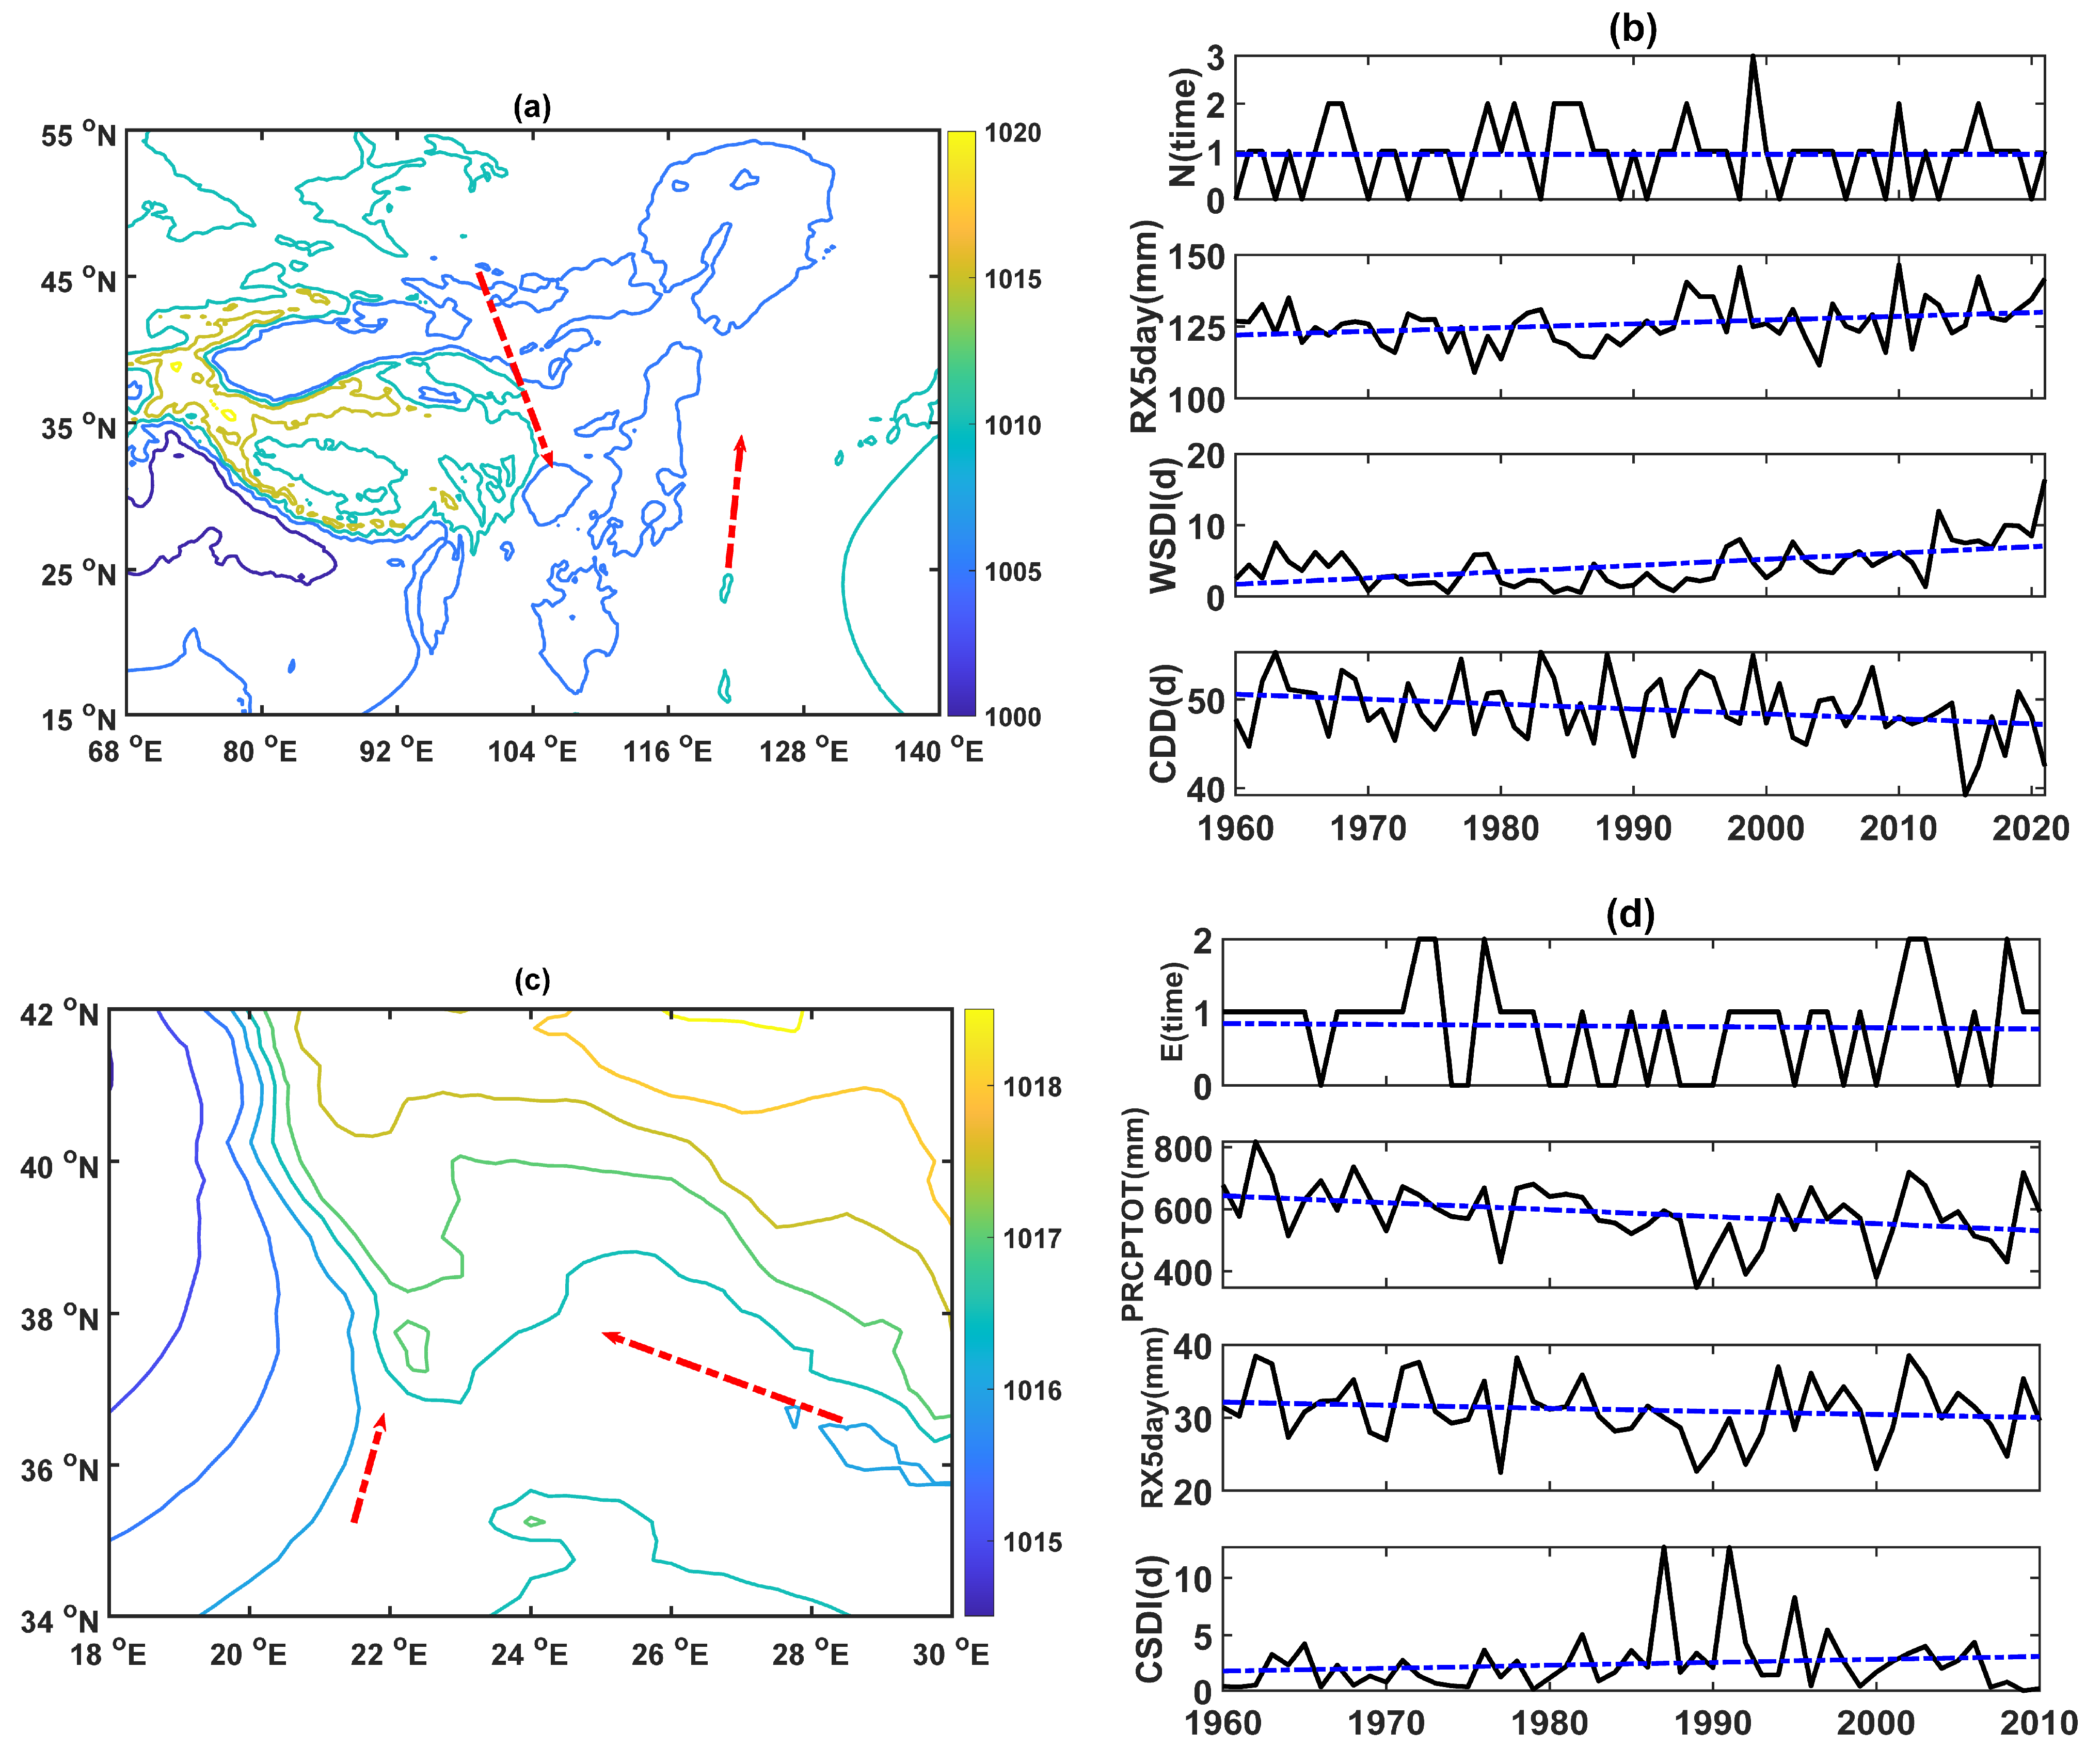
3.3. Relationship between Climate Extremes and Circulation Types
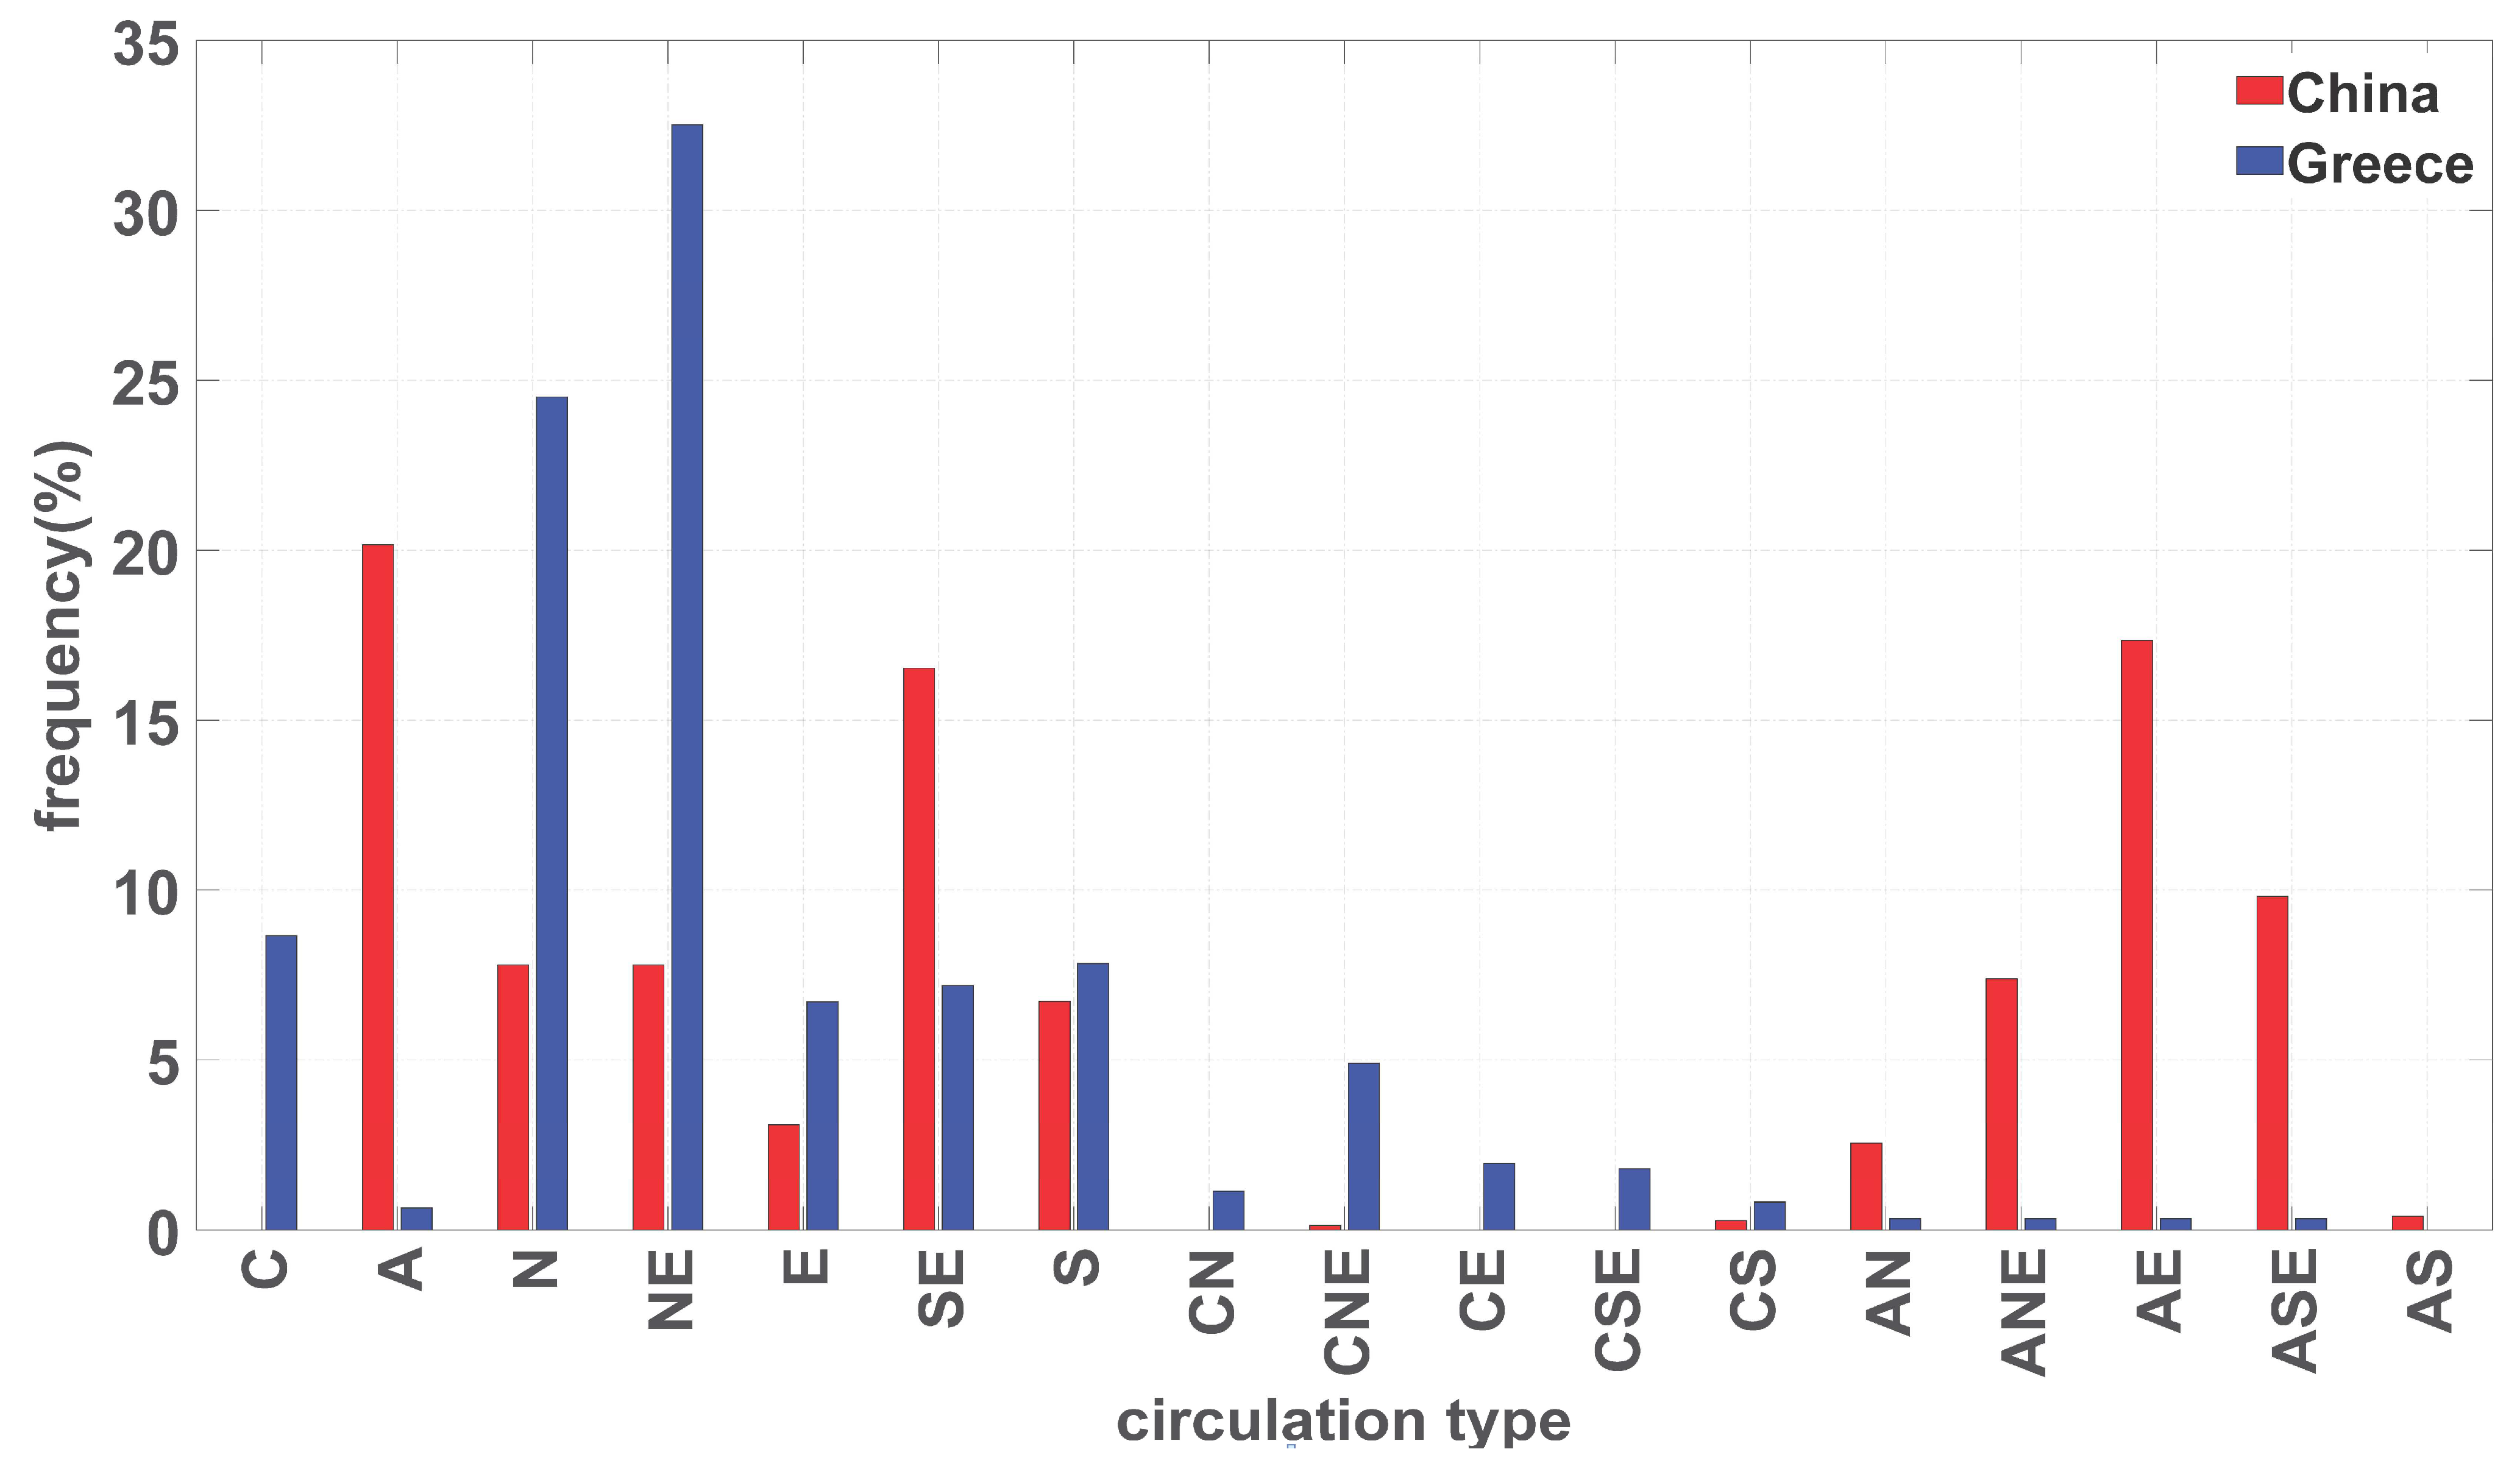
3.3.1. Main Circulation Types in China and Greece
3.3.2. Main Circulation Types in China and Greece
4. Summary and Conclusions
Author Contributions
Funding
Institutional Review Board Statement
Informed Consent Statement
Data Availability Statement
Acknowledgments
Conflicts of Interest
References
- IPCC 2021. Summary for Policymakers. In Climate Change 2021: The Physical Science Basis. Contribution of Working Group I to the Sixth Assessment Report of the Intergovernmental Panel on Climate Change; Cambridge University Press: Cambridge, UK, 2021; in press. [Google Scholar]
- Yan, Z.; Ding, Y.; Zhai, P.; Song, L.; Cao, L.; Li, Z. Re-assessing climatic warming in China since 1900. J. Meteor. Res. 2020, 34, 243–251. [Google Scholar] [CrossRef]
- Yao, T.; Bolch, T.; Chen, D.; Gao, J.; Immerzeel, W.; Piao, S.; Su, F.; Thompson, L.; Wada, Y.; Wand, L.; et al. The imbalance of the Asian water tower. Nat. Rev. Earth Environ. 2022, 3, 618–632. [Google Scholar] [CrossRef]
- Ren, G.Y.; Feng, G.L.; Yan, Z.W. Progresses in observation studies of climate extremes and changes in mainland China. Clim. Environ. Res. 2010, 15, 337–353. (In Chinese) [Google Scholar]
- Shi, J.; Cui, L.; Ma, Y.; Du, H.; Wen, K. Trends in temperature extremes and their association with circulation patterns in China during 1961–2015. Atmos. Res. 2018, 212, 259–272. [Google Scholar] [CrossRef]
- Yin, H.; Sun, Y. Characteristics of extreme temperature and precipitation in China in 2017 based on ETCCDI indices. Adv. Clim. Chang. Res. 2019, 15, 363–373. (In Chinese) [Google Scholar] [CrossRef]
- Wang, J.; Yan, Z. Rapid rises in the magnitude and risk of extreme regional heat wave events in China. Weather. Clim. Extrem. 2021, 34, 100379. [Google Scholar] [CrossRef]
- Lin, P.; He, Z.; Du, J.; Chen, L.; Zhu, X.; Li, J. Recent changes in daily climate extremes in an arid mountain region, a case study in northwestern China’s Qilian Mountains. Sci. Rep. 2017, 7, 2245. [Google Scholar] [CrossRef] [Green Version]
- Li, X.; You, Q.; Ren, G.; Wang, S.; Zhang, Q.; Yang, J.; Zheng, G. Concurrent droughts and hot extremes in Northwest China from 1961 to 2017. Int. J. Climatol. 2019, 39, 2186–2196. [Google Scholar] [CrossRef]
- Pei, L.; Yan, Z.; Chen, D.; Miao, S. The Contribution of Human-Induced Atmospheric Circulation Changes to the Record-Breaking Winter Precipitation Event over Beijing in February 2020. Bull. Am. Meteor. Soc. 2022, 103, S55–S60. [Google Scholar] [CrossRef]
- Bartzokas, A.; Houssos, E.E. Extreme Temperature Events in NW Greece. In Proceedings of the 10th International Conference on Harmonisation within Atmospheric Dispersion Modelling for Regulatory Purposes, Crete, Greece; 2005; pp. 556–560. Available online: https://www.researchgate.net/publication/233898112 (accessed on 1 September 2022).
- Kolios, S.; Antonatou, G.; Zervas, E. Observed temperature extremes in Greece and their relation with North Atlantic Oscillation. Int. J. Global. Warm. 2018, 15, 392–412. [Google Scholar] [CrossRef]
- Houssos, E.E.; Bartzokas, A. Extreme precipitation events in NW Greece. Adv. Geosci. 2006, 7, 91–96. [Google Scholar] [CrossRef]
- Li, C.; Yang, H.; Zhao, J. Combinational anomalies of atmospheric circulation system and occurrences of extreme weather/climate events. Trans. Atmos. Sci. 2019, 42, 321–333. (In Chinese) [Google Scholar] [CrossRef]
- Yan, Z.; Jones, P.D.; Davies, T.D.; Moberg, A.; Bergstrom, H.; Camuffo, D.; Cocheo, C.; Maugeri, M.; Demaree, G.; Verhoeve, T.; et al. Trends of extreme temperatures in Europe and China based on daily observations. Clim. Chang. 2002, 53, 355–392. [Google Scholar] [CrossRef]
- Lamb, H.H. Types and spells of weather around the year in the British Isles. Q. J. R. Meteorol. Soc. 1950, 76, 393–438. [Google Scholar] [CrossRef]
- Jenkinson, A.; Collison, F. An initial climatology of gales over the North Sea. In Synoptic Climatology Branch Memorandum; Meteorological Office: Exeter, UK, 1977; Volume 62, pp. 1–62. [Google Scholar]
- Zhu, Y.; Chen, D.; Li, W. Lamb-Jenkinson Circulation Type Classification System and Its Application in China. J. Nanjing Inst. Meteorol. 2007, 30, 289–297. (In Chinese) [Google Scholar]
- Brisson, E.; Demuzere, M.; Kwakernaak, B.; Van Lipzig, N.P.M. Relations between atmospheric circulation and precipitation in Belgium. Meteor. Atmos. Phys. 2011, 111, 27–39. [Google Scholar] [CrossRef]
- Teng, H. Relationship Between Circulation Patterns and Summer Precipitation in Shangdong Province. J. Arid. Meteor. 2016, 34, 789–795. (In Chinese) [Google Scholar] [CrossRef]
- Maheras, P.; Tolika, K.; Anagnostopoulou, C.; Vafiadis, M.; Patrikas, I.; Flocas, H.A. On the relationships between circulation types and changes in rainfall variability in Greece. Int. J. Climatol. 2004, 24, 1695–1712. [Google Scholar] [CrossRef]
- Maheras, P.; Flocas, H.A.; Tolika, K.; Anagnostopoulou, K.; Vafiadis, M. Circulation types and extreme temperature changes in Greece. Clim. Res. 2006, 30, 161–174. [Google Scholar] [CrossRef]
- Szentimrey, T. Multiple Analysis of Series for Homogenisation (MASH). In Proceedings of the Second Seminar for Homogenisation of Surface Climatological Data, Budapest, Hungary, 9–13 November 1998; WCDMP-No. 41. WMO: Geneva, Switzerland, 1999; pp. 27–46. [Google Scholar]
- Guijarro, J.A. Homogenisation of Climatic Series with Climatol—Version 3.1.1. 2021. Available online: https://climatol.eu/homog_climatol-en.pdf (accessed on 4 April 2022).
- Argiriou, A.A.; Li, Z.; Armaos, V.; Mamara, A.; Shi, Y.; Yan, Z. Homogenized Monthly and Daily Temperature and Precipitation Time Series in China and Greece since 1960. Adv. Atmos. Sci. 2022. (Manuscript under review, with datasets DOIs: 10.57760/sciencedb.01720 for Greece and 10.57760/sciencedb.01731 for China). [Google Scholar]
- Uppala, S.M.; KÅllberg, P.W.; Simmons, A.J.; Andrae, U.; Bechtold, V.D.C.; Fiorino, M.; Gibson, J.K.; Haseler, J.; Hernandez, A.; Kelly, G.A.; et al. The ERA-40 re-analysis. Q. J. R. Meteorol. Soc. 2005, 131, 2961–3012. [Google Scholar] [CrossRef]
- Muñoz-Sabater, J.; Dutra, E.; NAgustí-Panareda, A.; Albergel, C.; Arduini, G.; Balsamo, G.; Boussetta, S.; Choulga, M.; Harrigan, S.; Hersbach, H.; et al. ERA5-Land: A state-of-the-art global reanalysis dataset for land applications. Earth Syst. Sci. Data 2021, 13, 4349–4383. [Google Scholar] [CrossRef]
- Cressman, G.P. An operational objective analysis system. Mon. Weather Rev. 1959, 87, 367–374. [Google Scholar] [CrossRef]
- Mann, H.B. Nonparametric tests against trend. Econometrica 1945, 13, 245–259. [Google Scholar] [CrossRef]
- Kendall, M.G. Rank Correlation Methods; Oxford University Press: New York, NY, USA, 1975. [Google Scholar]
- Theil, H. A rank-invariant method of linear and polynomial regression analysis. I, II, III. Nederl. Akad. Wetensch. Proc. 1950, 53, 386–392, 521–525, 1397–1412. [Google Scholar]
- Sen, P. Estimated of the regression coefficient based on Kendall’s Tau. J. Am. Stat. Assoc. 1968, 39, 1379–1389. [Google Scholar] [CrossRef]
- Longobardi, A.; Villani, P. Trend Analysis of annual and seasonal rainfall time series in the Mediterranean area. Int. J. Climatol. 2010, 30, 1538–1546. [Google Scholar] [CrossRef]
- Chen, D. A monthly circulation climatology for Sweden and its application to a winter temperature case study. Int. J. Climatol. 2000, 20, 1067–1076. [Google Scholar] [CrossRef]
- Tošić, I.; Putniković, S.; Tošić, M.; Lazić, I. Extreme Temperature Events in Serbia in Relation to Atmospheric Circulation. Atmosphere 2021, 12, 1584. [Google Scholar] [CrossRef]
- Ma, N.; Zhang, Y. Increasing Tibetan Plateau terrestrial evapotranspiration primarily driven by precipitation. Agric. Forest. Meteorol. 2022, 317, 108887. [Google Scholar] [CrossRef]
- Samuels, R.; Hochman, A.; Baharad, A.; Givati, A.; Levi, Y.; Yosef, Y.; Saaroni, H.; Ziv, B.; Harpaz, T.; Alpert, P. Evaluation and projection of extreme precipitation indices in the Eastern Mediterranean based on CMIP5 multi-model ensemble. Int. J. Climatol. 2018, 38, 2280–2297. [Google Scholar] [CrossRef]
- Qiu, Y.; Feng, J.; Yan, Z.; Wang, J.; Li, Z. High-resolution dynamical downscaling for regional climate projection in Central Asia based on bias-corrected multiple GCMs. Clim. Dyn. 2022, 58, 777–791. [Google Scholar] [CrossRef]
- Hui, P.; Wei, F.; Xiao, Y.; Yang, J.; Xu, J.; Tang, J. Future projection of extreme precipitation within CORDEX East Asia phase II: Multi-model ensemble. Theor. Appl. Climatol. 2022, 150, 1271–1293. [Google Scholar] [CrossRef]


| Climate Index | Indicator Name | Definitions | Units |
|---|---|---|---|
| TXx | Max Tmax | Annual maximum value of daily maximum temperature | °C |
| TNx | Max Tmin | Annual maximum value of daily minimum temperature | °C |
| TXn | Min Tmax | Annual minimum value of daily maximum temperature | °C |
| TNn | Min Tmin | Annual minimum value of daily maximum temperature | °C |
| TN10p | Cool nights | Percentage of days when TN < 10th percentile | % |
| TX10p | Cool days | Percentage of days when TX < 10th percentile | % |
| TN90p | Warm nights | Percentage of days when TN > 90th percentile | % |
| TX90p | Warm days | Percentage of days when TX > 90th percentile | % |
| FD0 | Frost days | Annual count when TN < 0 °C | Days |
| SU25 | Summer days | Annual count when TX > 25 °C | Days |
| ID0 | Ice days | Annual count when TX < 0 °C | Days |
| TR20 | Tropical nights | Annual count when TN > 20 °C | Days |
| WSDI | Warm spell duration indicator | Annual count of days with at least 6 consecutive days when TX > 90th percentile | Days |
| CSDI | Cold spell duration indicator | Annual count of days with at least 6 consecutive days when TN < 10th percentile | Days |
| GSL | Growing season length | Annual (1st January to 31st December in NH, 1st July to 30th June in SH) count between first span of at least 6 days with TG > 5 °C and first span after July 1 (January 1 in SH) of 6 days with TG < 5 °C | Days |
| DTR | Daily temperature range | Monthly mean difference between TX and TN | ℃ |
| R10MM | Number of heavy precipitation days | Annual count of days when RR ≥ 10 mm | Days |
| R20MM | Number of very heavy precipitation days | Annual count of days when RR ≥ 20 mm | Days |
| RX5day | Max 5-day precipitation | Annual maximum consecutive 5-day precipitation | mm |
| RX1day | Max 1-day precipitation | Annual maximum 1-day precipitation | mm |
| SDII | Simple daily intensity index | Annual total precipitation divided by the number of wet days (RR ≥ 1mm) in the year | mm/day |
| CDD | Consecutive dry days | Maximum number of consecutive days with RR < 1 mm | Days |
| CWD | Consecutive wet days | Maximum number of consecutive days with RR < 1 mm | Days |
| R95p | Very wet days | Annual total precipitation when RR > 95th percentile | mm |
| R99p | Extremely wet days | Annual total precipitation when RR > 99th percentile | mm |
| PRCPTOT | Annual total wet-day precipitation | Annual total precipitation in wet days (RR > 1 mm) | mm |
| |ξ| ≤ V | |ξ| ≥ 2V | V < |ξ| < 2V | V < 6 and |ξ|< 6 |
|---|---|---|---|
| N; NE; E; SE; S; SW; W; NW | A; C | CN; CNE; CE; CSECS; CSW; CW; CNW; AN; ANE; AE; ASE; AS; ASW; AW; ANW | UD |
| Country | Time Period | TXx | TNx | TXn | TNn | TN10p | TN90p | TX10p |
|---|---|---|---|---|---|---|---|---|
| Greece | 1960–2010 | 0.1 * | 0.0 * | 0.0 | 0.1 | −0.5 | 0.0 * | −0.1 |
| China | 1960–2010 | 0.1 * | 0.2 * | 0.3 * | 0.5 * | −2.4 * | 1.6 * | −0.7 * |
| China | 1960–2021 | 0.2 * | 0.3 * | 0.2 * | 0.4 * | −2.2 * | 2.0 * | −0.9 * |
| TX90p | FD0 | ID0 | SU25 | TR20 | GSL | WSDI | ||
| Greece | 1960–2010 | 0.7 | 0.0 | 0.0 | 1.4 | 2.9 * | 2.9 | 1.3 * |
| China | 1960–2010 | 1.0 * | −2.9 * | −1.2 * | 2.2 * | 2.1 * | 2.4 * | 0.3 |
| China | 1960–2021 | 1.2 * | −2.9 * | −1.0 * | 2.5 * | 2.7 * | 2.5 * | 0.8 * |
| CSDI | DTR | R10MM | R20MM | RX5day | RX1day | SDII | ||
| Greece | 1960–2010 | 0.2 | 0.0 | −0.9 * | −0.2 | −0.4 | −0.1 | 0.1 |
| China | 1960–2010 | −2.0 * | −0.1 * | −0.1 | 0.1 | 0.3 | 0.6 | 0.1 * |
| China | 1960–2021 | −1.5 * | −0.1 * | 0.2 | 0.2 * | 1.2 * | 0.8 * | 0.1 * |
| CDD | CWD | R95p | R99p | PRCPTOT | ||||
| Greece | 1960–2010 | 1.9 | −0.2 * | 2.6 | 2.4 | −23.6 * | ||
| China | 1960–2010 | −0.2 | −0.1 * | 4.8 | 2.1 | 3.6 | ||
| China | 1960–2021 | −0.5 | −0.1 * | 7.3 * | 3.2 * | 8.4 * |
| R20MM | RX5day | CDD | PRCPTOT | FD0 | ID0 | WSDI | CSDI | |
|---|---|---|---|---|---|---|---|---|
| China | 0.35 | 0.53 * | 0.23 | 0.35 | 0.38 | 0.49 | 0.54 * | 0.35 |
| Greece | 0.71 * | 0.61 * | 0.50 * | 0.74 * | 0.57 * | 0.10 | 0.27 | 0.18 |
Publisher’s Note: MDPI stays neutral with regard to jurisdictional claims in published maps and institutional affiliations. |
© 2022 by the authors. Licensee MDPI, Basel, Switzerland. This article is an open access article distributed under the terms and conditions of the Creative Commons Attribution (CC BY) license (https://creativecommons.org/licenses/by/4.0/).
Share and Cite
Li, Z.; Shi, Y.; Argiriou, A.A.; Ioannidis, P.; Mamara, A.; Yan, Z. A Comparative Analysis of Changes in Temperature and Precipitation Extremes since 1960 between China and Greece. Atmosphere 2022, 13, 1824. https://doi.org/10.3390/atmos13111824
Li Z, Shi Y, Argiriou AA, Ioannidis P, Mamara A, Yan Z. A Comparative Analysis of Changes in Temperature and Precipitation Extremes since 1960 between China and Greece. Atmosphere. 2022; 13(11):1824. https://doi.org/10.3390/atmos13111824
Chicago/Turabian StyleLi, Zhen, Yingling Shi, Athanassios A. Argiriou, Panagiotis Ioannidis, Anna Mamara, and Zhongwei Yan. 2022. "A Comparative Analysis of Changes in Temperature and Precipitation Extremes since 1960 between China and Greece" Atmosphere 13, no. 11: 1824. https://doi.org/10.3390/atmos13111824