

Predictability of the Wintertime Western Pacific Pattern in the APEC Climate Center Multi-Model Ensemble

Abstract
:1. Introduction
2. Data and Methods
2.1. Data
2.2. Methods
3. Results and Discussion
3.1. Current Status of WP Prediction
3.2. Sources of Predictability in Observations and MME
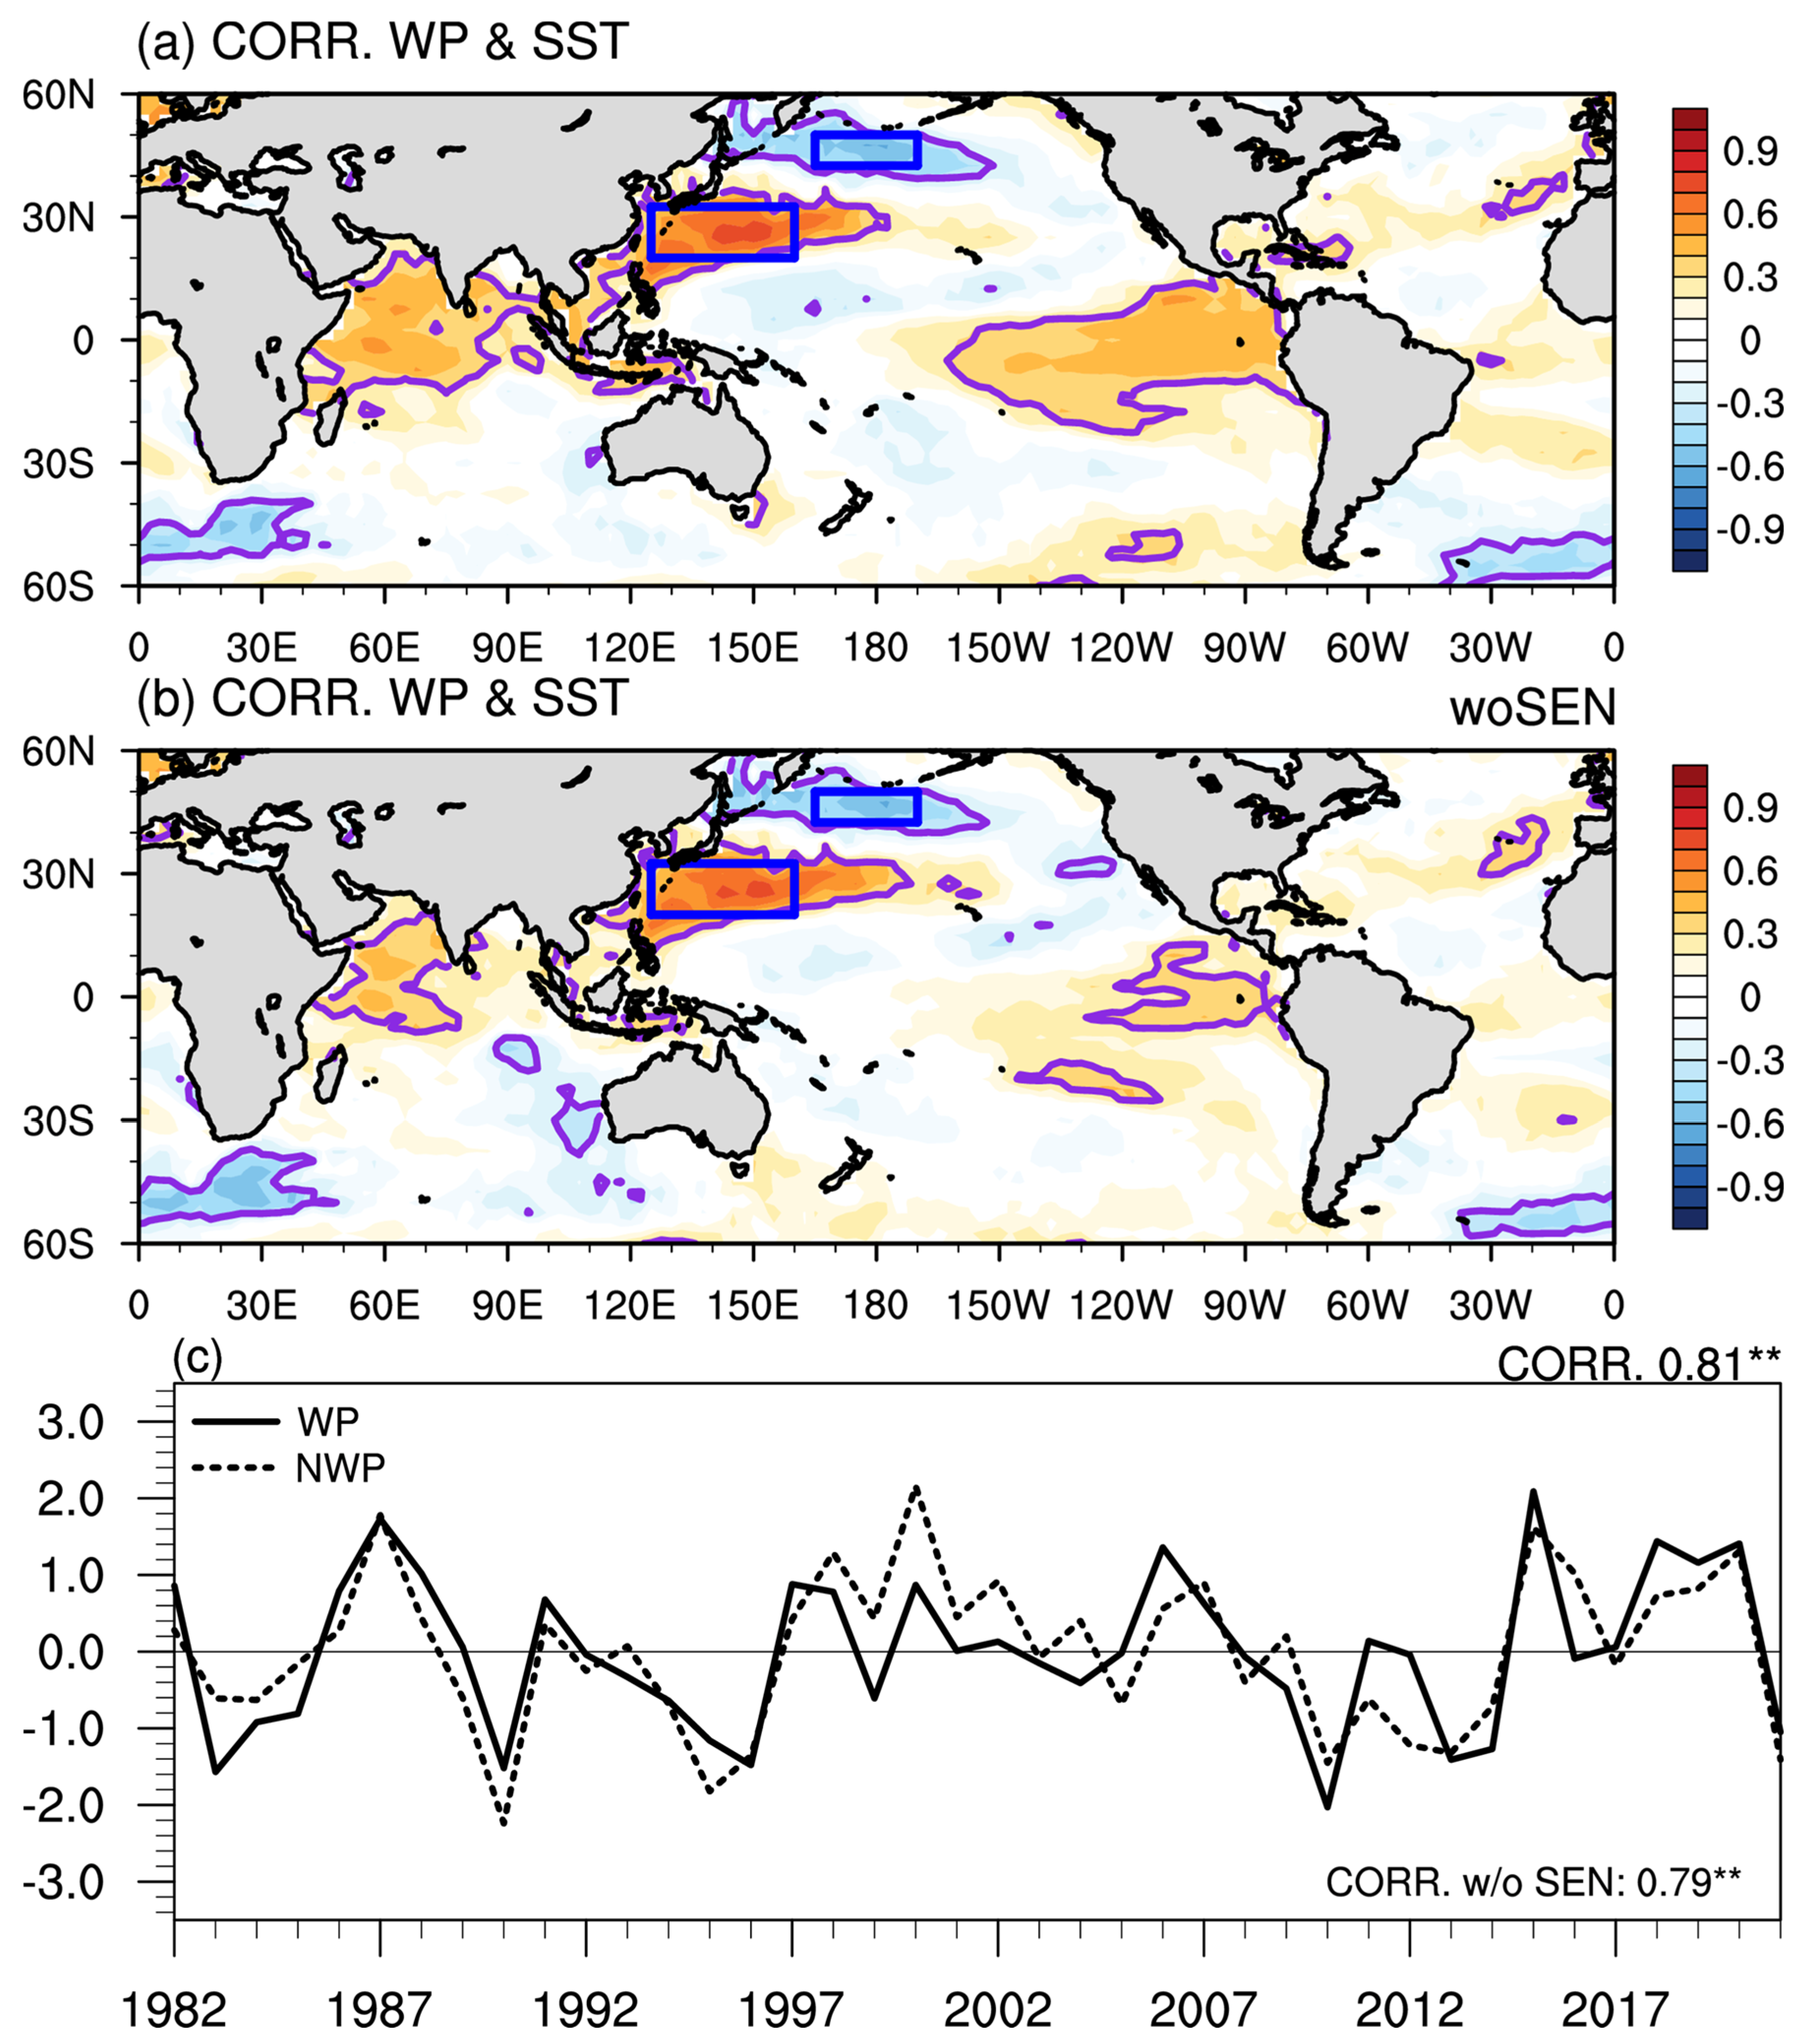
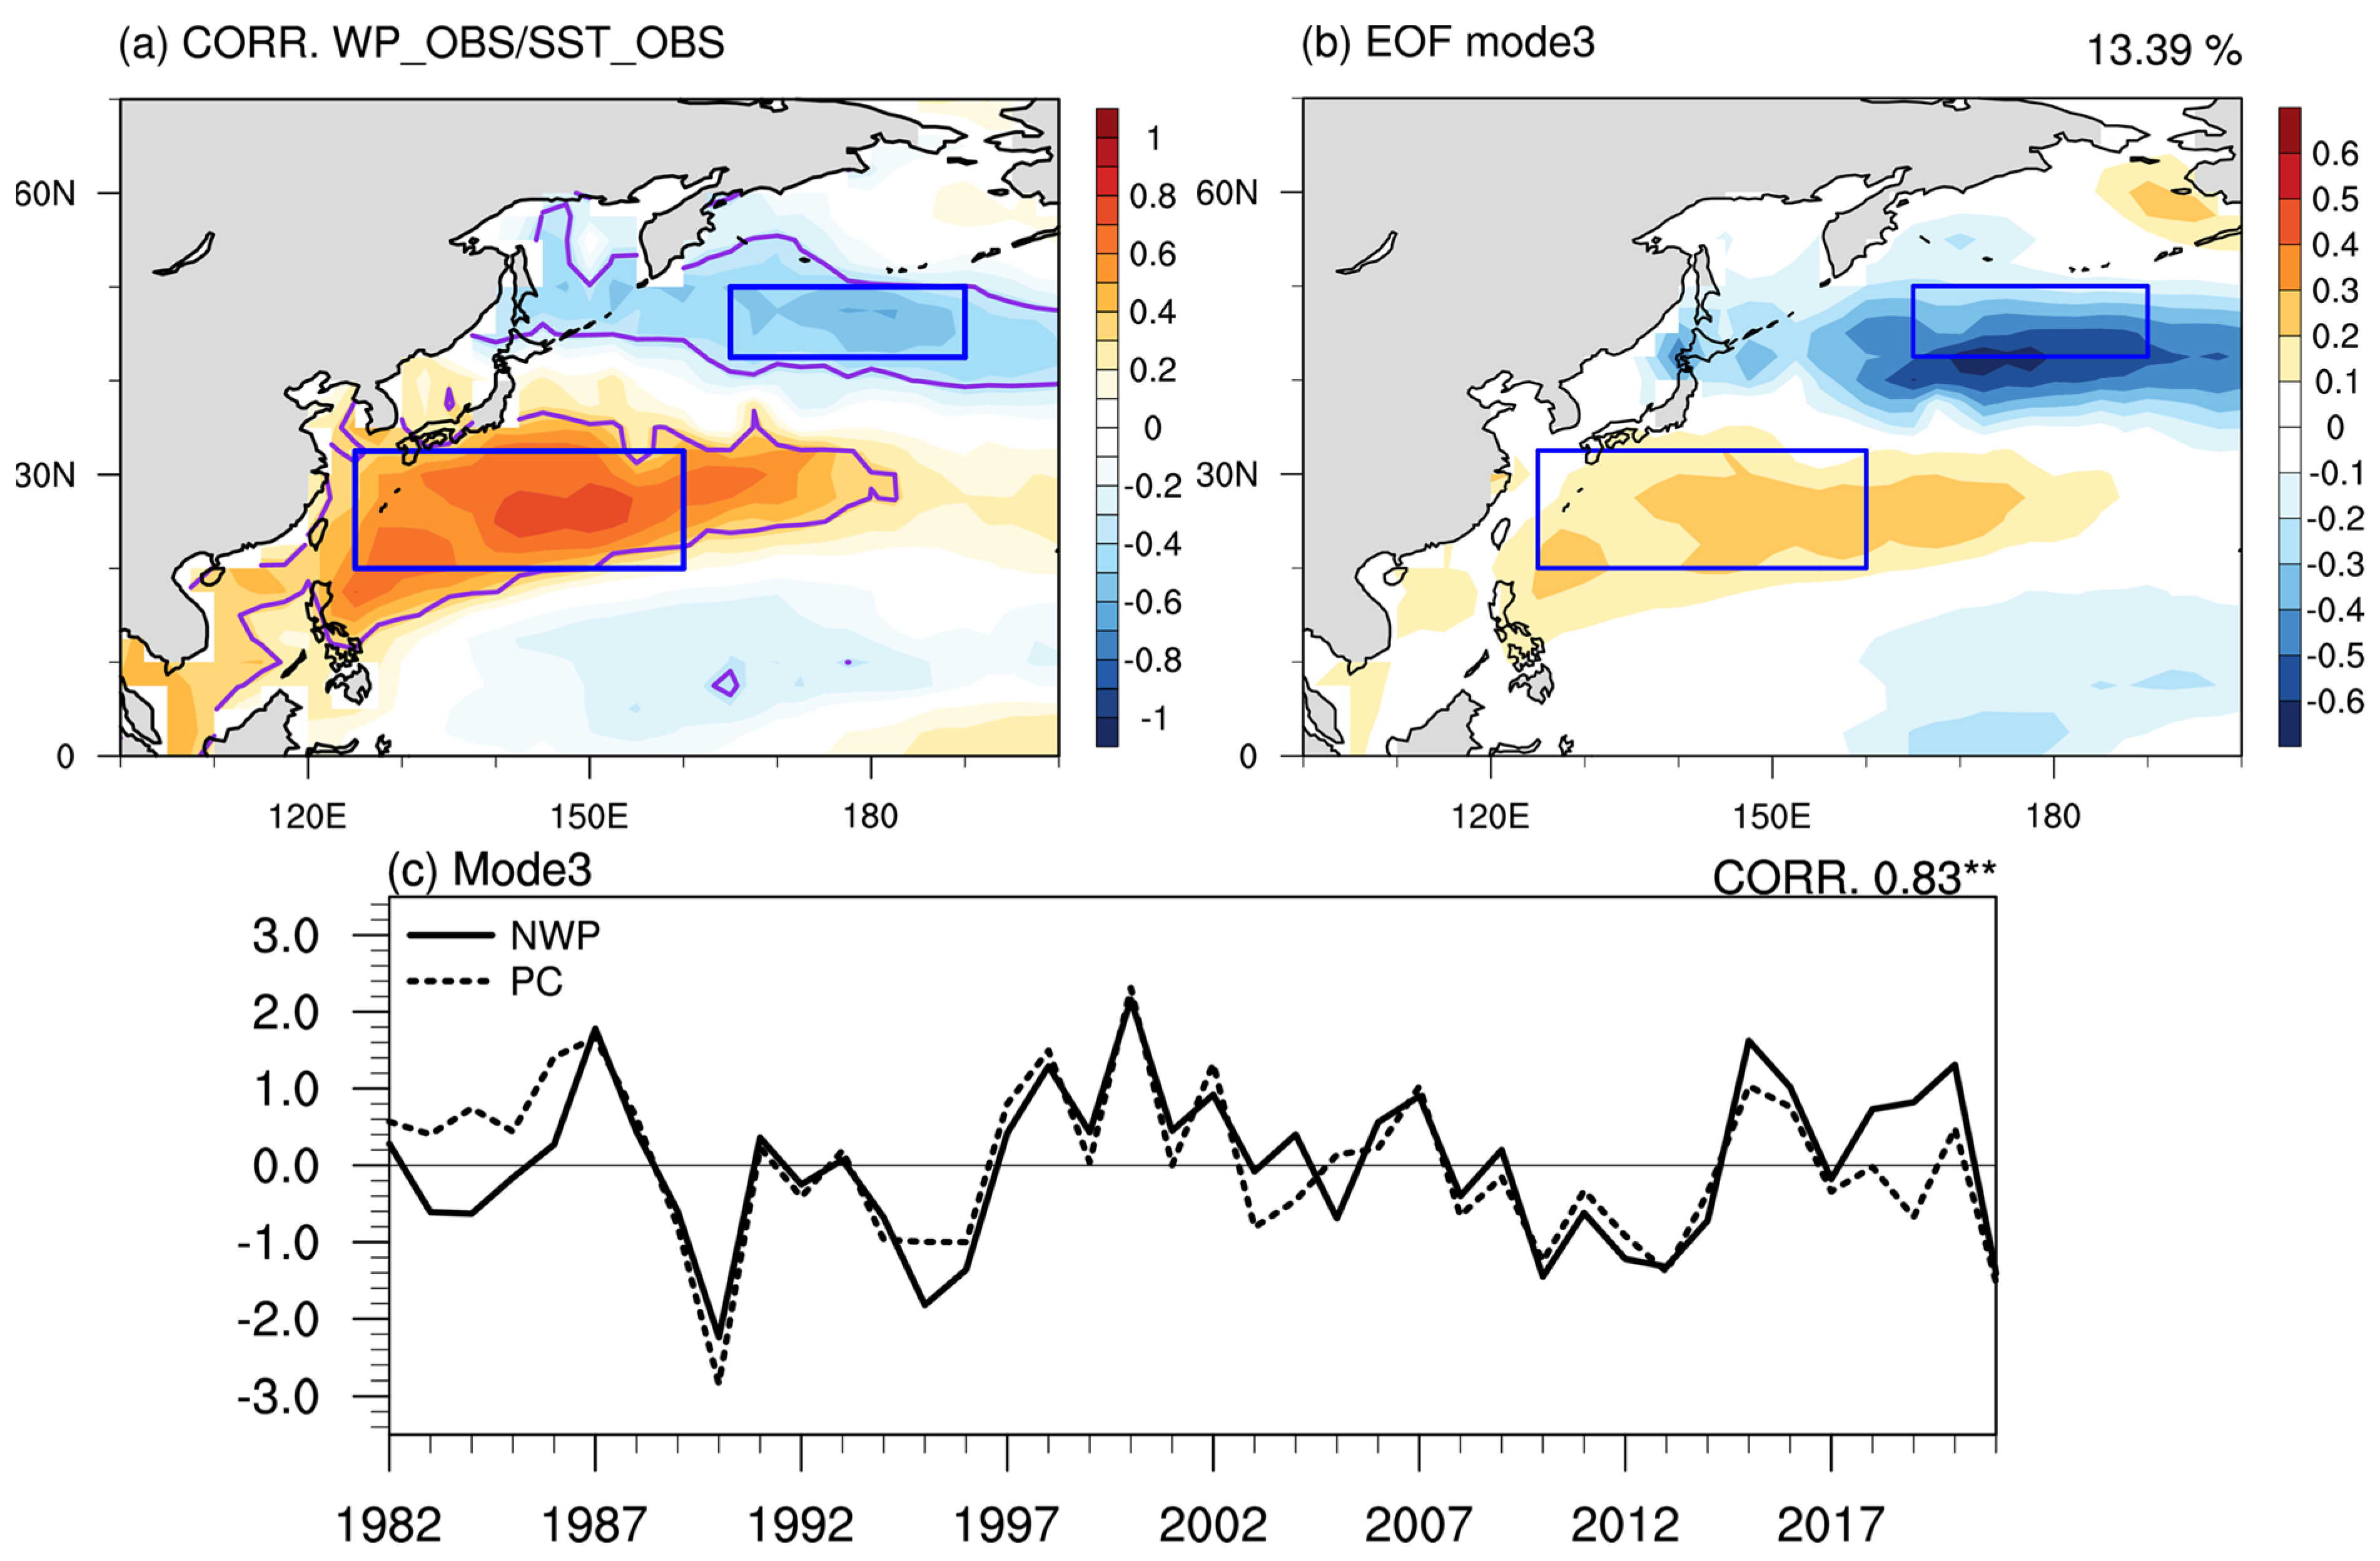
3.2.1. Observations
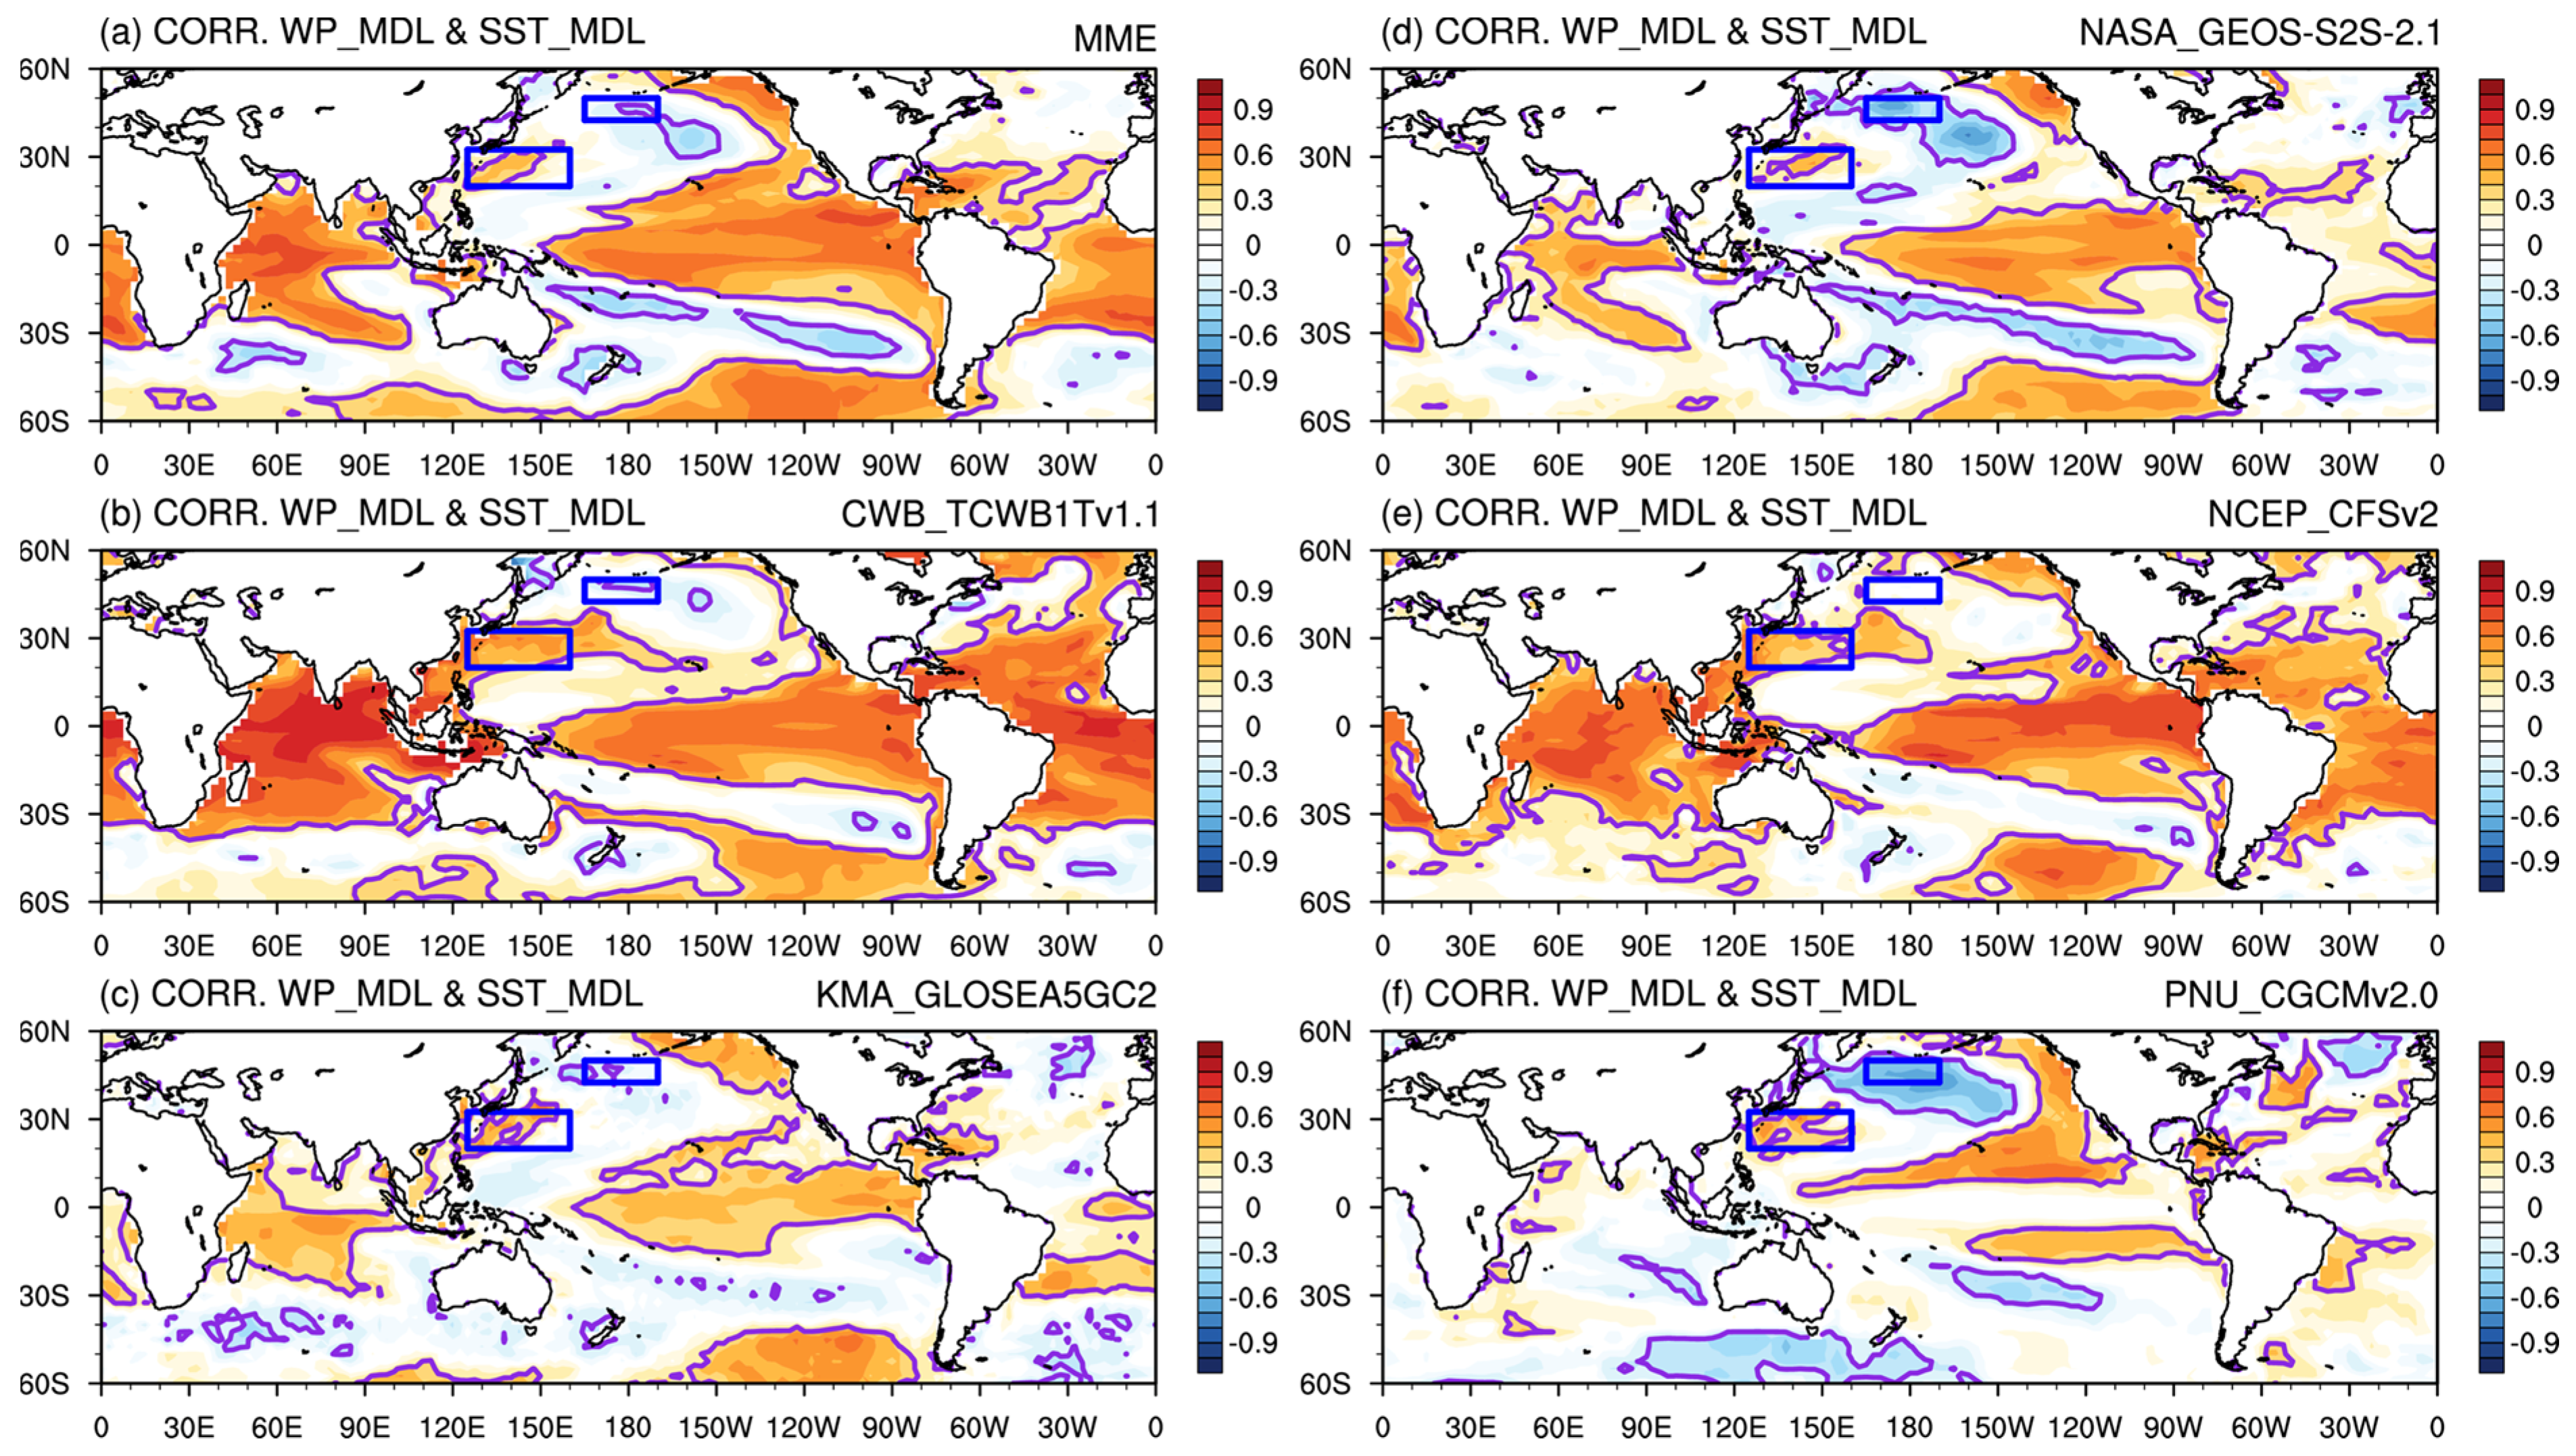
3.2.2. MME
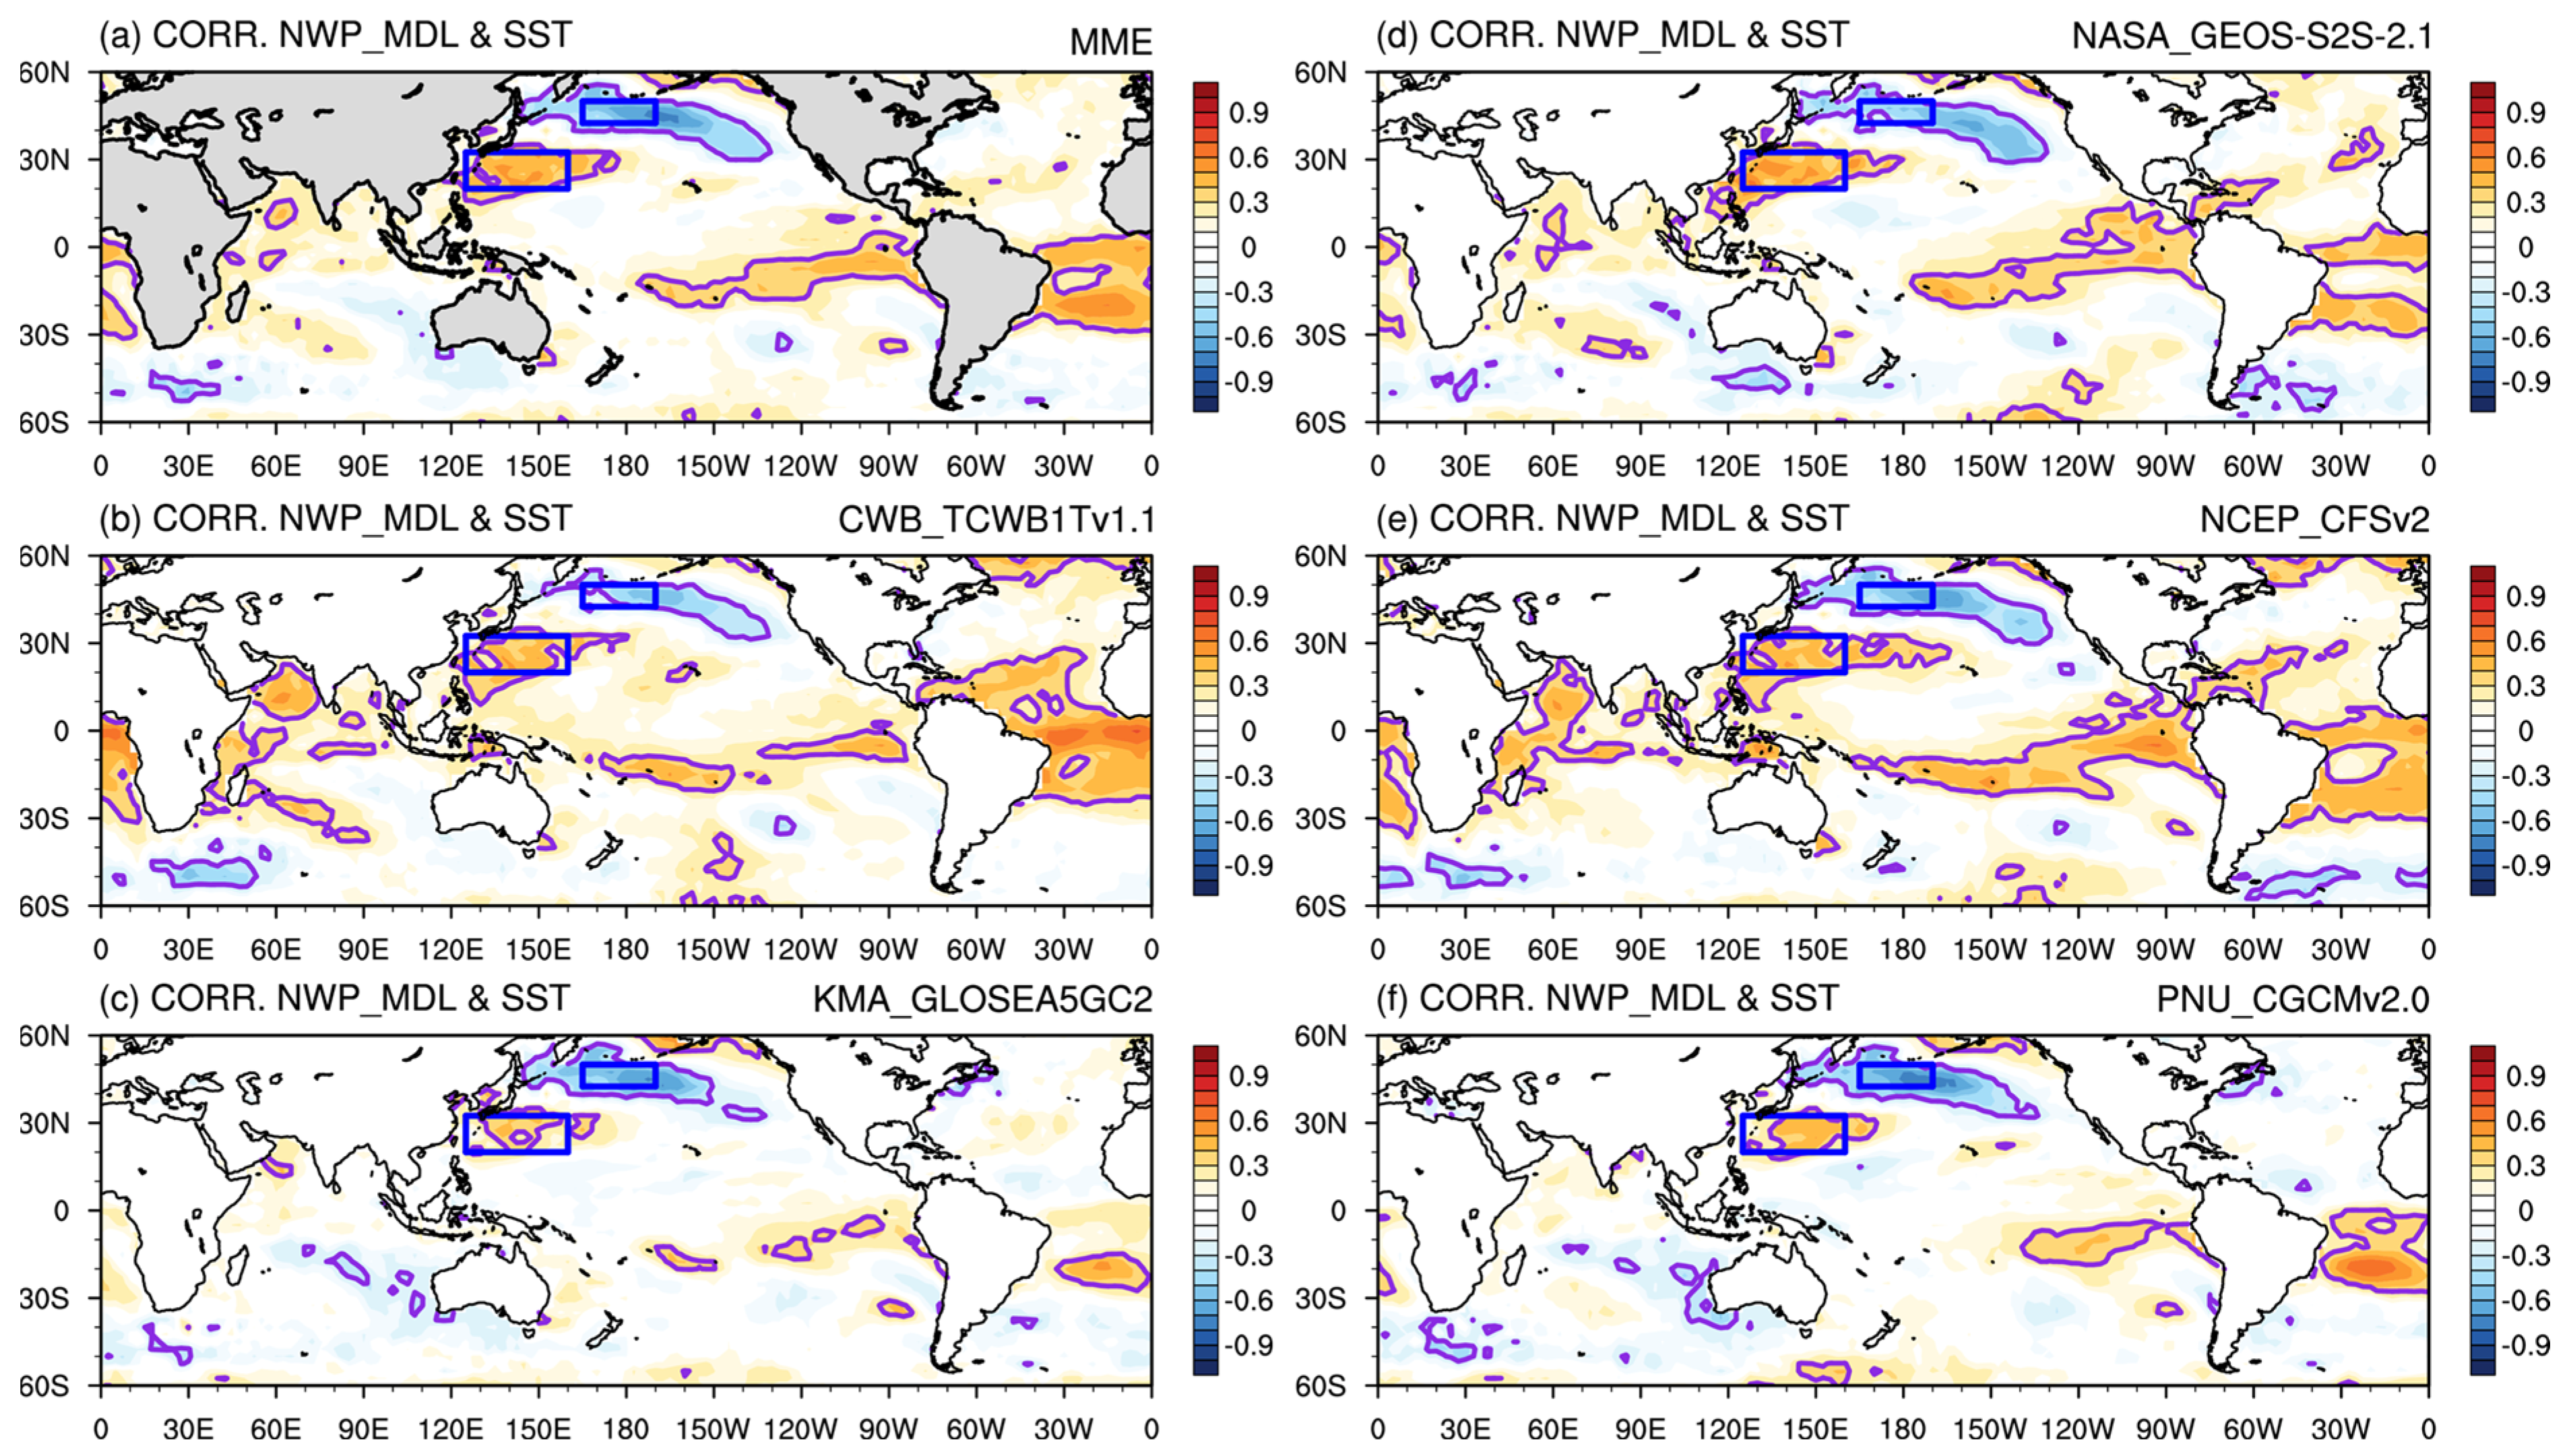
3.3. The Role of the NWP
4. Conclusions
Supplementary Materials
Author Contributions
Funding
Data Availability Statement
Acknowledgments
Conflicts of Interest
References
- Barnston, A.G.; Livezey, R.E. Classification, seasonality and persistence of low-frequency atmospheric circulation patterns. Mon. Weather Rev. 1987, 115, 1083–1126. [Google Scholar] [CrossRef]
- Mo, K.C.; Livezey, R.E. Tropical-extratropical geopotential height teleconnections during the Northern Hemisphere winter. Mon. Weather Rev. 1986, 114, 2488–2515. [Google Scholar] [CrossRef]
- Wallace, J.M.; Gutzler, D.S. Teleconnections in the geopotential height field during the Northern Hemisphere winter. Mon. Weather Rev. 1981, 109, 784–812. [Google Scholar] [CrossRef]
- Ma, X.; Zhang, Y. Interannual variability of the North Pacific winter storm track and its relationship with extratropical atmospheric circulation. Clim. Dyn. 2018, 51, 3685–3698. [Google Scholar] [CrossRef]
- Rivière, G. Role of Rossby wave breaking in the west Pacific teleconnection. Geophys. Res. Lett. 2010, 37, L11802. [Google Scholar] [CrossRef] [Green Version]
- Tanaka, S.; Nishii, K.; Nakamura, H. Vertical structure and energetics of the western Pacific teleconnection pattern. J. Clim. 2016, 29, 6597–6616. [Google Scholar] [CrossRef]
- Wettstein, J.J.; Wallace, J.M. Observed patterns of month-to-month storm-track variability and their relationship to the background flow. J. Atmos. Sci. 2010, 67, 1420–1437. [Google Scholar] [CrossRef]
- Yuan, J.; Tan, B.; Feldstein, S.B.; Lee, S. Wintertime North Pacific teleconnection patterns: Seasonal and interannual variability. J. Clim. 2015, 28, 8247–8263. [Google Scholar] [CrossRef] [Green Version]
- Dai, Y.; Tan, B. The western Pacific pattern precursor of major stratospheric sudden warmings and the ENSO modulation. Environ. Res. Lett. 2016, 11, 124032. [Google Scholar] [CrossRef]
- Kodera, K. Consideration of the origin of the different midlatitude atmospheric responses among El Niño events. J. Meteorol. Soc. Jpn. 1998, 76, 347–361. [Google Scholar] [CrossRef]
- Garfinkel, C.I.; Butler, A.H.; Waugh, D.W.; Hurwitz, M.M.; Polvani, L.M. Why might stratospheric sudden warmings occur with similar frequency in El Niño and La Niña winters? J. Geophys. Res. Atmos. 2012, 117, D19106. [Google Scholar] [CrossRef] [Green Version]
- Garfinkel, C.I.; Hartmann, D.L.; Sassi, F. Tropospheric precursors of anomalous Northern Hemisphere stratospheric polar vortices. J. Clim. 2010, 23, 3282–3299. [Google Scholar] [CrossRef]
- Lim, Y.K.; Kim, H.D. Impact of the dominant large-scale teleconnections on winter temperature variability over East Asia. J. Geophys. Res. Atmos. 2013, 118, 7835–7848. [Google Scholar] [CrossRef] [Green Version]
- Baxter, S.; Nigam, S. Key role of the North Pacific Oscillation–west Pacific pattern in generating the extreme 2013/14 North American winter. J. Clim. 2015, 28, 8109–8117. [Google Scholar] [CrossRef] [Green Version]
- Cheung, H.H.; Zhou, W.; Lee, S.M.; Tong, H.W. Interannual and interdecadal variability of the number of cold days in Hong Kong and their relationship with large-scale circulation. Mon. Weather Rev. 2015, 143, 1438–1454. [Google Scholar] [CrossRef]
- Kim, G.; Ahn, J.B.; Kryjov, V.N.; Lee, W.S.; Kim, D.J.; Kumar, A. Assessment of MME methods for seasonal prediction using WMO LC-LRFMME hindcast dataset. Int. J. Climatol. 2021, 41, E2462–E2481. [Google Scholar] [CrossRef]
- Lee, J.; Lee, M.I.; Ahn, J.B. Importance of ocean initial conditions of late autumn on winter seasonal prediction skill in atmosphere–land–ocean–sea ice coupled forecast system. Clim. Dyn. 2022, 58, 3427–3440. [Google Scholar] [CrossRef]
- Buontempo, C.; Burgess, S.N.; Dee, D.; Pinty, B.; Thépaut, J.N.; Rixen, M.; Almond, S.; Armstrong, D.; Brookshaw, A.; Alos, A.L.; et al. The Copernicus Climate Change Service: Climate Science in Action. Bull. Amer. Meteor. 2022. [Google Scholar] [CrossRef]
- Graham, R.J.; Yun, W.T.; Kim, J.; Kumar, A.; Jones, D.; Bettio, L.; Gagnon, N.; Kolli, R.K.; Smith, D. Long-range forecasting and the Global Framework for Climate Services. Clim. Res. 2011, 47, 47–55. [Google Scholar] [CrossRef]
- Kirtman, B.P.; Min, D.; Infanti, J.M.; Kinter, J.L.; Paolino, D.A.; Zhang, Q.; Dool, H.; Saha, S.; Mendez, M.P.; Becker, E.; et al. The North American Multimodel Ensemble: Phase-1 Seasonal-to-Interannual Prediction; Phase-2 toward Developing Intraseasonal Prediction. Bull. Am. Meteorol. Soc. 2014, 95, 585–601. [Google Scholar] [CrossRef] [Green Version]
- Min, Y.M.; Kryjov, V.N.; Oh, S.M.; Lee, H.J. Skill of real-time operational forecasts with the APCC multi-model ensemble prediction system during the period 2008–2015. Clim. Dyn. 2017, 49, 4141–4156. [Google Scholar] [CrossRef]
- Jeong, H.I.; Ahn, J.B.; Lee, J.Y.; Alessandri, A.; Hendon, H.H. Interdecadal change of interannual variability and predictability of two types of ENSO. Clim. Dyn. 2015, 44, 1073–1091. [Google Scholar] [CrossRef]
- Jeong, H.I.; Lee, D.Y.; Ashok, K.; Ahn, J.B.; Lee, J.Y.; Luo, J.J.; Schemm, J.-K.E.; Hendon, H.H.; Braganza, K.; Ham, Y.G. Assessment of the APCC coupled MME suite in predicting the distinctive climate impacts of two flavors of ENSO during boreal winter. Clim. Dyn. 2012, 39, 475–493. [Google Scholar] [CrossRef] [Green Version]
- Sohn, S.J.; Tam, C.Y.; Ashok, K.; Ahn, J.B. Quantifying the reliability of precipitation datasets for monitoring large-scale East Asian precipitation variations. Int. J. Climatol. 2012, 32, 1520–1526. [Google Scholar] [CrossRef]
- Domeisen, D.I.; Badin, G.; Koszalka, I.M. How predictable are the Arctic and North Atlantic Oscillations? Exploring the variability and predictability of the Northern Hemisphere. J. Clim. 2018, 31, 997–1014. [Google Scholar] [CrossRef]
- Kang, D.; Lee, M.I.; Im, J.; Kim, D.; Kim, H.M.; Kang, H.S.; Schubert, S.D.; Arribas, A.; MacLachlan, C. Prediction of the Arctic Oscillation in boreal winter by dynamical seasonal forecasting systems. Geophys. Res. Lett. 2014, 41, 3577–3585. [Google Scholar] [CrossRef] [Green Version]
- Kim, H.J.; Ahn, J.B. Improvement in prediction of the Arctic Oscillation with a realistic ocean initial condition in a CGCM. J. Clim. 2015, 28, 8951–8967. [Google Scholar] [CrossRef]
- Sun, J.; Ahn, J.B. Dynamical seasonal predictability of the Arctic Oscillation using a CGCM. Int. J. Climatol. 2015, 35, 1342–1353. [Google Scholar] [CrossRef]
- Scaife, A.A.; Arribas, A.; Blockley, E.; Brookshaw, A.; Clark, R.T.; Dunstone, N.; Eade, R.; Fereday, D.; Folland, C.K.; Gordon, M.; et al. Skillful long-range prediction of European and North American winters. Geophys. Res. Lett. 2014, 41, 2514–2519. [Google Scholar] [CrossRef] [Green Version]
- Lee, Y.Y.; Oh, J.H. West Pacific teleconnection pattern in dynamical seasonal predictions: How is it connected to the Atlantic atmospheric mean bias? Clim. Dyn. 2020, 54, 3671–3683. [Google Scholar] [CrossRef]
- Paek, H.; Yu, J.Y.; Hwu, J.W.; Lu, M.M.; Gao, T. A source of AGCM bias in simulating the western Pacific subtropical high: Different sensitivities to the two types of ENSO. Mon. Weather Rev. 2015, 143, 2348–2362. [Google Scholar] [CrossRef] [Green Version]
- MacLachlan, C.; Arribas, A.; Peterson, K.A.; Maidens, A.; Fereday, D.; Scaife, A.A.; Gordon, M.; Vellinga, M.; Williams, A.; Comer, R.E.; et al. Global Seasonal forecast system version 5 (GloSea5): A high-resolution seasonal forecast system. Q. J. R. Meteorol. Soc. 2015, 141, 1072–1084. [Google Scholar] [CrossRef]
- Borovikov, A.; Cullather, R.; Kovach, R.; Marshak, J.; Vernieres, G.; Vikhliaev, Y.; Zhao, B.; Li, Z. GEOS-5 seasonal forecast system. Clim. Dyn. 2019, 53, 7335–7361. [Google Scholar] [CrossRef]
- Saha, S.; Moorthi, S.; Pan, H.L.; Wu, X.; Wang, J.; Nadiga, S.; Tripp, P.; Kistler, R.; Woollen, J.; Behringer, D.; et al. The NCEP climate forecast system reanalysis. Bull. Am. Meteorol. Soc. 2010, 91, 1015–1058. [Google Scholar] [CrossRef] [Green Version]
- Ahn, J.B.; Kim, H.J. Improvement of 1-month lead predictability of the wintertime AO using a realistically varying solar constant for a CGCM. Meteorol. Appl. 2014, 21, 415–418. [Google Scholar] [CrossRef]
- Hersbach, H.; Bell, B.; Berrisford, P.; Hirahara, S.; Horányi, A.; Muñoz-Sabater, J.; Nicolas, J.; Peubey, C.; Radu, R.; Schepers, D.; et al. The ERA5 global reanalysis. Q. J. R. Meteorol. Soc. 2020, 146, 1999–2049. [Google Scholar] [CrossRef]
- Reynolds, R.W.; Rayner, N.A.; Smith, T.M.; Stokes, D.C.; Wang, W. An improved in situ and satellite SST analysis for climate. J. Clim. 2002, 15, 1609–1625. [Google Scholar] [CrossRef]
- Wilks, D.S. Statistical Methods in the Atmospheric Sciences, 2nd ed.; Elsevier Academic Press: San Diego, CA, USA, 1995; p. 467. [Google Scholar]
- Leung, M.Y.T.; Zhou, W. Variation of circulation and East Asian climate associated with anomalous strength and displacement of the East Asian trough. Clim Dyn. 2015, 45, 2713–2732. [Google Scholar] [CrossRef]
- Nishii, K.; Nakamura, H.; Orsolini, Y.J. Cooling of the wintertime Arctic stratosphere induced by the western Pacific teleconnection pattern. Geophys. Res. Lett. 2010, 37, L13805. [Google Scholar] [CrossRef]
- Feddersen, H.; Navarra, A.; Ward, M.N. Reduction of model systematic error by statistical correction for dynamical seasonal predictions. J. Clim. 1999, 12, 1974–1989. [Google Scholar] [CrossRef]
- Kang, I.S.; Shukla, J. Dynamic seasonal prediction and predictability of the monsoon. In The Asian Monsoon; Wang, B., Ed.; Springer: Berlin/Heidelberg, Germany, 2006; pp. 585–612. [Google Scholar]
- Hagedorn, R.; Doblas-Reyes, F.J.; Palmer, T.N. The rationale behind the success of multi-model ensembles in seasonal forecasting—I. Basic concept. Tellus A Dyn. Meteorol. Oceanogr. 2005, 57, 219–233. [Google Scholar] [CrossRef]
- Dai, Y.; Tan, B. Two types of the western Pacific pattern, their climate impacts, and the ENSO modulations. J. Clim. 2019, 32, 823–841. [Google Scholar] [CrossRef]
- Saji, N.H.; Goswami, B.N.; Vinayachandran, P.N.; Yamagata, T. A dipole mode in the tropical Indian Ocean. Nature 1999, 401, 360–363. [Google Scholar] [CrossRef] [PubMed]
- Hurwitz, M.M.; Newman, P.A.; Garfinkel, C.I. On the influence of North Pacific sea surface temperature on the Arctic winter climate. J. Geophys. Res. Atmos. 2012, 117, D19110. [Google Scholar] [CrossRef]
- Nigam, S. Teleconnections. In Encyclopedia of Atmospheric Sciences; Holton, J.R., Pyle, J.A., Curry, J.A., Eds.; Academic Press: London, UK, 2003; pp. 2243–2269. [Google Scholar]
- North, G.R.; Bell, T.L.; Cahalan, R.F.; Moeng, F.J. Sampling errors in the estimation of empirical orthogonal functions. Mon. Weather Rev. 1982, 110, 699–706. [Google Scholar] [CrossRef]
- Park, H.J.; Kryjov, V.N.; Ahn, J.B. One-month-lead predictability of Asian summer monsoon indices based on the zonal winds by the APCC multimodel ensemble. J. Clim. 2018, 31, 8945–8960. [Google Scholar] [CrossRef]
- Lu, B.; Ren, H.L.; Scaife, A.A.; Wu, J.; Dunstone, N.; Smith, D.; Wan, J.; Eade, R.; MacLachlan, C.; Gordon, M. An extreme negative Indian Ocean Dipole event in 2016: Dynamics and predictability. Clim. Dyn. 2018, 51, 89–100. [Google Scholar] [CrossRef]
- Scaife, A.A.; Smith, D. A signal-to-noise paradox in climate science. Npj Clim. Atmos. Sci. 2018, 1, 1–8. [Google Scholar] [CrossRef]


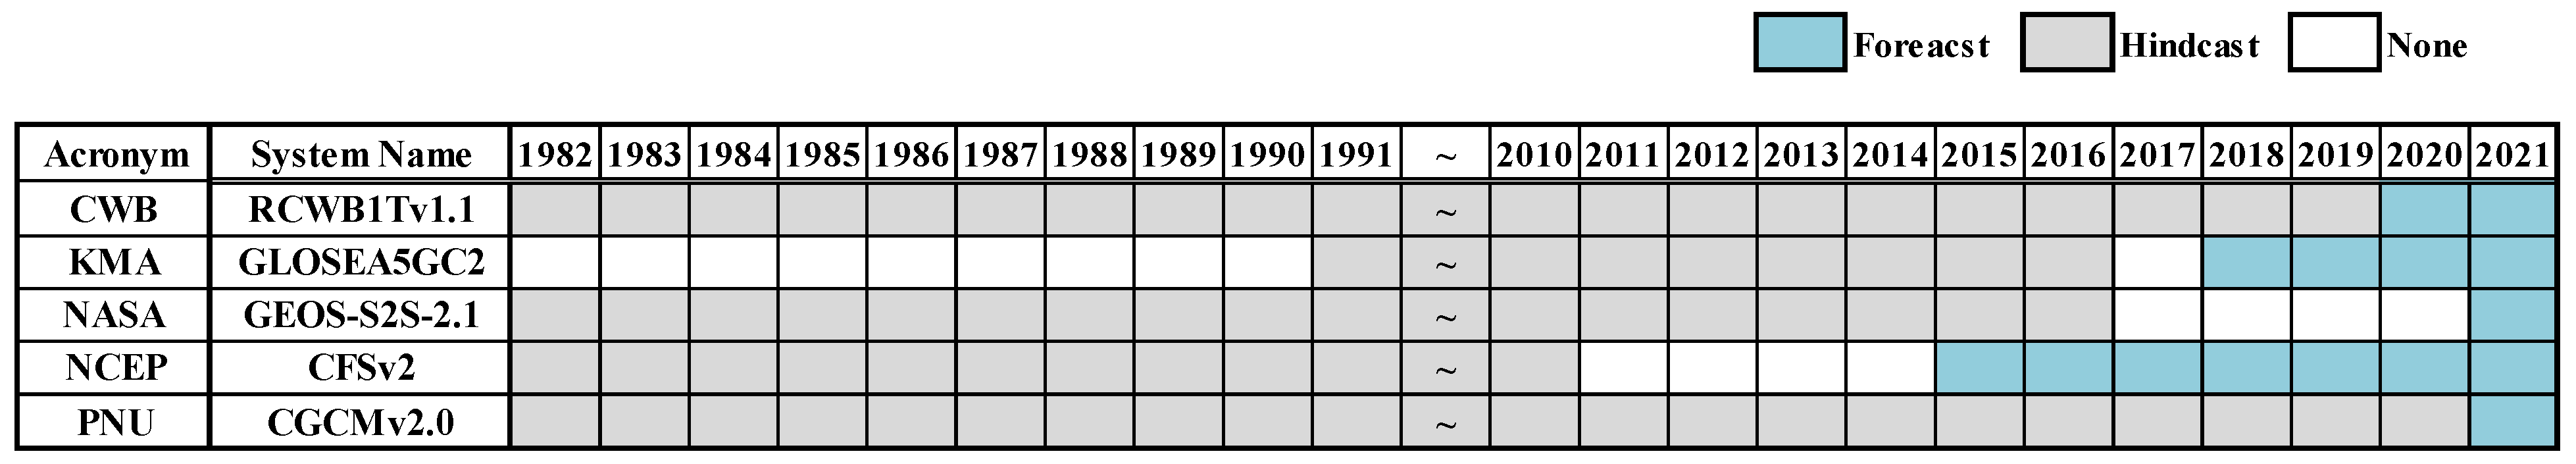
| System Name | Organization/ Country | AGCM/ Resolution | OGCM/ Resolution | Arrangement of Members (Hindcast/Forecast) | No. of | Reference |
|---|---|---|---|---|---|---|
| Taiwan Central Weather Bureau 1 Tier model version 1.1 (TCWB1Tv1.1) | Central Weather Bureau (CWB)/ Chinese Taipei | GFS/ T119L40 | MOM3/ 1° × 1° | 30 days before the 15th of each month | 30 | Paek et al. [31] |
| Global Seasonal Forecasting System version 5 Global Coupled configuration 2 (GloSea5GC2) | Korea Meteorological Administration (KMA)/ South Korea | UM8.6/ N216L85 | NEMO3.4/ N216L85 | Every day/1st, 9th, 17th, 25th of the month | 42/12 | MacLachlan et al. [32] |
| Goddard Earth Observing System Atmosphere-Ocean General Circulation Model and Data Assimilation System Version S2S-2_1 (GOES-S2S-2.1) | National Aeronautics and Space Administration (NASA)/ United States of America | MERRA-2/ 0.5° × 0.5° | MOM5/ 0.5° × 0.5° | Every 5 days of the month | 10/4 | Borovikov et al. [33] |
| Climate Forecast System Version 2 (CFSv2) | National Centers for Environmental Prediction (NCEP), National Weather Service (NWS), and National Oceanic and Atmospheric Administration (NOAA)/ United States of America | GFS/ T126L64 | MOM4/ 0.25° − 0.5° × 0.5°, L40 | Latest 5 days in previous month/Every 5 days of the month | 20 | Saha et al. [34] |
| Pusan National University Coupled General Circulation Model Version 2.0 (PNU CGCM v2.0) | Pusan National University (PNU)/South Korea | CCM3/ T42L18 | MOM3/ 2.8125°, L40 | Different 5 days of the month | 35 | Ahn and Kim [35] |
| Reference | Definition |
|---|---|
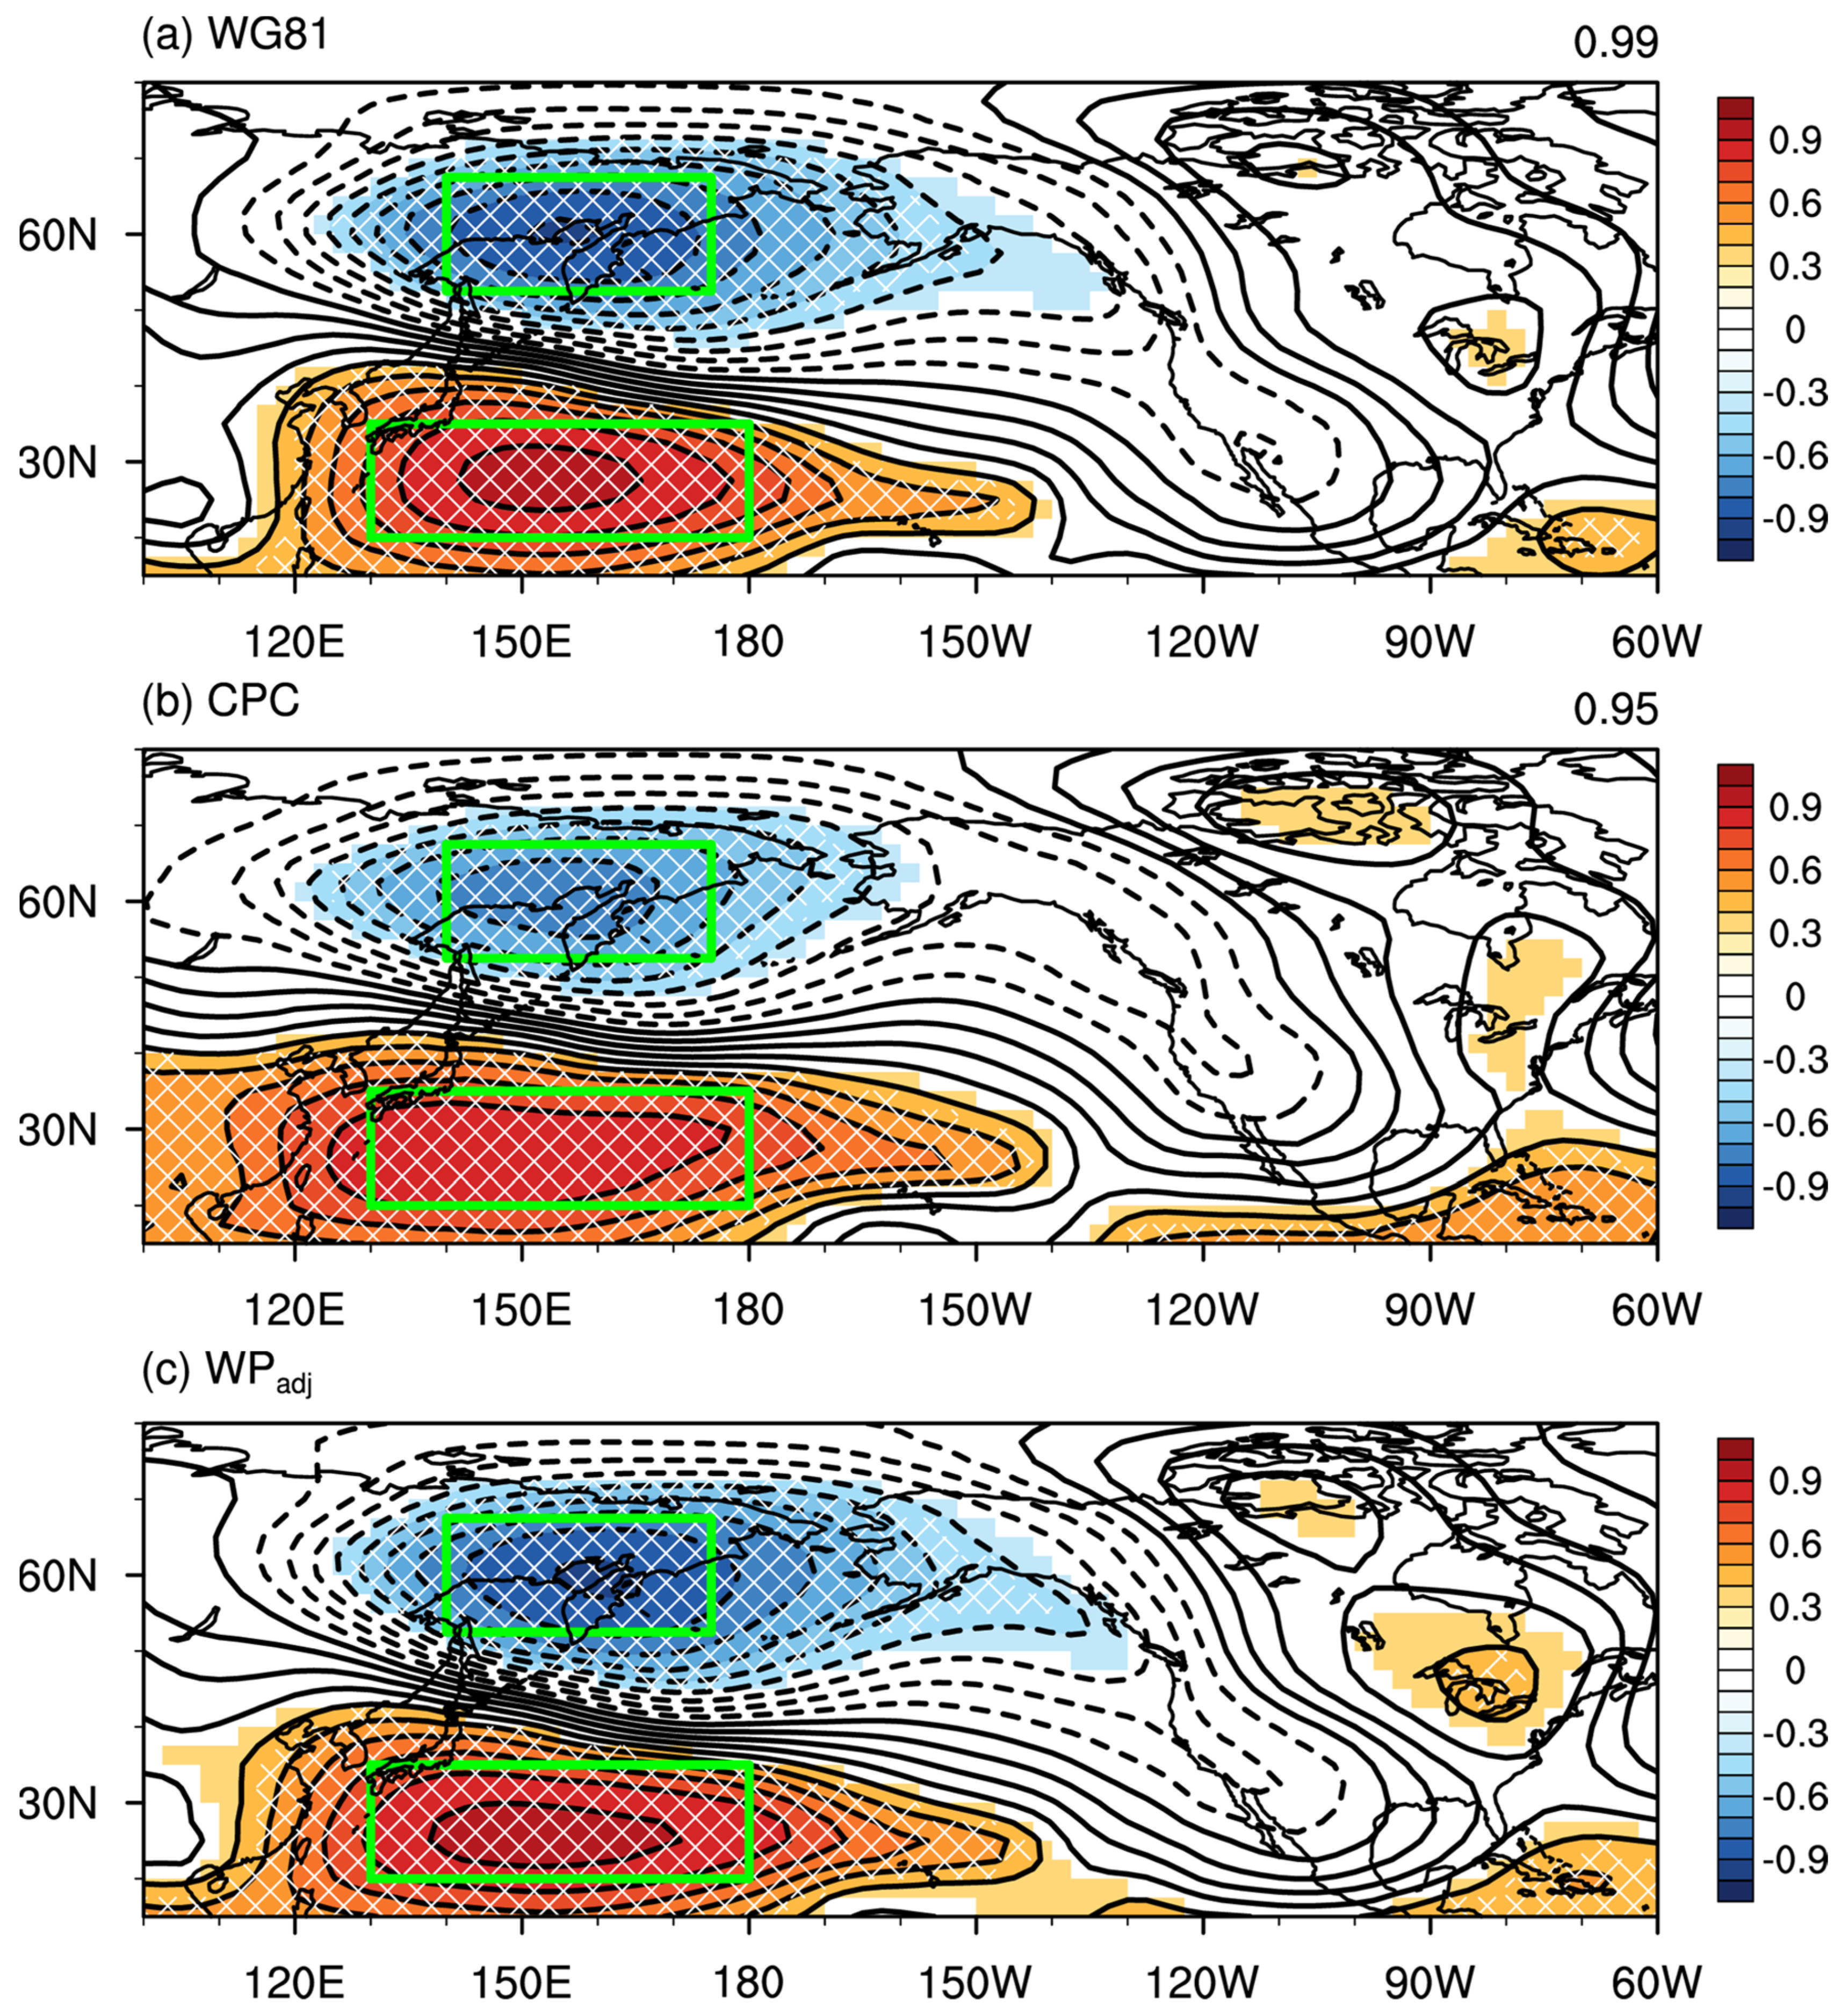
| Wallace and Gutzler ([3], WG81) | –(0.5 × [(Z*(60 °N, 155 °E)–Z*(30 °N, 155 °E)]) Z*: Normalized Z500 WG81 in this study has an opposite sign with the original WP index defined by WG81. |
| NOAA/CPC ([1], CPC) | PC Time series of RPCA of standardized Z500 anomalies over the extratropical Northern Hemisphere (20 °N–). |
| WP | WG81 | CPC | |
|---|---|---|---|
| WP | 1.00 | 0.97 | 0.89 |
| WG81 | 1.00 | 0.87 | |
| CPC | 1.00 |
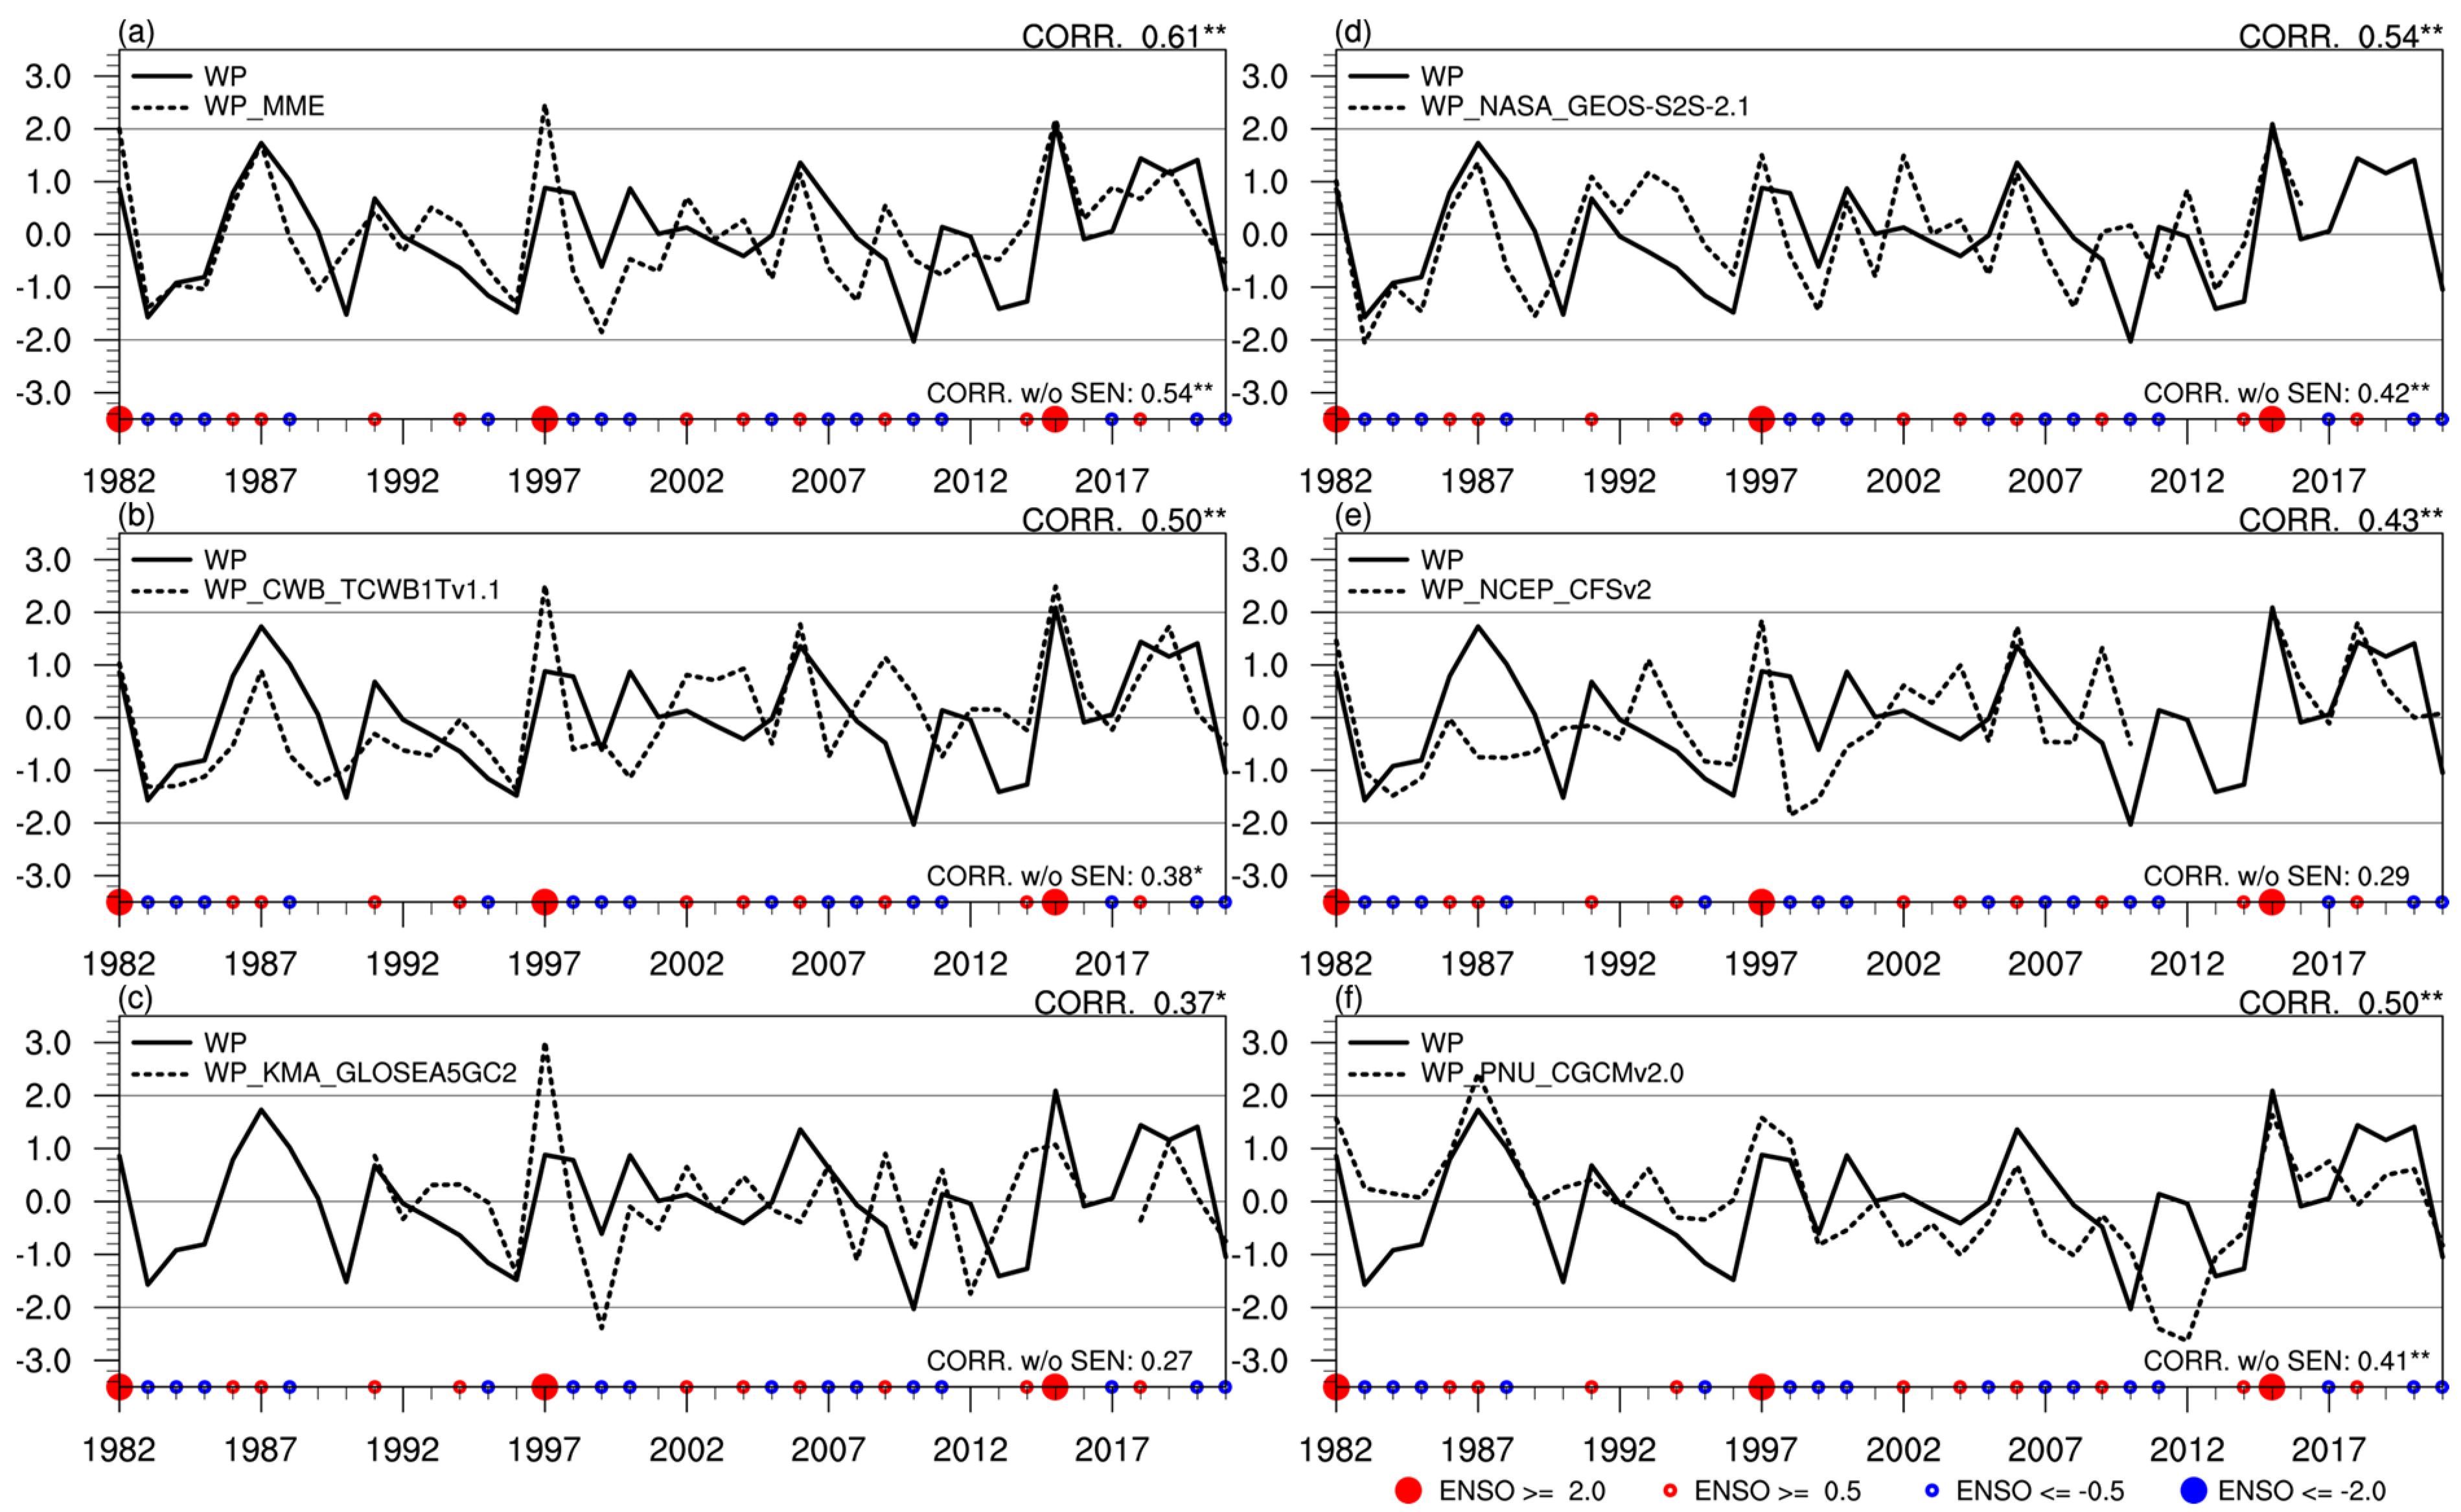
| WP & WP_MME | MME | CWB | KMA | NASA | NCEP | PNU |
|---|---|---|---|---|---|---|
| Correl. (w/o SEN) | 0.61 ** | 0.50 ** | 0.37 * | 0.54 ** | 0.43 ** | 0.50 ** |
| 0.54 ** | 0.38 * | 0.27 | 0.42 ** | 0.29 | 0.41 ** | |
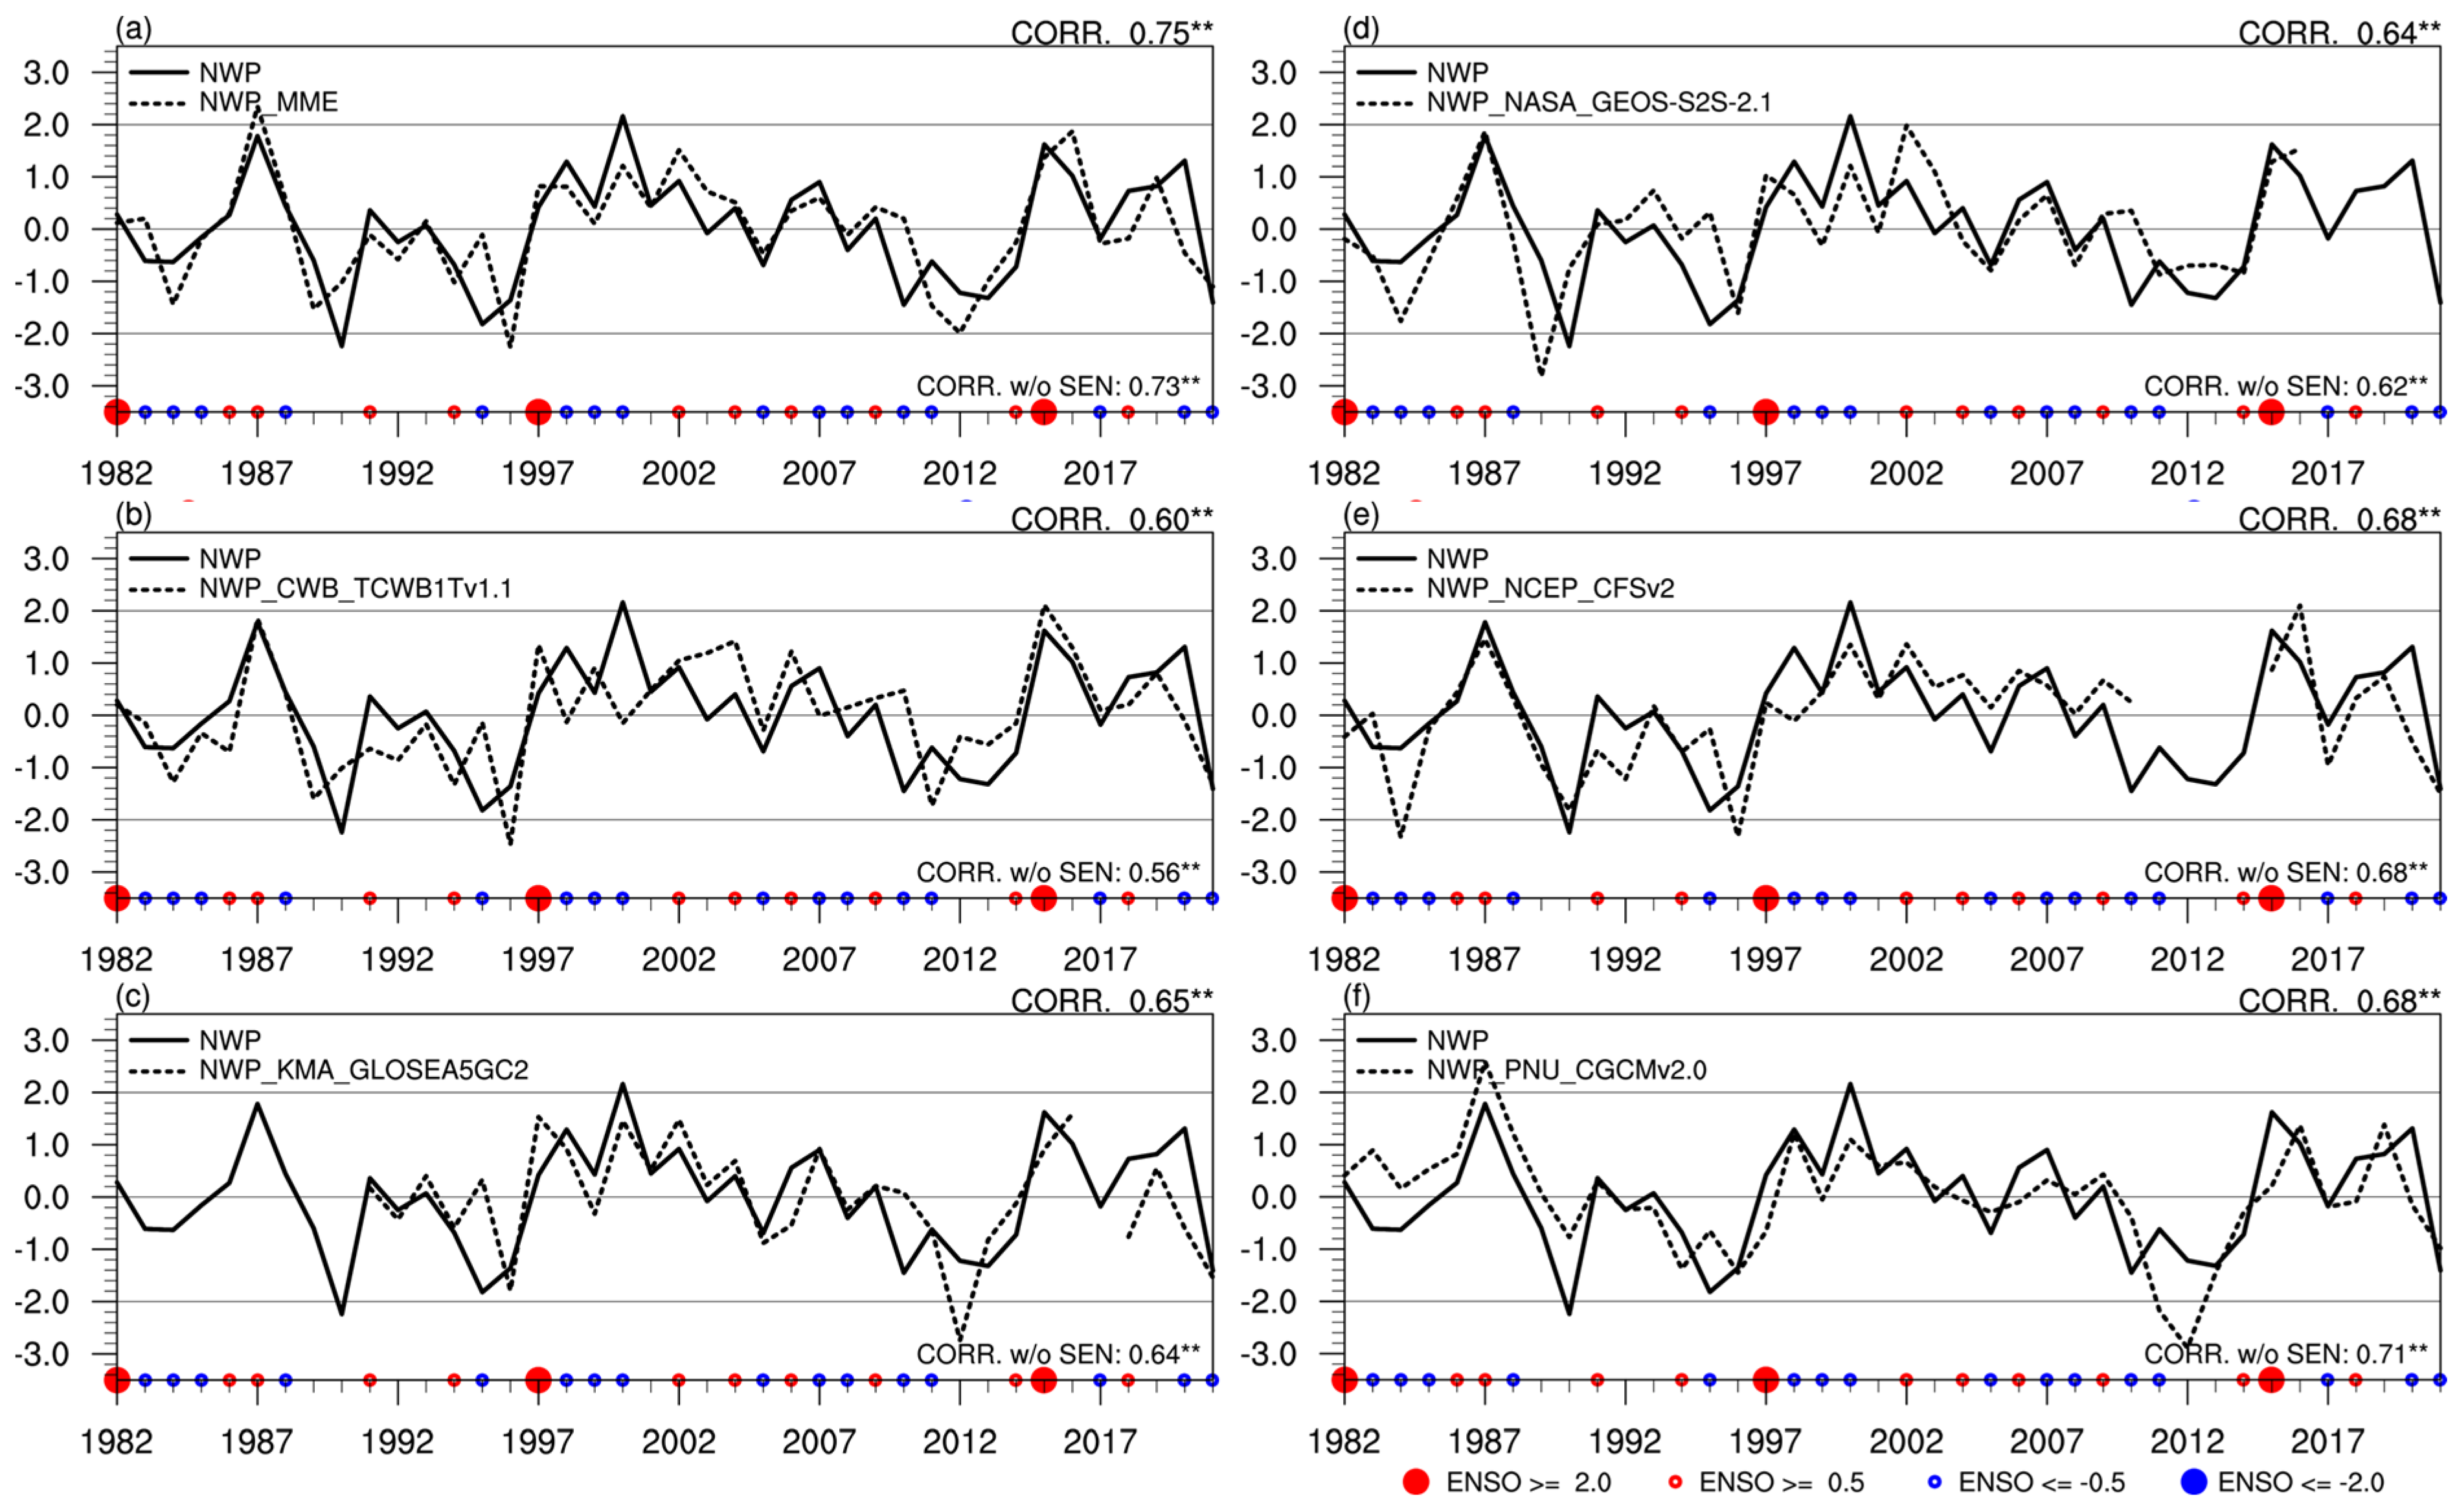
| NWP and NWP_MME | MME | CWB | KMA | NASA | NCEP | PNU |
| Correl. | 0.75 ** | 0.60 ** | 0.65 ** | 0.64 ** | 0.68 ** | 0.68 ** |
| (w/o SEN) | 0.73 ** | 0.56 ** | 0.64 ** | 0.62 ** | 0.68 ** | 0.71 ** |
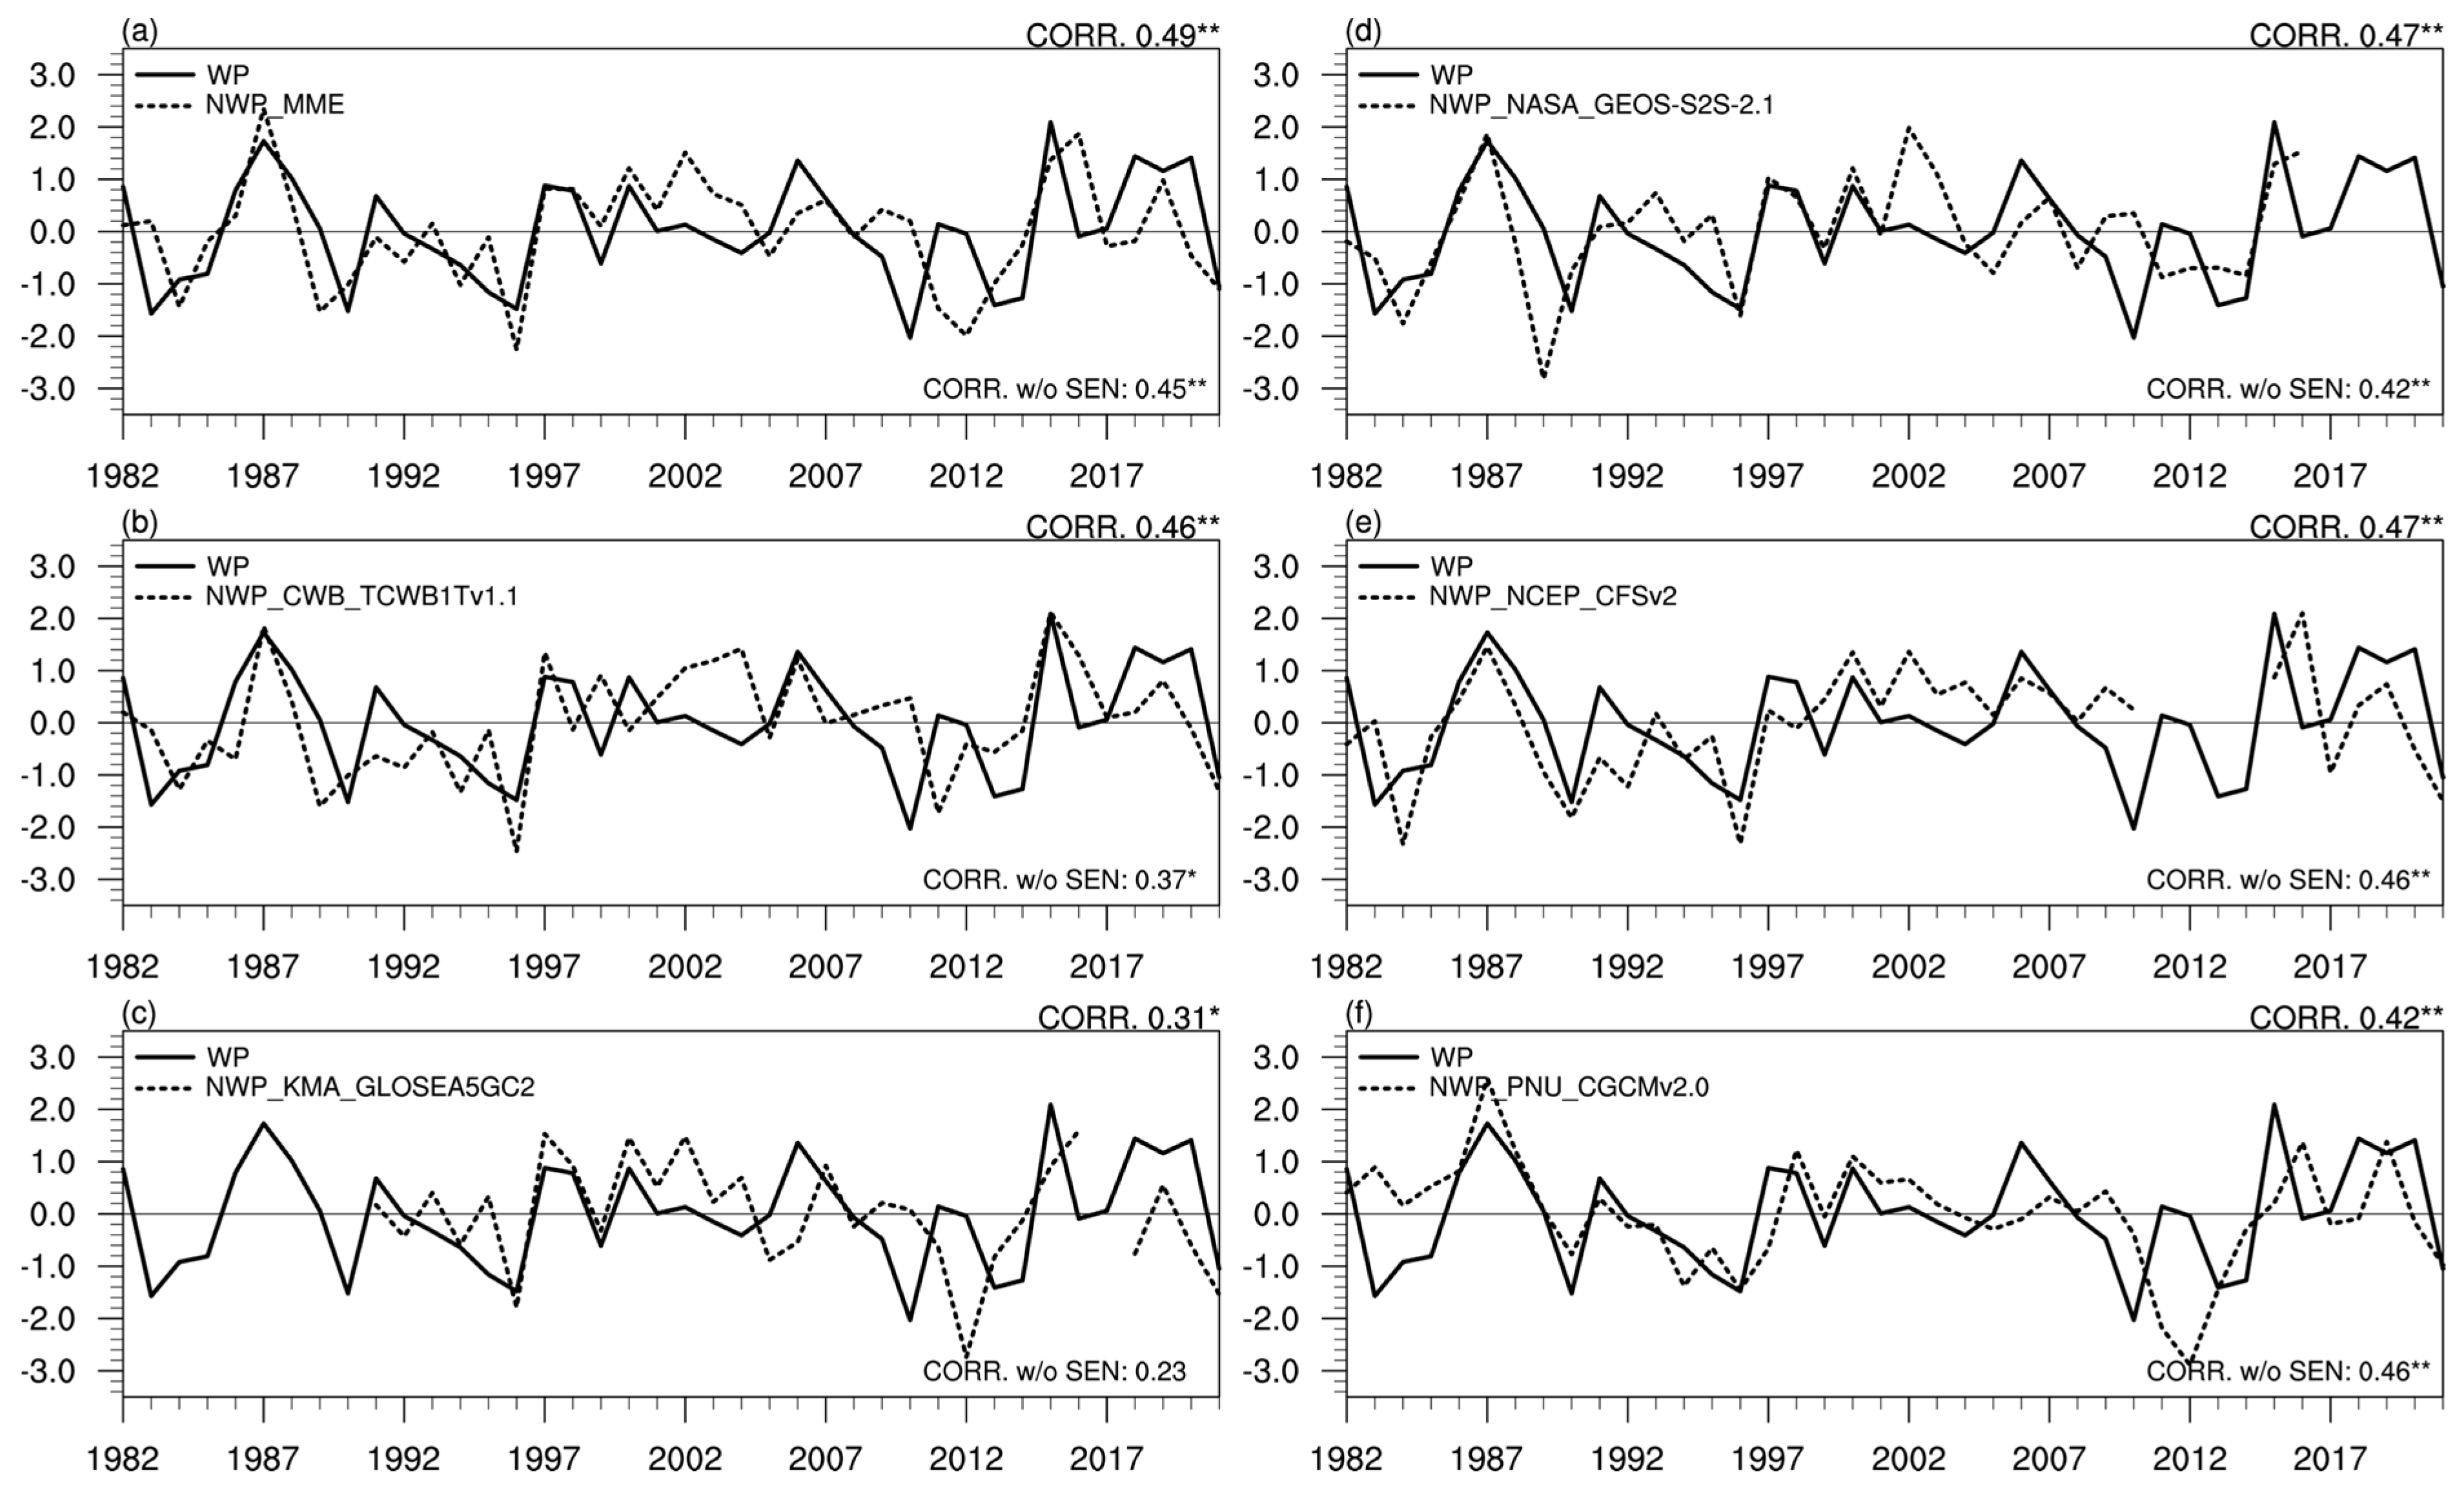
| WP and NWP_MME | MME | CWB | KMA | NASA | NCEP | PNU |
| Correl. | 0.49 ** | 0.46 ** | 0.31 * | 0.47 ** | 0.47 ** | 0.42 ** |
| (w/o SEN) | 0.45 ** | 0.37 * | 0.23 | 0.42 ** | 0.46 ** | 0.46 ** |
Publisher’s Note: MDPI stays neutral with regard to jurisdictional claims in published maps and institutional affiliations. |
© 2022 by the authors. Licensee MDPI, Basel, Switzerland. This article is an open access article distributed under the terms and conditions of the Creative Commons Attribution (CC BY) license (https://creativecommons.org/licenses/by/4.0/).
Share and Cite
Kim, E.-S.; Kryjov, V.N.; Ahn, J.-B. Predictability of the Wintertime Western Pacific Pattern in the APEC Climate Center Multi-Model Ensemble. Atmosphere 2022, 13, 1772. https://doi.org/10.3390/atmos13111772
Kim E-S, Kryjov VN, Ahn J-B. Predictability of the Wintertime Western Pacific Pattern in the APEC Climate Center Multi-Model Ensemble. Atmosphere. 2022; 13(11):1772. https://doi.org/10.3390/atmos13111772
Chicago/Turabian StyleKim, Eung-Sup, Vladimir N. Kryjov, and Joong-Bae Ahn. 2022. "Predictability of the Wintertime Western Pacific Pattern in the APEC Climate Center Multi-Model Ensemble" Atmosphere 13, no. 11: 1772. https://doi.org/10.3390/atmos13111772