
Temporal and Spatial Distribution Characteristics of Drought and Its Influence on Vegetation Change in Xilin Gol, China
Abstract
:1. Introduction
2. Study Area and Methods
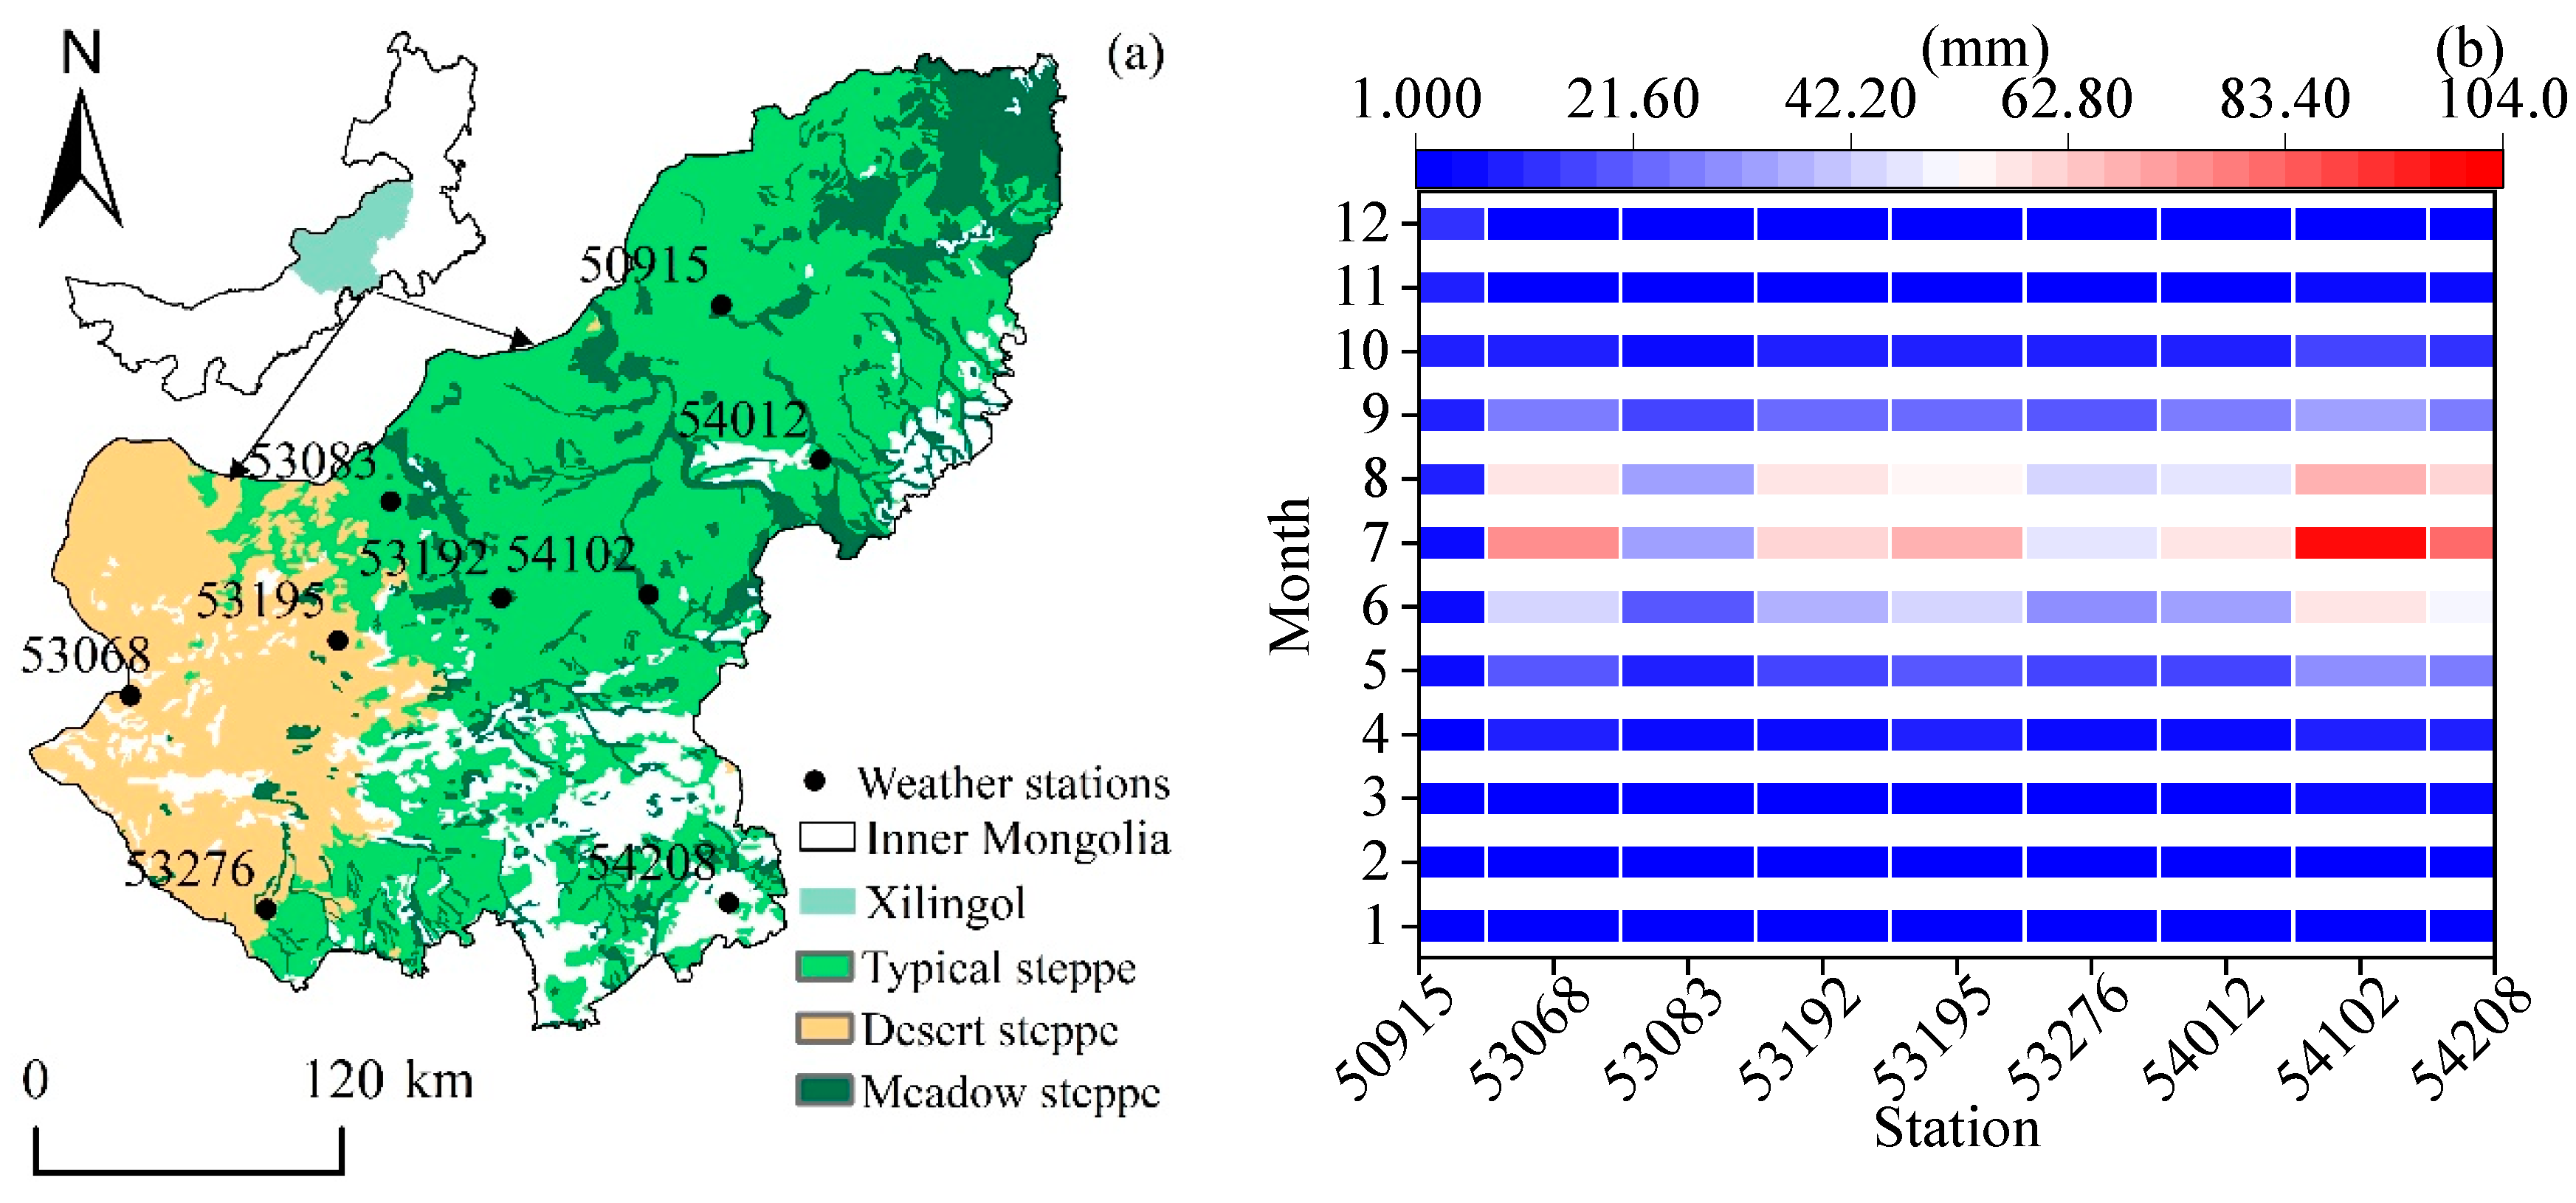
2.1. Study Area
2.2. Data Sources
2.3. Effective Drought Index
2.4. Quantitative Characterization of Drought
- (1)
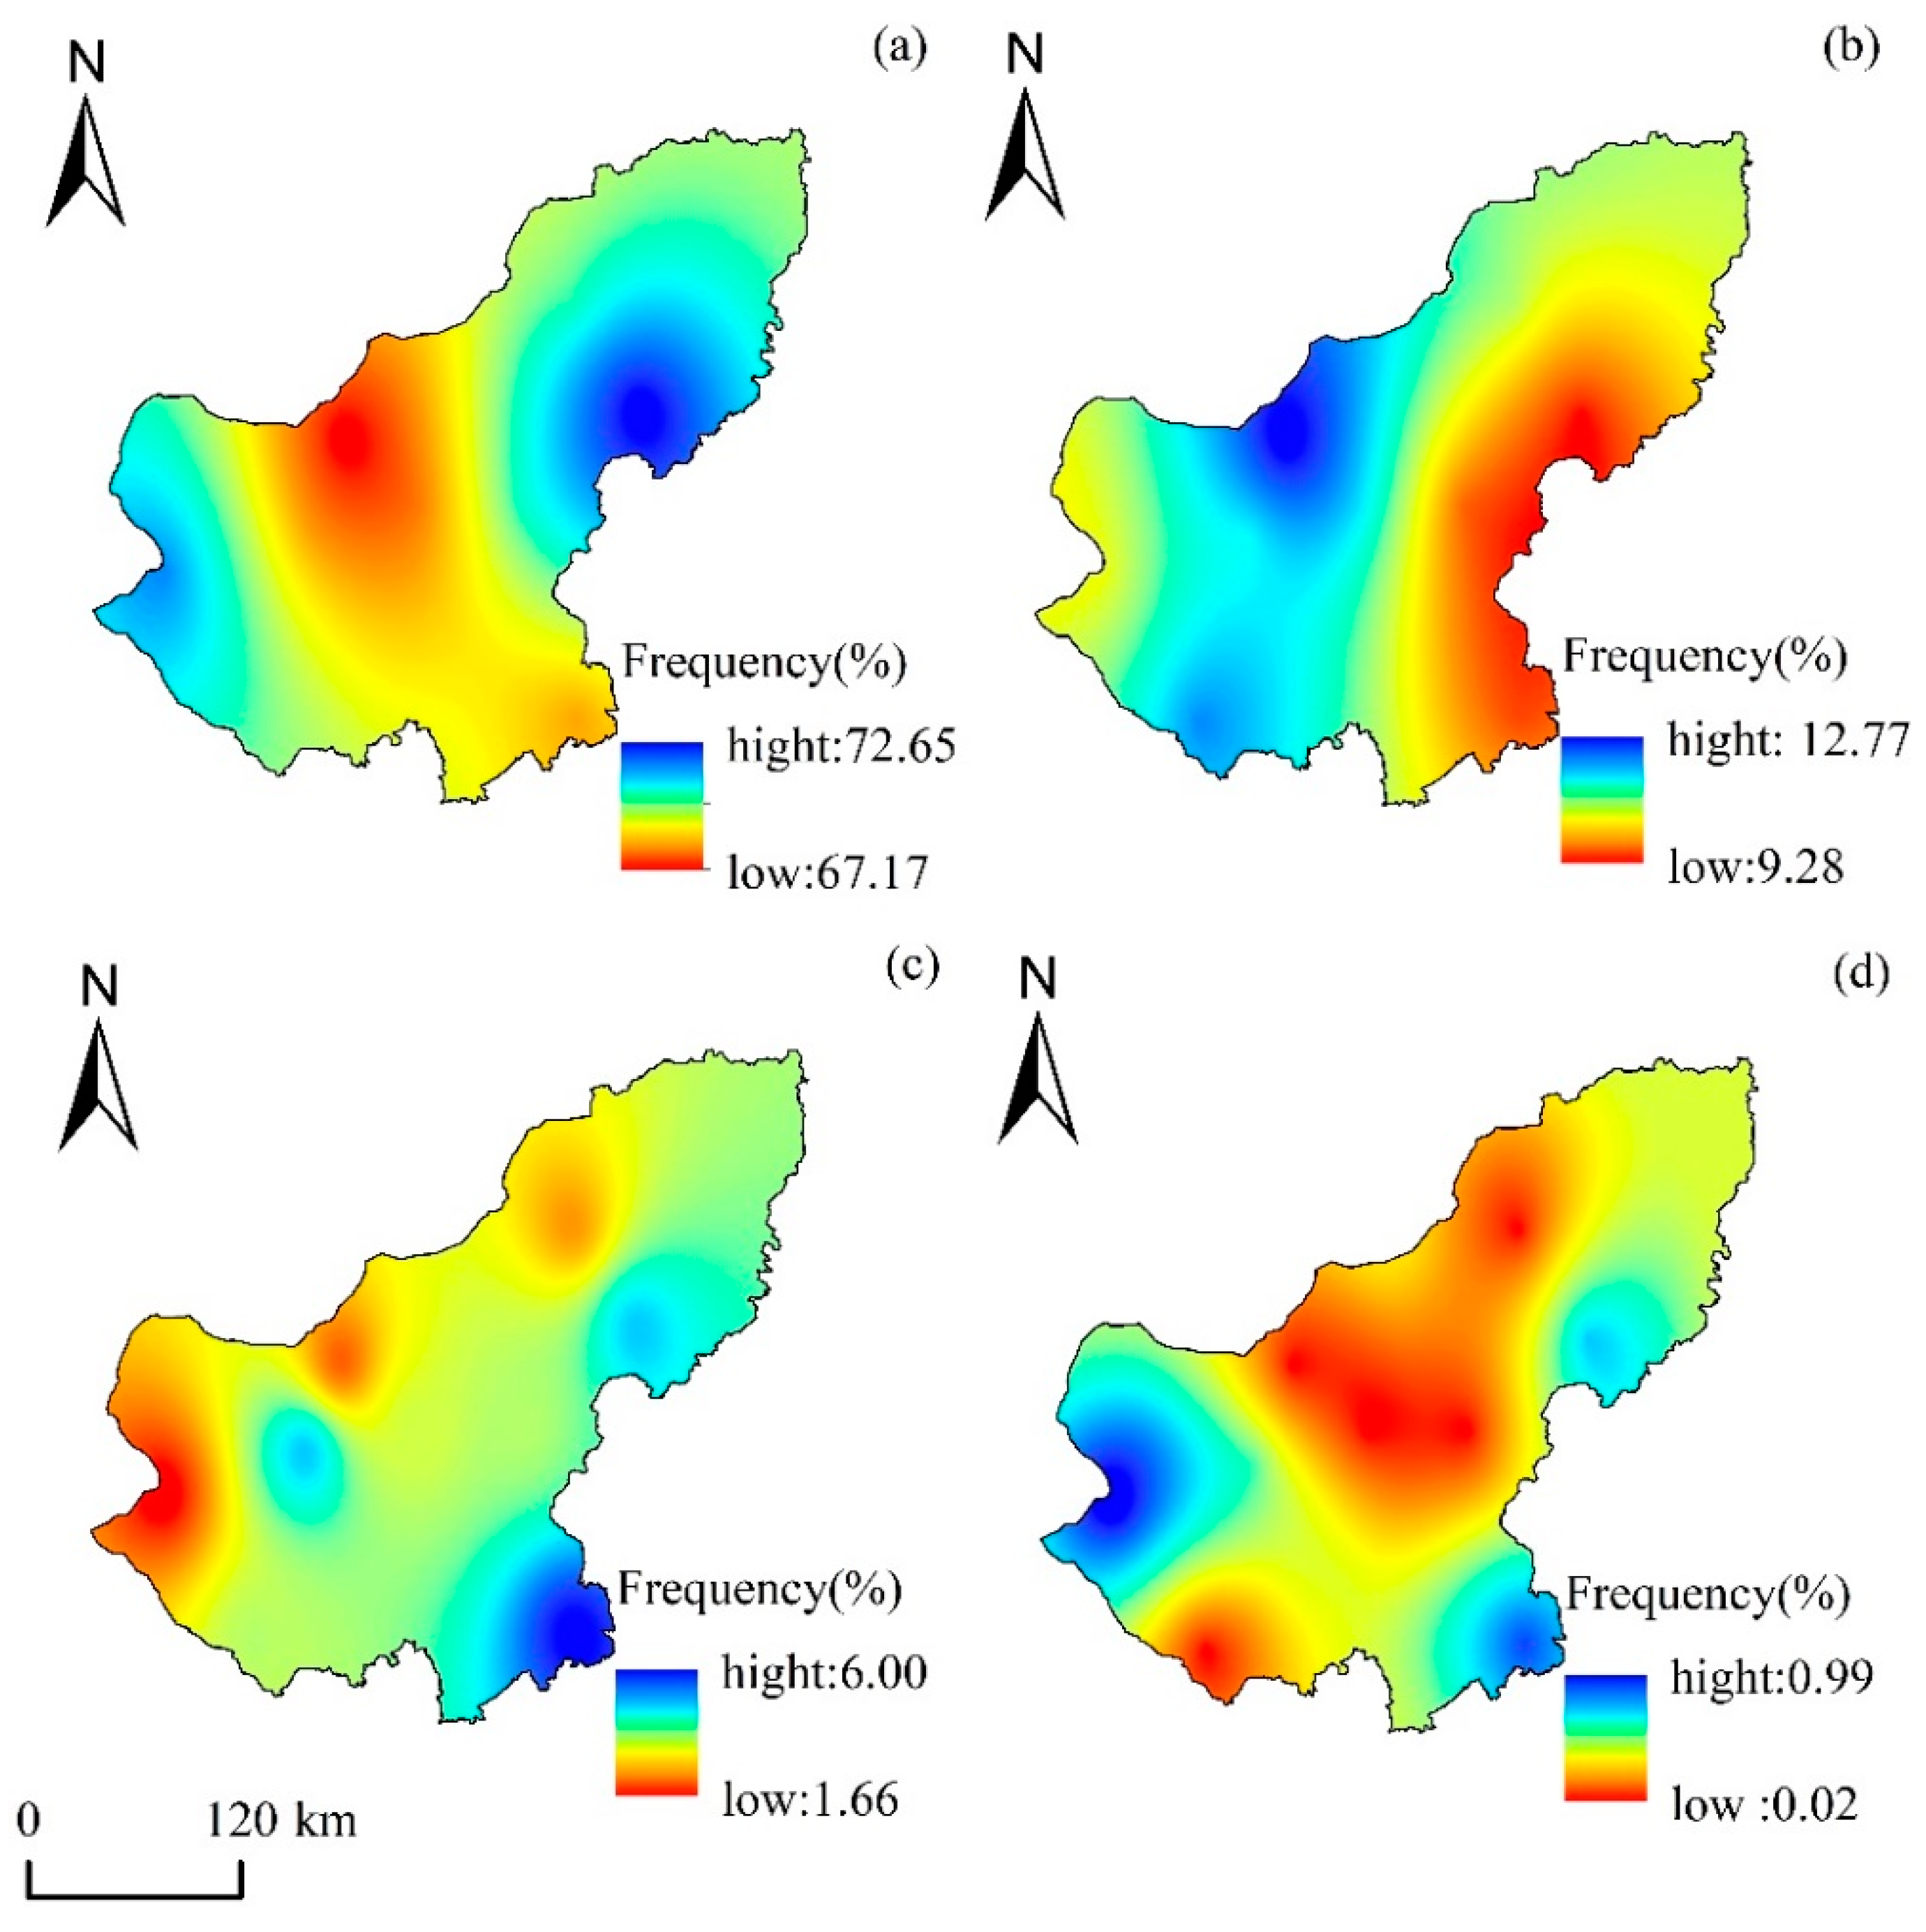
- Drought frequency
- (2)
- Drought intensity
2.5. Mann–Kendall Test
2.6. Empirical Orthogonal Function Decomposition
- (1)
- Select the data to be analyzed and preprocess the data.
- (2)
- Calculate the eigenvalues and eigenvectors of the matrix Cm×m.
- (3)
- Calculate the time coefficient matrix.
3. Results
3.1. Variation Characteristics of Meteorological Drought in Xilin Gol
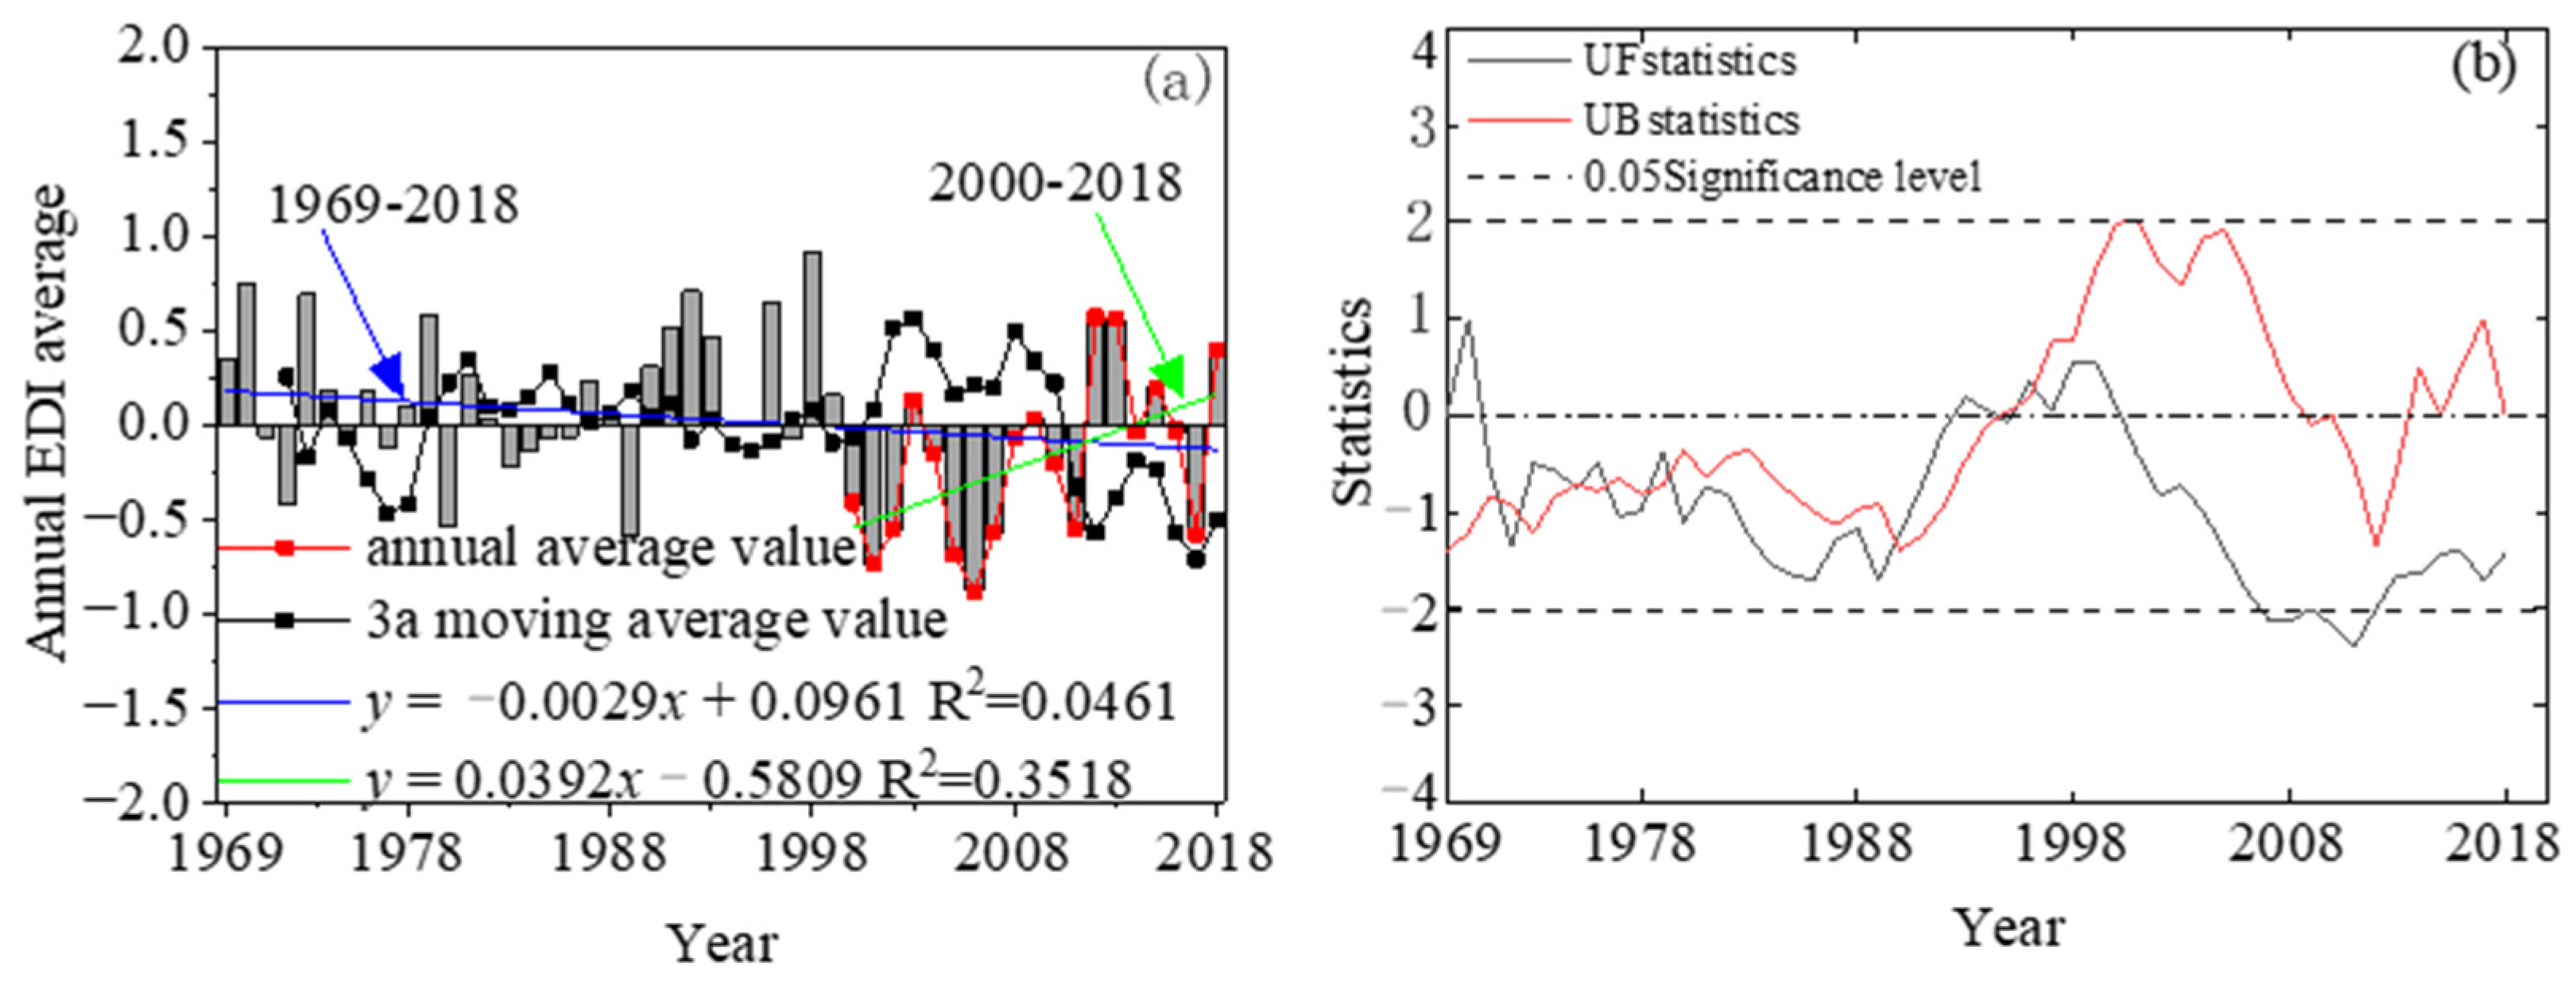
3.1.1. Interannual Variation and Mutation Detection of Drought
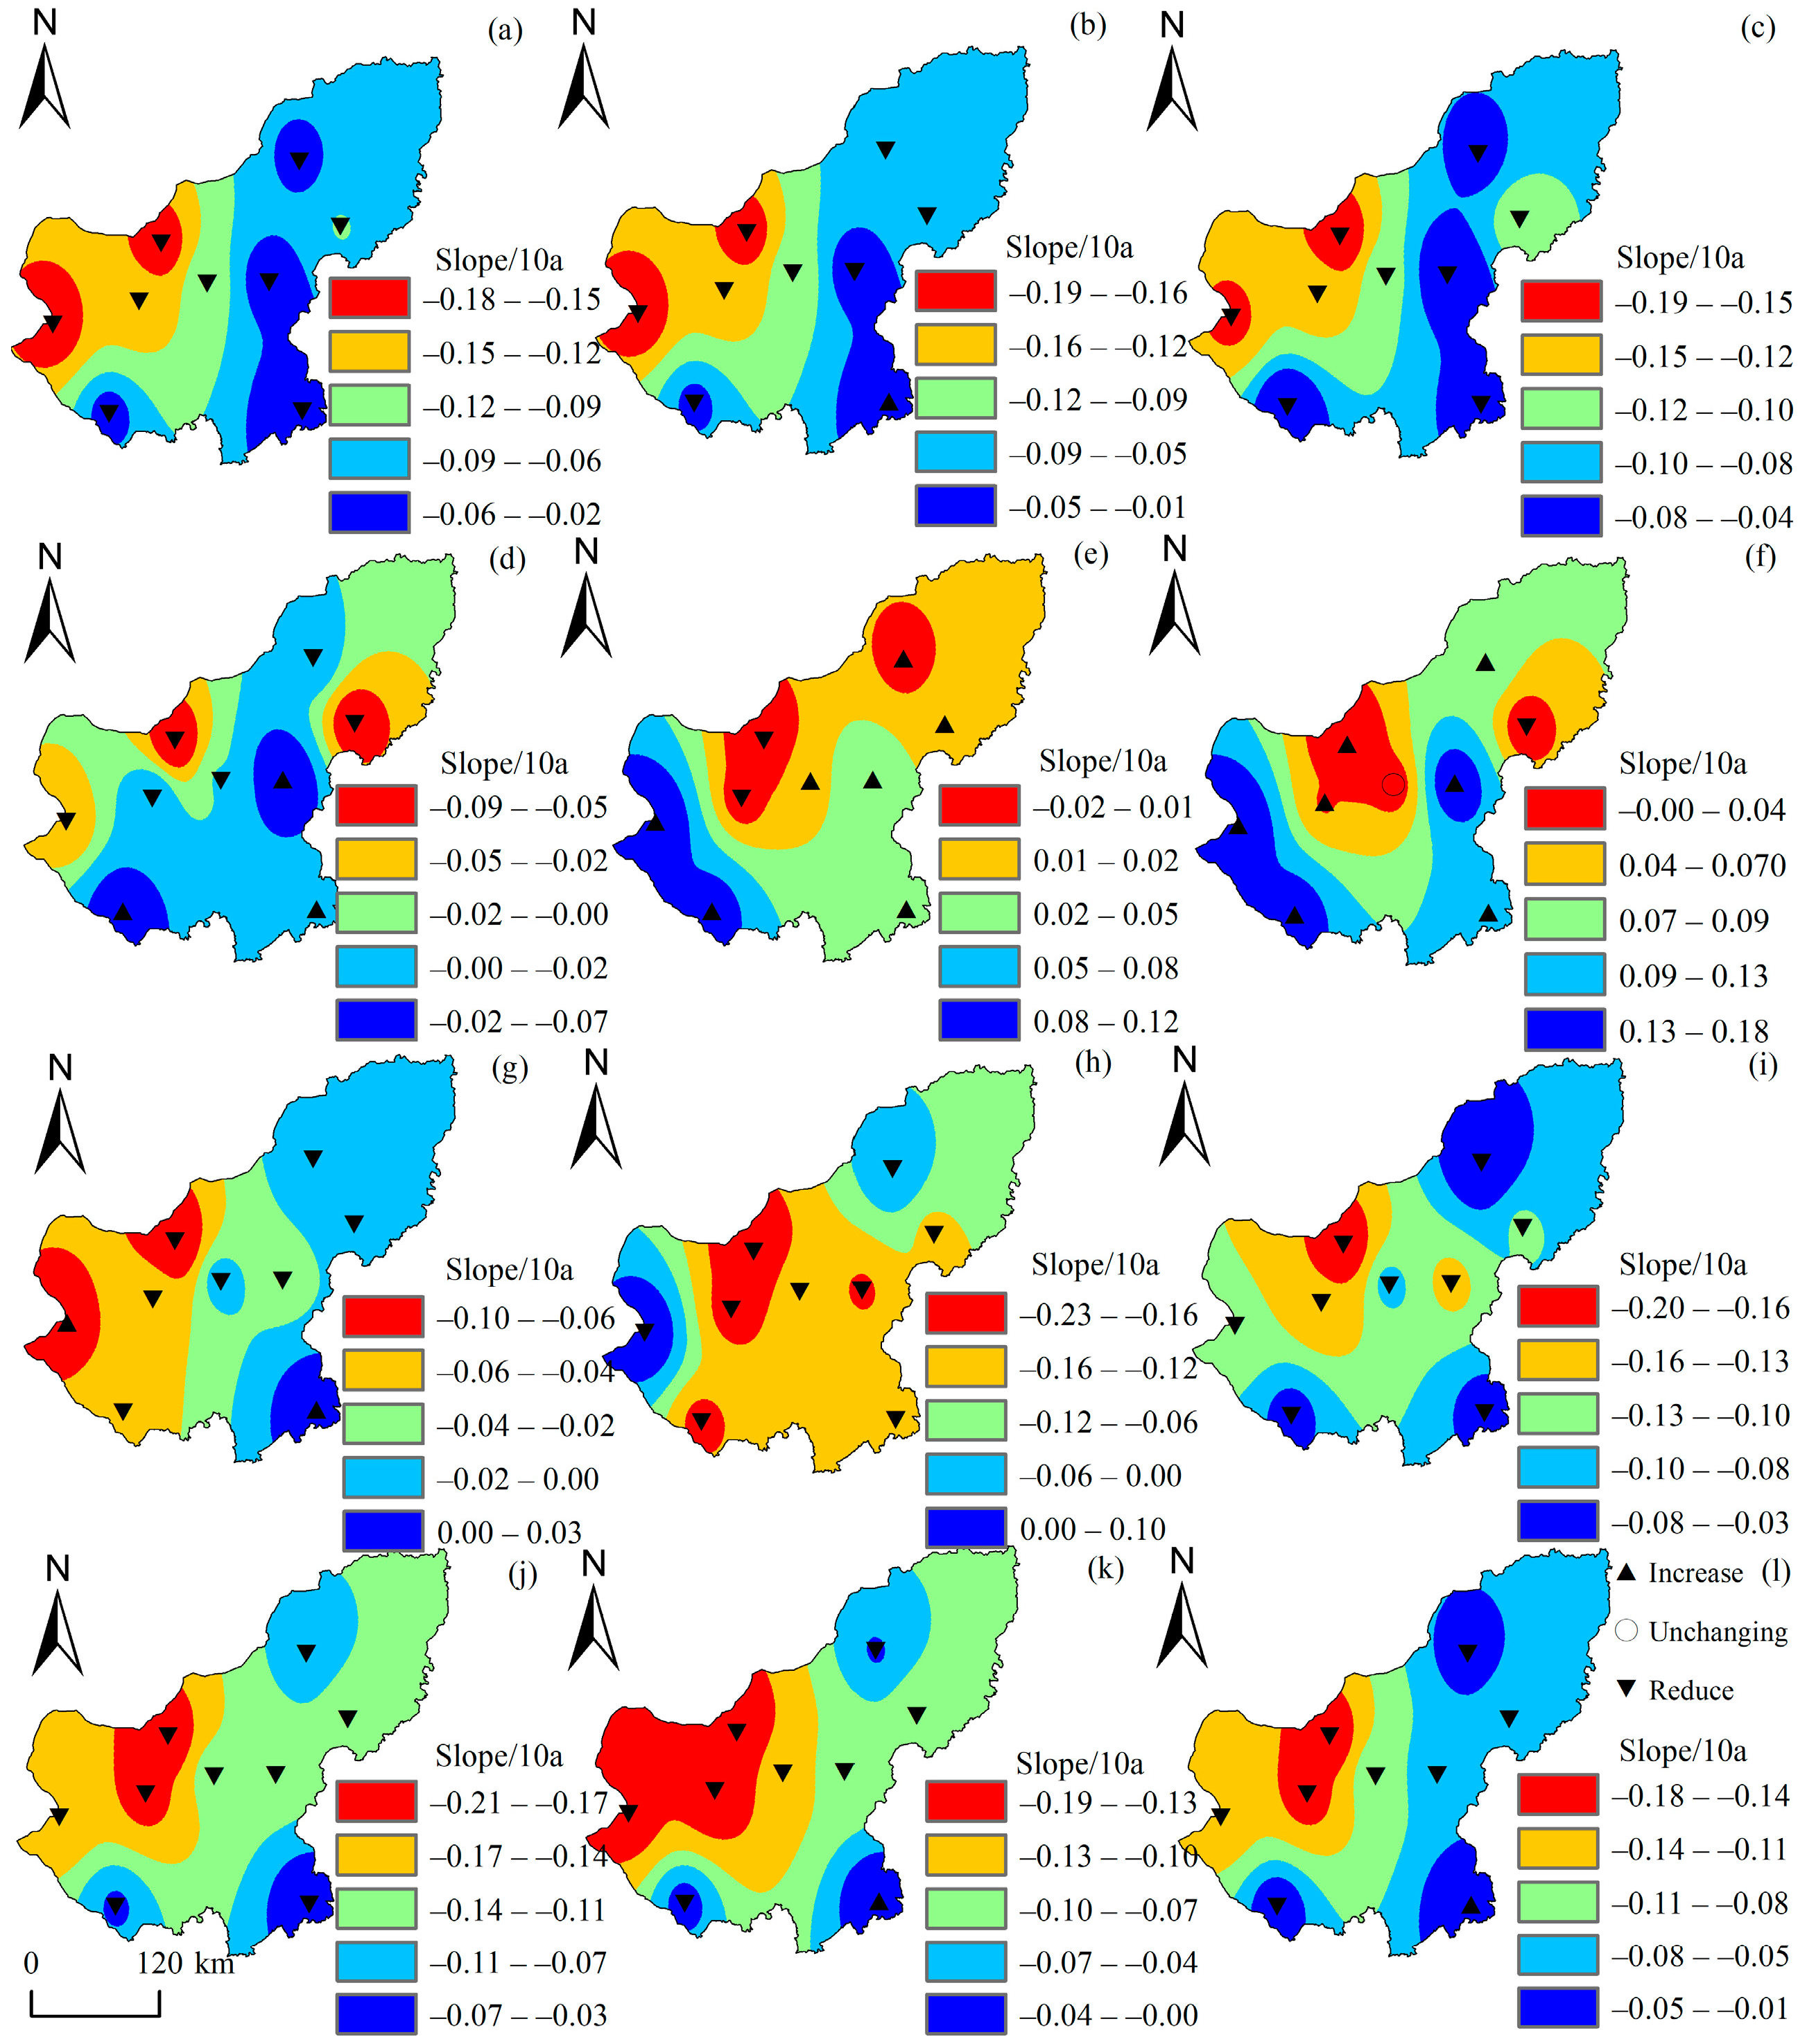
3.1.2. Spatial Distribution Characteristics of Drought
3.1.3. Variation of Drought Trend
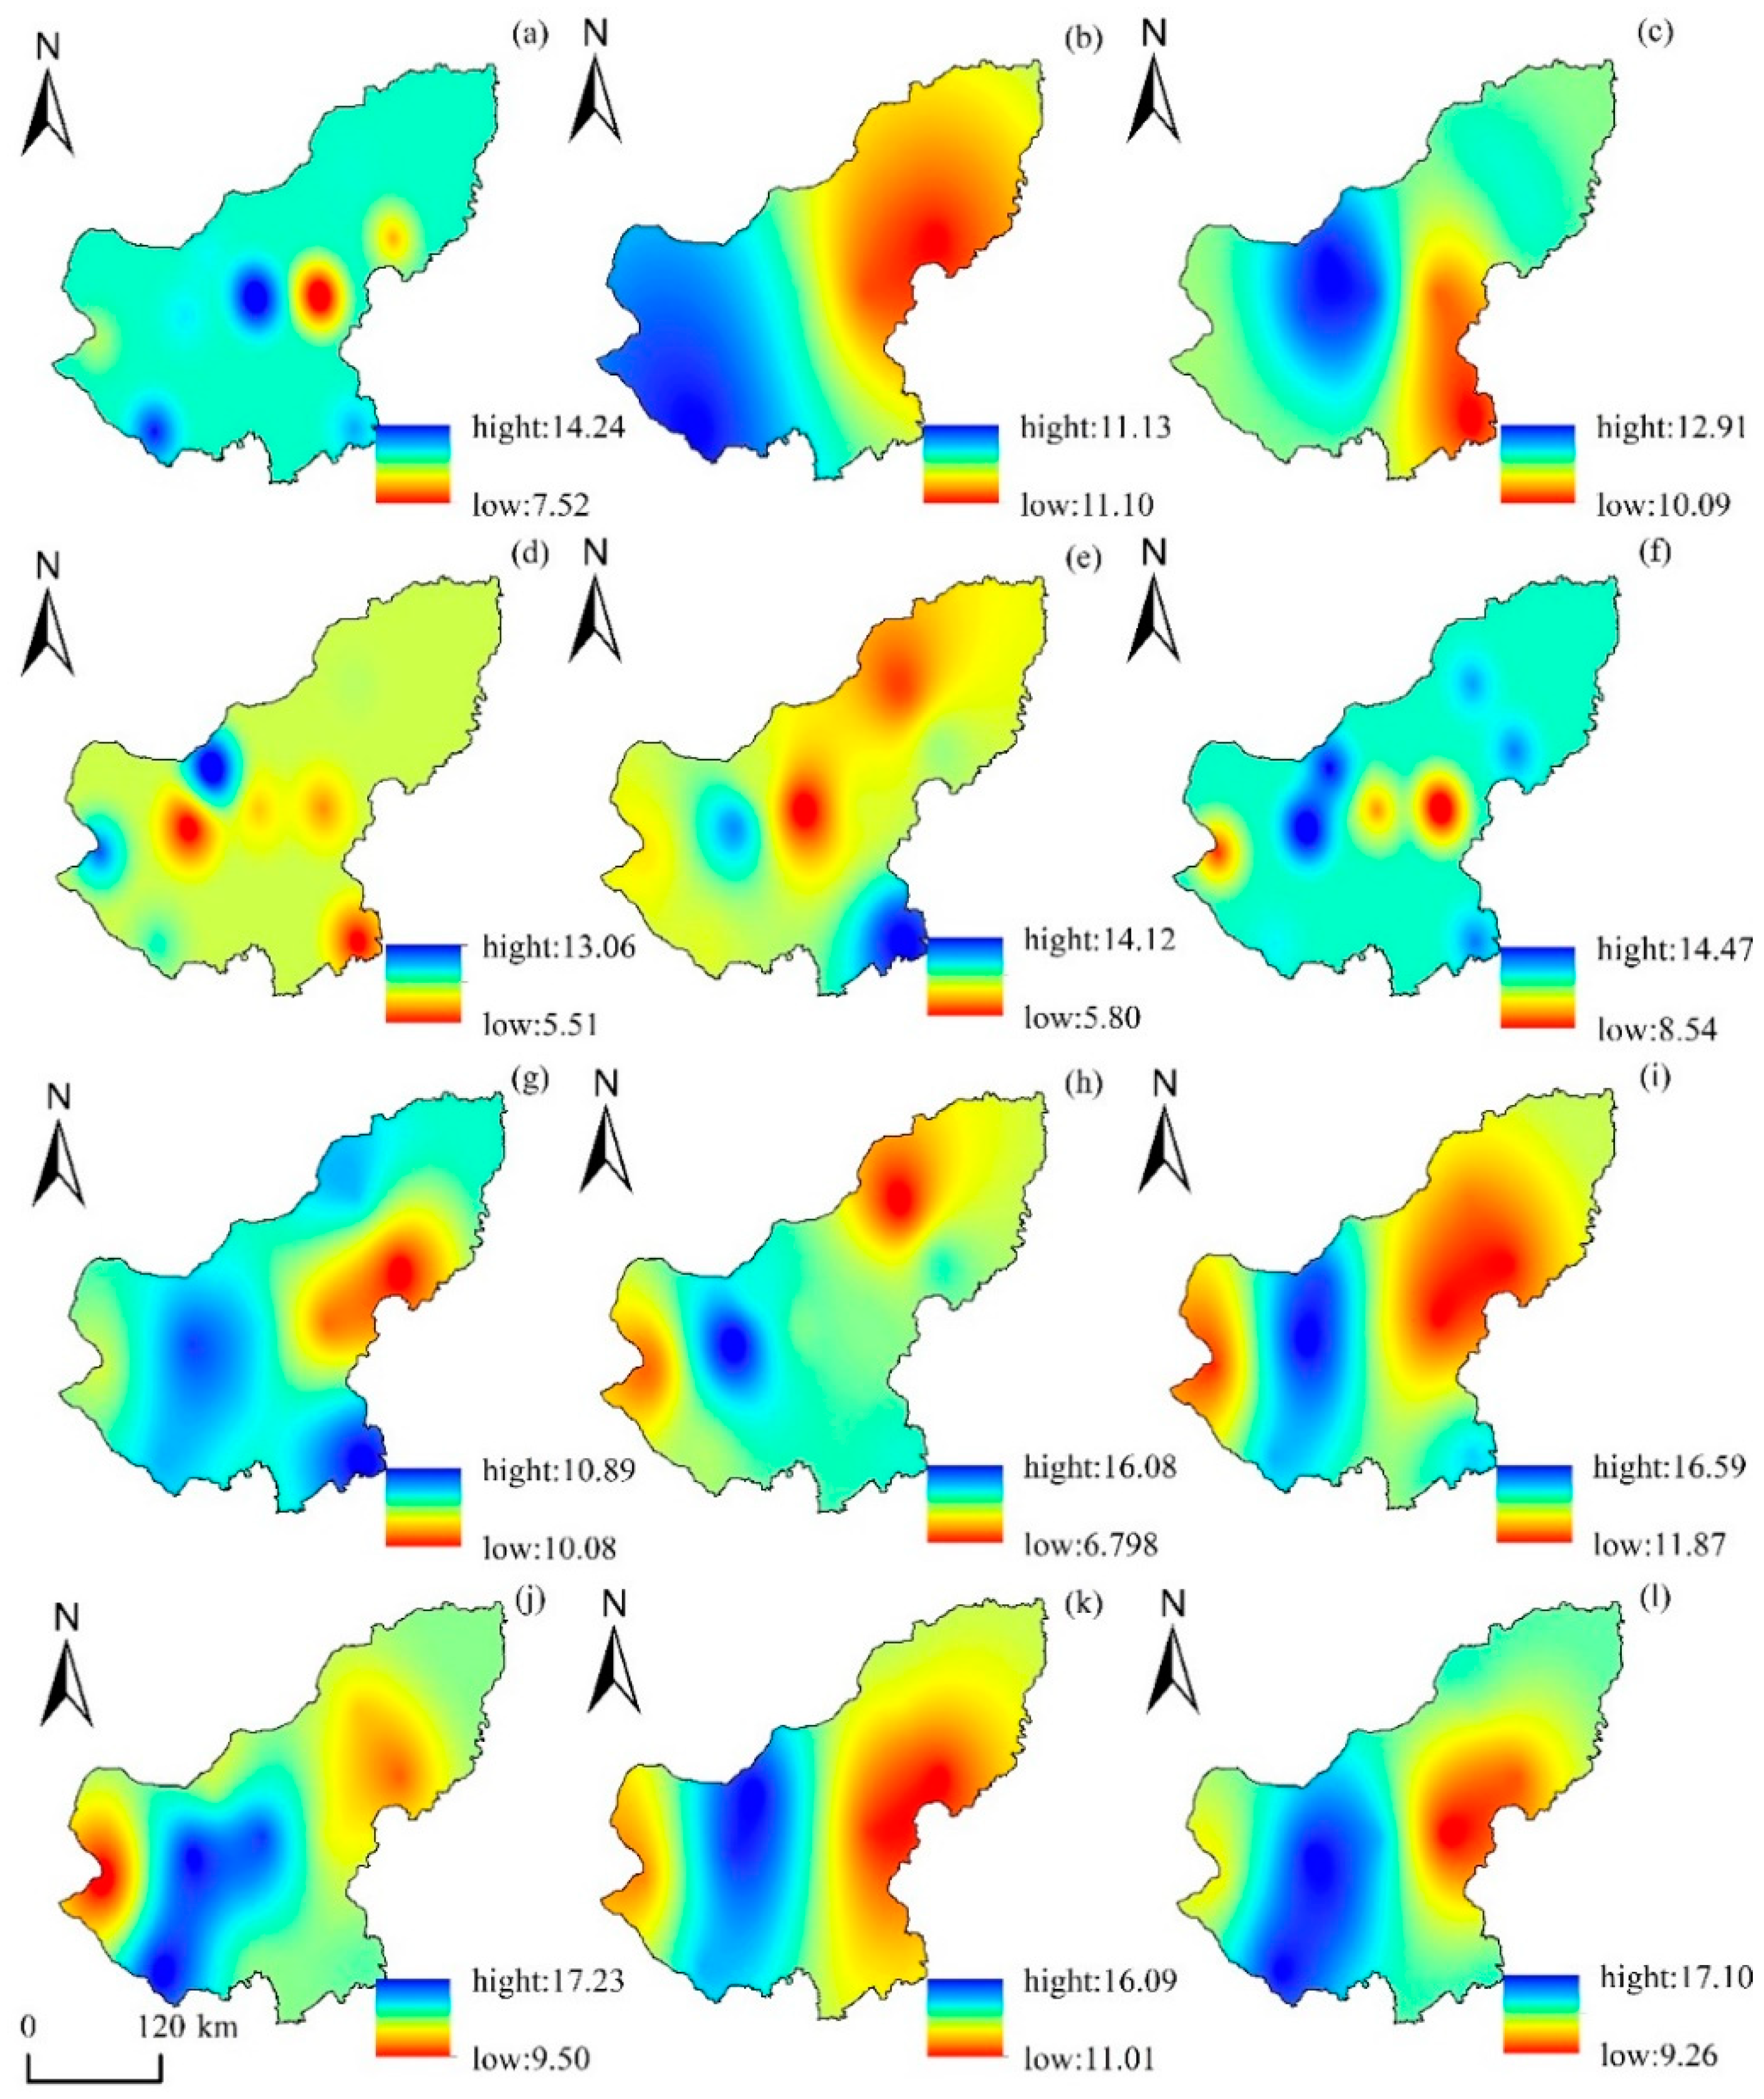
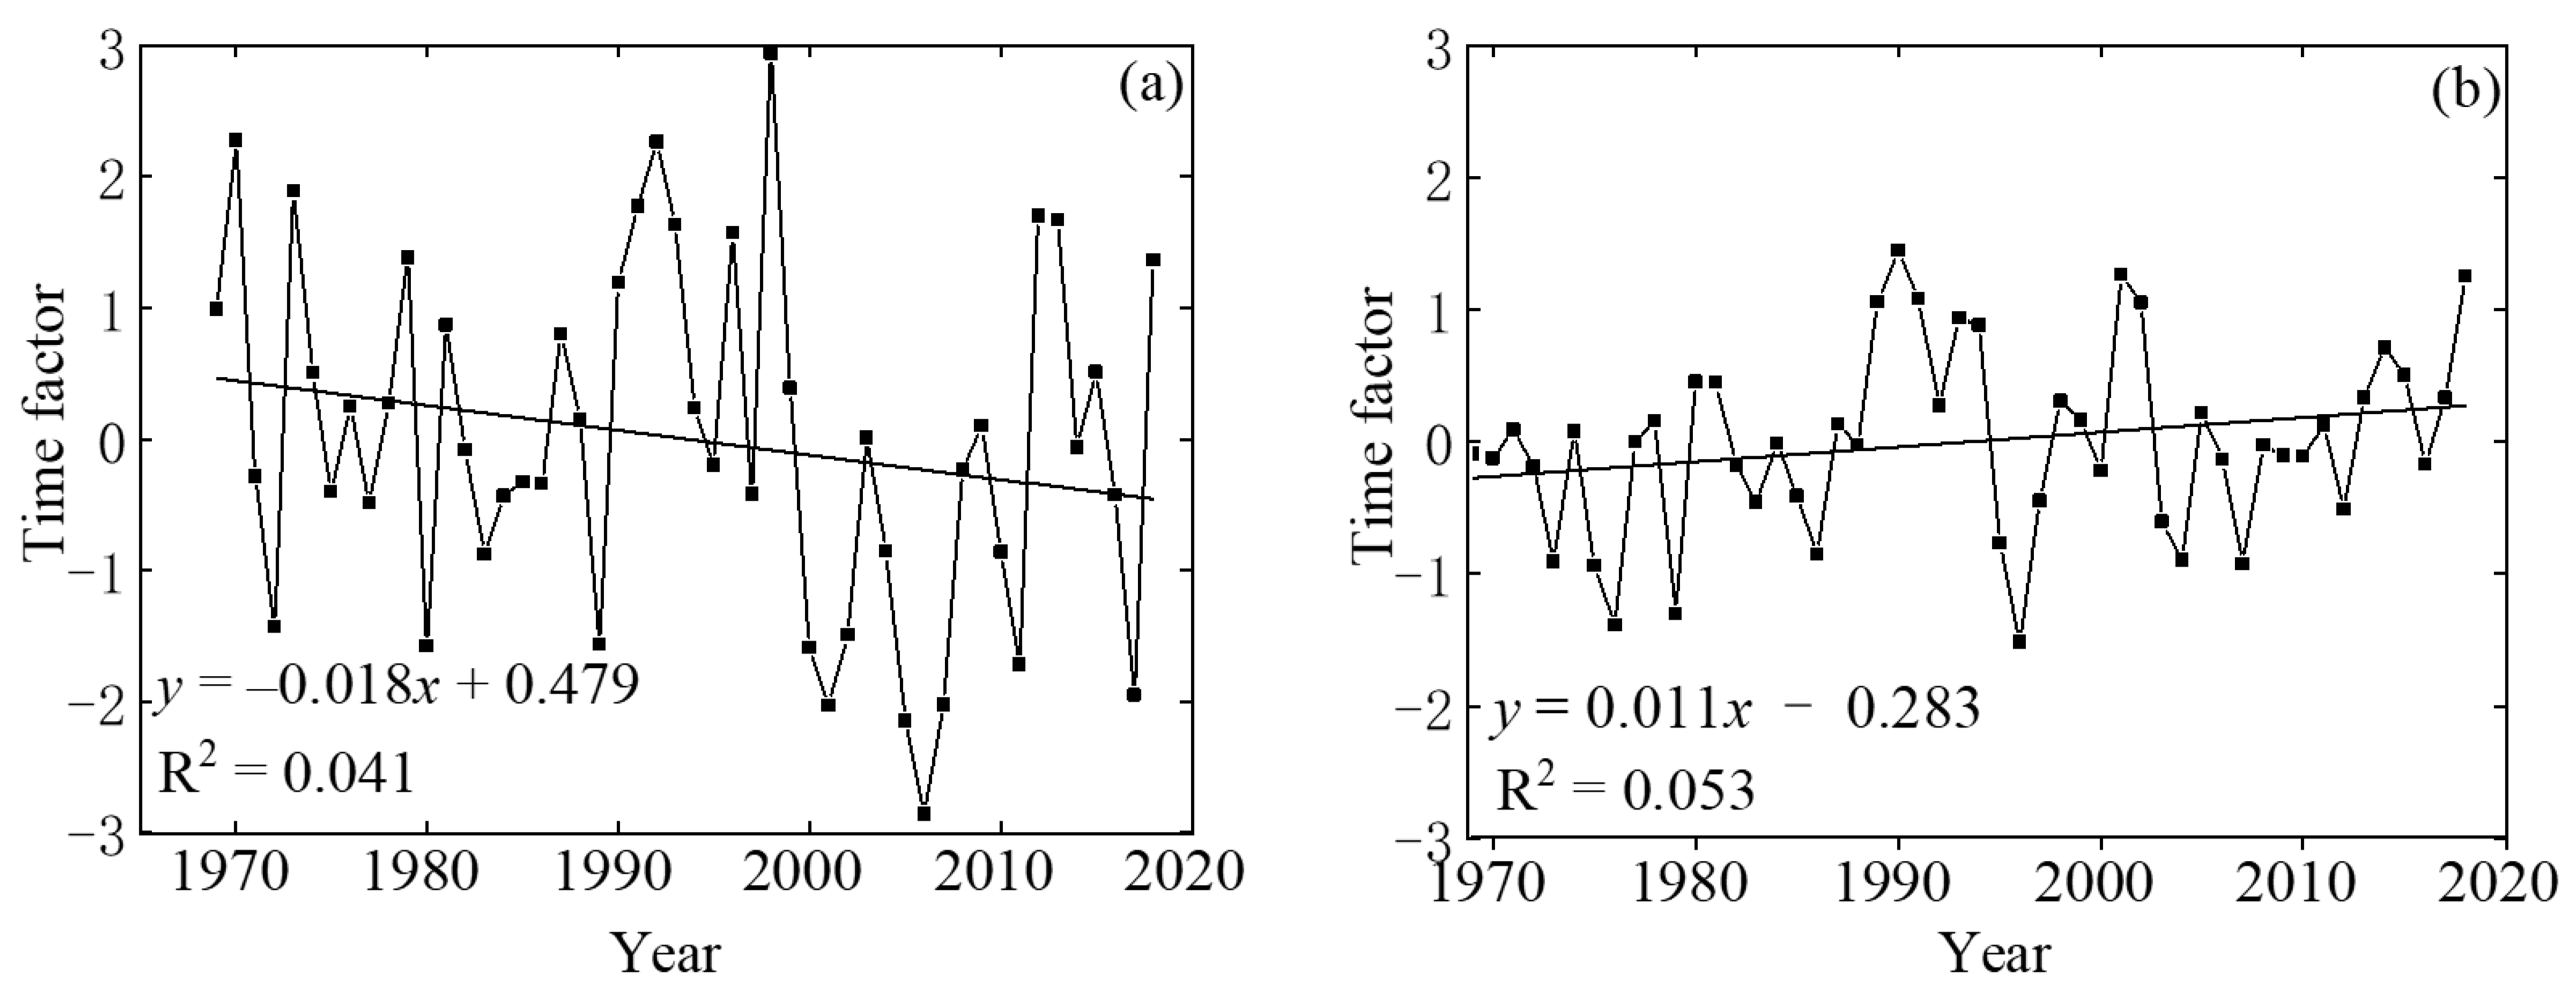
3.1.4. Analysis of Temporal and Spatial Modes of Drought
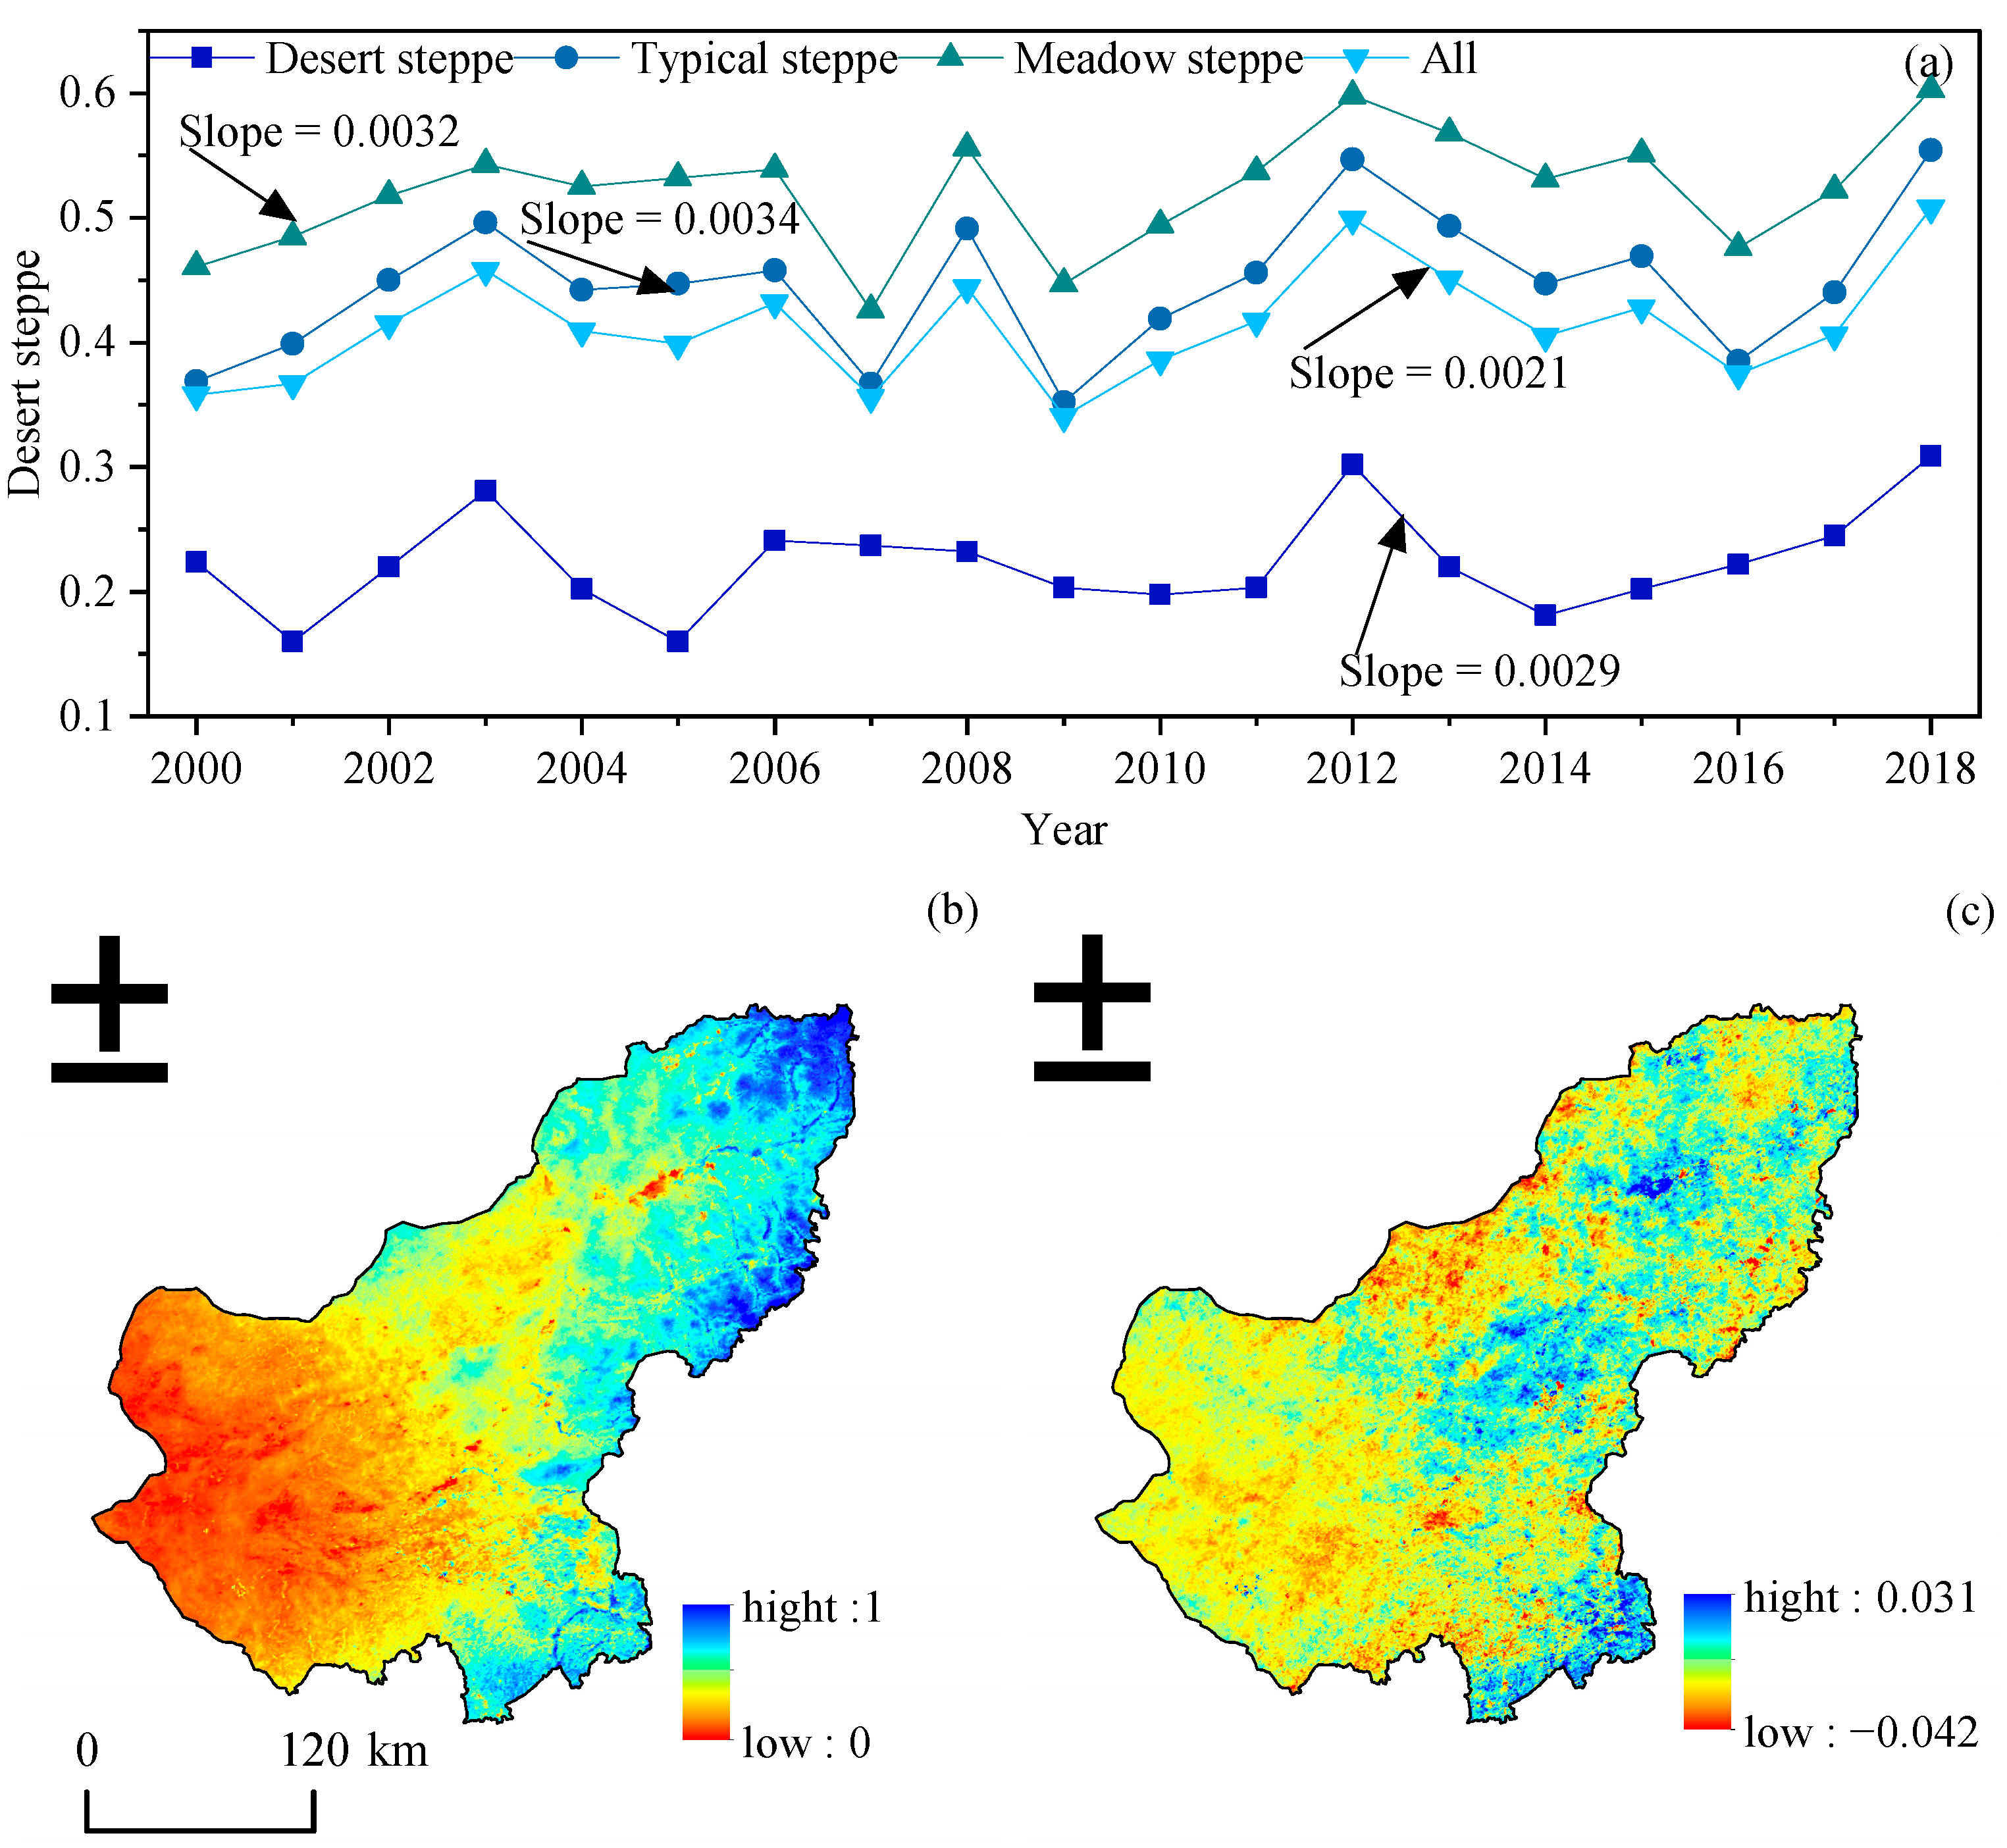
3.2. Characteristics of Vegetation Change in Xilin Gol
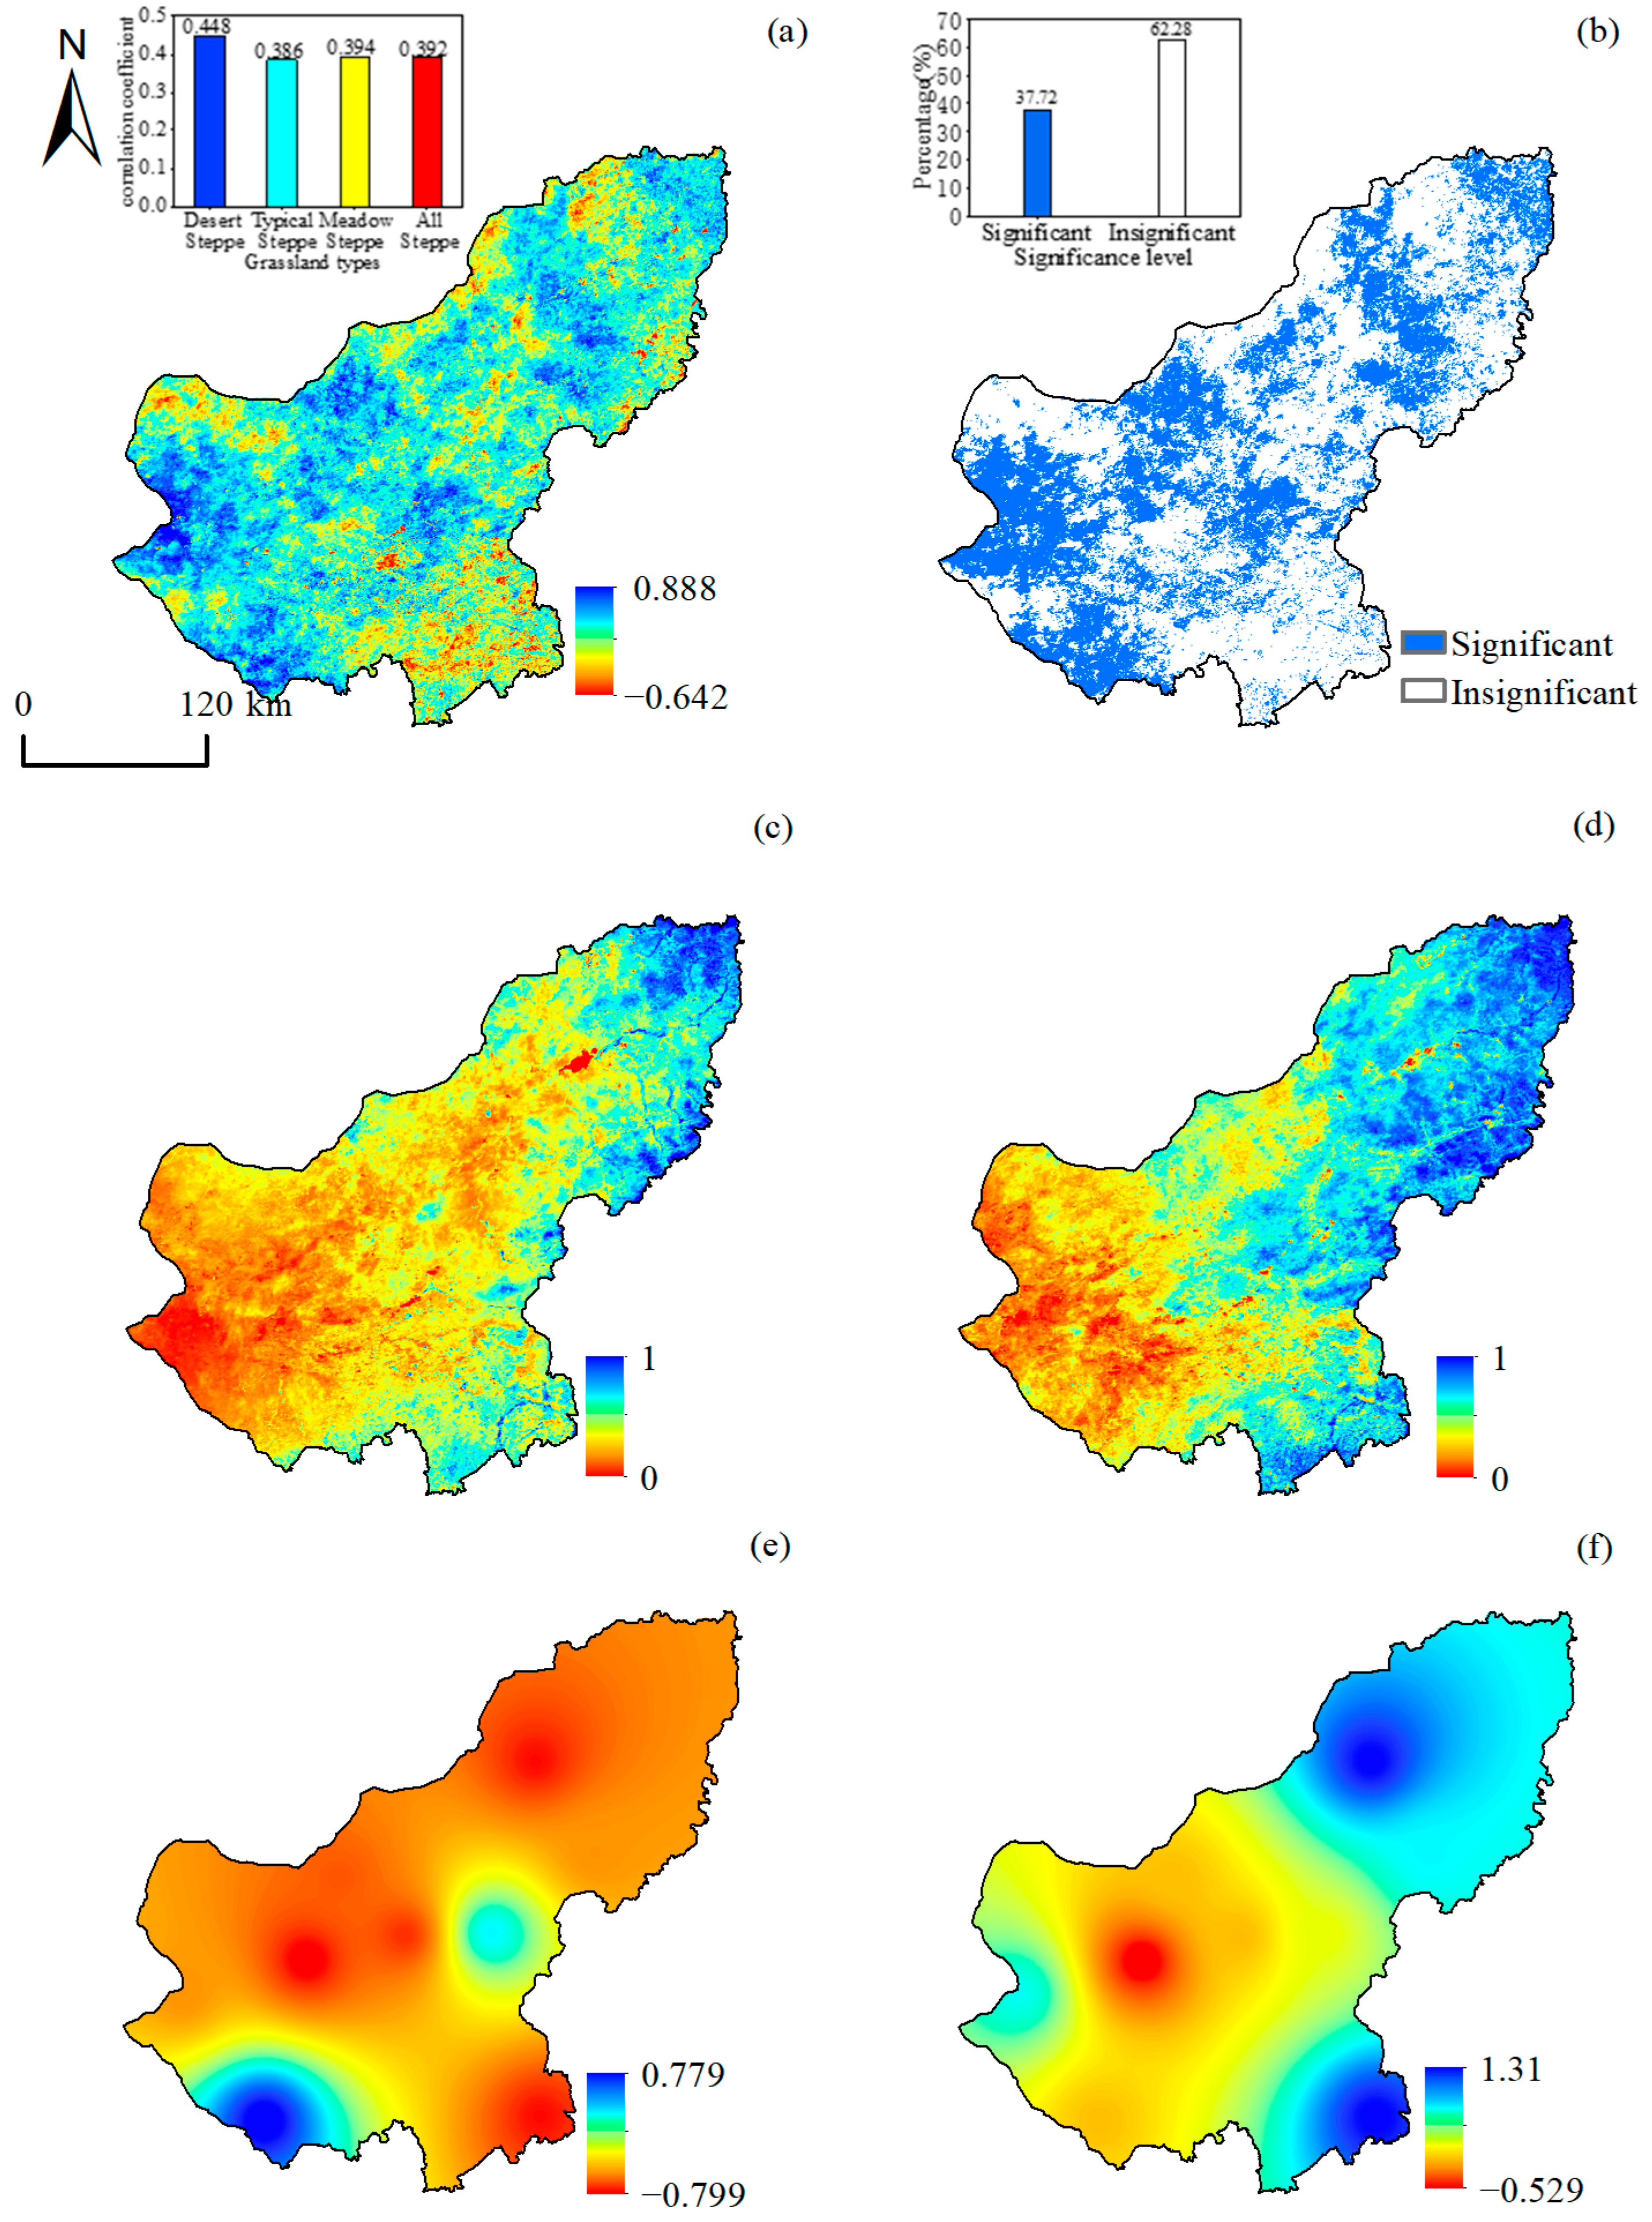
3.3. Effects of Drought on Vegetation
4. Discussion
5. Conclusions
Author Contributions
Funding
Informed Consent Statement
Data Availability Statement
Acknowledgments
Conflicts of Interest
References
- Yan, H.; Ran, Q.; Hu, R.; Xue, K.; Zhang, B.; Zhou, S.; Zhang, Z.; Tang, L.; Che, R.; Pang, Z.; et al. Machine learning-based prediction for grassland degradation using geographic, meteorological, plant and microbial data. Ecol. Indic. 2022, 137, 108738. [Google Scholar] [CrossRef]
- Wu, L.; Liu, H.; Liang, B.; Zhu, X.; Cao, J.; Wang, Q.; Jiang, L.; Cressey, E.L.; Quine, T.A. A process-based model reveals the restoration gap of degraded grasslands in Inner Mongolian steppe. Sci. Total Environ. 2022, 806, 151324. [Google Scholar] [CrossRef] [PubMed]
- Wang, X.; Pan, S.; Pan, N.; Pan, P. Grassland productivity response to droughts in northern China monitored by satellite-based solar-induced chlorophyll fluorescence. Sci. Total Environ. 2022, 830, 154550. [Google Scholar] [CrossRef] [PubMed]
- Liu, Y.; You, C.; Zhang, Y.; Chen, S.; Zhang, Z.; Li, J.; Wu, Y. Resistance and resilience of grasslands to drought detected by SIF in inner Mongolia, China. Agric. For. Meteorol. 2021, 308–309, 108567. [Google Scholar] [CrossRef]
- Xu, L.; Chen, N.; Yang, C.; Zhang, C.; Yu, H. A parametric multivariate drought index for drought monitoring and assessment under climate change. Agric. For. Meteorol. 2021, 310, 108657. [Google Scholar] [CrossRef]
- Li, L.; Qian, R.; Liu, W.; Wang, W.; Biederman, J.A.; Zhang, B.; Kang, X.; Wen, F.; Ran, Q.; Zheng, Z.; et al. Drought timing influences the sensitivity of a semiarid grassland to drought. Geoderma 2022, 412, 115714. [Google Scholar] [CrossRef]
- Liu, Y.; Dang, C.; Yue, H.; Lyu, C.; Dang, X. Enhanced drought detection and monitoring using sun-induced chlorophyll fluorescence over Hulun Buir Grassland, China. Sci. Total Environ. 2021, 770, 145271. [Google Scholar] [CrossRef]
- Rascón, J.; Gosgot Angeles, W.; Quiñones Huatangari, L.; Oliva, M.; Barrena Gurbillón, M.Á. Dry and Wet Events in Andean Populations of Northern Peru: A Case Study of Chachapoyas, Peru. Front. Environ. Sci. 2021, 9, 54. [Google Scholar] [CrossRef]
- Zhang, Y.; Li, Z. Uncertainty Analysis of Standardized Precipitation Index Due to the Effects of Probability Distributions and Parameter Errors. Front. Earth Sci. 2020, 8, 76. [Google Scholar] [CrossRef]
- Dukat, P.; Bednorz, E.; Ziemblińska, K.; Urbaniak, M. Trends in drought occurrence and severity at mid-latitude European stations (1951–2015) estimated using standardized precipitation (SPI) and precipitation and evapotranspiration (SPEI) indices. Meteorol. Atmos. Phys. 2022, 134, 20. [Google Scholar] [CrossRef]
- Mallenahalli, N.K. Comparison of parametric and nonparametric standardized precipitation index for detecting meteorological drought over the Indian region. Theor. Appl. Climatol. 2020, 142, 219–236. [Google Scholar] [CrossRef]
- Choudhury, A.; Dutta, D.; Bera, D.; Kundu, A. Regional variation of drought parameters and long-term trends over India using standardized precipitation evapotranspiration index. J. Environ. Manag. 2021, 296, 113056. [Google Scholar] [CrossRef]
- Wang, Y.; Liu, G.; Guo, E. Spatial distribution and temporal variation of drought in Inner Mongolia during 1901–2014 using Standardized Precipitation Evapotranspiration Index. Sci. Total Environ. 2019, 654, 850–862. [Google Scholar] [CrossRef] [PubMed]
- Zheng, Y.; Zhang, X.; Yu, J.; Xu, Y.; Wang, Q.; Li, C.; Yao, X. Assessing the Joint Impact of Climatic Variables on Meteorological Drought Using Machine Learning. Front. Earth Sci. 2022, 10, 320. [Google Scholar] [CrossRef]
- Ram, S.; Singh, H.N.; Yadav, R.K.; Varikoden, H.; Nandargi, S.S.; Srivastava, M.K. Variations in vapor pressure and standardized precipitation evapotranspiration index since AD 1861 over the western Himalaya in India: Inference from tree ring-width records. Theor. Appl. Climatol. 2020, 140, 157–166. [Google Scholar] [CrossRef]
- Asadi Zarch, M.A.; Sivakumar, B.; Sharma, A. Droughts in a warming climate: A global assessment of Standardized precipitation index (SPI) and Reconnaissance drought index (RDI). J. Hydrol. 2015, 526, 183–195. [Google Scholar] [CrossRef]
- Niu, Q.; Liu, L.; Heng, J.; Li, H.; Xu, Z. A Multi-Index Evaluation of Drought Characteristics in the Yarlung Zangbo River Basin of Tibetan Plateau, Southwest China. Front. Earth Sci. 2020, 8, 213. [Google Scholar] [CrossRef]
- Hajiabadi, F.; Hassanpour, F.; Yaghoobzadeh, M.; Hammami, H.; Amirabadizadeh, M. Evaluation of drought characterization using SPI and SC-PDSI drought indices in baseline and upcoming periods in Birjand region. Arab. J. Geosci. 2021, 14, 939. [Google Scholar] [CrossRef]
- Yu, H.; Zhang, Q.; Xu, C.Y.; Du, J.; Sun, P.; Hu, P. Modified Palmer Drought Severity Index: Model improvement and application. Environ. Int. 2019, 130, 104951. [Google Scholar] [CrossRef]
- Mondol, M.A.H.; Zhu, X.; Dunkerley, D.; Henley, B.J. Observed meteorological drought trends in Bangladesh identified with the Effective Drought Index (EDI). Agric. Water Manag. 2021, 255, 107001. [Google Scholar] [CrossRef]
- Shaik, R.; N.T., M.; G., S.N. Estimation of annual regional drought index considering the joint effects of climate and water budget for Krishna River basin, India. Environ. Monit. Assess. 2020, 192, 427. [Google Scholar] [CrossRef] [PubMed]
- Zhang, Y.; Yu, Z.; Niu, H. Standardized Precipitation Evapotranspiration Index is highly correlated with total water storage over China under future climate scenarios. Atmos. Environ. 2018, 194, 123–133. [Google Scholar] [CrossRef]
- Byun, H.R.; Kim, D.W. Comparing the Effective Drought Index and the Standardized Precipitation Index. Options Méditerranéennes Série A Séminaires Méditerranéens 2010, 95, 85–89. [Google Scholar]
- Kamruzzaman, M.; Hwang, S.; Cho, J.; Jang, M.W.; Jeong, H. Evaluating the Spatiotemporal Characteristics of Agricultural Drought in Bangladesh Using Effective Drought Index. Water 2019, 11, 2437. [Google Scholar] [CrossRef] [Green Version]
- Wang, Z.; Huang, Z.; Li, J.; Zhong, R.; Huang, W. Assessing impacts of meteorological drought on vegetation at catchment scale in China based on SPEI and NDVI. Trans. Chin. Soc. Agric. Eng. 2016, 32, 177–186. [Google Scholar]
- Hossain, M.L.; Li, J. NDVI-based vegetation dynamics and its resistance and resilience to different intensities of climatic events. Glob. Ecol. Conserv. 2021, 30, e01768. [Google Scholar] [CrossRef]
- Wang, S.; Li, R.; Wu, Y.; Zhao, S. Effects of multi-temporal scale drought on vegetation dynamics in Inner Mongolia from 1982 to 2015, China. Ecol. Indic. 2022, 136, 108666. [Google Scholar] [CrossRef]
- Li, J.; Wang, Y.; Liu, L. Responses of the Terrestrial Ecosystem Productivity to Droughts in China. Front. Earth Sci. 2020, 8, 59. [Google Scholar] [CrossRef] [Green Version]
- Li, C.; Wang, J.; Yin, S.; Bao, Y.; Li, Y.; Yu, S. Drought hazard assessment and possible adaptation options for typical steppe grassland in Xilingol League, Inner Mongolia, China. Theor. Appl. Climatol. 2019, 136, 1339–1346. [Google Scholar] [CrossRef]
- Tong, S.; Bao, Y.; Te, R.; Ma, Q.; Ha, S.; Lusi, A. Analysis of Drought Characteristics in Xilingol Grassland of Northern China Based on SPEI and Its Impact on Vegetation. Math. Probl. Eng. 2017, 2017, 5209173. [Google Scholar] [CrossRef] [Green Version]
- Deo, R.C.; Byun, H.-R.; Adamowski, J.F.; Begum, K. Application of effective drought index for quantification of meteorological drought events: A case study in Australia. Theor. Appl. Climatol. 2016, 128, 359–379. [Google Scholar] [CrossRef]
- Gocic, M.; Trajkovic, S. Analysis of changes in meteorological variables using Mann-Kendall and Sen’s slope estimator statistical tests in Serbia. Glob. Planet. Chang. 2013, 100, 172–182. [Google Scholar] [CrossRef]
- Ionita, M.; Caldarescu, D.E.; Nagavciuc, V. Compound Hot and Dry Events in Europe: Variability and Large-Scale Drivers. Front. Clim. 2021, 3, 688991. [Google Scholar] [CrossRef]
- Özger, M.; Başakın, E.E.; Ekmekcioğlu, Ö.; Hacısüleyman, V. Comparison of wavelet and empirical mode decomposition hybrid models in drought prediction. Comput. Electron. Agric. 2020, 179, 105851. [Google Scholar] [CrossRef]
- Yong, M.; Shinoda, M.; Nandintsetseg, B.; Bi, L.; Gao, H.; Wang, Y. Impacts of Land Surface Conditions and Land Use on Dust Events in the Inner Mongolian Grasslands, China. Front. Ecol. Evol. 2021, 9, 664900. [Google Scholar] [CrossRef]
- Wang, S.; Li, R.; Wu, Y.; Zhao, S. Vegetation dynamics and their response to hydrothermal conditions in Inner Mongolia, China. Glob. Ecol. Conserv. 2022, 34, e02034. [Google Scholar] [CrossRef]
- Tong, S.; Li, X.; Zhang, J.; Bao, Y.; Bao, Y.; Na, L.; Si, A. Spatial and temporal variability in extreme temperature and precipitation events in Inner Mongolia (China) during 1960–2017. Sci. Total Environ. 2019, 649, 75–89. [Google Scholar] [CrossRef]
- Zhang, X.; Pan, X.; Xu, L.; Wei, P.; Yin, Z.; Shao, C. Analysis of spatio-temporal distribution of drought characteristics based on SPEI in Inner Mongolia during 1960–2015. Trans. Chin. Soc. Agric. Eng. 2017, 33, 190–199. [Google Scholar]
- Li, W.; Duan, L.; Wang, W.; Wu, Y.; Liu, T.; Quan, Q.; Chen, X.; Yin, H.; Zhou, Q. Spatiotemporal characteristics of drought in a semi-arid grassland over the past 56 years based on the Standardized Precipitation Index. Meteorol. Atmos. Phys. 2020, 133, 41–54. [Google Scholar] [CrossRef]
- Qiaofeng, Z.; Guixiang, L.; Hongbo, Y.U.; Yuhai, B. Analysis of drought characteristics in Xilingol League based on standardized precipitation index. J. Nat. Disasters 2015, 24, 119–128. [Google Scholar]
- Hang, Y.L.; Bao, G.; Bao, Y.H.; Burenjirigala; Dorjsuren, A. Spatiotemporal Changes of Vegetation Coverage in Xilin Gol Grassland and Its Responses to Climate Change during 2000–2010. Acta Agrestia Sin. 2014, 22, 1194–1204. [Google Scholar]
- Shi, N.N.; Xiao, N.W.; Wang, Q.; Han, Y.; Gao, X.Q.; Feng, J.; Quan, Z.J. Spatio-temporal dynamics of normalized differential vegetation index and its driving factors in Xilin Gol, China. Chin. J. Plant Ecol. 2019, 43, 331–341. [Google Scholar] [CrossRef]
- Dong, Z.; Rong, A.; Zhang, J.; Tong, Z.; Han, A.; Zhi, F. Study on the Evolutionary Features and Driving Factors of Land-Use System in Xilingol, China. Land 2022, 11, 526. [Google Scholar] [CrossRef]
- Li, Q.; Wang, J.; Xie, H.; Ochir, A.; Davaasuren, D.; Chen, M.H. Applicability of Grassland Production Estimation Using Remote Sensing for the Mongolian Plateau by Comparing Typical Regions in China and Mongolia. Sustainability 2022, 14, 3122. [Google Scholar] [CrossRef]
- Dou, H.; Li, X.; Gong, J.; Wang, H.; Tian, Y.; Xuan, X.; Wang, K. Enhanced Ecosystem Services in China’s Xilingol Steppe during 2000–2015: Towards Sustainable Agropastoralism Management. Remote Sens. 2022, 14, 738. [Google Scholar] [CrossRef]
- Fang, A.; Dong, J.; Cao, Z.; Zhang, F.; Li, Y. Tempo-Spatial Variation of Vegetation Coverage and Influencing Factors of Large-Scale Mining Areas in Eastern Inner Mongolia, China. Multidiscip. Digit. Publ. Inst. 2019, 17, 47. [Google Scholar] [CrossRef] [Green Version]
- Zhang, Y.; Zhang, J.; Xia, J.; Guo, Y.; Fu, Y.H. Effects of Vegetation Phenology on Ecosystem Water Use Efficiency in a Semiarid Region of Northern China. Front. Plant Sci. 2022, 13, 945582. [Google Scholar] [CrossRef]
- Li, M.; Wang, X.; Chen, J. Assessment of Grassland Ecosystem Services and Analysis on Its Driving Factors: A Case Study in Hulunbuir Grassland. Front. Ecol. Evol. 2022, 10, 25. [Google Scholar] [CrossRef]
- Gutierrez-Cori, O.; Espinoza, J.C.; Li, L.Z.X.; Wongchuig, S.; Arias, P.A.; Ronchail, J.; Segura, H. On the Hydroclimate-Vegetation Relationship in the Southwestern Amazon During the 2000–2019 Period. Front. Water 2021, 3, 648499. [Google Scholar] [CrossRef]
- Lv, Y.; Zhao, X.Q.; Zhang, S.R.; Zhang, J.G.; Yue, K.T.; Meng, B.P.; Li, M.; Cui, W.X.; Sun, Y.; Zhang, J.G.; et al. Herbaceous Dominant the Changes of Normalized Difference Vegetation Index in the Transition Zone Between Desert and Typical Steppe in Inner Mongolia, China. Front. Plant Sci. 2022, 12, 832044. [Google Scholar] [CrossRef]
- Yang, S.; Quan, Q.; Liang, W.; Liu, T. Characteristics of Agricultural Droughts and Spatial Stratified Heterogeneity and Dependence of Dominant Factors in Inner Mongolia Autonomous Region, China. Atmosphere 2021, 12, 1249. [Google Scholar] [CrossRef]
- Liu, X.; Tian, Y.; Liu, S.; Jiang, L.; Mao, J.; Jia, X.; Zha, T.; Zhang, K.; Wu, Y.; Zhou, J. Time-Lag Effect of Climate Conditions on Vegetation Productivity in a Temperate Forest–Grassland Ecotone. Forests 2022, 13, 1024. [Google Scholar] [CrossRef]
- Wei, Y.; Zhu, L.; Chen, Y.; Cao, X.; Yu, H. Spatiotemporal Variations in Drought and Vegetation Response in Inner Mongolia from 1982 to 2019. Remote Sens. 2022, 14, 3803. [Google Scholar] [CrossRef]
- Zhang, H.; Zhang, X.; Shang, Y.; Kattel, G.; Miao, L. Continuously Vegetation Greening over Inner Mongolia for the Past Three Decades. Remote Sens. 2021, 13, 2446. [Google Scholar] [CrossRef]
- Guo, E.; Wang, Y.; Wang, C.; Sun, Z.; Bao, Y.; Mandula, N.; Jirigala, B.; Bao, Y.; Li, H. NDVI Indicates Long-Term Dynamics of Vegetation and Its Driving Forces from Climatic and Anthropogenic Factors in Mongolian Plateau. Remote Sens. 2021, 13, 688. [Google Scholar] [CrossRef]
- Kang, W.; Wang, T.; Liu, S. The Response of Vegetation Phenology and Productivity to Drought in Semi-Arid Regions of Northern China. Remote Sens. 2018, 10, 727. [Google Scholar] [CrossRef] [Green Version]
- Zhu, W.; Wang, S.; Luo, P.; Zha, X.; Cao, Z.; Lyu, J.; Zhou, M.; He, B.; Nover, D. A Quantitative Analysis of the Influence of Temperature Change on the Extreme Precipitation. Atmosphere 2022, 13, 612. [Google Scholar] [CrossRef]
- Meng, F.; Luo, M.; Sa, C.; Wang, M.; Bao, Y. Quantitative assessment of the effects of climate, vegetation, soil and groundwater on soil moisture spatiotemporal variability in the Mongolian Plateau. Sci. Total Environ. 2022, 809, 152198. [Google Scholar] [CrossRef]
- Ma, X.-Q.; Leng, P.; Liao, Q.-Y.; Geng, Y.-J.; Zhang, X.; Shang, G.-F.; Song, X.; Song, Q.; Li, Z.-L. Prediction of vegetation phenology with atmospheric reanalysis over semiarid grasslands in Inner Mongolia. Sci. Total Environ. 2022, 812, 152462. [Google Scholar] [CrossRef]


| Drought Grade | Drought Definition | EDI Value |
|---|---|---|
| 1 | Normal | −1 < EDI ≤ 1 |
| 2 | Mild drought | −1.5 < EDI ≤ −1 |
| 3 | Moderate drought | −2 < EDI ≤ −1.5 |
| 4 | Severe drought | EDI ≤ −2 |
| Modal | Eigenvalue | Variance Contribution Rate/% | Cumulative Variance Contribution Rate/% | Characteristic Root Error Range | |
|---|---|---|---|---|---|
| 1 | 1.76 | 52.75 | 52.75 | 0.93 | 2.59 |
| 2 | 0.48 | 14.38 | 67.13 | 0.25 | 0.70 |
| 3 | 0.32 | 9.60 | 76.73 | 0.16 | 0.47 |
| 4 | 0.22 | 6.76 | 83.49 | 0.11 | 0.33 |
| 5 | 0.17 | 5.32 | 88.81 | 0.09 | 0.26 |
Publisher’s Note: MDPI stays neutral with regard to jurisdictional claims in published maps and institutional affiliations. |
© 2022 by the authors. Licensee MDPI, Basel, Switzerland. This article is an open access article distributed under the terms and conditions of the Creative Commons Attribution (CC BY) license (https://creativecommons.org/licenses/by/4.0/).
Share and Cite
Chen, Z.; Wang, W.; Wu, Y.; Yin, H.; Li, W.; Zhao, S. Temporal and Spatial Distribution Characteristics of Drought and Its Influence on Vegetation Change in Xilin Gol, China. Atmosphere 2022, 13, 1743. https://doi.org/10.3390/atmos13111743
Chen Z, Wang W, Wu Y, Yin H, Li W, Zhao S. Temporal and Spatial Distribution Characteristics of Drought and Its Influence on Vegetation Change in Xilin Gol, China. Atmosphere. 2022; 13(11):1743. https://doi.org/10.3390/atmos13111743
Chicago/Turabian StyleChen, Zexun, Wenjun Wang, Yingjie Wu, Hang Yin, Wei Li, and Shuixia Zhao. 2022. "Temporal and Spatial Distribution Characteristics of Drought and Its Influence on Vegetation Change in Xilin Gol, China" Atmosphere 13, no. 11: 1743. https://doi.org/10.3390/atmos13111743