Article

Evaluation of MODIS Dark Target AOD Product with 3 and 10 km Resolution in Amazonia

by
Rafael Palácios
1,*,
Danielle C. S. Nassarden
2,
Marco A. Franco
3,4,*,
Fernando G. Morais
3,5,
Luiz A. T. Machado
3,4,
Luciana V. Rizzo
3,4,
Glauber Cirino
1,
Augusto G. C. Pereira
1,
Priscila dos S. Ribeiro
1,
Lucas R. C. Barros
1,
Marcelo S. Biudes
2,
Leone F. A. Curado
2,
Thiago R. Rodrigues
6,
Jorge Menezes
7,
Eduardo Landulfo
5 and
Paulo Artaxo
3,4
1
Institute of Geosciences, Federal University of Pará, UFPA, Belém 66075-110, PA, Brazil
2
Institute of Physics, Federal University of Mato Grosso, UFMT, Cuiabá 78060-900, MT, Brazil
3
Institute of Physics, University of São Paulo, São Paulo 05508-220, SP, Brazil
4
Research Centre for Greenhouse Gas Innovation, RCGI-POLI-USP, São Paulo 05508-220, SP, Brazil
5
Lasers and Applications Center, IPEN, São Paulo 05508-000, SP, Brazil
6
Institute of Physics, Federal University of Mato Grosso do Sul, UFMS, Campo Grande 79070-900, MS, Brazil
7
Institute of Agriculture and Environment Education, Federal University of Amazon, UFAM, Humaitá 69800-000, AM, Brazil
*
Authors to whom correspondence should be addressed.
Atmosphere 2022, 13(11), 1742; https://doi.org/10.3390/atmos13111742
Submission received: 20 September 2022 / Revised: 10 October 2022 / Accepted: 20 October 2022 / Published: 22 October 2022
(This article belongs to the Special Issue Aerosols and Particulate Matters in the Southern Hemisphere)

Abstract

:
The techniques and analyses employed by remote sensing provide key information about atmospheric particle properties at regional and global scales. However, limitations in optical spectral models used to represent the different types of aerosols in the atmosphere and their effects (direct and indirect) are still one of the major causes of sources of uncertainties and substantial impacts in climate prediction. There are no studies yet in South America, especially in the Amazon Basin, that have evaluated the advantages, disadvantages, inconsistencies, applicability, and suitability of the MODIS sensor (Moderate Resolution Imaging Spectroradiometer) destined for monitoring the ambient aerosol optical thickness over rivers and continents. In this study, the results of the DT (Dark Target) algorithm for products with 3 km and 10 km resolutions were systematically evaluated for six sites in the Amazon rainforest. The comparisons between the products were carried out with the AERONET (Aerosol Robotic Network) measurements, which were used as reference. Statistical parameters between AERONET vs. MODIS were also evaluated based on biomass burning records in the site regions. Here, the DT 10 km product showed satisfactory performance for the Amazon region, with observations between the expected error (EE) limits above 66%, in addition to R > 0.8 and RMSE < 0.3. However, the regional analysis for the two sites in the central and southern regions of the Amazon basin did not have the same performance, where the results showed an EE of 24 and 47%, respectively. The DT 3 km product did not perform well in any site, with an EE below 50%. Both products overestimated the AOD, but the 3 km product overestimated it approximately four times more due to its algorithm setup. Thus, we recommend the 10 km product for general analysis in Amazonia. Regional biomass burning records showed a direct relationship with the AERONET vs. MODIS DT with overestimation of both products. All variations between products and sites were justified based on the difficulty of retrieving surface reflectance and the model selected for local aerosols. Improvements in the optical spectral model currently implemented in the algorithms, with more realistic representations of the main types of the aerosol present in the Amazon Basin, may contribute to better performance among the evaluated products.

1. Introduction

Atmospheric aerosols are defined as particulate matter suspended in the air, constituted of a diversity of chemical compositions, ranging from a few nanometers to tens of micrometers. These particles play an important role in the climate system, and due to their high spatial and temporal heterogeneity, they contribute to the uncertainties in the terrestrial radiative balance [1,2,3]. The direct climatic impacts of aerosols are related to the processes of scattering and absorption of solar radiation [4,5,6,7,8,9]. Additionally, the aerosols act as seeds for cloud formation, giving to the cloud’s different aspects of their physical properties, such as albedo and lifetime, changing, for instance, the efficiency for the precipitation process [9,10].
The challenges associated with the spatiotemporal characterization of the aerosol optical properties require a joint effort of long-term measurements in a huge variety of regions [5,11]. The need for these measurements has been fulfilled by the AERONET network (Aerosol Robotic Network), which performs continuous monitoring of a variety of aerosol physical parameters in different sites of the world [12]. Although AERONET provides important continuous information on optical properties, their limitations are mainly related to the fact that the photometers perform only local measurements, which also requires maintenance and calibrations from time to time. In this context, satellite remote sensing offers an unprecedented opportunity to advance the understanding of the aerosol–climate relationships and assist in understanding the complex atmospheric dynamics [4,5,11].
The use of remote sensing through spectrometers such as MODIS (Moderate Resolution Imaging Spectroradiometer), aboard the Terra and Aqua satellites, has shown the ability to provide different aerosol and cloud properties on a global scale [13]. In the newly released MODIS product Collection 6 (C6), the aerosol optical depth (AOD), which is a unitless quantity, goes beyond the traditional 10 km resolution data of the level 2, with a new global product with 3 km spatial resolution [14]. Although the new AOD 3 km product follows the same principles as the AOD 10 km, it can assist in constructing new products that assess smoke plumes and aerosol gradients at local and regional scales [15,16].
AOD retrieved by the set of algorithms of the MODIS instrument applies three different features: Dark Target (DT), Deep Blue (DB), and a combination of them (DTB) [11]. The DT 10 km AOD was already validated for humid regions with vegetated surfaces [17]. However, this algorithm is limited in its capacity for bright surfaces (e.g., desert regions). For these cases, it has been recommended to use the DB algorithm [18]. Recent works have evaluated the applicability of MODIS algorithms in various regions of the world, such as the semi-arid region of the USA [19], huge variety of sites in China [16,20], South America [21,22], Saudi Arabia [23], Peru [24], and globally [11,25,26,27].
Particularly for Brazil, the 10 km AOD MODIS products have already been applied to analyze radiative fluxes [6,28] and their effects on the carbon balance [29] over the Amazonian region. This same product was also evaluated by Lanzaco et al., 2016 [21] on some South American sites and used by Pérez Ramirez et al., 2017 [30] to complement some discussions on AERONET measures. In a global analysis, Wei et al. [11] performed some comparisons and evaluations between the different algorithms (DT, DB, and DTB), focused on their inner performance. Although there are studies that applied the MODIS data for the Amazonian region, the DT 3 km product was never applied and validated for the rainforest.
This study aims, therefore, to evaluate the local and regional application of AOD MODIS products for spatial resolutions of 3 km and 10 km (Dark Target algorithm) over different sites of the Amazon. In particular, the MODIS estimates against AERONET’s benchmark measurements on six Amazon sites were evaluated in addition to the quantification of AOD variations as a function of biomass burning records in the region.

2. Data and Methods

2.1. AERONET Data

AERONET is a global aerosol monitoring network, installed and maintained by NASA’s Earth Observing System (EOS) [12]. Its measurements allow near real-time monitoring of aerosol optical depth in several wavelengths, and a variety of aerosols’ physical and optical properties. Products provided by AERONET are freely available online at http://aeronet.gsfc.nasa.gov/ (accessed on 10 June 2019), which also contains specific information about the monitoring system. The network follows a protocol for data quality assurance, divided according to the level of processing, which varies between 1.0, 1.5, and 2.0. At level 2.0, which is the highest quality level, the data undergo a final calibration with corrections for local factors and earns a network certification. In this study, we prioritize the use of level 2.0 data. For the AOD analysis, we focused on the measurements taken on 500 nm, since this wavelength is commonly used because of its proximity to the MODIS estimates at 550 nm [31].
The Extinction Ångström Exponent (EAE) for the spectral range of 440–870 nm was used as a proxy of the spectral dependence of the AOD, which also allows the conversion of the AOD 500 nm to AOD 550 nm, which is the wavelength of MODIS products where the AODs are retrieved. The following equation was used for the AOD interpolation:
AOD 550   nm =   AOD 500   nm   ( 550 500 ) EAE
The sites considered in this study belong to the region known as the Brazilian Legal Amazon, herein referred to as the Legal Amazon, which comprises the Brazilian states of Amazonas, Acre, Rondônia, Roraima, Pará, Maranhão, Amapá, Tocantins, and Mato Grosso. AERONET data were extracted over the Abracos Hill (AH) and Ji Paraná (JP) sites in Rondônia, Alta Floresta (AF) and Cuiabá-MIRANDA (CM) in Mato Grosso, Manaus EMBRAPA (ME) in Amazonas, and Rio Branco (RB) in Acre (Figure 1). The analysis comprised a maximum period of 16 years, from 2002 to 2017, depending on the data availability in each site. Site locations are shown in Figure 1, and more information about them can be obtained elsewhere [32].

2.2. MODIS Data

MODIS is a spectroradiometer with 36 spectral bands, measuring light in the wavelength range from 0.4 to 41.2 µm, with three different spatial resolutions. Bands 1 and 2 have a spatial resolution of 250 m, bands 3 to 7 of 500 m, and the others with resolution of 1 km. Its orbit sweeps an imaging area of 2300 km, providing almost daily coverage of the Earth’s surface and atmosphere [33]. The 10 km and 3 km DT products have already been evaluated on regional and global scales, with expected errors spanning from 15 and 20%, respectively [14,16,34,35,36,37,38]. The AOD 550 nm retrieved by the DT algorithm has a spatial resolution of 3 and 10 km; data were downloaded from http://ladsweb.nascom.nasa.gov (accessed on 10 June 2019).
The DT algorithm has been applied to MODIS sensor data since 1999, when Terra satellite was launched. There are two DT algorithms, the first being used to retrieve aerosol information over the ocean and the second particularly over land. The algorithms have been continuously improved, periodically producing new collections of higher quality data. This study uses data from collection 6 (C6). The advantages of DT C6 is that it has better resolutions than in the previous collections, especially in clouds and smoke plume detection, with AOD data available for both 10 km [38] and 3 km [14,15] resolution standards.
The DT algorithm was originally developed for surface area with dark vegetation, where the measured reflectance at the top of the atmosphere is initially corrected for absorption by various gases before being arranged into the 10 km × 10 km (400 pixels) or 3 km × 3 km (36 pixels) area. The pixels are then processed to remove clouds, desert, snow/ice, and groundwater. Over land, 20% of the total darkest and 50% of the total brightest pixels are ignored. Finally, up to 11 (for 3 km) and 120 (for 10 km) pixels remain on which to perform aerosol retrieval by averaging their spectral reflectance. In addition to AOD values, other parameters associated with the recovery process, e.g., surface reflectance and cloud fraction, were archived in product files; these variables can be used to identify the original uncertainty during recovery and compare the two products [16].
This study uses data obtained from the Aqua satellite, which passes over the study areas at approximately 13:30 h (local time). The MODIS DT products, MYD04_L2 (Aqua) level 2, were obtained based on the physical locations of the AERONET radiometers. To match the instant AOD value provided by MODIS with the repeated measurements observed by AERONET, we followed the widely used method of averaging AERONET data within 30 min of MODIS pass time. Satellite data passes are placed with spatially averaged MODIS AODs within 5 × 5 pixels of the MODIS product 10 km from the AERONET site location. This record (shown in Figure 1) was also used for the extraction of the MODIS 3 km product. The MODIS data for an area of 50 km × 50 km were then used in the average calculation of the AOD and compared with the AERONET measurements and with each other [16]. Regarding the clippings of selected areas, the total number of pixels on each clipping ranged from 50 to 256 for the 3 km product and from 5 to 25 for the 10 km product. Only recoveries with minimum fractions above 30% were used of the total of each pixel on the clippings centered on the AERONET website [11].

2.3. Complementary Measurements

Data on fire spots over the Legal Amazon were used to complement the analysis of variations in AOD. Monthly data were obtained from the National Institute for Space Research (INPE), at https://queimadas.dgi.inpe.br/queimadas/portal (accessed on 1 July 2022) [39]. Measurements from the Aqua reference satellite were used (afternoon period) between 2002 and 2017. Table 1 shows the characteristics of the data used in this study. Although the fire records may not be representative of the instantaneous impacts, the overall monthly accumulated over the Legal Amazonia may be showing direct relationships between the records of fires and the regional elevations of AOD over the rainforest.

2.4. Statistical Evaluations

Through linear regression statistical models, the MODIS 3 km and 10 km AOD products were evaluated as a function of the AERONET 550 nm AOD reference measurements. The slope, intercept, and significance level were obtained for each site. The errors and the statistical significance of the MODIS DT AODs were also evaluated through metrics such as Root Mean Square Error (RMSE), Mean Absolute Error (MAE), Relative Mean Bias (RMB), the Pearson correlation coefficient (R), and the expected error (EE). The equations used to calculate the statistical parameters are shown below; procedures to obtain the quantities were performed similarly to Almazroui (2019) [23] and Che et al. [20]:
RMSE = 1 n i = 1 n ( MODIS ( i ) AERONET ( i ) ) 2 ,
MAE = 1 n i = 1 n ( | MODIS ( i )   AERONET ( i ) | ) ,
RMB = 1 n i = 1 n | MODIS ( i ) / AERONET ( i ) | ,
R = i = 1 n ( AERONET ( i ) AERONET ¯ ) ( MODIS ( i ) MODIS ¯ ) i = 1 n ( AERONET ( i ) AERONET ¯ ) 2 i = 1 n ( MODIS ( i ) MODIS ¯ ) 2 ,
Δ EE = ± ( 0.05 + 0.2   AOD   AERONET ) .
The monthly values calculated for the statistical parameters were used to assess the sensitivity of MODIS products for fire outbreaks in the Amazon.

3. Results

3.1. AOD MODIS Local Assessment for 3 and 10 km

The time series of the AERONET AOD and the MODIS DT 3 km and 10 km AOD are shown in Figure 2. All sites present an evident seasonality, which is already expected due to the impact of emissions from fires that occur in the dry season on the region [31,32,40]. In general, the maximum AOD values in all sites are directly related to the regional fire events. The high loads of aerosols emitted by the regional biomass burning that occurs in central and northern Brazil, in the region locally known as the deforestation arc [31], cover extensive areas over South America and can impact locations relatively distant from their origin emission [29,41,42,43,44,45].
Figure 2 also shows the data coverage for each site. For AH, the period in common between the AERONET data and the MODIS AODs is between the years 2002 to 2006, for JP, from 2006 to 2017, and for MN, from 2011 to 2017. For the other sites, these intervals cover the entire period of analysis from 2002 to 2017. The AOD magnitude values vary from site to site. For MN, the maximum AOD values of AERONET do not exceed 2.0. For 2015, particularly, the MODIS DT 10 km AOD recorded values above 2.5. The MN site in central Amazon is also influenced by fire events, but not with the same proportion as the other sites [32]. AOD magnitudes above 3.0 are typical for other sites [32]. The time series shows that the MODIS DT data for the maximum AOD values are slightly higher than the AERONET measurements. The AOD MODIS 3 km product is similar to the 10 km estimates, both in good agreement with the AERONET measurements.
A systematic evaluation of the MODIS DT AODs for each site was performed using linear regression models, which are shown in Figure 3, where the punctual measurements available on each site are represented. The regressions show similar behavior in practically all sites, and the regression lines show an overestimation of the AOD by both MODIS DT products. Figure 3 also shows that the linear fit varies from site to site. For MN, the R2 was 0.78 and 0.79 for the 3 km and 10 km products, respectively, while for AF, these values were 0.87 for both products. The differences between the fits may be associated with the aerosol model used and the possible differences in the characteristics of local aerosol sources [16]. During the dry season, all sites are influenced by regional Biomass Burning Aerosol (BBA); however, different land cover can affect properties in the aerosol emitted by the biomass burning and by different surface reflectances. There is also the possibility that regional and long-range transported aerosols influence the local characteristics of the atmosphere, which impacts the absorption and scattering processes of solar radiation by the particles. Palácios et al. [32] reported that the CM site is influenced both by local pasture burning and by aerosols from fires that occur to the north and northeast of this site, whereas the AF, JP, and AH sites are considerably close to the deforestation arc and are directly impacted by the fire events that take place in this region. A similar observation was obtained by Morais et al. [31].
The regression models in Figure 3 are complemented with the statistical parameters shown in Table 2, which show the RMSE, MAE, RMB, and R for each site. Table 2 also shows the number of observations for each regression point. The joint analysis of Figure 3 and Table 2 shows that the AOD MODIS 3 km and 10 km products present similar performances regarding the RMSE. However, the behavior of these estimates is different between the analyzed sites. For the AH, AF, RB, and JP sites, the slopes between the 3 km and 10 km products practically did not vary, whereas these values ranged drastically between the sites for the 3 km product, from 1.17 in AF to 1.46 in AH.
The statistical parameters shown in Table 2 do not show significant differences between the RMSE and the MAE for the 3 km and 10 km products. However, the RMB points to an overestimation of the 3 km product, compared to the 10 km one. The average difference in RMB between MODIS DT products was 22–35%. The correlation coefficients (R) reinforce the excellent agreement between the MODIS DT estimates and the AERONET reference measures, the values had minor variations between 0.87 and 0.94, and all comparisons had a significance level of p < 0.001. Slight variations in R between sites can also be associated with land cover (surface reflectance) and local aerosols properties. The products clearly varied from region to region [46]. The expected error (EE) shown in Figure 4 complemented the analysis of these spatial variations. The EE was calculated according to Remer et al. [14].
As shown in Figure 1, it is possible to attribute the main differences between the sites by the land use of the selected areas. The AH, AF, RB, and JP sites presented similar systematic errors, a fact justified by the land use in each site, with typical pasture vegetation, forest residues, and small urban regions. As for the MN site, there is a complex mix of landscapes that contain dense forest vegetation, a strong contribution from urbanization and water regions. The CM site, on the other hand, is composed mainly of non-forest features. According to Machado et al. [47], the metropolitan region of Cuiabá, 20 km from the AERONET CM site, is composed of a mosaic of urban buildings, agricultural plantations, pasture, and exposed soil.
Figure 4 shows the percentage of points that are between the EE for each site. According to Remer et al. (2013) [14], the products would have a good match if more than 66% of the points were within the limits of the EE. The results show that all values of EE for the 3 km product are below the expected limit of 66%. The MN site had the worst performance for the 3 km product, with 24.07% of the points satisfying the condition. The EE for the other sites varied between 49.15% (RB) and 61.86% (AF).
As for the MODIS DT 10 km product, the sites belonging to the deforestation arc showed similar behavior. AH had 64.84% of the points within the EE. AF, RB, and JP exceeded the minimum percentage, showing a good match, with 69.38, 71.34, and 67.40%, respectively. The performance for the 10 km at the MN and CM sites were unsatisfactory, with 48.57 and 47.05% of the points within the EE, respectively. On average, the MODIS DT 3 km product did not perform well for the Amazonian sites, with only 49.47% of the points within the limits of the EE, while the 10 km product had a satisfactory performance of 66.22% satisfying the criteria.
Here, we hypothesize that the 3 km product obtains radiometric detail with information on the smoke that AERONET cannot detect from the ground. The 10 km product looks better, not because the optical model has better physical parameters, but very likely because the average reflectance pattern is more homogeneous across the observed area. For instance, for the MAIAC product at 1 km, the disagreement with AERONET data could be more relevant, considering that the distribution of spot fires is quite heterogeneous for areas of 3, 10, and 1 km. Depending on the surface type, some aerosols will be invisible to MODIS, and others will stand out due to the complex relationship between the spatial and radiometric resolutions, a classic problem of remote sensing techniques.

3.2. AOD MODIS DT Regional Assessment

A general analysis of the MODIS DT products for the Amazonian region was performed in Figure 5a, which shows the time series of the integrated measurements of all sites for AOD AERONET and AOD MODIS DT 3 km and 10 km. The results show a similar seasonal behavior between the AERONET measurements and the MODIS DT estimates. Figure 5b shows the differences between the AERONET measurements and the MODIS DT 3 km and 10 km products, as well as the difference between the 3 km and 10 km products. The differences between AERONET with the 3 km and 10 km products indicate that the magnitudes vary more for the 3 km product. In this case, 92% of the differences are negative, with values reaching values lower than −1, evidencing the overestimation of the AOD for all atmospheric conditions. The differences between AERONET and the 10 km product are less pronounced, with values mainly ranging between 0 and −1. The differences between the 3 km and 10 km products can be attributed to different ways of estimating the algorithms [16], a fact also verified by Figure 5d.
Figure 5c shows the linear regression models between the AODs from AERONET and from MODIS DT 3 km and 10 km for the integrated set of observations, together with the statistical parameters, which are shown in Table 3. Although there is a large dispersion between the points, the R2 of the regressions were 0.72 and 0.69 for the 3 km and 10 km products, respectively, values with a significance level of p-value < 0.001. The linear fits in Figure 5c show that both MODIS DT products 3 and 10 km overestimate the AOD, where the slope of the fits are 1.12 and 1.04, respectively. In particular, the 3 km product overestimates about 12% more. Table 3 shows that, for the 3 km product, the RMB was 1.83, while for the 10 km product, it was 1.17. The statistical parameters show that the errors associated with both products are similar, with MAE of 0.13 and 0.11 and RMSE of 0.21 and 0.22 for the 3 km and 10 km products, respectively. As for the slope for the regressions, they were also similar, with differences less than 10%.
The linear regression in Figure 5d shows the relationship between the 3 km and 10 km products, which shows a good agreement between the estimates with an R² of 0.84 and a p-value < 0.001. The linear fit below the 1 × 1 line reinforces the larger magnitudes for the 3 km product. The low error values (Table 3) also reinforce the good agreement between the products; however, as will be discussed in detail later (Section 4), the differences between the retrieval algorithms and the variations of the analyzed surface can favor the differences in the estimation process, contributing to scattering observations for certain AOD values.

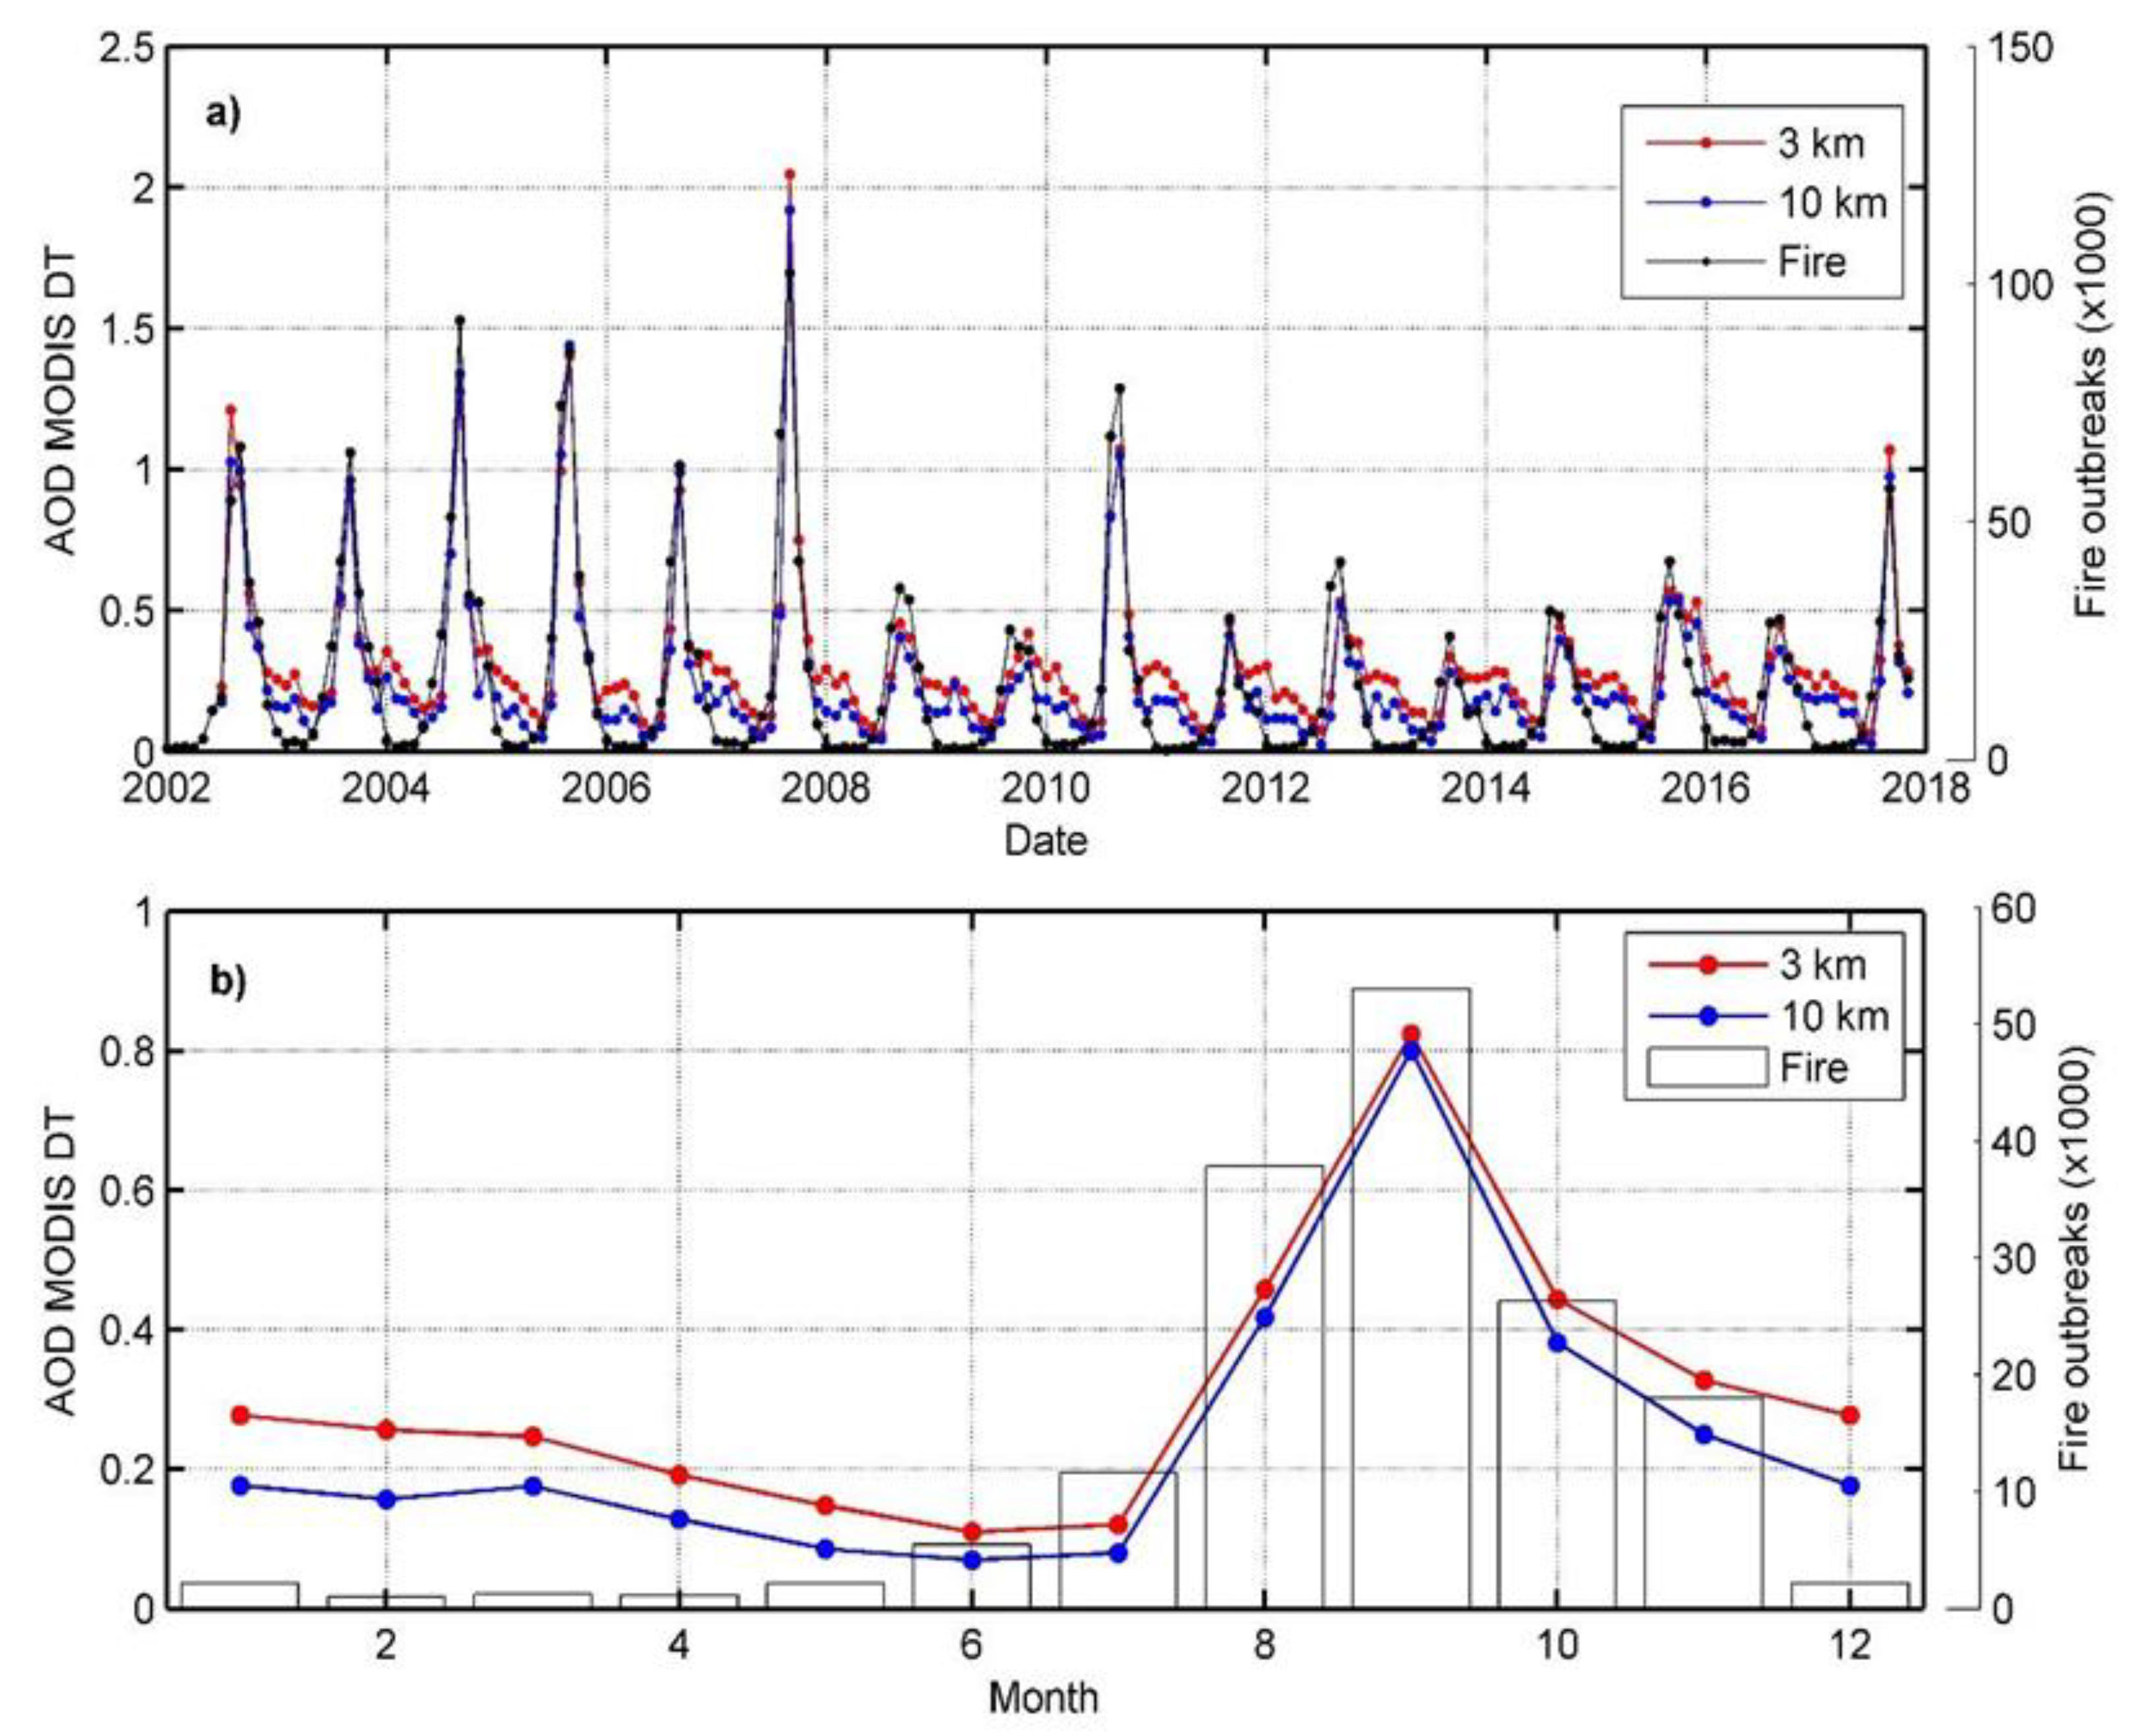
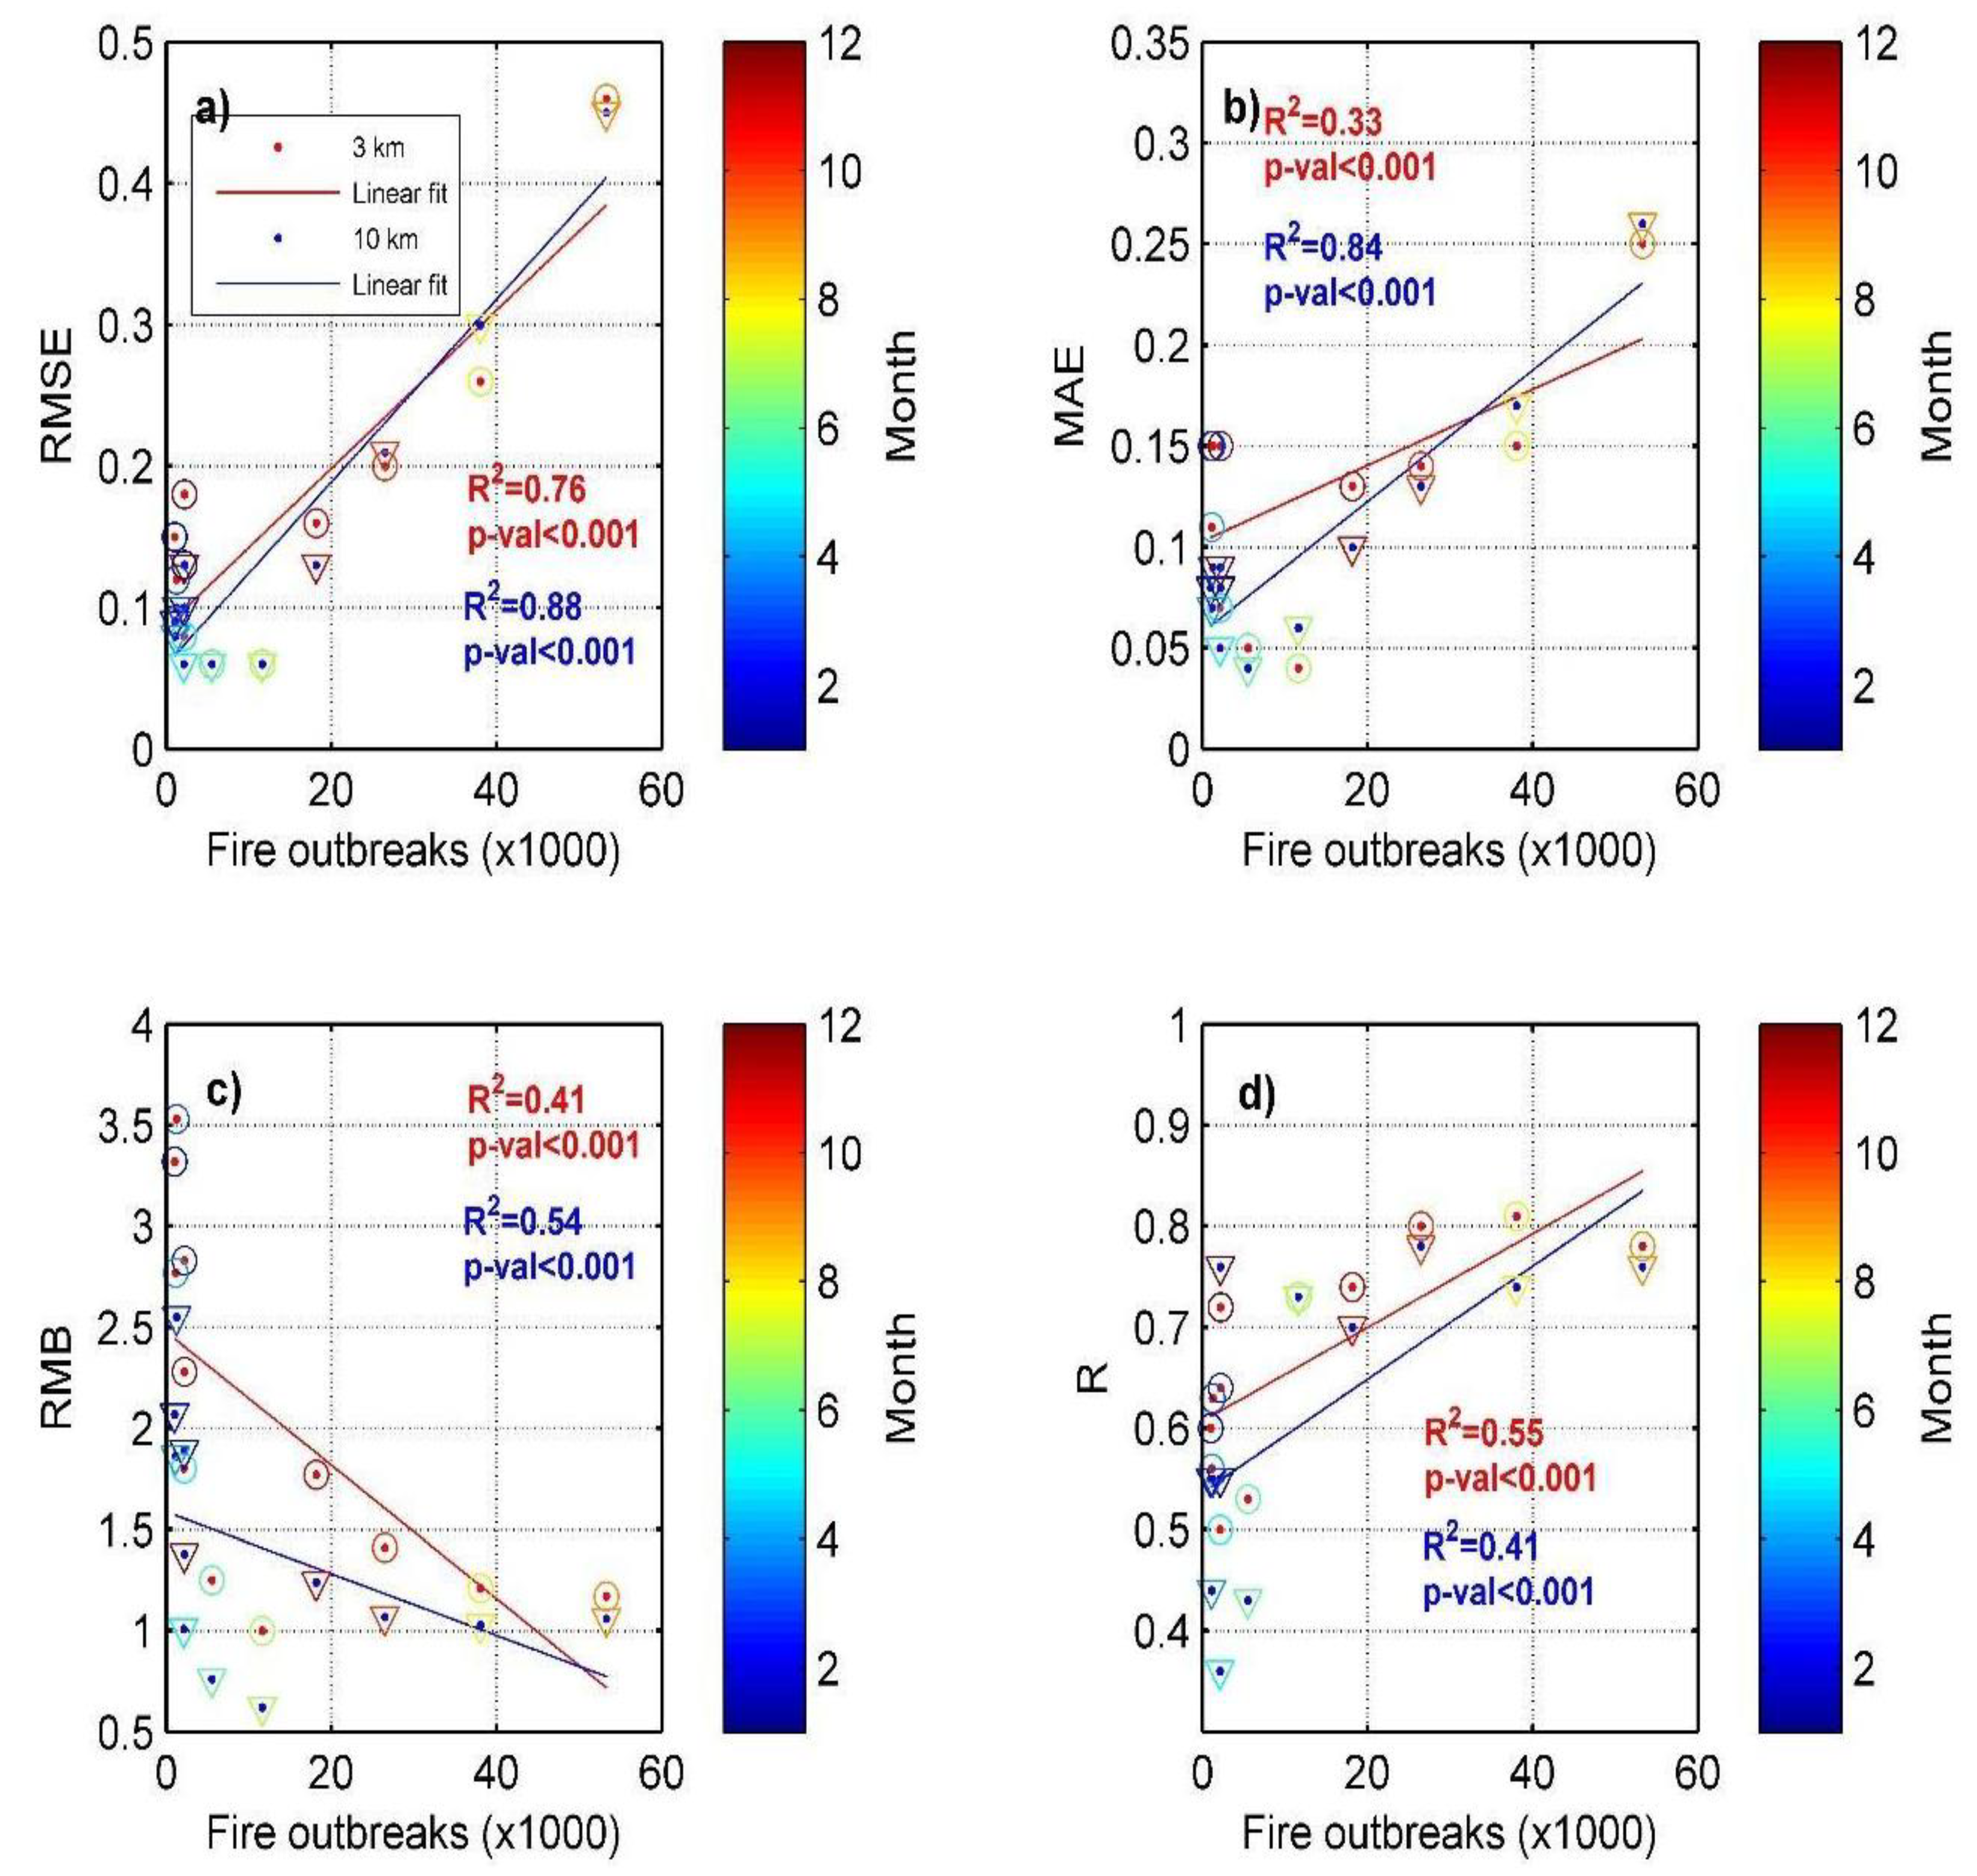
3.3. MODIS DT AOD Sensitivity to Fire Outbreaks

The AODs MODIS DT 3 km and 10 km for the Amazonian region were aggregated into monthly averages, shown in Figure 6a, which also shows the monthly cumulative for the fires over the Legal Amazon. The peaks show the characteristic seasonal behavior of the region. The AOD variations directly follow the fire outbreak records increase. Through the time series, it is possible to observe that monthly averages of AOD above 1.0 are recurrent for years in which fire records reach the 50,000 fire outbreaks. The time series also shows annual variations, where records of fires are more intense in the period from 2002 to 2007 and in different years such as 2010 and 2017, which is in accordance to what was reported by Morais et al. [31].
Seeking a direct relationship between the fire records and the AOD, we estimated the characteristic average year, as shown in Figure 6b, which shows the monthly average of hotspots accumulations and the monthly average of the AOD MODIS DT. The behavior shown in Figure 6b shows the increase in fire records in July. From June to July, the records of hotspots increased by approximately 50%. From June to September, when the occurrence of biomass burning is more pronounced, this percentage increases by about ten times, compared to the other periods. The increase in AOD presents a slight lag at the beginning of July but reaches its maximum in September, which is the same month where the fire occurrences have reached their maximum value. From October onwards, with the intensification of precipitation records in the region, the fire outbreaks and the AOD values decreased.
The errors associated with the AERONET comparisons were related to the average distribution of the monthly accumulated hotspots to assess the sensitivity of the AOD MODIS DT. Figure 7 shows the relationship between fire outbreaks with RMSE, MAE, RMB, and R. The statistical error parameters, RMSE and MAE (Figure 7a,b), showed a good linear relationship for the 10 km product (blue adjustment) with an R2 of 0.88 and 0.84, respectively. This result indicates that the increase in fire records explains approximately 90% of the rise in RMSE and MAE for the 10 km product. For the 3 km product (red adjustment), the linear relationship resulted in R2 of 0.76 and 0.33 for the RMSE and MAE, respectively. This indicates that the increase in fire records can explain the RMSE and MAE increases of approximately 87% and 58%, respectively, for the 3 km product. The comparison between the products shows that the 10 km estimate is more sensitive to changes in the fire records.
Regarding Figure 7c, the bias values have an inverse relationship with fire records. The R2 adjustments were 0.41 and 0.54 for the MODIS DT 3 km and 10 km products, respectively. The highest RMB values occur for low records of fires. Linear adjustments show that the MODIS DT 3 km product has the highest RMB values for conditions with few fire records, reaching values above 3.0. The slope of the fitted lines also shows the more significant overestimation of the 3 km product for low values of fire outbreaks. Figure 7d shows the linear relationship between the correlation coefficients (R) and the records of fire outbreaks. The linear fits were 0.55 and 0.41 for the MODIS DT 3 km and 10 km products, respectively. Although there is a large dispersion between the points, this adjustment indicates that the greater the number of fires, the greater the degree of correlation between the AERONET measurements and the MODIS DT estimates.

4. Discussion and Conclusions

The results of the local comparisons between the AOD of the AERONET measurements and the MODIS DT showed a good correlation for both products, 3 km and 10 km. This fact was already expected, since the 3 km product performs the same criteria for selecting and disposing unwanted pixels as the 10 km product [16]. However, variations are observed in the errors and in the percentage of points that fit within the limits of the expected error (EE). He et al. [16] and Che et al. [20] also pointed out that the crucial source of the differences between the 3 km and 10 km products is associated with surface reflectance estimates, and the essence of satellite recovery of aerosol properties is the separation between the surface reflectance and reflectance at the top of the atmosphere.
The differences between the products and the sites can be directly associated with the physical characteristics of the surfaces and the recovery methods of each product. The DT algorithm was initially developed for applications in dense vegetation [17], and due to geographic variations, climate, and anthropic activities, there may be differences between products at a regional level [11]. The difference between the 3 km and 10 km products is likely associated with the difference in spatial resolution, since for the 3 km, it maintains a more significant number of pixels, which can be representative of heterogeneous surfaces that make it difficult to estimate the surface reflectance. The accuracy of DT 10 km products on brighter surfaces is better compared to DT 3 km, and this is precisely due to the elimination of bright pixels in the selection process within a larger recovery box (10 km × 10 km), which are possibly selected during the 3 km product demarcation process [46]. Thus, according to Remer et al. (2013) [14], the DT 3 km product is noisier than the DT 10 km product.
DT products are generally recommended for highly vegetated regions, such as the Amazon rainforest [11]. However, the regional analysis showed that even in places such as MN, the influence of urbanized areas can influence the performance of these products, especially for the MODIS 3 km. However, we found similar results on the AH, AF, RB, and JP sites, with less contrast between the products. Underestimated surface reflectance values could cause an overestimation of AOD values, which is more evident in the 3 km product [11,16,46].
The CM site had the worst performance for all MODIS DT products. In this case, both products had an EE below 50% with RMB values around 1.0 and 0.8 for the 3 km and 10 km products, respectively, showing a slight underestimation of the AOD compared to the AERONET. In addition to the different physical properties of the surface, since this site has predominant characteristics of cerrado vegetation, this underestimation is likely related to the selection of the aerosol model by the DT algorithms. In fact, the absorption processes at this site are different from the others [32]. The mixture of regional emissions from forest burning with emissions from burning of cerrado vegetation in the dry season can be the factor responsible for a negative bias, indicating low absorption in the aerosol models. Another possible reason to be considered is the big variety of the soil cover. Machado et al. (2020) [47] identified a mixture of forest vegetation, savannah, and urban constructions in the limits of analysis of this site. In addition, the classic method used here to compare AERONET measurements with MODIS products uses the averages of AERONET measurements in the 30 min interval of the satellite passage, which can also lead to inaccuracies related to the simultaneous measurement [48].
The general evaluation of the integrated data for the Amazon region represented an average general behavior of the analyzed sites, and the degree of correlation was satisfactory for both products (R > 0.80); however, only the DT 10 km product presented the expected performance with EE above 66%. For the same reasons mentioned above, in the regional analysis of the sites, the 3 km product overestimated the AOD by only 49.47% within the EE. These results allow us to state that the DT 10 km product is more accurate and better represents spatial variations at a regional level, and similar results were found for sites in China [16,46].
It was verified, through the monthly averages, that in the Amazon, the direct impact of biomass burning (Figure 7b) and the errors in the MODIS DT estimates also have a direct relationship with the burning records. For the months from December to June, with lower records of burning, both products considerably overestimated the AOD values with RMB values ranging from 1.0 to 3.5 for the 3 km product and from 0.6 to 2.5 for the 10 km product; the magnitude of the variations may be related to contributions from the CM site, further south of the Amazon basin. For these same months, the correlation also varies considerably (R = 0.3 to 0.75). However, with the increase in fire records, the overestimation decreases, and the correlation coefficients increase from July onwards. Although the linear relationships for these statistical parameters are not excellent, with R² < 0.6 for RMB (Figure 7c,d), they are highly significant (p-value < 0.001). In this case, the increase in fire records in the Amazon could explain, on average, 70% of the decrease in overestimation and 70% of the rise in the correlation between AERONET measurements and MODIS DT estimates.
In general, this study evaluates the local and regional performance of the AOD MODIS C6 estimates, using the Dart Target algorithm for a spatial resolutions of 3 km and 10 km over the Amazon. The calculations were performed in comparison with AERONET’s reference measures on six sites of the Legal Amazonia between the years 2002 to 2017. The MODIS DT 10 km product presented a satisfactory performance in most of the analyzed sites and on the integrated data set in the Amazon, with 66.22% of the observations within the limits of the expected error (EE). However, the EE was not satisfactory for the MN and CM sites. These variations may be related to the influence of the urbanized area from Manaus and the choice of the aerosol model parameters for CM. The product MODIS DT 3 km did not present satisfactory performance for any site analyzed, with the worst performance on the MN site, of 24.07% within the EE. For Amazon, the EE of the 3 km product was 49.47%. The main variations were associated with the difficulty in determining the surface reflectance.
We verified that the underestimation of surface reflectance, mainly due to urbanization influences, causes an overestimation of the AOD in both products. In general, the 10 km DT overestimated the AOD by 17%, and the 3 km DT by approximately 80%. The increase in fire records from June to September causes an increase of approximately 80% in AOD values. The statistical comparison of AERONET vs. MODIS DT showed that the overestimation is statistically higher for low fire records, i.e., AOD AERONET values < 0.1. The correlation between the MODIS DT estimates improved considerably for high fire records, with AOD AERONET values above 0.5. The correlation between the MODIS DT estimates improved considerably for high burn records, with AOD AERONET values above 0.5. In summary, this work showed that the AOD MODIS performed well, DT 3 km has large dispersion, probably because it describes the spatial variability, we can parameterize AOD based on a number of fires, and the error is sensitive to the number of fires, probably because the sensor is saturated.
This study, therefore, opens discussions on new methods and analyses for evaluating the performance and applicability of MODIS products for Amazonia. In a future perspective, MODIS DT products need to be evaluated in terms of surface reflectance, mainly the 3 km product. We also emphasize that alternative techniques on the selection of the analyzed area should be applied as well as the comparison between the DT and DB products (not shown here). Land cover use can be a fundamental parameter in the evaluation of MODIS 3 km, verifying the effectiveness of each product on different surface reflectance’s and different local aerosol optical.

Author Contributions

R.P., A.G.C.P., L.R.C.B., M.A.F. and D.C.S.N. equally contributed to this study. Conceptualization, R.P., D.C.S.N., T.R.R., J.M. and M.S.B.; methodology, R.P., A.G.C.P., L.R.C.B., P.d.S.R. and D.C.S.N.; software, R.P., M.A.F. and F.G.M.; validation, R.P., A.G.C.P., L.R.C.B., L.F.A.C. and D.C.S.N.; formal analysis, R.P., F.G.M., G.C. and M.A.F.; investigation, R.P., A.G.C.P., L.R.C.B., F.G.M., L.V.R., L.A.T.M. and M.A.F.; resources, P.A., E.L., T.R.R. and M.S.B.; data curation, R.P. and D.C.S.N.; writing—original draft preparation, R.P., D.C.S.N., F.G.M. and M.A.F.; writing—review and editing, all authors; supervision, P.A. and E.L.; project administration, R.P. All authors have read and agreed to the published version of the manuscript.

Funding

This study was supported by the Fundação de Amparo à Pesquisa do Pará, FAPESPA, project 2022/43638 and São Paulo Research Foundation, FAPESP, grant number 2021/13610-8.

Institutional Review Board Statement

Not applicable.

Informed Consent Statement

Not applicable.

Data Availability Statement

The AERONET website provides data analysis and dissemination tools at https://aeronet.gsfc.nasa.gov (accessed on 10 June 2019). Data can be viewed in charts using the data display interface, acquired using the data download tool, analyzed, and downloaded using some analysis tools provided by AERONET. The NASA LAADS website provides data analysis and dissemination tools at http://ladsweb.nascom.nasa.gov (accessed on 10 June 2019). The INPE website provides data analysis and dissemination tools at https://queimadas.dgi.inpe.br/queimadas/portal (accessed on 1 July 2022).

Acknowledgments

The authors thank the field researchers and technicians Delano Campos, Bruno Takeshi, Edilson Andrade, Alberto W. Dresch, João Basso, Paulo Arruda, and Alejandro Fonseca Duarte for maintenance and operation of the NASA/AERONET network over so many years. The authors also thank Brent Holben and Joel Schafer for their support on the maintenance of the AERONET network.

Conflicts of Interest

The authors declare no conflict of interest.

References

  1. IPCC. Climate Change 2013-The Physical Science Basis: Contribution of Working GroupI to the Fifth Assessment Report of the Intergovernmental Panel on Climate Change; Stocker, T.F., Qin, D., Plattner, G.K., Tignor, M., Allen, S.K., Boschung, J., Nauels, A., Xia, Y., Bex, V., Midgley, P.M., Eds.; Cambridge University Press: Cambridge, UK; New York, NY, USA, 2013.
  2. Boucher, O.; Randall, A.D.; Bretherton, P.; Feingold, C.; Forster, G.; Kerminen, P.; Kondo, V.M.; Liao, Y.; Lohmann, H.; Rasch, U.; et al. Clouds and aerosols in climate change 2013. In The Physical Science Basis. Contribution of Working Group I to the Fifth Assessment Report of the Intergovernmental Panel on Climate Change; Cambridge University Press: Cambridge, UK; New York, NY, USA, 2013. [Google Scholar]
  3. Kumar, M.; Raju, M.P.; Singh, R.S.; Banerjee, T. Impact of drought and normal monsoon scenarios on aerosol induced radiative forcing and atmospheric heating in Varanasi over middle Indo-Gangetic Plain. J. Aerosol Sci. 2017, 113, 95–107. [Google Scholar] [CrossRef]
  4. Kumar, K.R.; Sivakumar, V.; Yin, Y.; Reddy, R.R.; Kang, N.; Diao, A.J.A.; Yu, X. Long-term (2003–2013) climatological trends and variations in aerosol optical parameters from MODIS over three stations in South Africa. Atmos. Environ. 2014, 95, 400–408. [Google Scholar] [CrossRef]
  5. Kang, N.; Kumar, K.R.; Hu, K.; Yu, X.; Yin, Y. Long-term (2002–2014) evolution and trend in Collection 5.1 Level-2 aerosol products derived from the MODIS and MISR sensors over the Chinese Yangtze River Delta. Atmos. Res. 2016, 181, 29–43. [Google Scholar] [CrossRef]
  6. Rizzo, L.V.; Artaxo, P.; Müller, T.; Wiedensohler, A.; Paixão, M.; Cirino, G.G.; Arana, A.; Swietlicki, E.; Roldin, P.; Fors, E.O.; et al. Long term measurements of aerosol optical properties at a primary forest site in Amazonia. Atmos. Chem. Phys. 2013, 13, 2391–2413. [Google Scholar] [CrossRef] [Green Version]
  7. Feng, L.; Palmer, P.I.; Bösch, H.; Parker, R.J.; Webb, A.J.; Correia, C.S.C.; Deutscher, N.M.; Domingues, L.G.; Feist, D.G.; Gatti, L.V.; et al. Consistent regional fluxes of CH4 and CO2 inferred from GOSAT proxy XCH4:XCO2 retrievals, 2010–2014. Atmos. Chem. Phys. 2017, 17, 4781–4797. [Google Scholar] [CrossRef] [Green Version]
  8. Thornhill, G.D.; Collins, W.J.; Kramer, R.J.; Olivié, D.; Skeie, R.B.; O’Connor, F.M.; Abraham, N.L.; Checa-Garcia, R.; Bauer, S.E.; Deushi, M.; et al. Effective radiative forcing from emissions of reactive gases and aerosols–a multi-model comparison. Atmos. Chem. Phys. 2021, 21, 853–874. [Google Scholar] [CrossRef]
  9. Artaxo, P.; Hans-Christen, H.; Meinrat, O.A.; Jaana, B.; Alves, E.G.; Barbosa, H.M.J.; Bender, F.; Bourtsoukidis, E.; Carbone, S.; Chi, J.; et al. Tropical and Boreal Forest-Atmosphere Interactions: A Review. Tellus B Chem. Phys. Meteorol. 2022, 74, 24–163. [Google Scholar] [CrossRef]
  10. Bond, T.C.; Doherty, S.J.; Fahey, D.W.; Forster, P.M.; Berntsen, T.; DeAngelo, B.J.; Flanner, M.G.; Ghan, S.; Kärcher, B.; Koch, D.; et al. Bounding the role of black carbon in the climate system: A scientific assessment. J. Geophys. Res. Atmos. 2013, 118, 5380–5552. [Google Scholar] [CrossRef]
  11. Wei, J.; Li, Z.; Peng, Y.; Sun, L. MODIS Collection 6.1 aerosol optical depth products over land and ocean: Validation and comparison. Atmos. Environ. 2019, 201, 428–440. [Google Scholar] [CrossRef]
  12. Holben, B.; Eck, T.F.; Slutsker, I.; Tanré, D.; Buis, J.P.; Setzer, A.; Vermote, E.; Reagan, J.A.; Kaufman, Y.; Nakajima, T.; et al. AERONET-A Federated Instrument Network and Data Archive for Aerosol Characterization. Remote Sens. Environ. 1998, 66, 1–16. [Google Scholar] [CrossRef]
  13. Cao, C.; Zheng, S.; Singh, R.P. Characteristics of aerosol optical properties and meteorological parameters during three major dust events (2005–2010) over Beijing, China. Atmos. Res. 2014, 150, 129–142. [Google Scholar] [CrossRef]
  14. Remer, L.; Mattoo, S.; Levy, R.; Munchak, L. MODIS 3 km aerosol product: Algorithm and global perspective. Atmos. Meas. Tech. 2013, 6, 1829–1844. [Google Scholar] [CrossRef] [Green Version]
  15. Munchak, L.; Levy, R.; Mattoo, S.; Remer, L.; Holben, B.; Schafer, J.; Hostetler, C.; Ferrare, R. MODIS 3 km aerosol product: Applications over land in an urban/suburban region. Atmos. Meas. Tech. 2013, 6, 1747–1759. [Google Scholar] [CrossRef] [Green Version]
  16. He, Q.; Zhang, M.; Huang, B.; Tong, X. MODIS 3 km and 10 km aerosol optical depth for China: Evaluation and comparison. Atmos. Environ. 2017, 153, 150–162. [Google Scholar] [CrossRef]
  17. Kaufman, Y.J.; Tanre, D.; Remer, L.A.; Vermote, E.F.; Chu, A.; Holben, B.N. Operational remote sensing of tropospheric aerosol over land from EOS moderate resolution imaging spec-troradiometer. J. Geophys. Res. 1997, 102, 17051–17067. [Google Scholar] [CrossRef]
  18. Hsu, N.C.; Tsay, S.C.; King, M.C.; Herman, J.R. Deep Blue Retrievals of Asian Aerosol Properties During ACE-Asia. IEEE Trans. Geosci. Remote Sens. 2006, 44, 3180–3195. [Google Scholar] [CrossRef]
  19. Loría-Salazar, S.M.; Holmes, H.A.; Patrick Arnott, W.; Barnard, J.C.; Moosmüller, H. Evaluation of MODIS columnar aerosol retrievals using AERONET in semi-arid Nevada and California, U.S.A., during the summer of 2012. Atmos. Environ. 2016, 144, 345–360. [Google Scholar] [CrossRef]
  20. Che, H.; Yang, L.; Liu, C.; Xia, X.; Wang, Y.; Wang, H.; Wang, H.; Lu, X.; Zhang, X. Long-term validation of MODIS C6 and C6.1 Dark Target aerosol products over China using CARSNET and AERONET. Chemosphere 2019, 236, 124268. [Google Scholar] [CrossRef] [PubMed]
  21. Lanzaco, B.L.; Olcese, L.E.; Palancar, G.G.; Toselli, B.M. A Method to Improve MODIS AOD Values: Application to South America. Aerosol Air Qual. Res. 2016, 16, 1509–1522. [Google Scholar] [CrossRef] [Green Version]
  22. Pérez-Ramírez, D.; Andrade, M.; Eck, T.; Stein, A.; O’Neill, N.; Lyamani, H.; Gassó, S.; Whiteman, D.N.; Veselovskii, I.; Velarde, F.; et al. Multi year aerosol characterization in the tropical Andes and in adjacent Amazonia using AERONET measurements. Atmos. Environ. 2017, 166, 412–432. [Google Scholar] [CrossRef]
  23. Almazroui, M. A comparison study between AOD data from MODIS deep blue collections 51 and 06 and from AERONET over Saudi Arabia. Atmos. Res. 2019, 225, 88–95. [Google Scholar] [CrossRef]
  24. Estevana, R.; Martínez-Castroa, D.; Suarez-Salasa, L.; Moyaa, A.; Silvaa, Y. First two and a half years of aerosol measurements with an AERONET sunphotometer at the Huancayo Observatory, Peru. Atmos. Environ. X 2019, 3, 100037. [Google Scholar] [CrossRef]
  25. Giglio, L.; Schroeder, W.; Justice, C.O. The collection 6 MODIS active fire detection algorithm and fire products. Remote Sens. Environ. 2016, 178, 31–41. [Google Scholar] [CrossRef] [PubMed] [Green Version]
  26. Shi, H.; Xiaoa, Z.; Zhana, X.; Mab, H.; Tiana, X. Evaluation of MODIS and two reanalysis aerosol optical depth products over AERONET sites. Atmos. Res. 2019, 220, 75–80. [Google Scholar] [CrossRef]
  27. Martins, V.S.; Lyapustinb, A.; Wangb, Y.; Gilesd, D.M.; Smirnovd, A.; Slutskerd, I.; Korkine, S. Global validation of columnar water vapor derived from EOS MODIS-MAIAC algorithm against the ground-based AERONET observations. Atmos. Res. 2019, 225, 181–192. [Google Scholar] [CrossRef] [Green Version]
  28. Sena, E.T.; Artaxo, P.; Correia, A.L. Spatial variability of the direct radiative forcing of biomass burning aerosols and the effects of land use change in Amazonia. Atmos. Chem. Phys. 2013, 13, 1261–1275. [Google Scholar] [CrossRef] [Green Version]
  29. Cirino, G.G.; Souza, R.F.A.; Adams, K.D.; Artaxo, P. The effect of atmospheric aerosol particles and clouds on net ecosystem exchange in the Amazon. Atmos. Chem. Phys. 2014, 14, 6523–6543. [Google Scholar] [CrossRef] [Green Version]
  30. Wang, Y.; Yuan, Q.; Shen, H.; Zheng, L.; Zhang, L. Investigating multiple aerosol optical depth products from MODIS and VIIRS over Asia: Evaluation, comparison, and merging. Atmos. Environ. 2020, 230, 117548. [Google Scholar] [CrossRef]
  31. Morais, F.G.; Franco, M.A.; Palácios, R.; Machado, L.A.T.; Rizzo, L.V.; Barbosa, H.M.J.; Jorge, F.; Schafer, J.S.; Holben, B.N.; Landulfo, E.; et al. Relationship between Land Use and Spatial Variability of Atmospheric Brown Carbon and Black Carbon Aerosols in Amazonia. Atmosphere 2022, 13, 1328. [Google Scholar] [CrossRef]
  32. Palácios, R.S.; Romera, K.S.; Curado, L.F.A.; Banga, N.M.; Rothmund, L.D.; Sallo, F.S.; Morais, D.; Santos, A.C.A.; Moraes, T.J.; Morais, F.G.; et al. Long Term Analysis of Optical and Radiative Properties of Aerosols in the Amazon Basin. Aerosol Air Qual. Res. 2020, 20, 139–154. [Google Scholar] [CrossRef]
  33. Cheng, T.; Chen, H.; Gu, X.; Yu, T.; Guo, J.; Guo, H. The inter-comparison of MODIS, MISR and GOCART aerosol products againstAERONET data over China. J. Quant. Spectrosc. Radiat. Transf. 2012, 113, 2135–2145. [Google Scholar] [CrossRef]
  34. Levy, R.C.; Mattoo, S.; Munchak, L.A.; Remer, L.A.; Sayer, A.M.; Patadia, F.; Hsu, N.C. The Collection 6 MODIS aerosol products overland and ocean. Atmos. Meas. Tech. 2013, 6, 2989–3034. [Google Scholar] [CrossRef] [Green Version]
  35. Nichol, J.E.; Bilal, M. Validation of MODIS3 km resolution aerosol optical depth retrieval over Asia. Remote Sens. 2016, 8, 328. [Google Scholar] [CrossRef] [Green Version]
  36. Levy, R.C.; Remer, L.A.; Dubovik, O. Global aerosol optical properties and application to Moderate Resolution Imaging Spectroradiometer aerosol retrieval over land. J. Geophys. Res. 2007, 112, 2156–2202. [Google Scholar] [CrossRef] [Green Version]
  37. Remer, L.A.; Kleidman, R.G.; Levy, R.C.; Kaufman, Y.J.; Tanré, D.; Mattoo, S.; Martins, J.V.; Ichoku, C.; Koren, I.; Yu, H.; et al. Global aerosol climatology from the MODIS satellite sensors. J. Geophys. Res. Atmos. 2008, 113, D14S07. [Google Scholar] [CrossRef] [Green Version]
  38. Remer, L.A.; Kaufman, Y.J.; Tanré, D.; Mattoo, S.; Chu, D.A.; Martinset, J.V.; Li, R.R.; Ichoku, C.; Levy, R.C.; Kleidman, R.G.; et al. The MODIS aerosol algorithm, products and validation. J. Atmos. Sci. 2005, 62, 947–973. [Google Scholar] [CrossRef] [Green Version]
  39. INPE. Instituto Nacional de Pesquisas Espaciais. Portal do Monitoramento de Queimadas e Incêndios Florestais; INPE: Cuiaba, Brazil, 2020. Available online: http://www.inpe.br/queimadas (accessed on 10 June 2019).
  40. Artaxo, P.; Rizzo, L.V.; Brito, J.F.; Barbosa, H.M.J.; Arana, A.; Sena, E.T.; Cirino, G.G.; Bastos, W.; Martin, S.T.; Andreae, M.O. Atmospheric aerosols in Amazonia and land use change: From natural biogenic to biomass burning conditions. Faraday Discuss. 2013, 165, 203–235. [Google Scholar] [CrossRef] [PubMed] [Green Version]
  41. Artaxo, P.; Martins, J.V.; Yamasoe, M.A.; Procopio, A.S.; Pauliquevis, T.M.; Andreae, M.O.; Guyon, P.; Gatti, L.V.; Leal, A.M.C. Physical and chemical properties of aerosols in the wet and dry seasons in Rondonia, Amazonia. J. Geophys. Res. Atmos. 2002, 107, LBA 49-1–LBA 49-14. [Google Scholar] [CrossRef]
  42. Procopio, A.S.; Artaxo, P.; Kaufman, Y.J.; Remer, L.A.; Schafer, J.S.; Holben, B.N. Multiyear analysis of amazonian biomass burning smoke radiative forcing of climate. Geophys. Res. Lett. 2004, 31, L03108. [Google Scholar] [CrossRef]
  43. Fuzzi, S.; Decesari, S.; Facchini, M.C.; Cavalli, F.; Emblico, L.; Mircea, M.; Andreae, M.O.; Trebs, I.; Hoffer, A.; Guyon, P.; et al. Overview of the inorganic and organic composition of size-segregated aerosol in Rondônia, Brazil, from the biomass-burning period to the onset of the wet season. J. Geophys. Res. 2007, 112, D01201. [Google Scholar] [CrossRef]
  44. Martin, S.T.; Andreae, M.O.; Althausen, D.; Artaxo, P.; Baars, H.; Borrmann, S.; Chen, Q.; Farmer, D.K.; Guenther, A.; Gunthe, S.S.; et al. An overview of the Amazonian Aerosol Characterization Experiment 2008 (AMAZE-08). Atmos. Chem. Phys. 2010, 10, 11415–11438. [Google Scholar] [CrossRef] [Green Version]
  45. Davidson, E.A.; Araujo, A.C.; Artaxo, P.; Balch, J.K.; Brown, I.F.; Bustamante, M.M.C.; Coe, M.T.; Defries, R.S.; Keller, M.; Longo, M.; et al. The Amazon basin in transition. Nature 2012, 481, 321–328. [Google Scholar] [CrossRef] [PubMed]
  46. Mhawisha, A.; Banerjeea, T.; Brodayc, D.M.; Misrad, A.; Tripathid, S.N. Evaluation of MODIS Collection 6 aerosol retrieval algorithms over Indo-Gangetic Plain: Implications of aerosol types and mass loading. Remote Sens. Environ. 2017, 201, 297–313. [Google Scholar] [CrossRef]
  47. Machado, N.G.; Biudes, M.S.; Angelini, L.P.; Santos, C.A.S.; Silva, P.C.B. Impact of changes in surface cover on energy balance in a tropical city by remote sensing: A study case in Brazil. Remote Sens. Appl. Soc. Environ. 2020, 20, 100373. [Google Scholar] [CrossRef]
  48. Chang, I.; Gao, L.; Burton, S.P.; Chen, H.; Diamond, M.S.; Ferrare, R.A.; Flynn, C.J.; Kacenelenbogen, M.; LeBlanc, S.E.; Meyer, K.G.; et al. Spatiotemporal Heterogeneity of Aerosol and Cloud Properties Over the Southeast Atlantic: An Observational Analysis. Geophys. Res. Lett. 2021, 48, e2020GL091469. [Google Scholar] [CrossRef]
Figure 1. Site locations considered in this study. The red stars represent AERONET sites and the dashed area is the Legal Amazon. The acronyms represent the sites, where AH is Abracos Hill, AF is Alta Floresta, RB is Rio Branco, JP is Ji Parana, MN is Manaus, and CM is Cuiabá Miranda. The figure also shows the 50 km × 50 km clippings from which the MODIS 3 km and 10 km estimates were extracted on each site, as well as the land use in these regions.
Atmosphere 13 01742 g001
Figure 2. Time series AOD AERONET AOD and MODIS DT 3 km and 10 km for the analyzed sites: (a) Abracos Hill, (b) Alta Floresta, (c) Rio Branco, (d) Ji Paraná, (e) Manaus, and (f) Cuiabá Miranda.
Atmosphere 13 01742 g002
Figure 3. Linear regression models obtained between AOD from AERONET and from MODIS DT 3 km and 10 km (where the punctual measurements available on each site are represented): (a) Abracos Hill, (b) Alta Floresta, (c) Rio Branco, (d) Ji Paraná, (e) Manaus, and (f) Cuiabá Miranda. All models were statistically significant, with p-value < 0.001.
Atmosphere 13 01742 g003
Figure 4. Bar plot showing the percentage of observations that are within the expected error (EE), estimated by the following equation 6 for each site. The dotted line represents the 66% mark, considered the minimum percentage for the product to have a good performance.
Atmosphere 13 01742 g004
Figure 5. (a) Time series of AODs obtained by AERONET, MODIS DT 3 km, and MODIS DT 10 km for all analyzed sites. (b) Difference between the AODs obtained by AERONET and all MODIS DT data. (c) Linear regression with the integrated measurements of all sites for the AERONET AOD measurements and the MODIS DT 3 km and 10 km products. The dashed line represents the x = y line. (d) Linear regression between the AOD products MODIS DT 3 km and 10 km.
Atmosphere 13 01742 g005
Figure 6. (a) Time series of integrated AOD measurements for MODIS DT 3 km and 10 km products (monthly average) and records of fire outbreaks over the Legal Amazon. (b) Characteristic year with average values for MODIS DT 3 km and 10 km products and records of fire outbreaks.
Atmosphere 13 01742 g006
Figure 7. The plots show the linear regression between the mean values of fire outbreaks and the monthly statistical parameters (characteristic year) of the regressions between AERONET and MODIS DT. (a) RMSE—Root Mean Square Error, (b) MAE—mean absolute error, (c) RMB—relative mean bias, and (d) R—the correlation coefficient. The color outlines inform the month of each regression point.
Atmosphere 13 01742 g007
Table 1. Overview of the products used in this study, where SR stands for spatial resolution and QA is the quality assurance.
DataProduct/Description/AcronymSR
AERONETAOD 500 nm/V3 Levell 2.0/AOD AERONET-
EAE 440–870 nm/V3 Level 2.0/EAE-
MODIS (AOD 550 nm)DT MYD04_L2/QA = 3 Level 2.0 (AOD MODIS 3 km)3 km
DT MYD04_L2/QA = 3 Level 2.0 (AOD MODIS 10 km)10 km
INPEFire Spot/QA 1 km/HS1 km
Table 2. Statistical parameters calculated for the linear regression models between AOD AERONET and AOD MODIS DT 3 km and 10 km: Amount (N) of observations of the AERONET and MODIS pairs used in all calculations; Root Mean Square Error (RMSE); Mean Absolute Error (MAE); Relative Mean Bias (RMB) and Correlation coefficient. AH—Abracos Hill, AF—Alta Floresta, RB—Rio Branco, JP—Ji Paraná, MN—Manaus, CM—Cuiabá Miranda. The table also shows the relative difference between the parameters of the 3 km and 10 km products.
3 km10 kmRelative Difference (%)
SiteNRMSEMAERMBRNRMSEMAERMBRRMSEMAERMBR
AH2610.300.201.590.901280.270.181.230.921010222
AF15350.180.111.270.939210.200.100.920.93109270
RB11170.160.121.820.916350.150.091.180.94625353
JP10630.180.131.710.936390.190.101.120.94623341
MN4320.100.142.330.891050.060.081.730.874043262
CM18340.150.101.000.8713410.120.100.720.88100281
Table 3. Statistical parameters calculated for the linear regression model (shown in Figure 6c,d) between the integrated measures of all sites, AOD AERONET × AOD MODIS DT 3 km, AOD AERONET × AOD MODIS DT 10 km, and AOD MODIS DT 3 km × AOD MODIS DT 10 km. N—Number of observations, a—slope, b—intercept, R²—coefficient of determination, RMSE—root mean square error, MAE—mean absolute error, and RMB—relative mean bias.
ParametersAERONET × 3 kmAERONET × 10 km3 km × 10 km
N428131983525
a1.121.040.91
b0.0080.0090.005
0.720.690.84
RMSE0.210.220.16
MAE0.130.110.008
RMB1.831.170.80
p-value<0.001<0.001<0.001
Publisher’s Note: MDPI stays neutral with regard to jurisdictional claims in published maps and institutional affiliations.

