


Advanced Oxidation Processes to Reduce Odor Emissions from Municipal Wastewater—Comprehensive Studies and Technological Concepts


Abstract
:1. Introduction
2. Materials and Methods
2.1. Initial Assumptions of the Experiment
2.2. Study Design
- -
- stage 1 (S1)—Fe2+ in the form of FeSO4 · 6H2O and hydrogen peroxide (H2O2) in the form of 30% perhydrol solution—Fenton reaction;
- -
- stage 2 (S2)—Fe2+ in the form of Fe2(SO4)3 and hydrogen peroxide (H2O2) in the form of 30% perhydrol solution—Fenton-like reaction;
- -
- stage 3 (S3)—hydrogen peroxide (H2O2) in the form of 30% perhydrol solution;
- -
- stage 4 (S4)—Fe2+ in the form of FeSO4 · 6H2O;
- -
- stage 5 (S5)—Fe2+ in the form of Fe2(SO4)3.
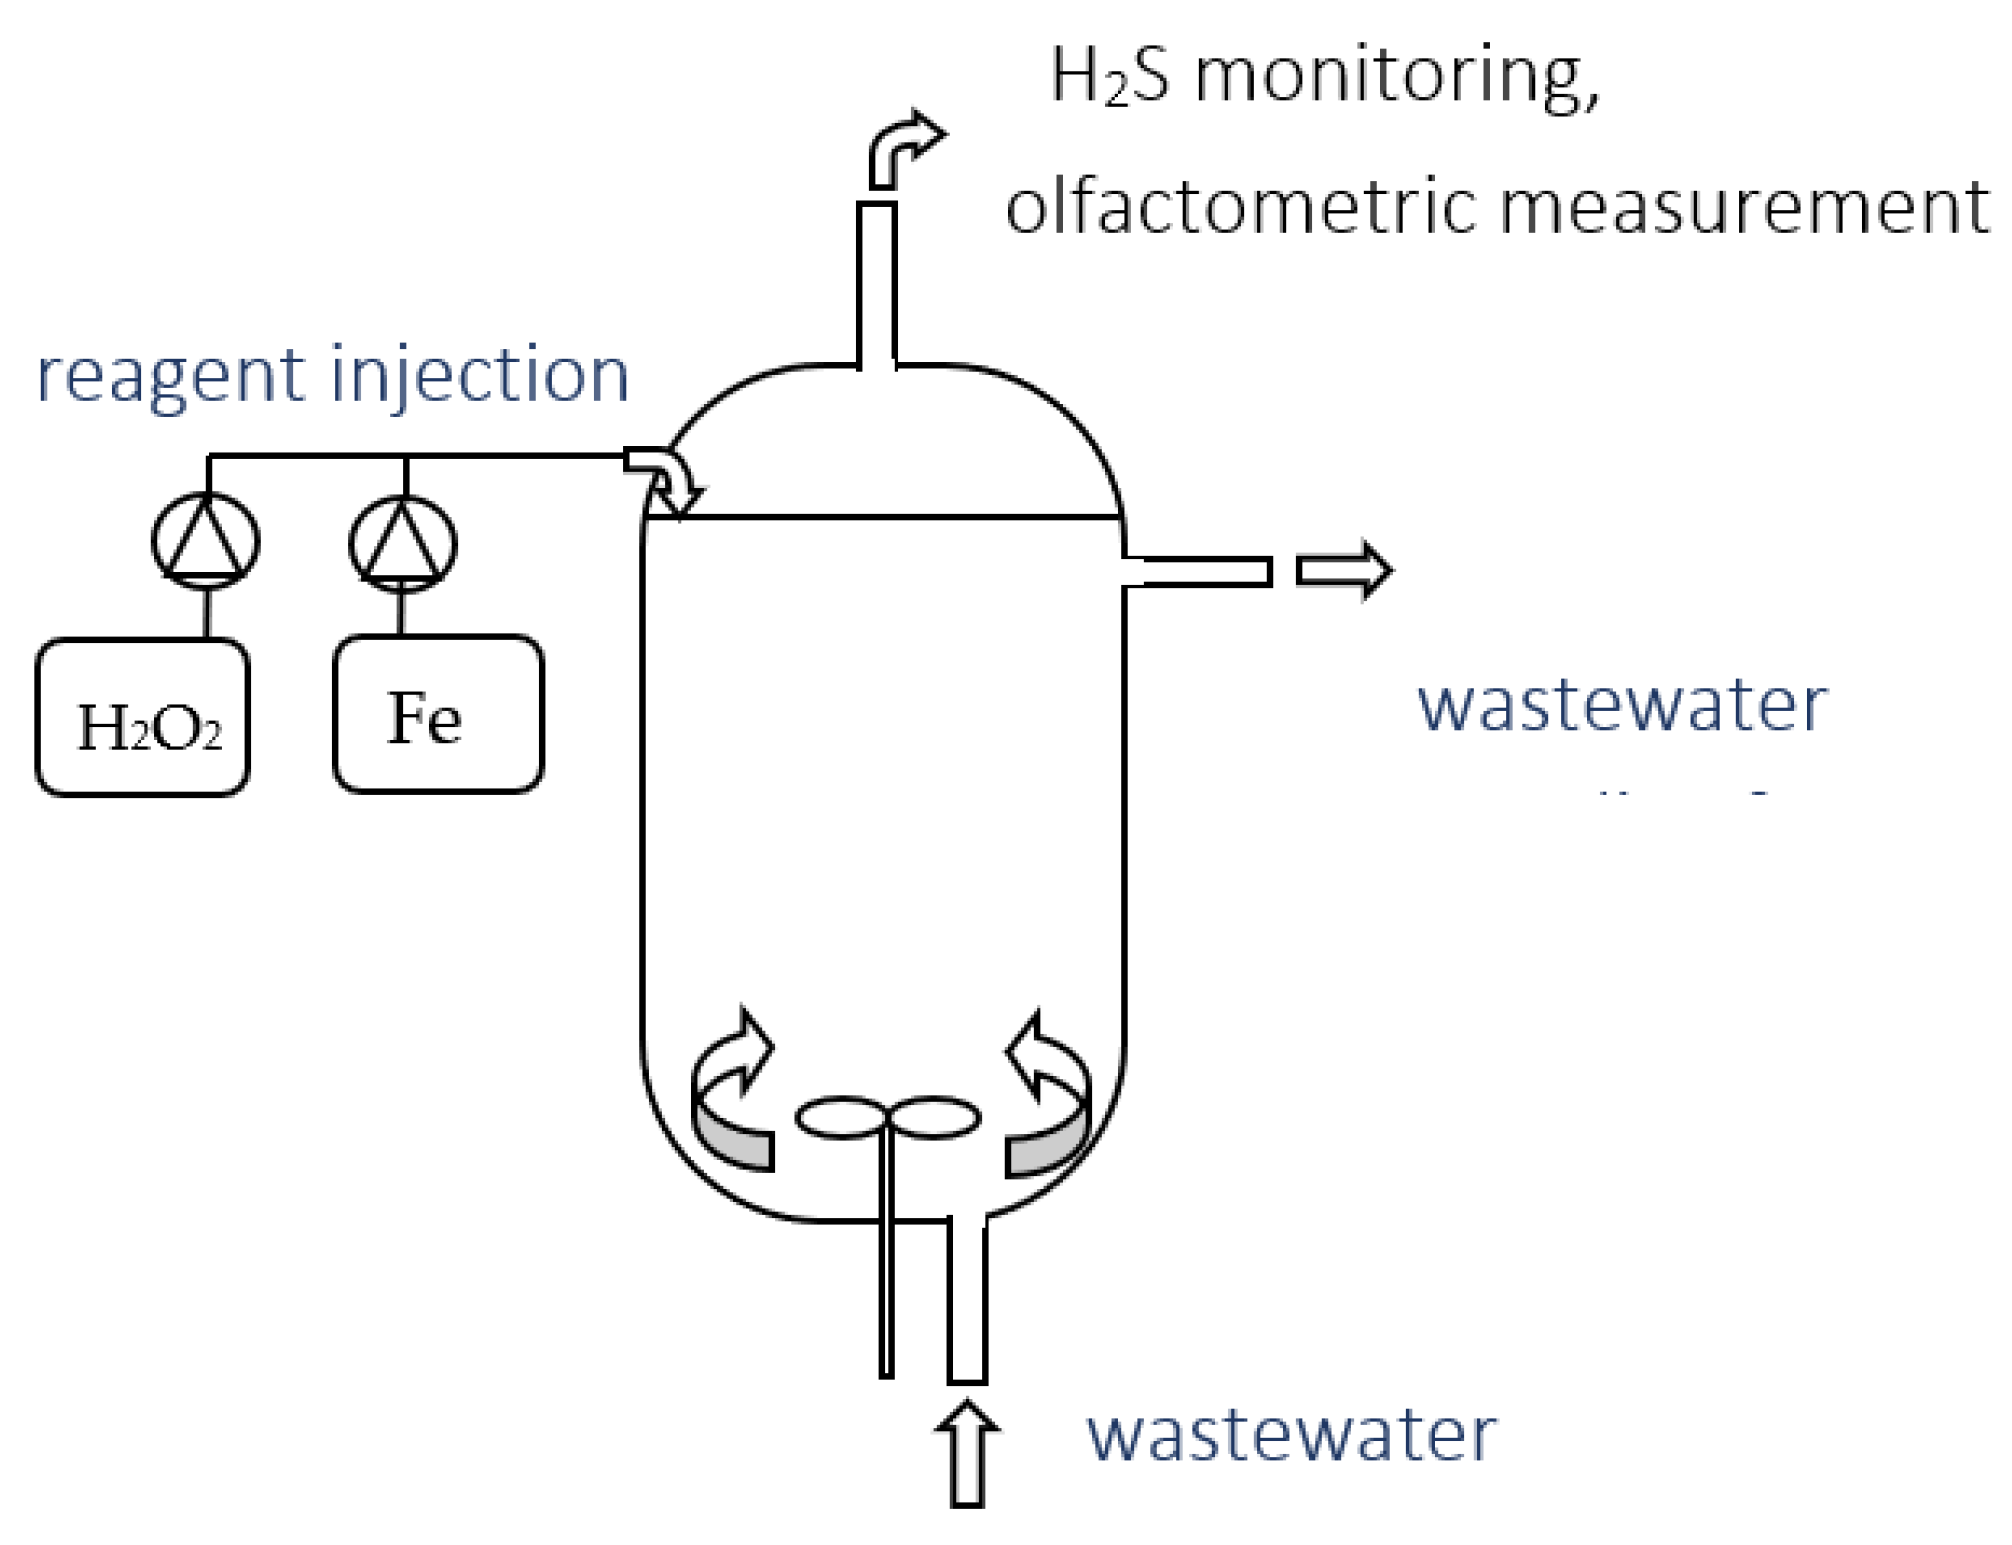
2.3. Experimental Set-Up
2.4. Materials
2.5. Analytical Methods
2.6. Statistical Analysis
3. Results
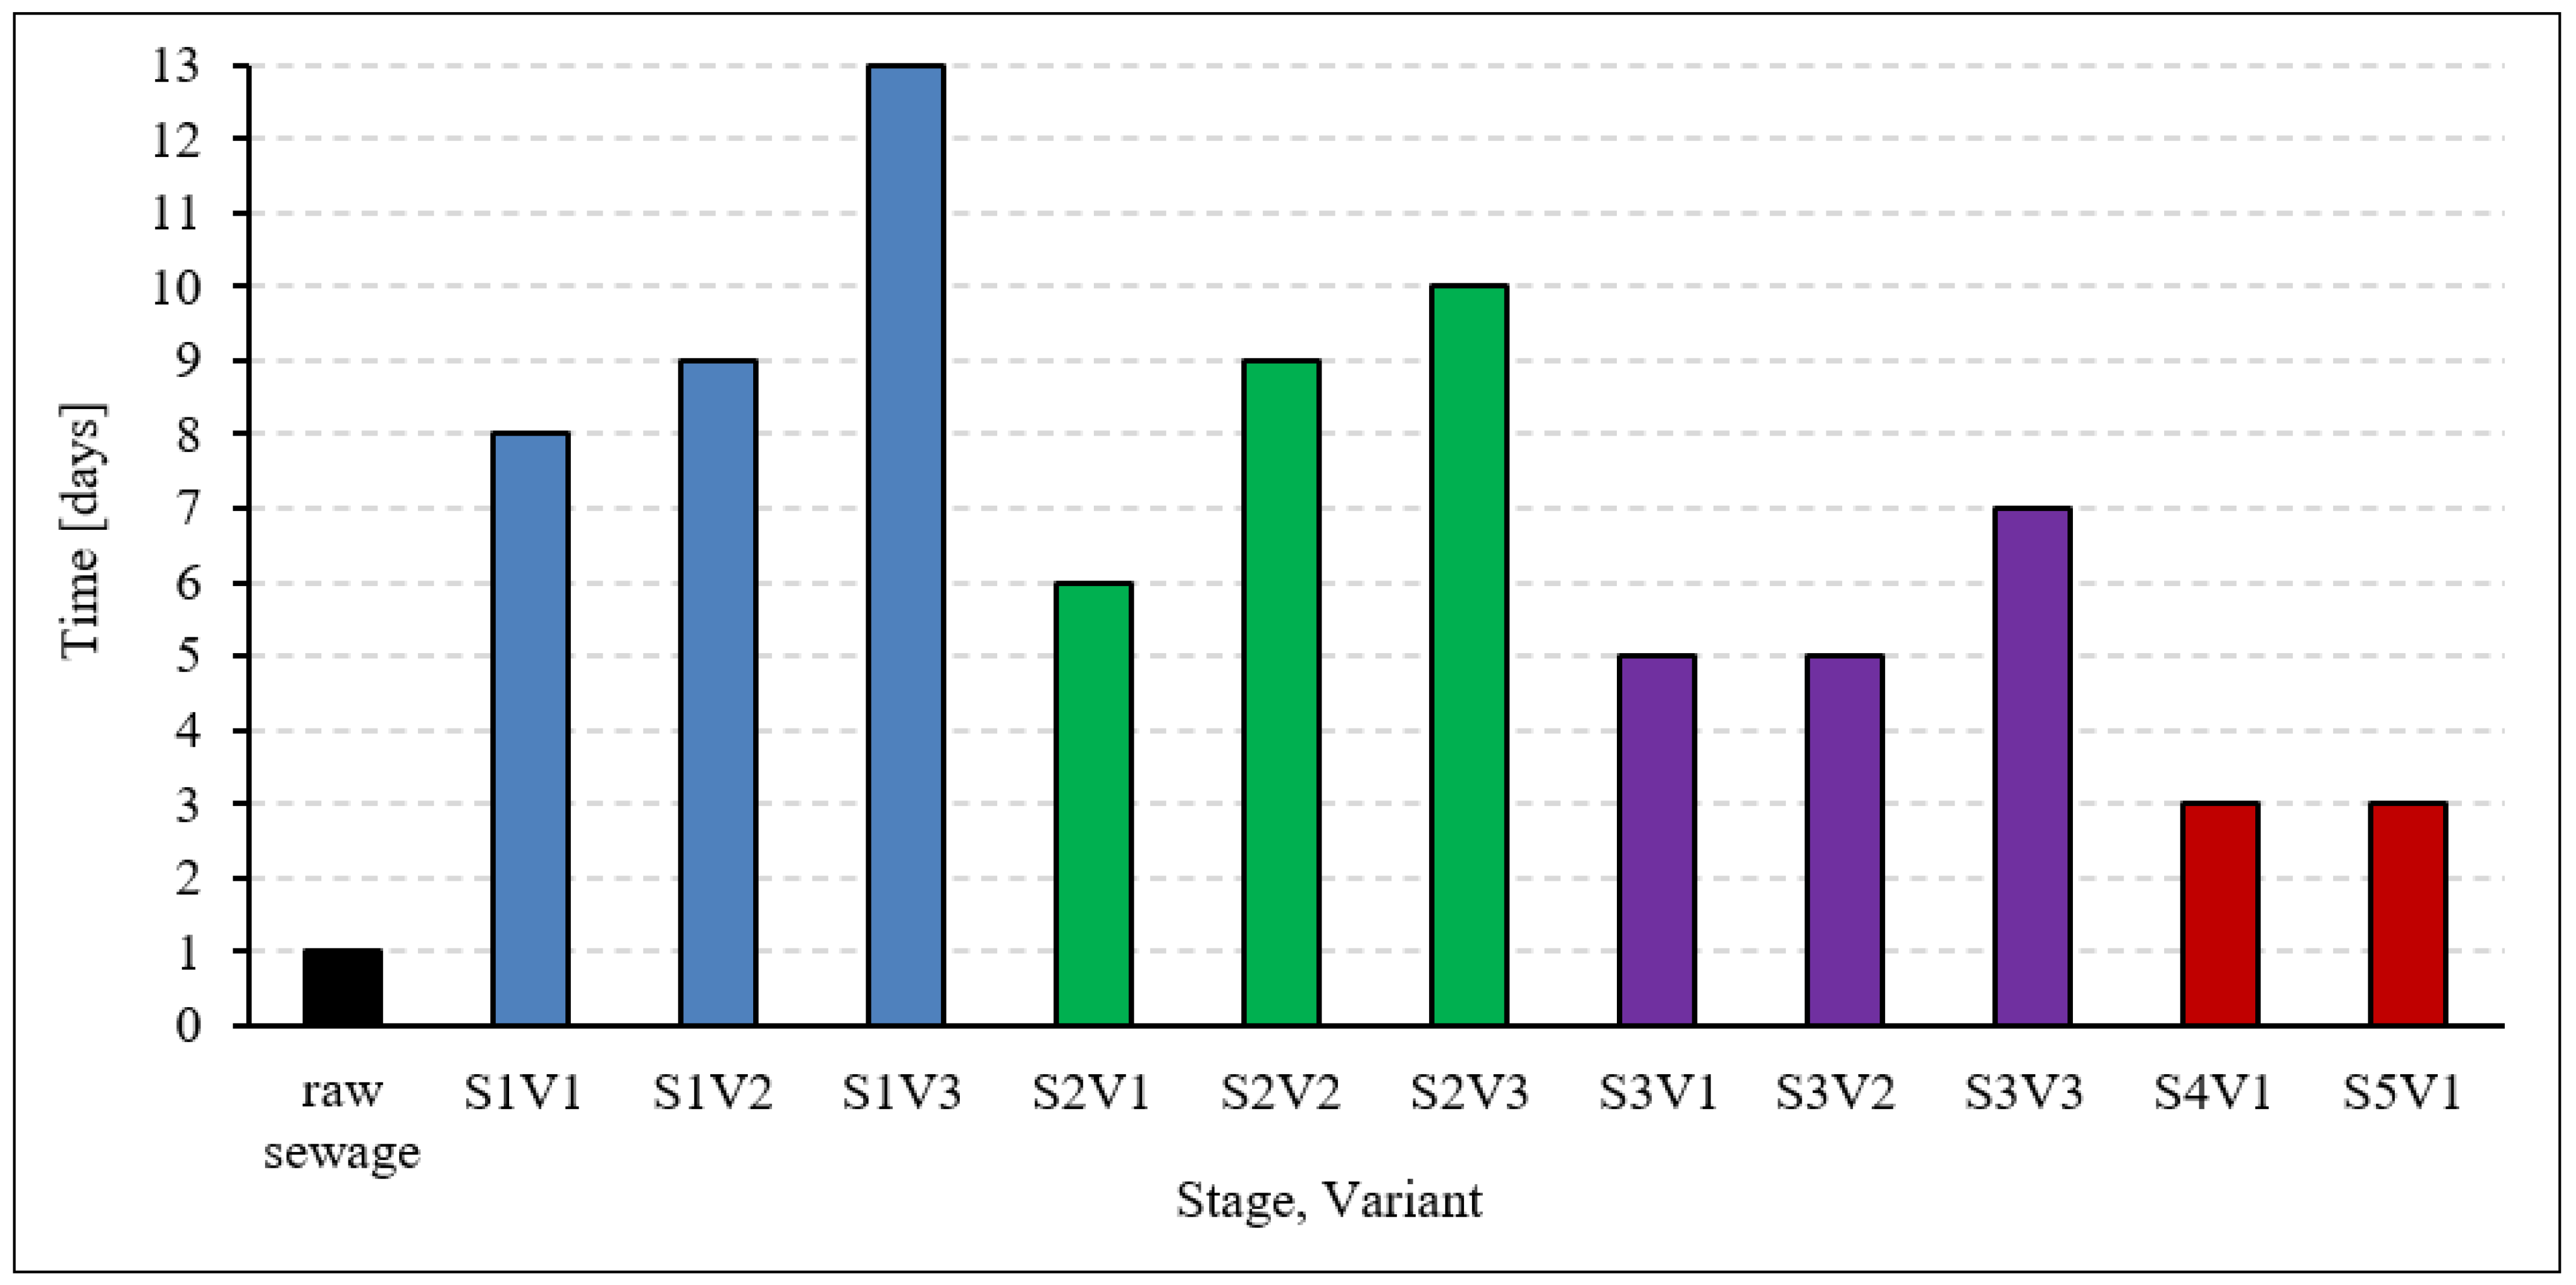
3.1. Putrefaction
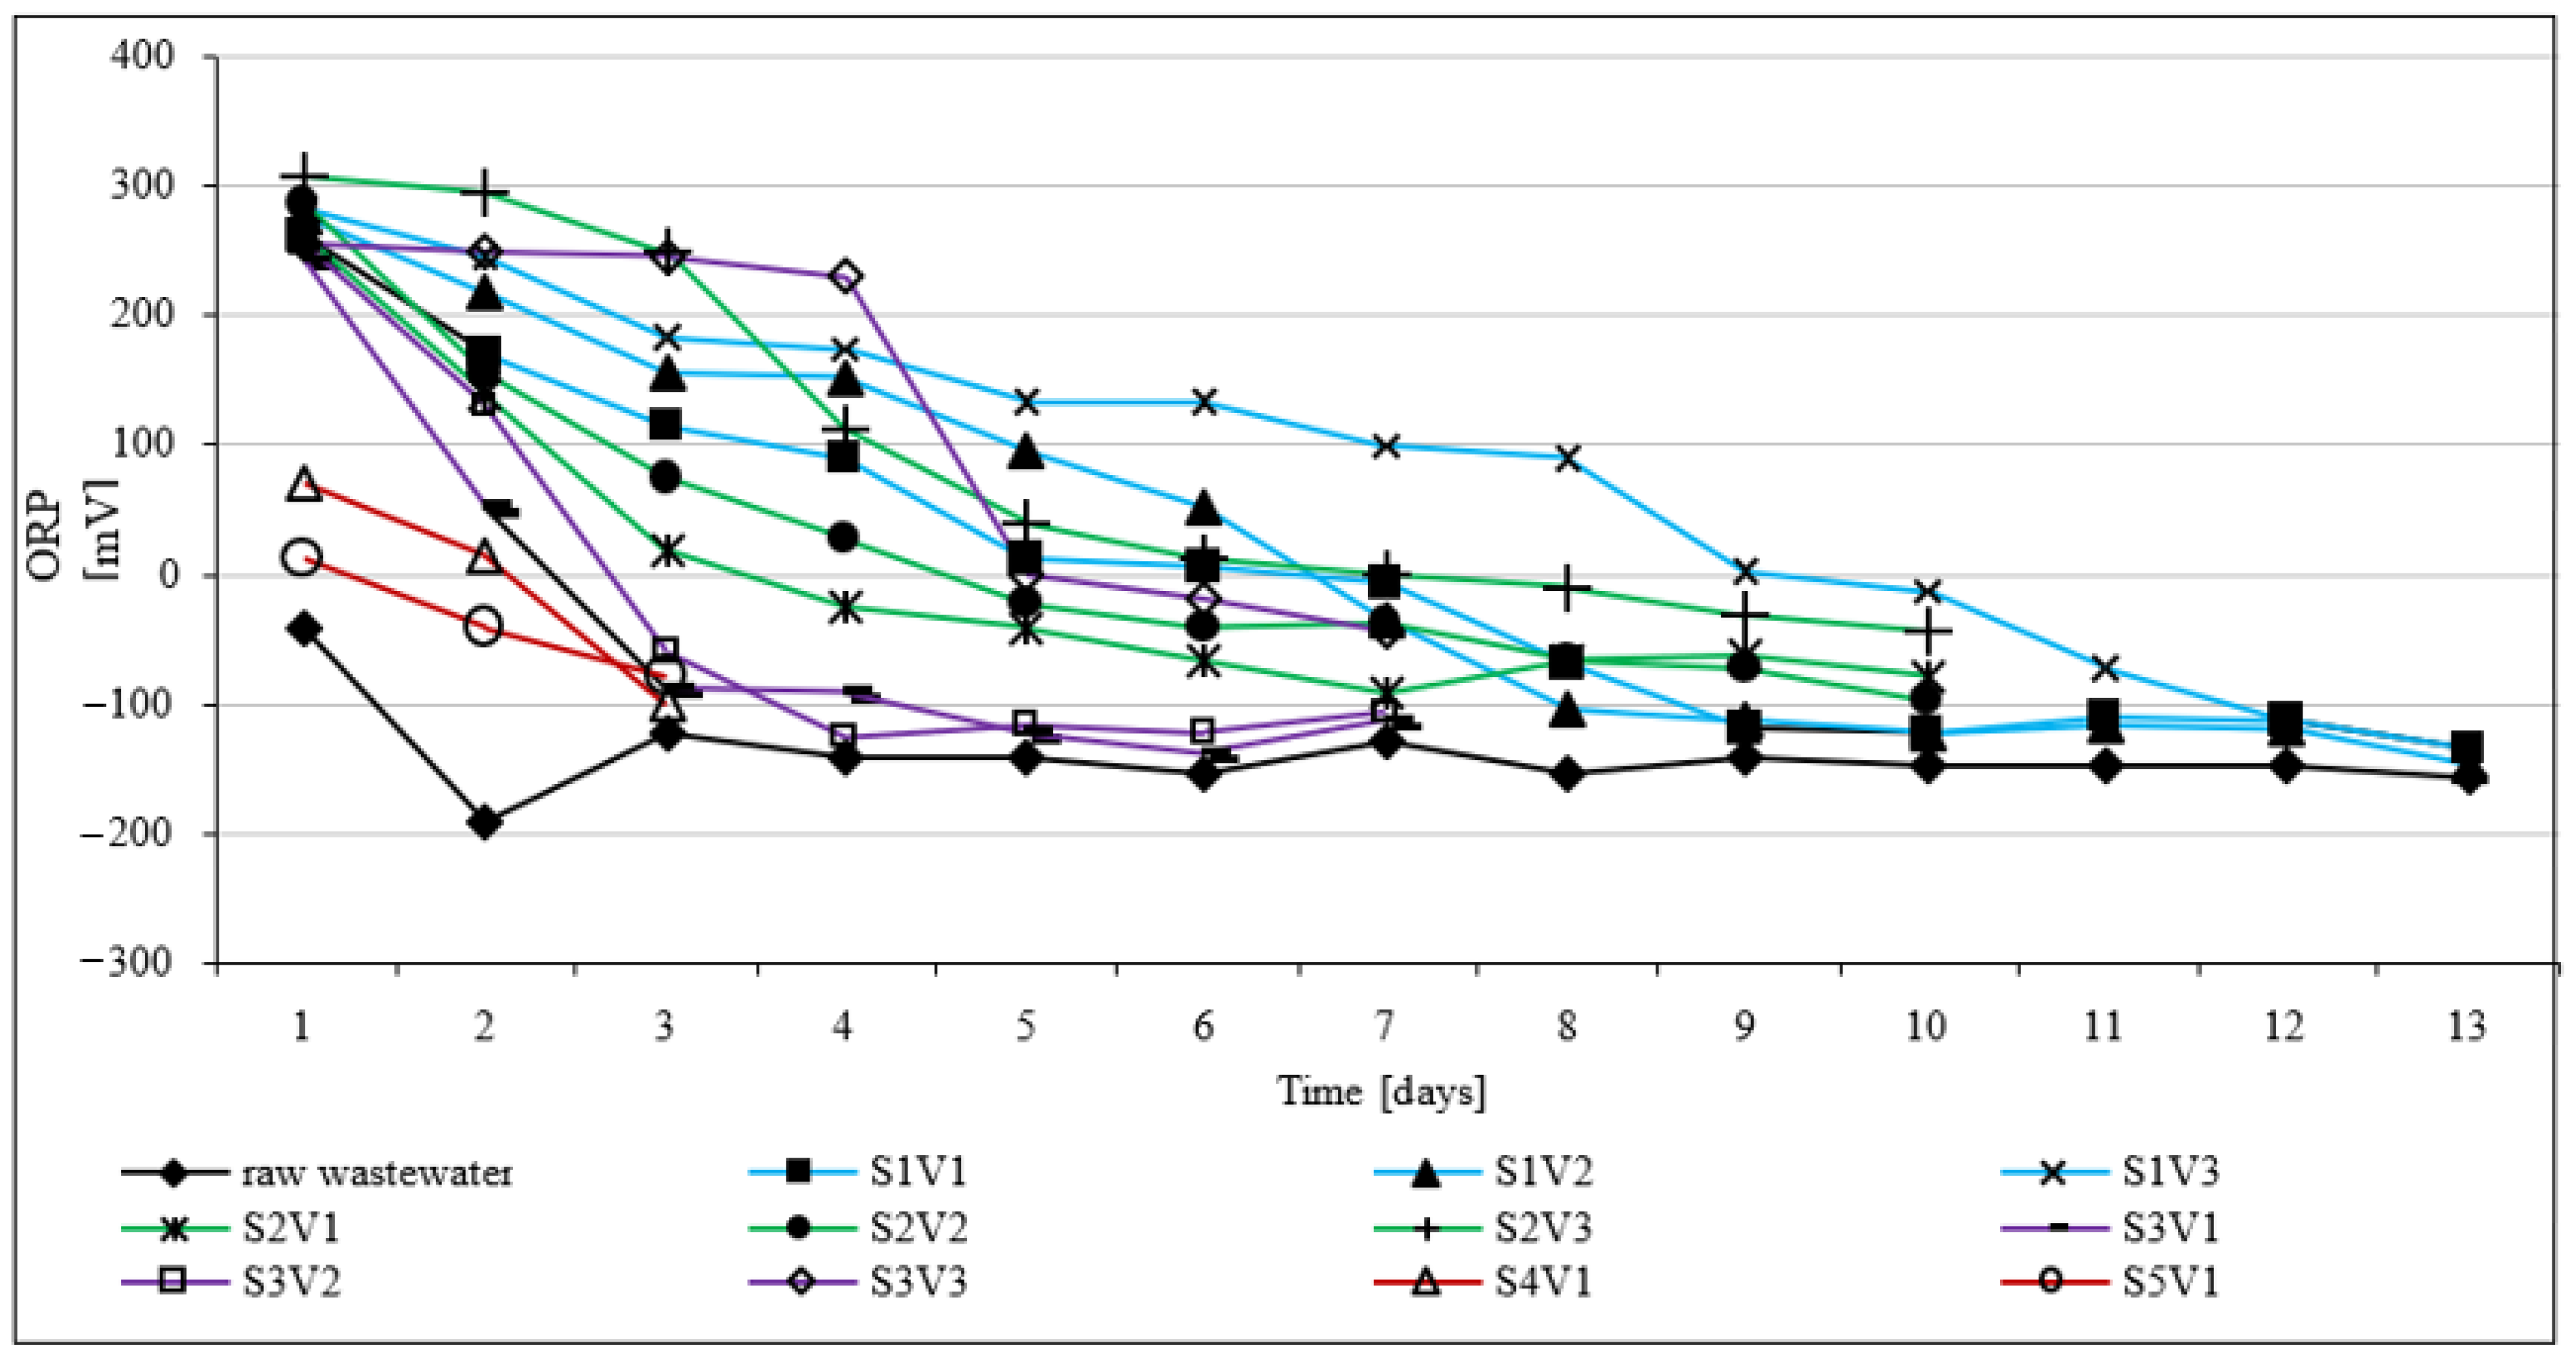
3.2. Oxidation–Reduction Potential (ORP)
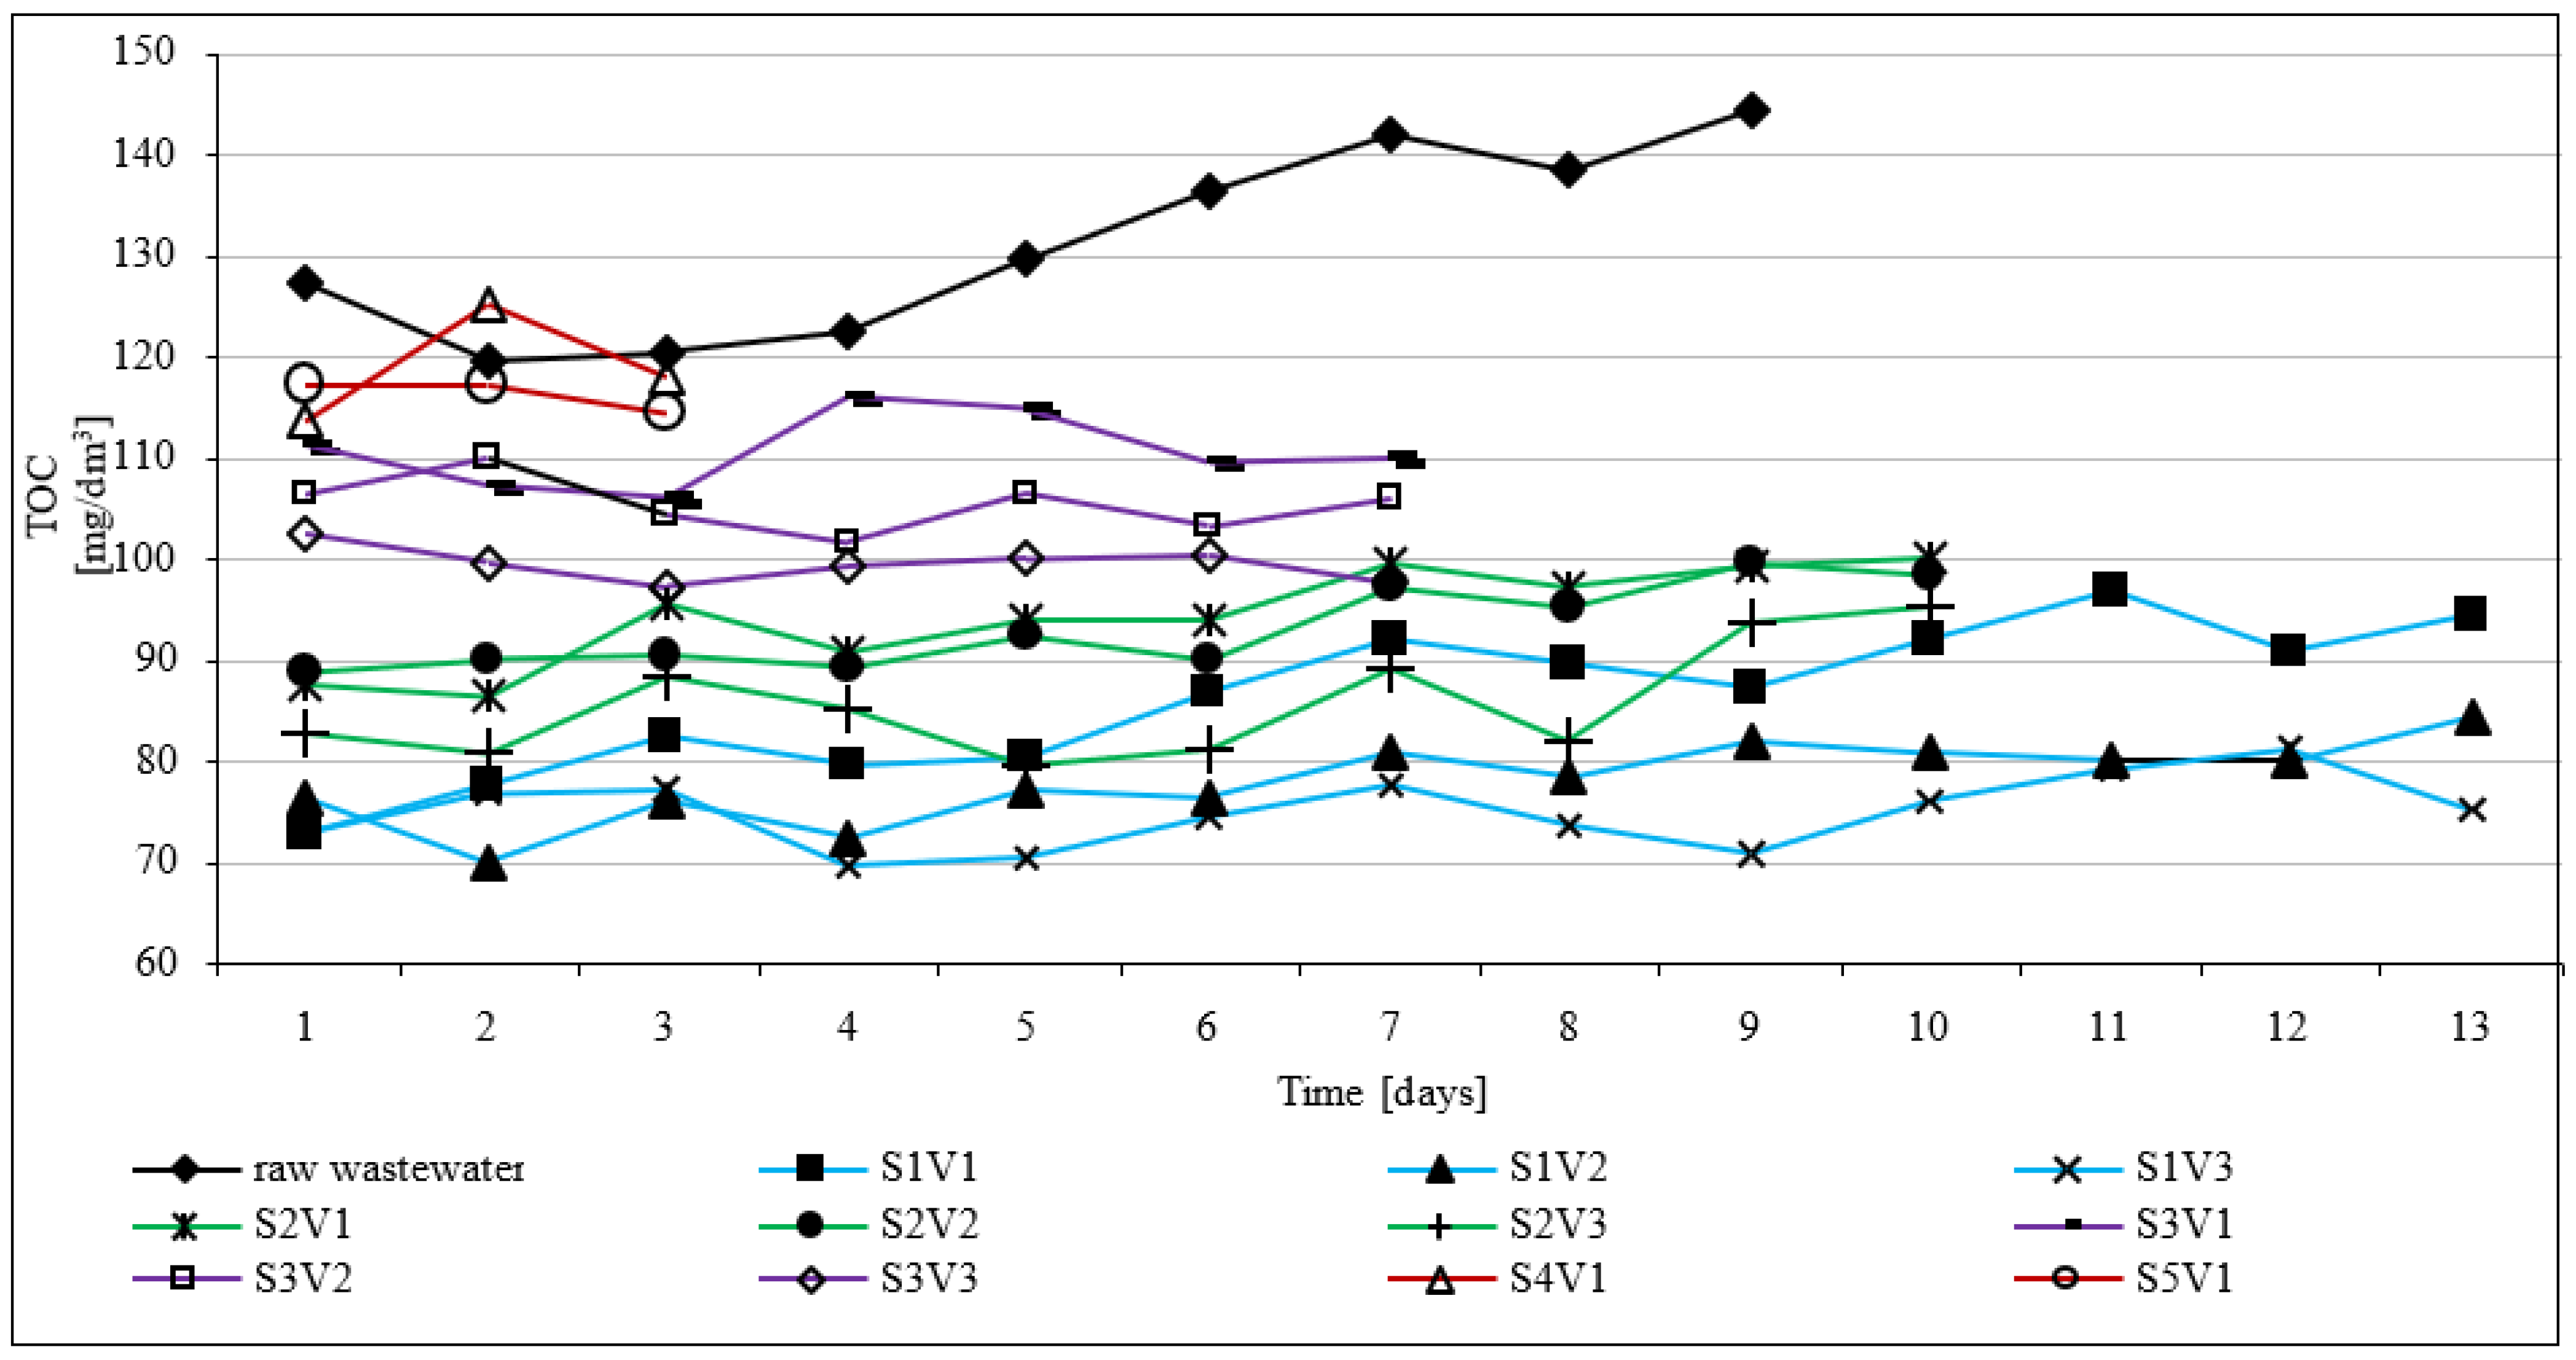
3.3. TOC
3.4. Changes in pH, Concentrations of Sulfates/Sulfides
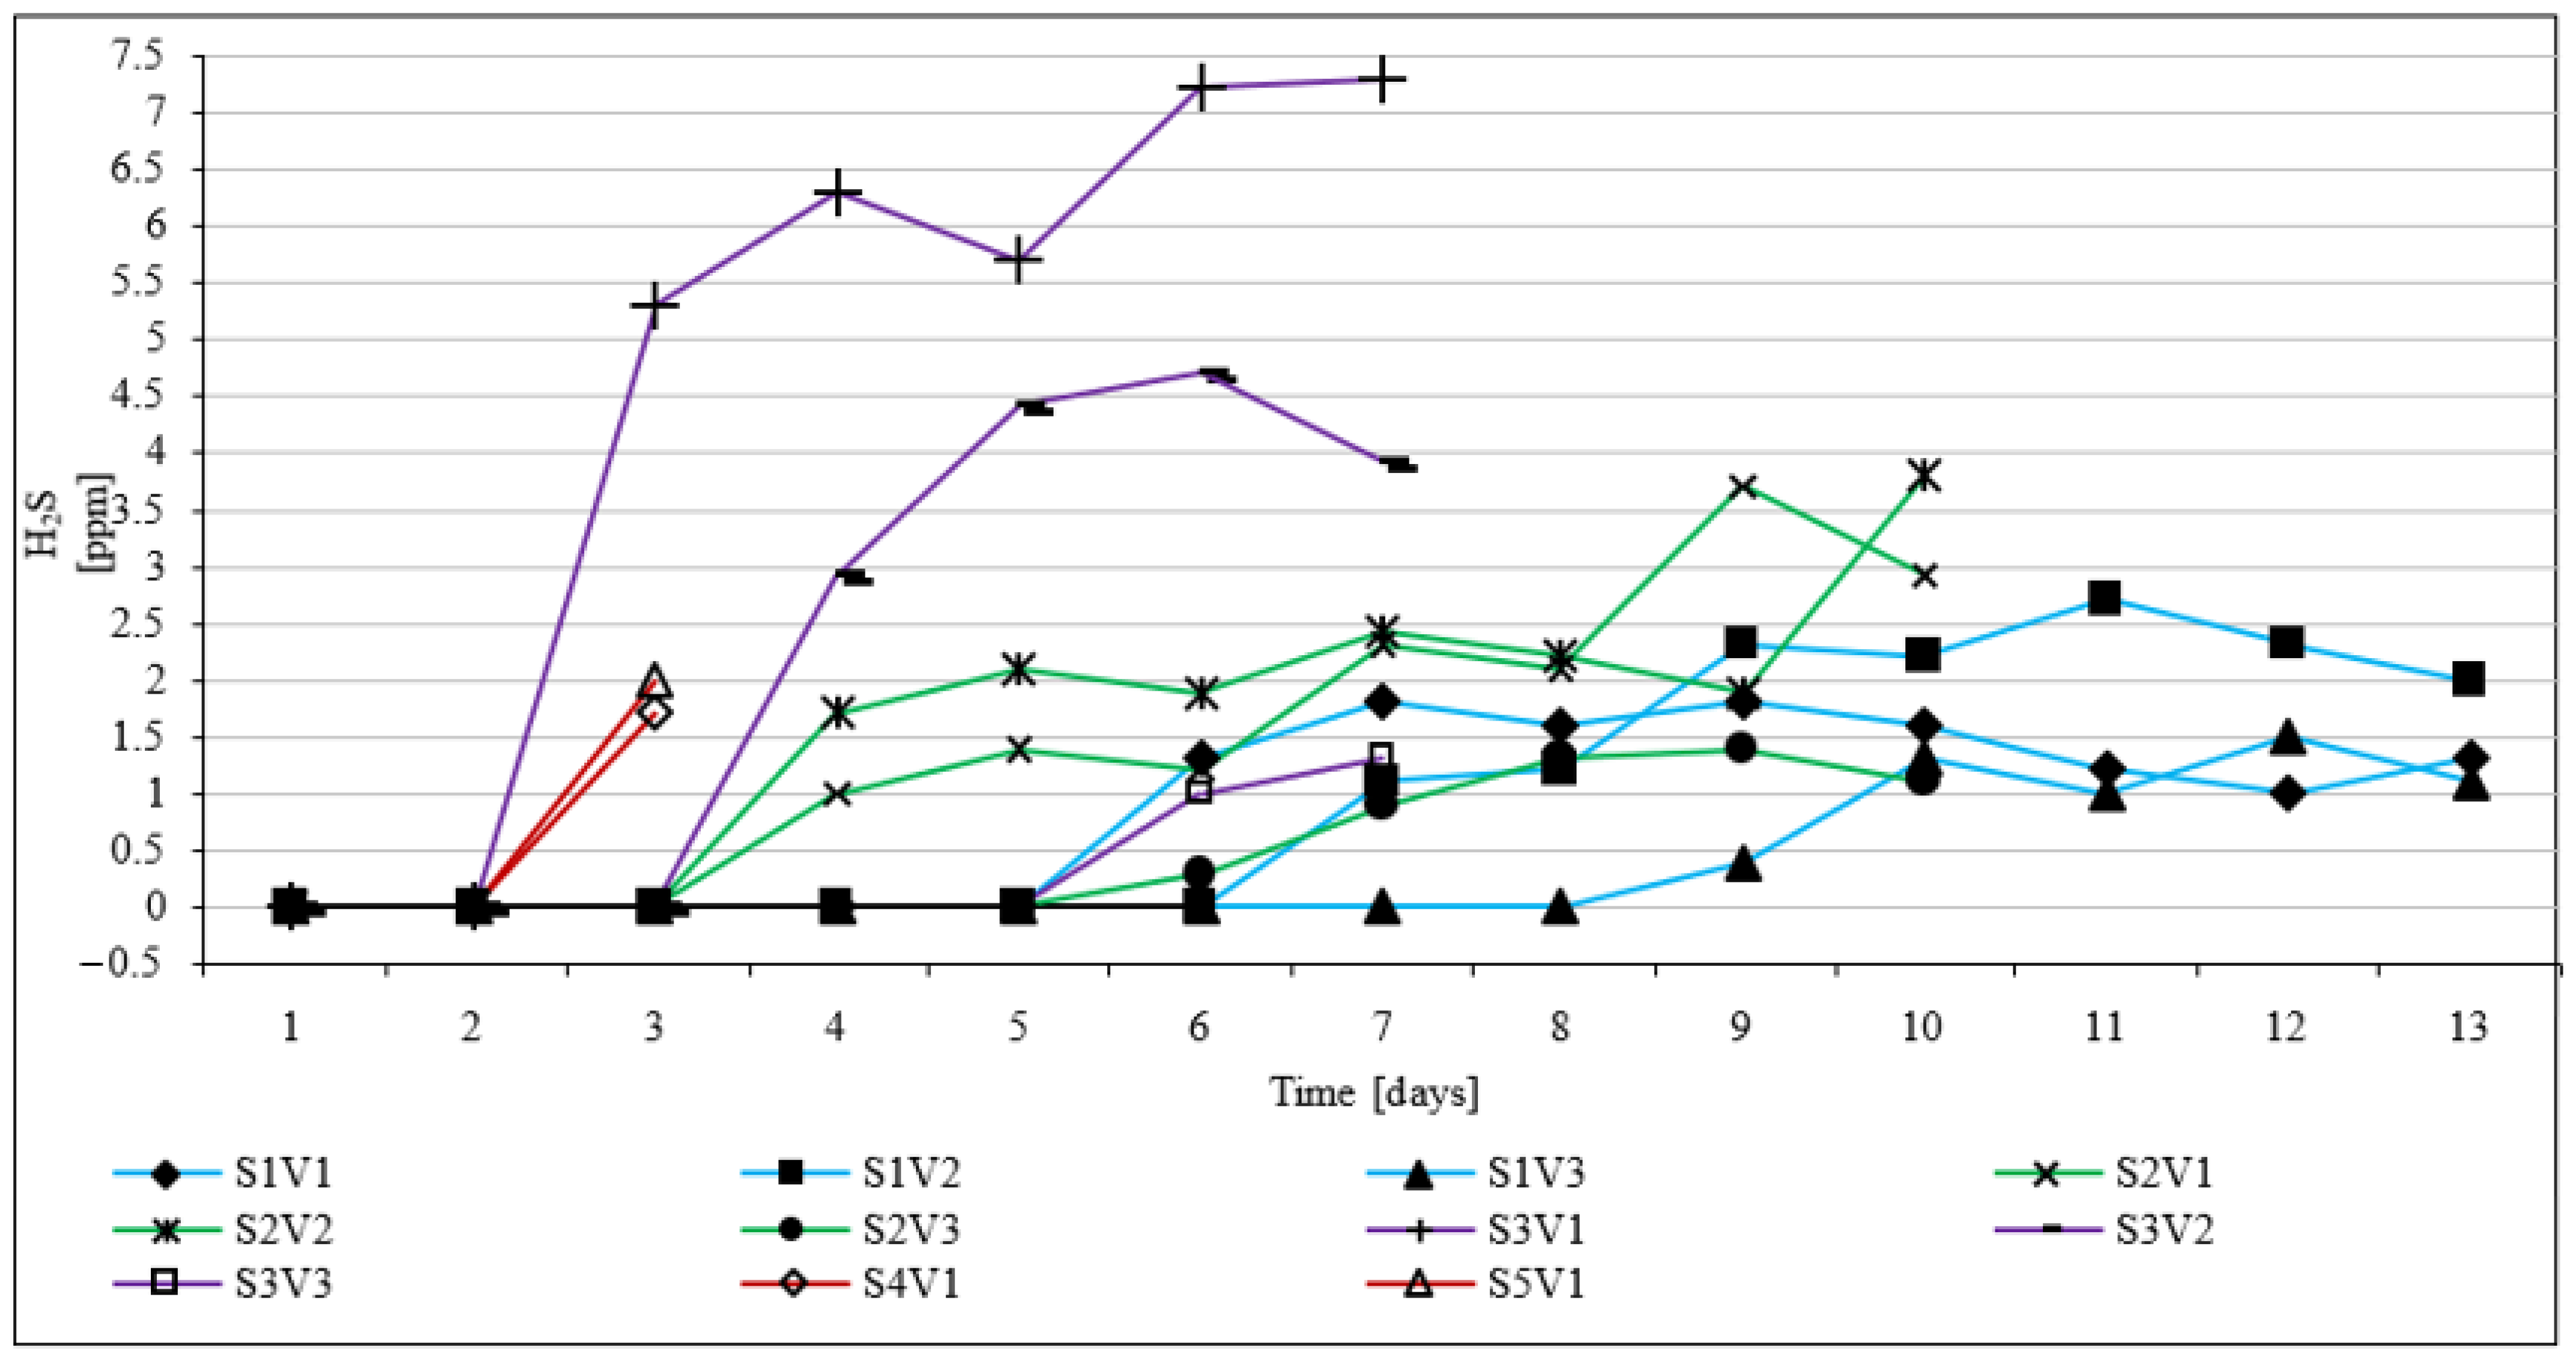
3.5. H2S Levels
3.6. Concentrations of Other Gases
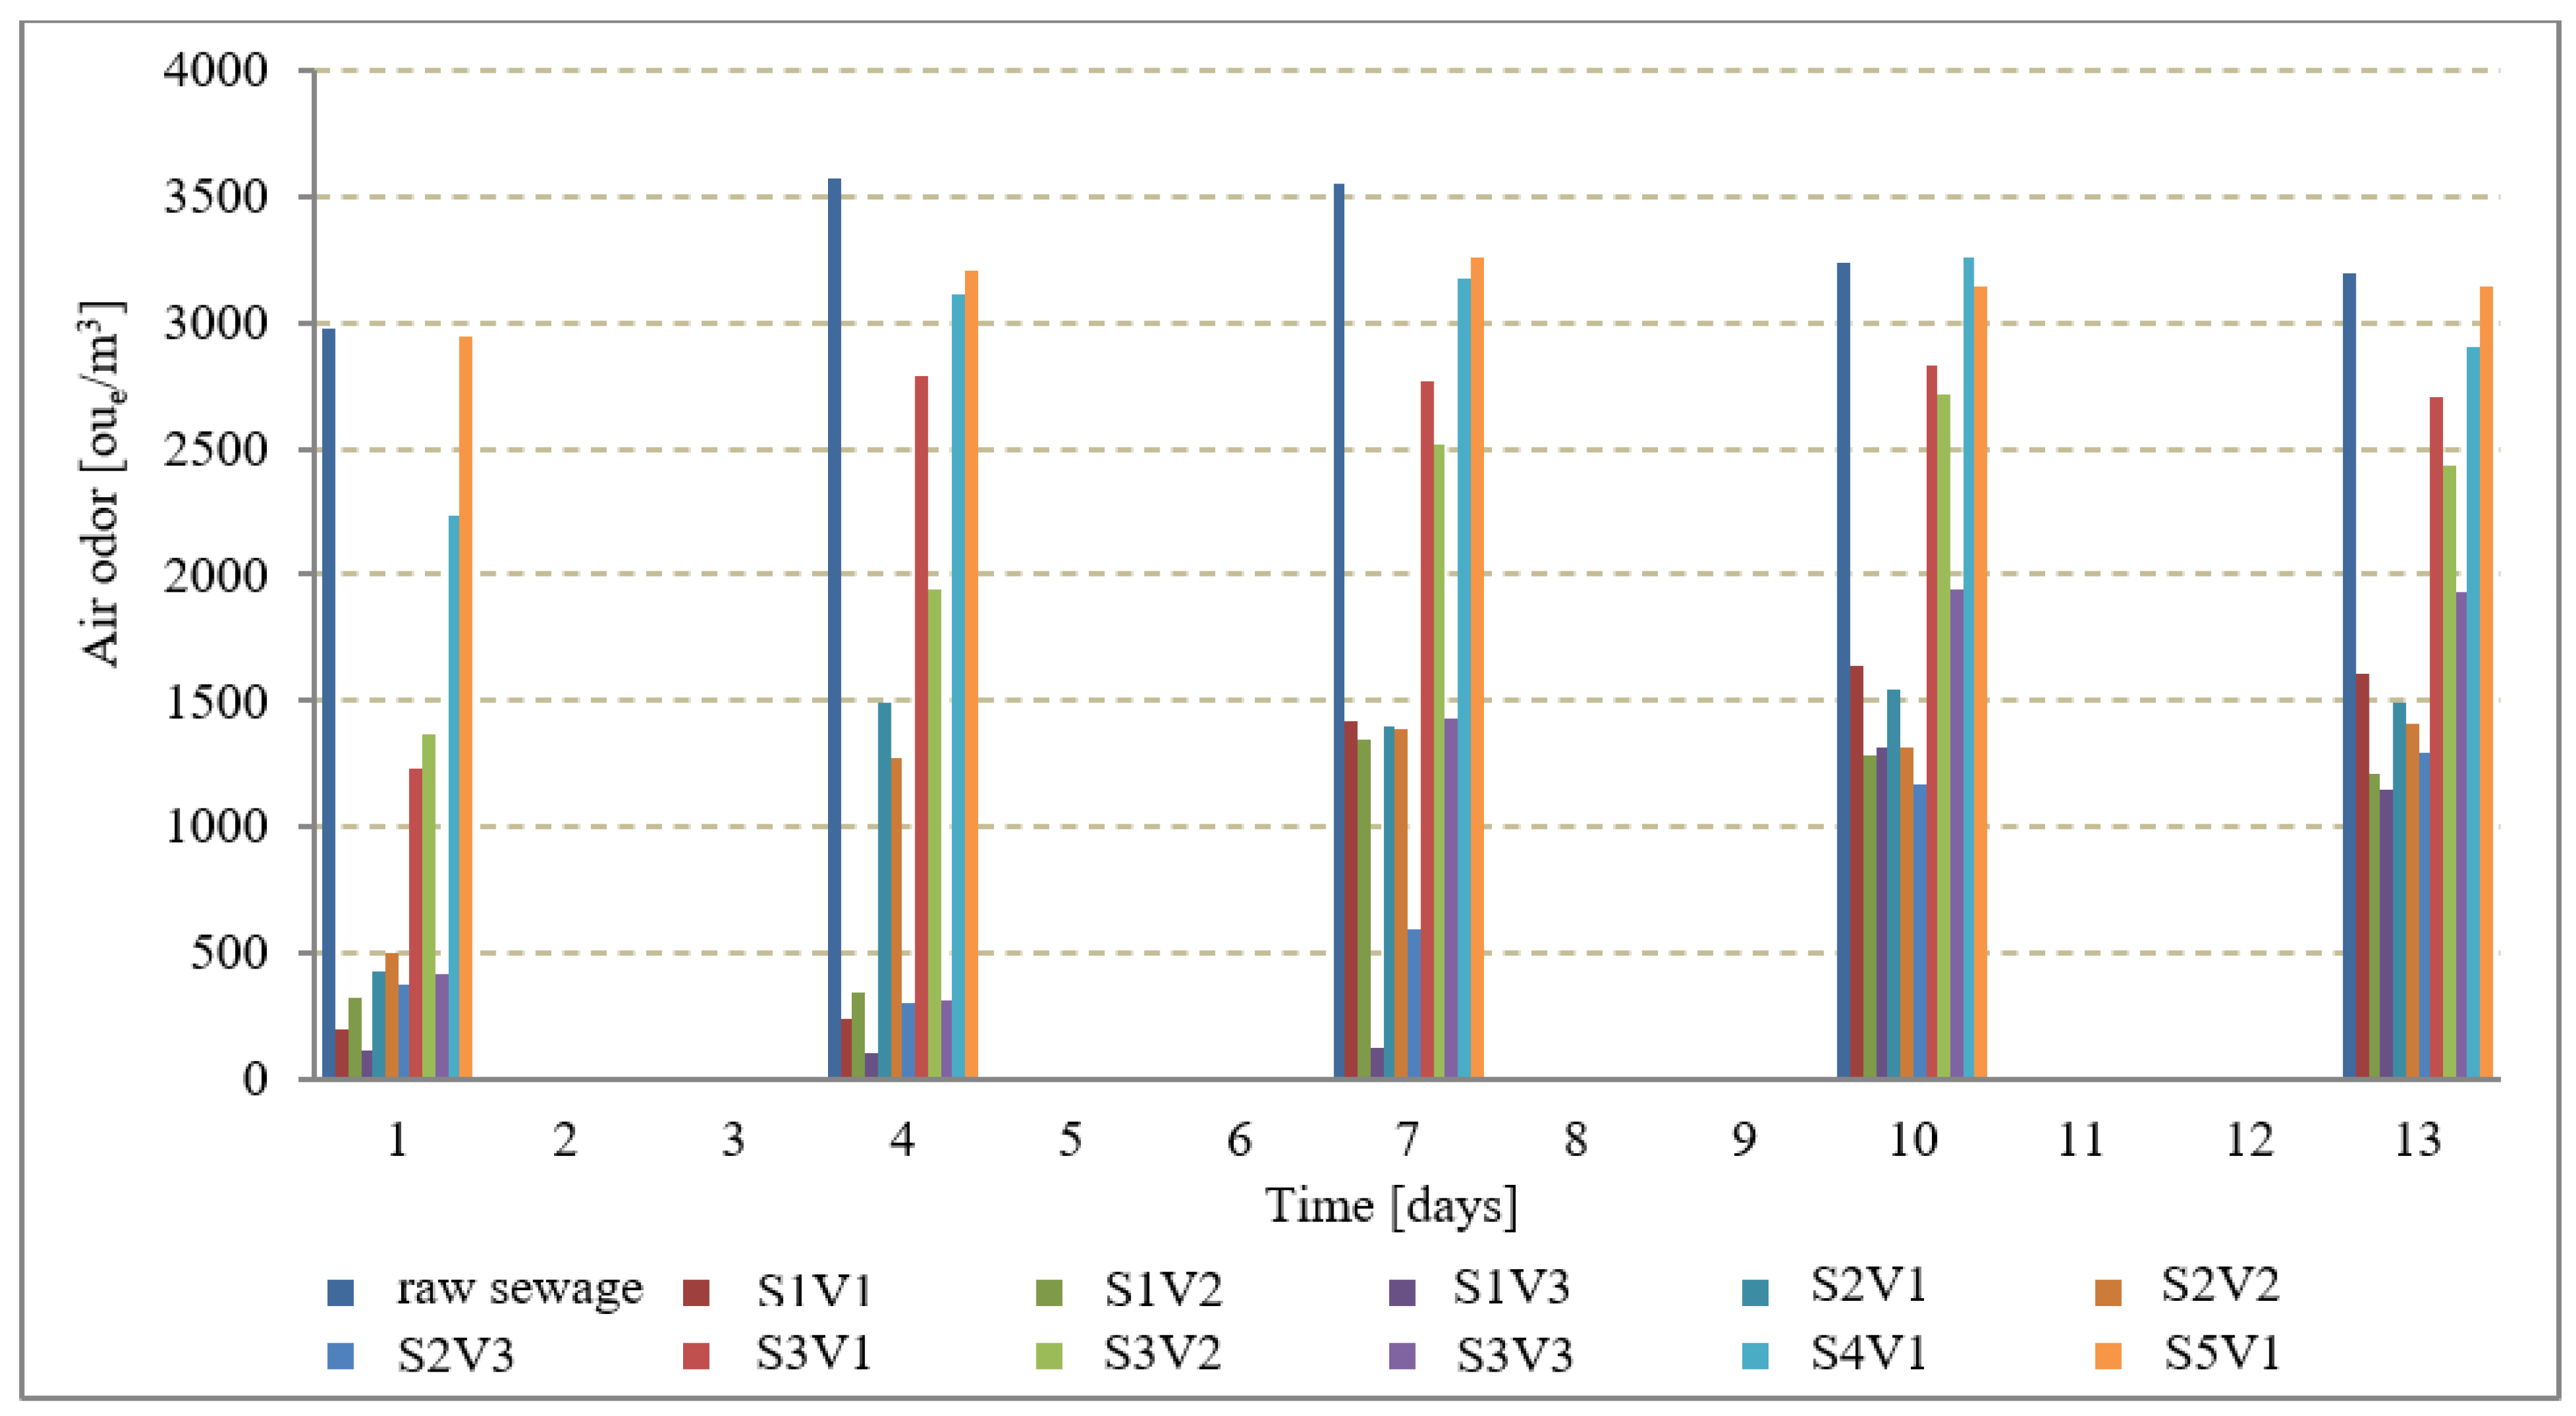
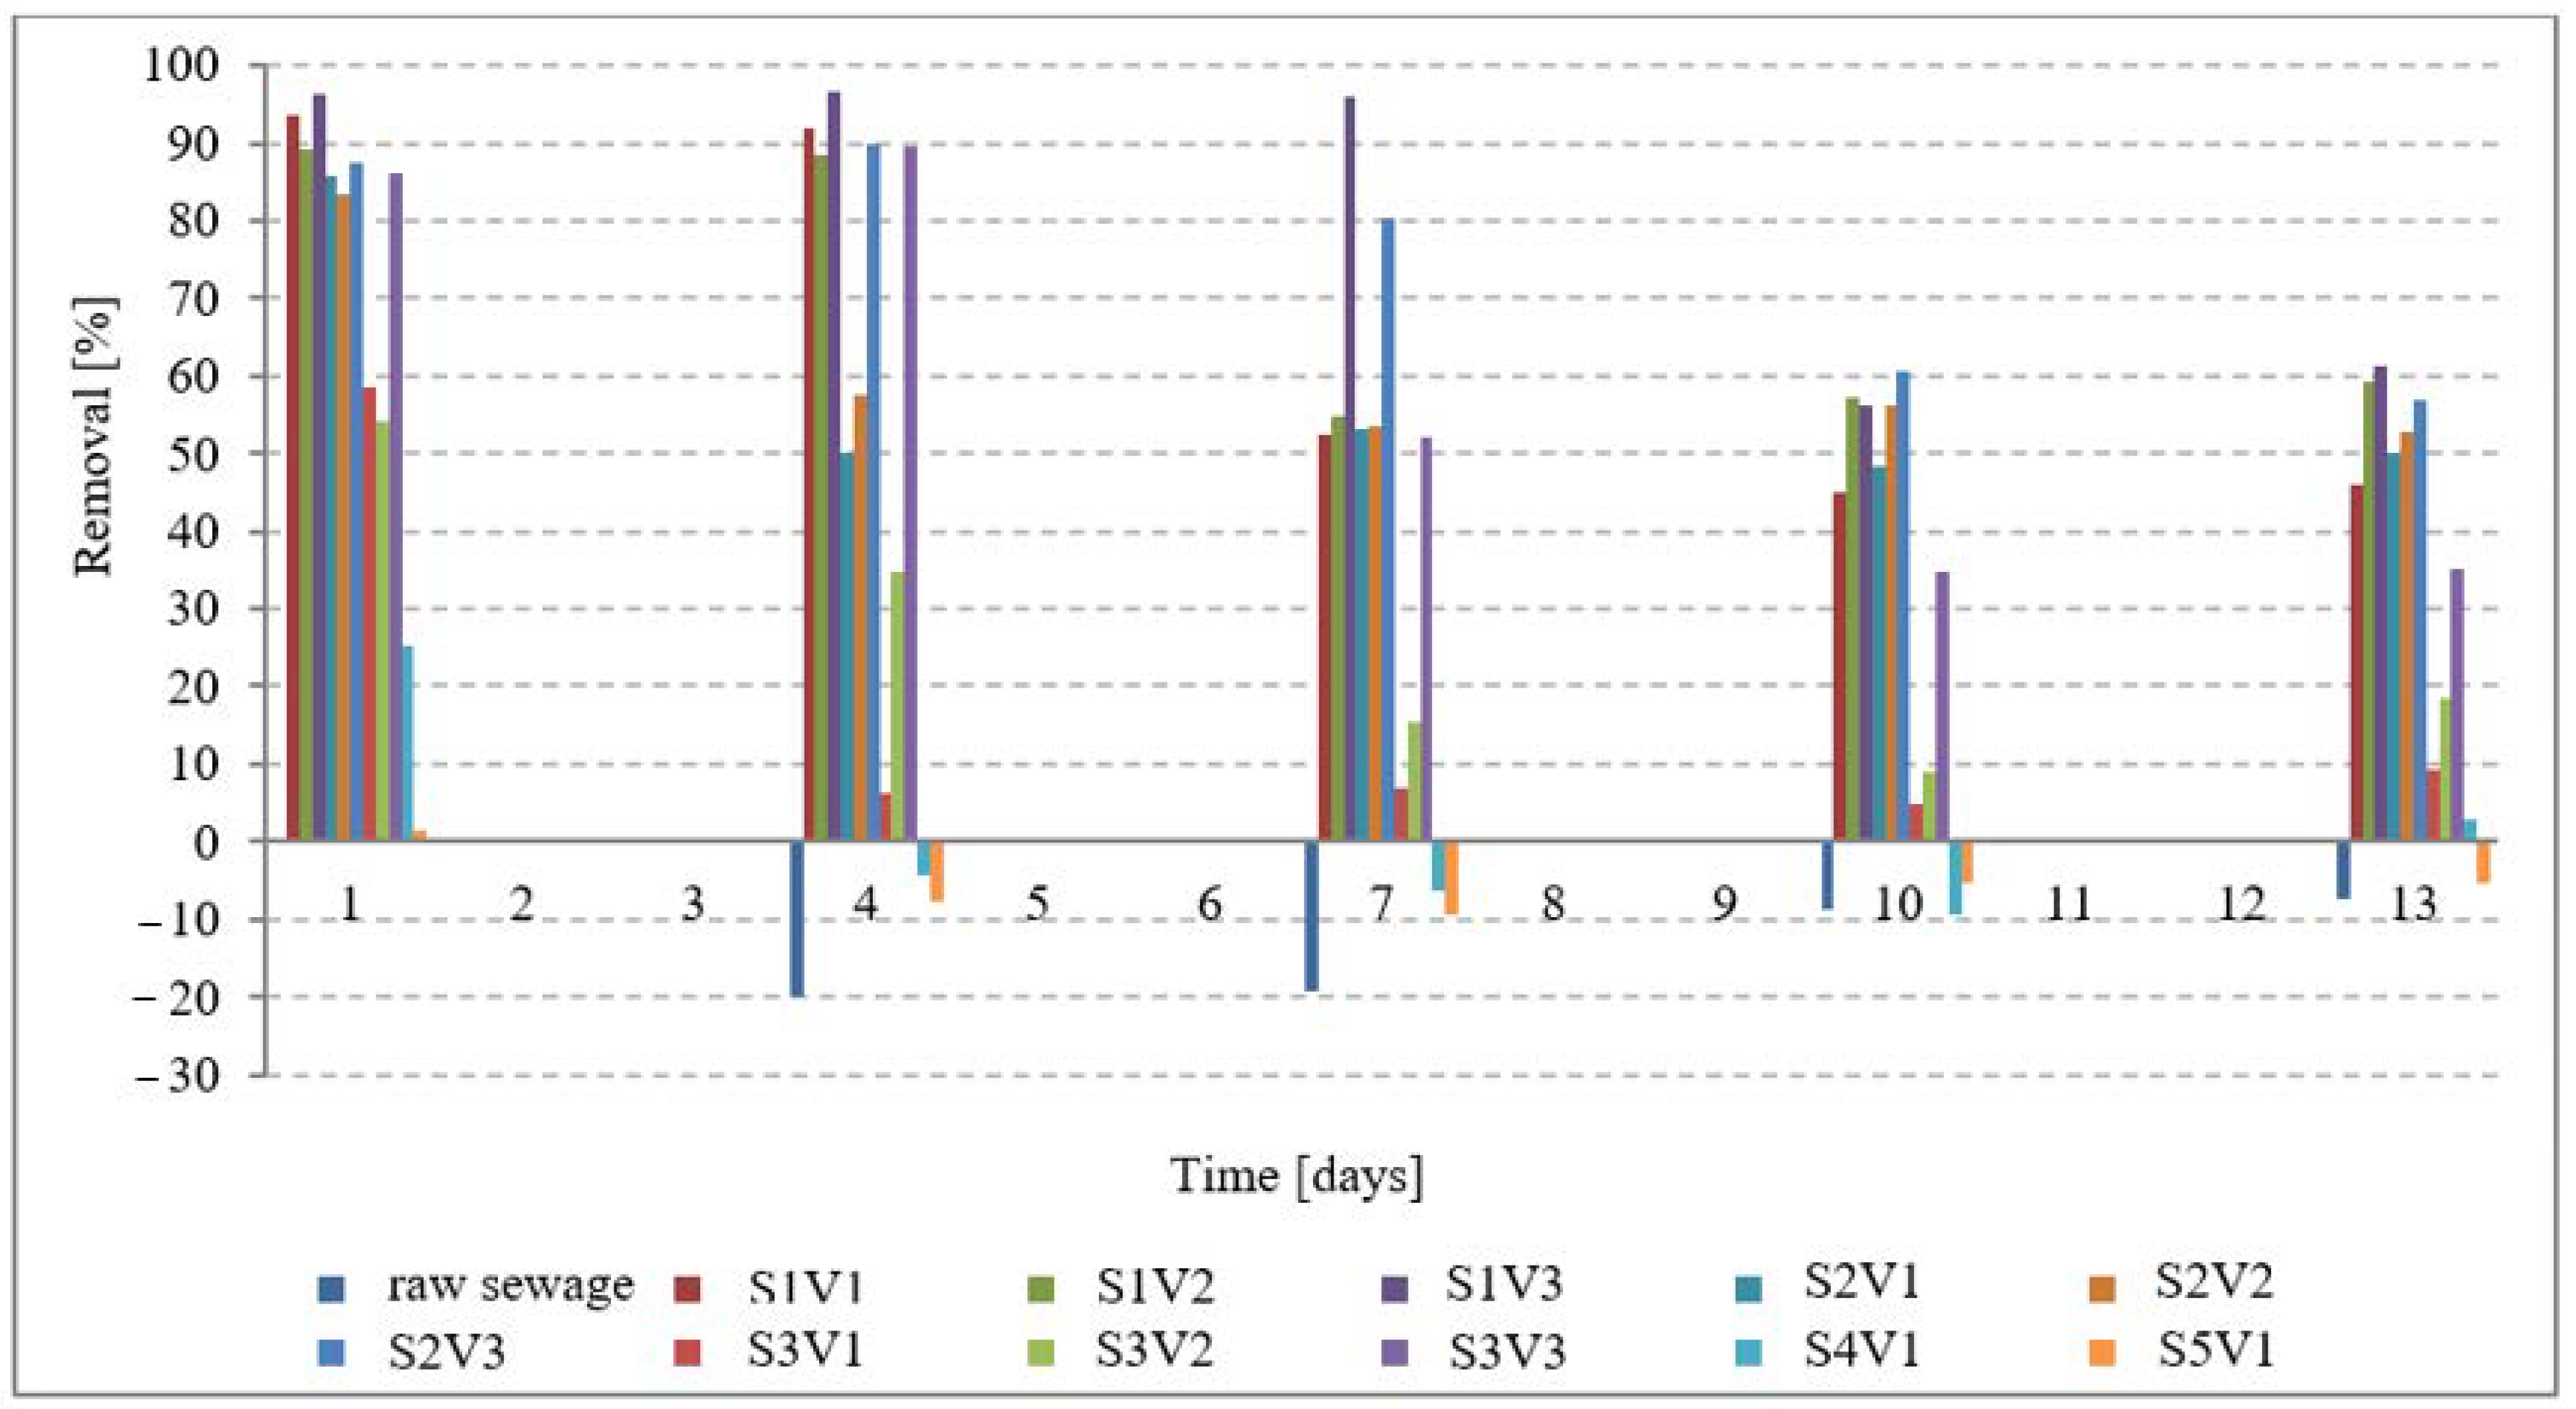
3.7. Odor Concentration
4. Discussion
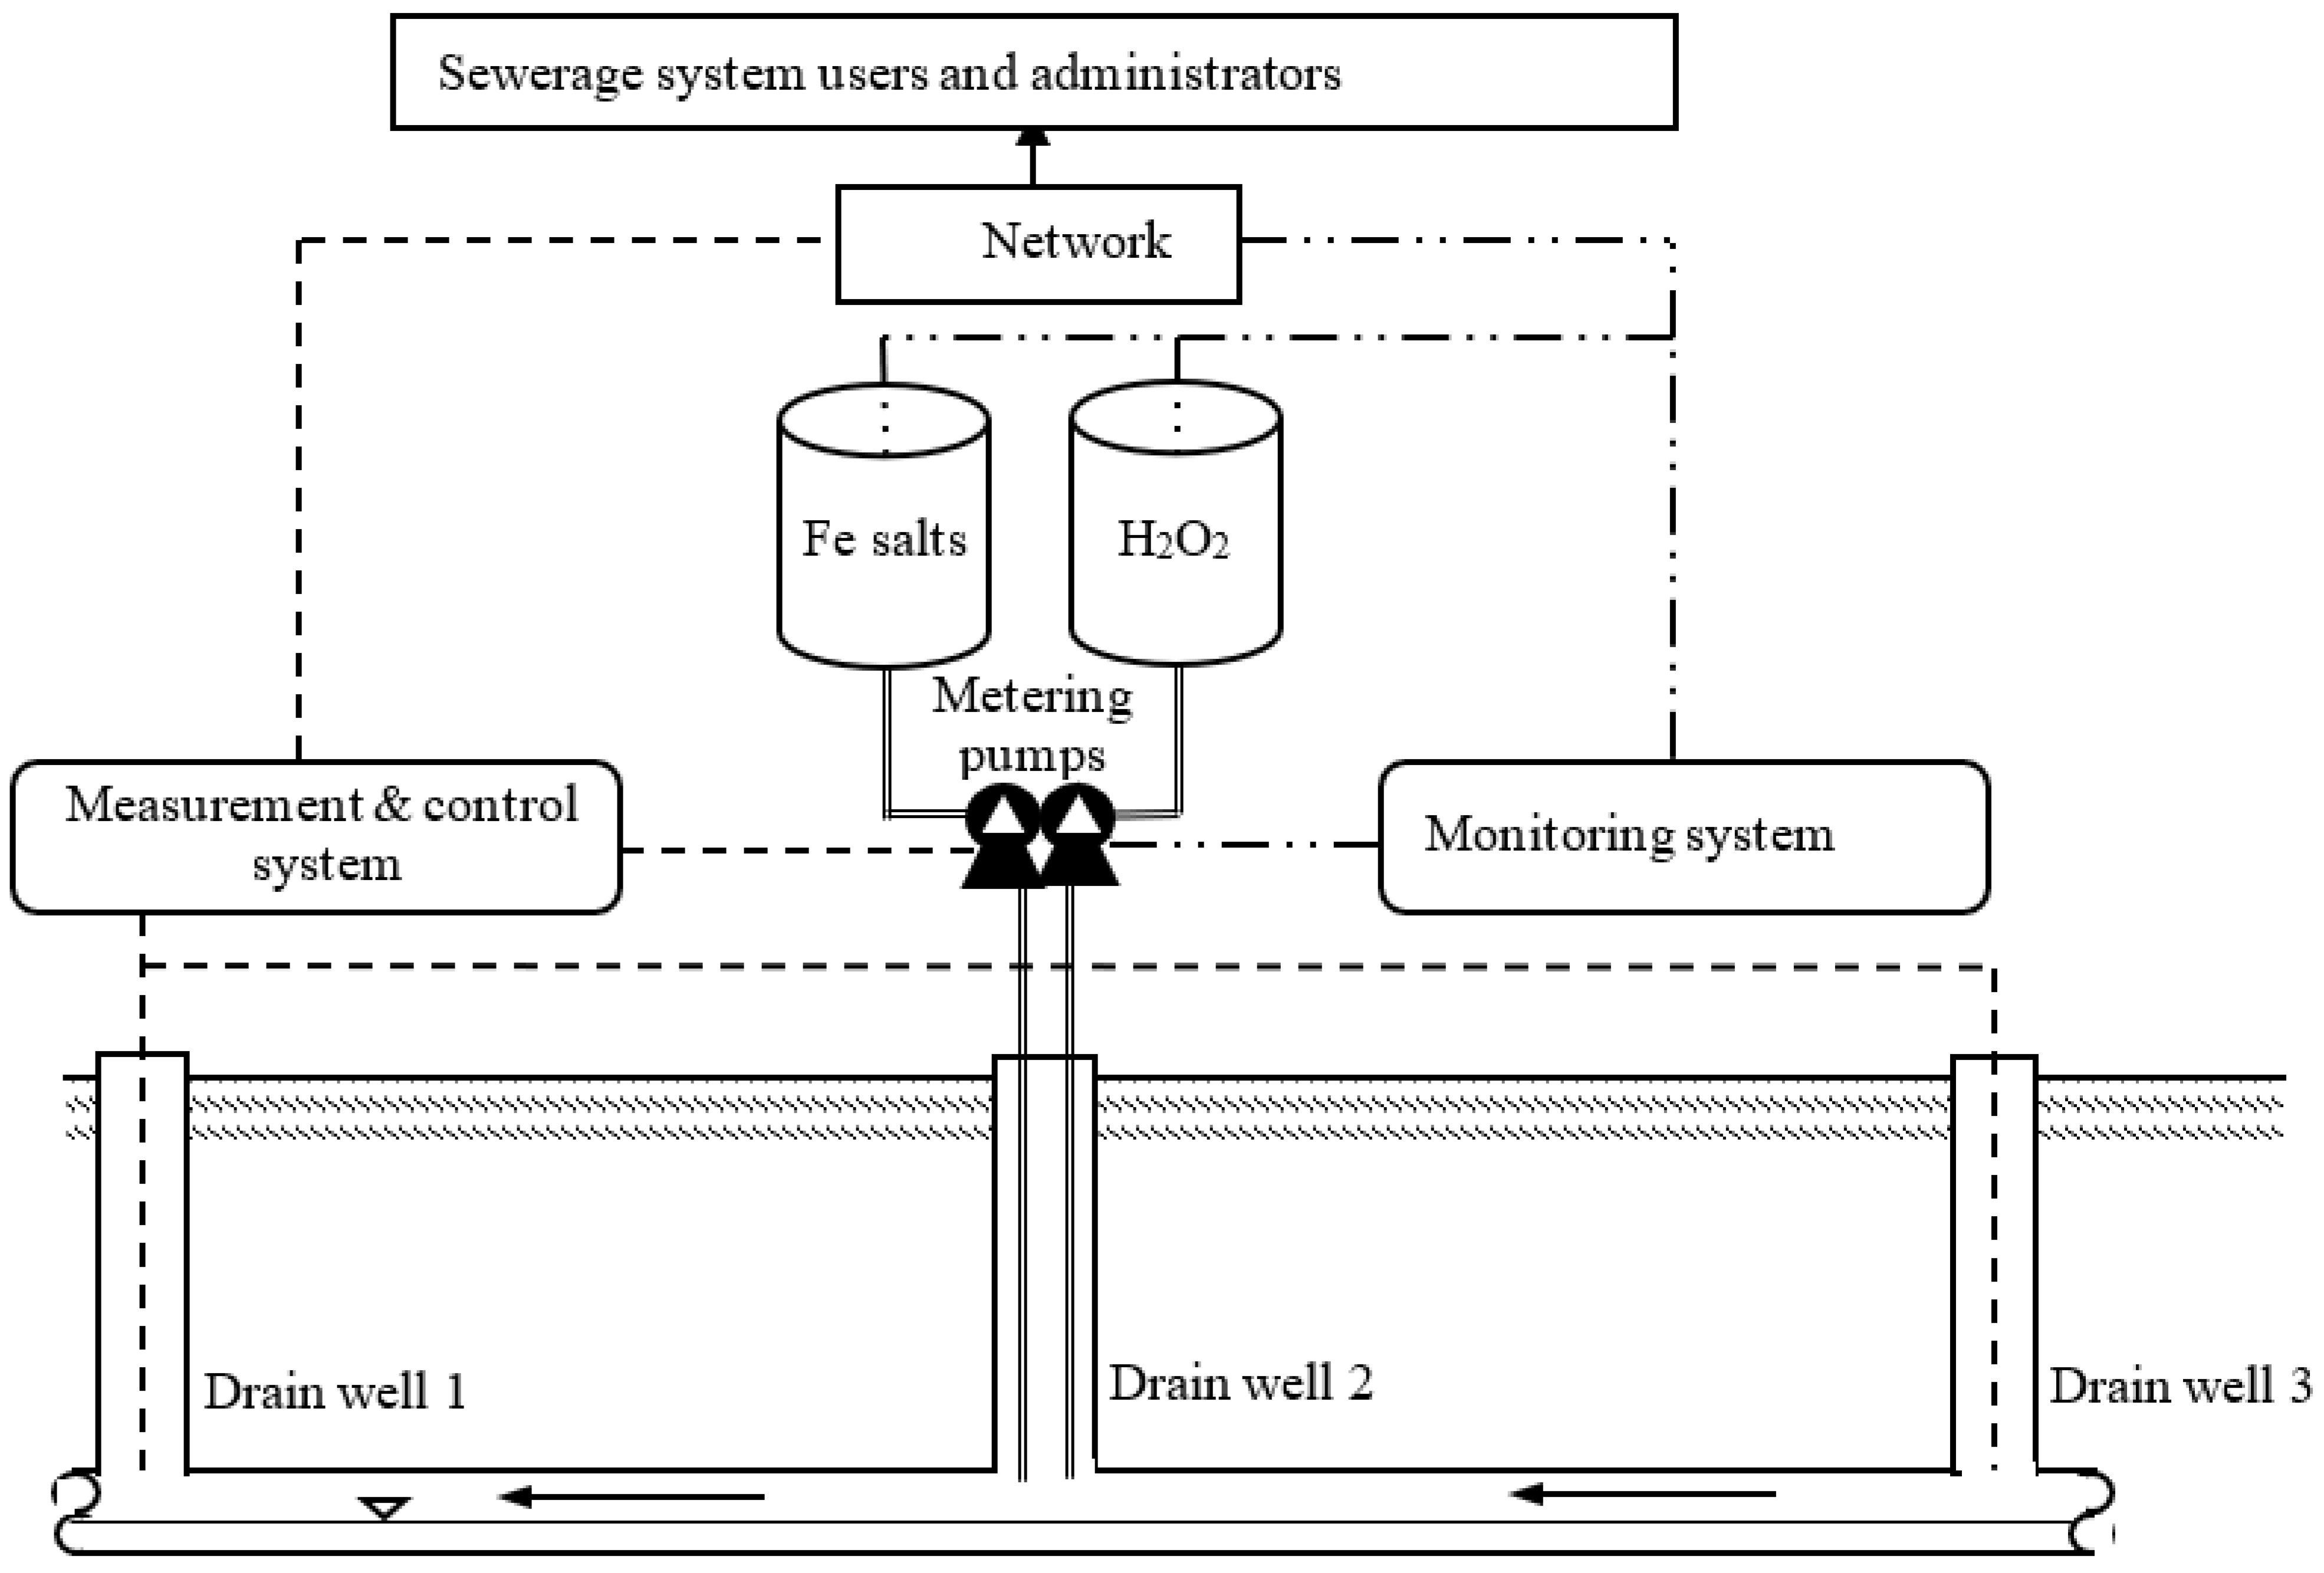
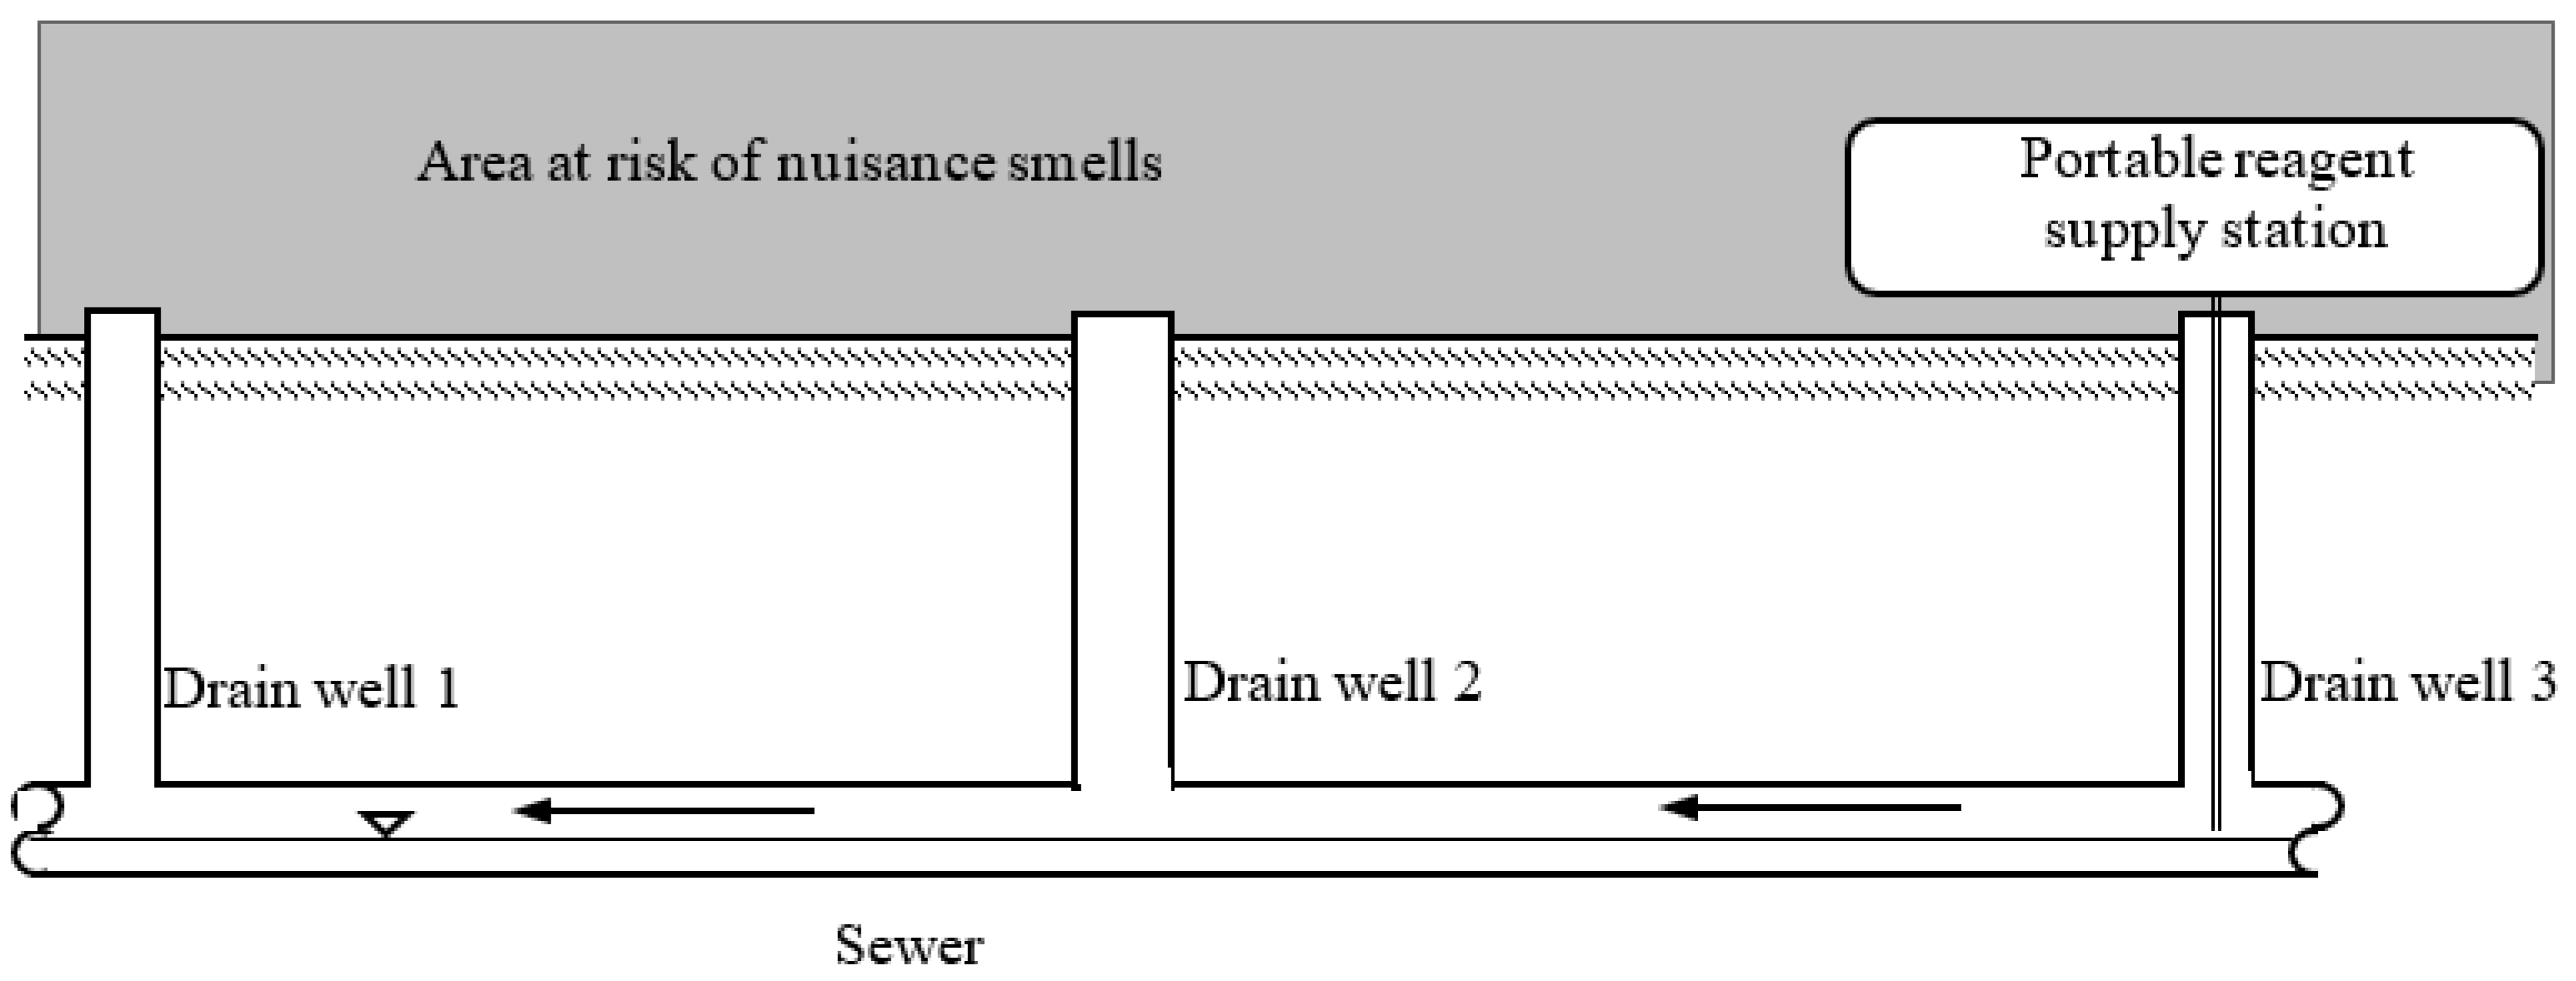
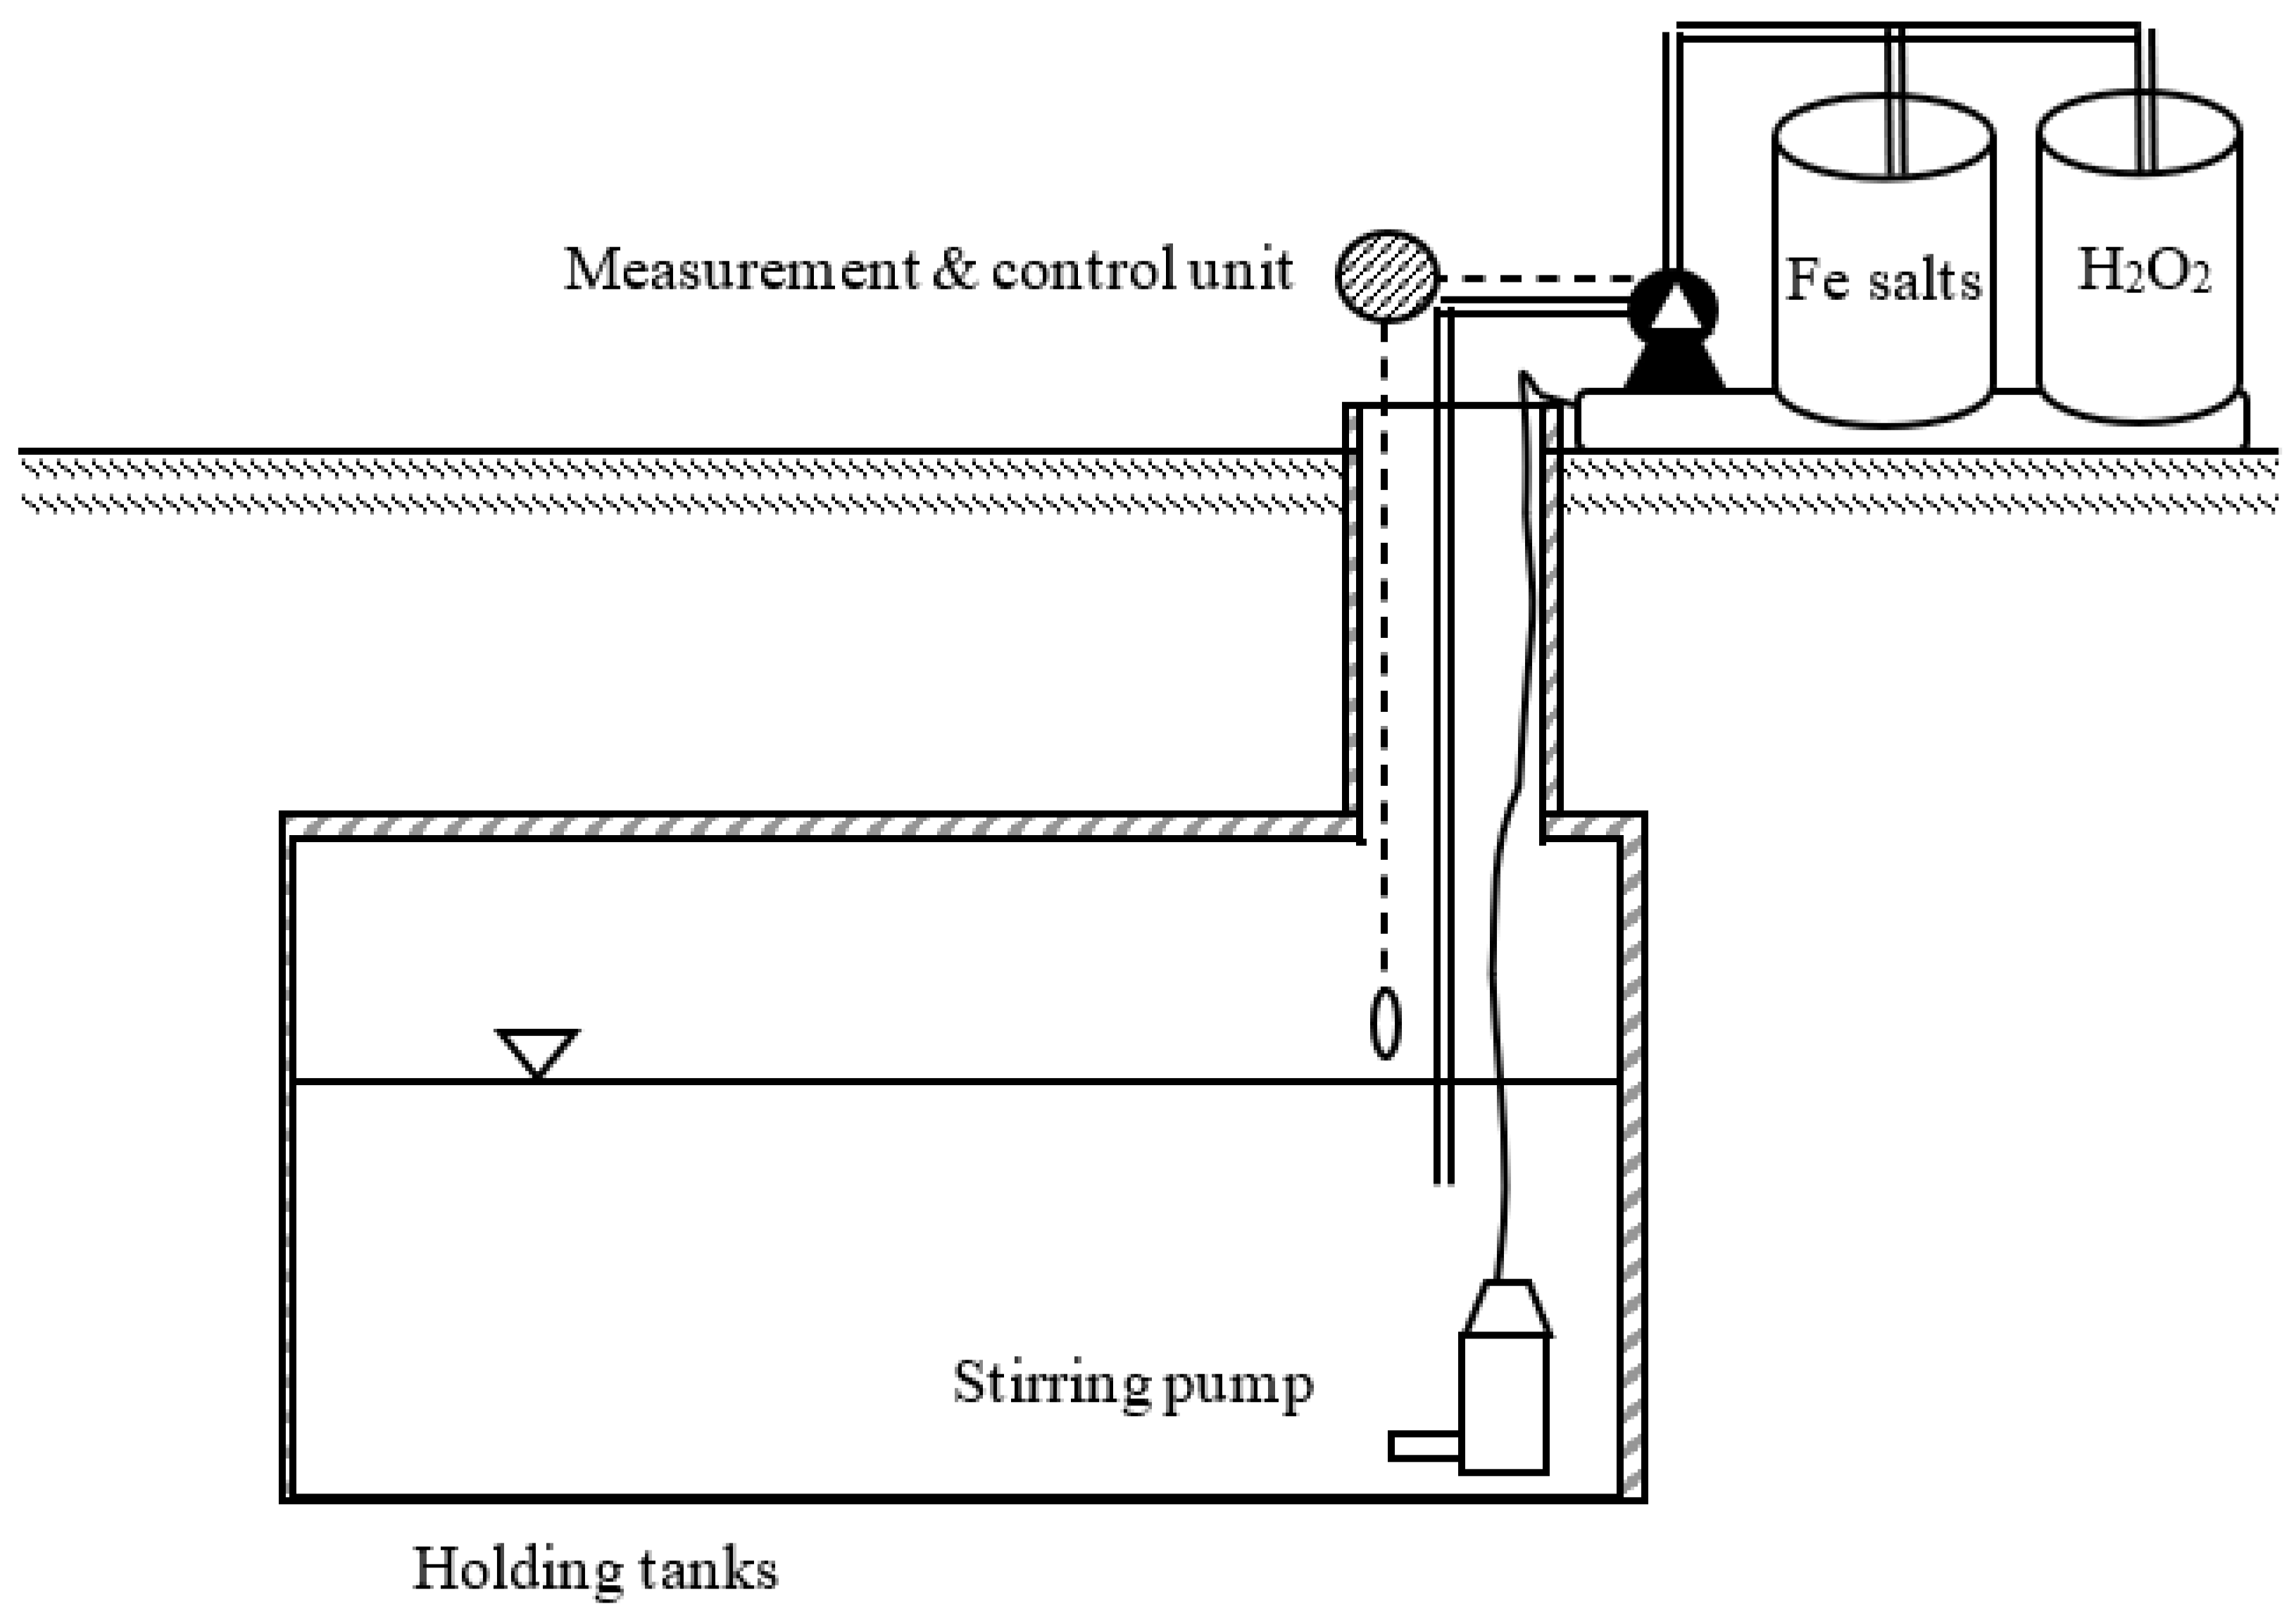
5. Process Design
6. Conclusions
Supplementary Materials
Author Contributions
Funding
Institutional Review Board Statement
Informed Consent Statement
Data Availability Statement
Conflicts of Interest
References
- Meeroff, D.E.; Binninger, D.M. Development of A Biosensor for Measuring Odorants in the Ambient Air Near Solid Waste Management Facilities Final Report; Hinkley Center for Solid and Hazardous Waste Management University of Florida: Gainesville, FL, USA, 2021. [Google Scholar]
- Kazimierowicz, J.; Dzienis, L.; Dębowski, M.; Zieliński, M. Optimisation of methane fermentation as a valorisation method for food waste products. Biomass Bioenergy 2021, 144, 105913. [Google Scholar] [CrossRef]
- Kazimierowicz, J. Organic waste used in agricultural biogas plants. J. Ecol. Eng. 2014, 15, 88–92. [Google Scholar] [CrossRef]
- Jinjaruk, T.; Maskulrath, P.; Choeihom, C.; Chunkao, K. The Appropriate Biochemical Oxygen Demand Concentration for Designing Domestic Wastewater Treatment Plant. EnvironmentAsia 2019, 12, 162–168. [Google Scholar] [CrossRef]
- Krzemieniewski, M.; Dębowski, M.; Dobrzyńska, A.; Zieliński, M. Chemical Oxygen Demand Reduction of Various Wastewater Types Using Magnetic Field-assisted Fenton Reaction. Water Environ. Res. 2004, 76, 301–309. [Google Scholar] [CrossRef]
- Arkanova, I.A.; Ulrikh, D.V. Modern technology of sulphide-bearing wastewater sanitation. IOP Conf. Ser. Mater. Sci. Eng. 2018, 451, 012234. [Google Scholar] [CrossRef] [Green Version]
- Piccardo, M.T.; Geretto, M.; Pulliero, A.; Izzotti, A. Odor emissions: A public health concern for health risk perception. Environ. Res. 2022, 204, 112121. [Google Scholar] [CrossRef]
- Bokowa, A.; Diaz, C.; Koziel, J.A.; McGinley, M.; Barclay, J.; Schauberger, G.; Guillot, J.-M.; Sneath, R.; Capelli, L.; Zorich, V.; et al. Summary and Overview of the Odour Regulations Worldwide. Atmosphere 2021, 12, 206. [Google Scholar] [CrossRef]
- Schauberger, G.; Piringer, M.; Wu, C.; Koziel, J.A. Environmental Odour. Atmosphere 2021, 12, 1293. [Google Scholar] [CrossRef]
- Pochwat, K.; Kida, M.; Ziembowicz, S.; Koszelnik, P. Odours in Sewerage—A Description of Emissions and of Technical Abatement Measures. Environments 2019, 6, 89. [Google Scholar] [CrossRef] [Green Version]
- Wiśniewska, M.; Kulig, A.; Lelicińska-Serafin, K. Odour Emissions of Municipal Waste Biogas Plants—Impact of Technological Factors, Air Temperature and Humidity. Appl. Sci. 2020, 10, 1093. [Google Scholar] [CrossRef]
- Turek, P. Recruiting, training and managing a sensory panel in odor nuisance testing. PLoS ONE 2021, 16, e0258057. [Google Scholar] [CrossRef]
- Wojnarowska, M.; Soltysik, M.; Turek, P.; Szakiel, J. Odour nuisance as a consequence of preparation for circular economy. Eur. Res. Stud. J. XXIII 2020, 1, 128–142. [Google Scholar] [CrossRef] [Green Version]
- Torresin, S.; Pernigotto, G.; Cappelletti, F.; Gasparella, A. Combined effects of environmental factors on human perception and objective performance: A review of experimental laboratory works. Indoor Air 2018, 28, 525–538. [Google Scholar] [CrossRef]
- Conti, C.; Guarino, M.; Bacenetti, J. Measurements techniques and models to assess odor annoyance: A review. Environ. international 2020, 134, 105261. [Google Scholar] [CrossRef]
- Hamoda, M.F.; Alshalahi, S.F. Assessment of hydrogen sulfide emission in a wastewater pumping station. Environ. Monit. Assess. 2021, 193, 1–16. [Google Scholar] [CrossRef]
- European Union. Commission Directive 2009/161/EU of 17 December 2009. Establishing a Third List of Indicative Occupational Exposure Limit Values in Implementation of Council Directive 98/24/EC and Amending Commission Directive 2000/39/ECText with EEA Relevance. In Official Journal of the European Union; European Union: Maastricht, The Netherlands, 2009; p. 3. [Google Scholar]
- Austigard, Å.D.; Svendsen, K.; Heldal, K.K. Hydrogen sulphide exposure in waste water treatment. J. Occup. Med. Toxicol. 2018, 13, 10. [Google Scholar] [CrossRef] [Green Version]
- Godoi, A.F.L.; Grasel, A.M.; Polezer, G.; Brown, A.; Potgieter-Vermaak, S.; Scremim, D.C.; Yamamoto, C.I.; Godoi, R.H.M. Human exposure to hydrogen sulphide concentrations near wastewater treatment plants. Sci. Total Environ. 2018, 610, 583–590. [Google Scholar] [CrossRef]
- Fan, F.; Xu, R.; Wang, D.; Meng, F. Application of activated sludge for odor control in wastewater treatment plants: Approaches, advances and outlooks. Water Res. 2020, 181, 115915. [Google Scholar] [CrossRef]
- O’Neill, T.; Rynk, R.; Black, G.; Bokowa, A.F. Odor management and community relations. In The Composting Handbook; Academic Press: Cambridge, MA, USA, 2020; pp. 549–625. [Google Scholar] [CrossRef]
- Badach, J.; Kolasińska, P.; Paciorek, M.; Wojnowski, W.; Dymerski, T.; Gębicki, J.; Dymnicka, M.; Namieśnik, J. A case study of odour nuisance evaluation in the context of integrated urban planning. J. Environ. Manag. 2018, 213, 417–424. [Google Scholar] [CrossRef]
- João, J.J.; Silva, C.S.D.; Vieira, J.L.; Silveira, M.F. Treatment of swine wastewater using the Fenton process with ultrasound and recycled iron. Rev. Ambiente Água 2020, 15, 1–12. [Google Scholar] [CrossRef]
- Krzemieniewski, M.; Debowski, M.; Janczukowicz, W.; Pesta, J. Effect of Sludge Conditioning by Chemical Methods with Magnetic Field Application. Pol. J. Environ. Stud. 2003, 12, 595–605. [Google Scholar]
- Domingues, E.; Fernandes, E.; Gomes, J.; Martins, R.C. Advanced oxidation processes perspective regarding swine wastewater treatment. Sci. Total Environ. 2021, 776, 145958. [Google Scholar] [CrossRef]
- Cuerda-Correa, E.M.; Alexandre-Franco, M.F.; Fernández-González, C. Advanced Oxidation Processes for the Removal of Antibiotics from Water. An Overview. Water 2020, 12, 102. [Google Scholar] [CrossRef] [Green Version]
- Jaltade, A.S.; Mokadam, A.M.; Gulhane, M.L. Treatment of Dairy Wastewater Using the Fenton’s Oxidation Process (FOP). In Global Challenges in Energy and Environment; Lecture Notes on Multidisciplinary Industrial, Engineering; Sivasubramanian, V., Subramanian, S., Eds.; Springer: Singapore, 2020. [Google Scholar] [CrossRef]
- Ebrahiem, E.E.; Al-Maghrabi, M.N.; Mobarki, A.R. Removal of organic pollutants from industrial wastewater by applying photo-Fenton oxidation technology. Arab. J. Chem. 2017, 10, S1674–S1679. [Google Scholar] [CrossRef]
- ISO/IEC 17025:2017; Guideline Standard for the Competence of Testing and Calibration Laboratories. ISO: Geneva, Switzerland, 2017.
- CEN. EN 13725:2003; Air quality. Determination of Odour Concentration by Dynamic Olfactometry (European Standard EN 13725:2003). European Committee for Standardization: Brussels, Belgium, 2003.
- Vihervuori, P. Environmental Law in Finland; Kluwer Law International BV: The Hague, The Netherlands; London, UK; Boston, MA, USA, 2021. [Google Scholar]
- Pawnuk, M.; Grzelka, A.; Miller, U.; Sówka, I. Prevention and Reduction of Odour Nuisance in Waste Management in the Context of the Current Legal and Technological Solutions. J. Ecol. Eng. 2020, 21, 34–41. [Google Scholar] [CrossRef]
- Steinhäuser, K.G.; Von Gleich, A.; Große Ophoff, M.; Körner, W. The Necessity of a Global Binding Framework for Sustainable Management of Chemicals and Materials—Interactions with Climate and Biodiversity. Sustain. Chem. 2022, 3, 205–237. [Google Scholar] [CrossRef]
- USP Technologies Hydrogen Peroxide is a Powerful Oxidizer, Full-Service Wastewater Treatment Programs for Municipal, Industrial and Refinery Applications. Available online: https://www.h2o2.com/products-and-services/us-peroxide-technologies.aspx?pid=112&name=Hydrogen-Peroxide (accessed on 21 July 2020).
- Shivasankaran, N.; Balan, A.V.; Sankar, S.P.; Magibalan, S.; Dinesh, C.M. Removal of hydrogen sulphide and odour from tannery & textile effluents. Mater. Today Proc. 2020, 21, 777–781. [Google Scholar] [CrossRef]
- Liu, Y.; Liu, Z.; Wang, Y.; Yin, Y.; Pan, J.; Zhang, J.; Wang, Q. Simultaneous absorption of SO2 and NO from flue gas using ultrasound/Fe2+/heat coactivated persulfate system. J. Hazard. Mater. 2017, 342, 326–334. [Google Scholar] [CrossRef]
- Liu, Y.X.; Wang, Y.; Wang, Q.; Pan, J.F.; Zhang, J. Simultaneous removal of NO and SO2 using vacuum ultraviolet light (VUV)/heat/peroxymonosulfate (PMS). Chemosphere 2018, 190, 431–441. [Google Scholar] [CrossRef]
- Jürgens, M.; Jacob, F.; Ekici, P.; Friess, A.; Parlar, H. Determination of direct photolysis rate constants and OH radical reactivity of representative odour compounds in brewery broth using a continuous flow-stirred photoreactor. Atmos. Environ. 2007, 41, 4571–4584. [Google Scholar] [CrossRef]
- El Brahmi, A.; Abderafi, S. Hydrogen sulfide removal from wastewater using hydrogen peroxide in-situ treatment: Case study of Moroccan urban sewers. Mater. Today Proc. 2021, 45, 7424–7427. [Google Scholar] [CrossRef]
- Beniwal, D.; Taylor-Edmonds, L.; Armour, J.; Andrews, R.C. Ozone/peroxide advanced oxidation in combination with biofiltration for taste and odour control and organics removal. Chemosphere 2018, 212, 272–281. [Google Scholar] [CrossRef] [PubMed] [Green Version]
- Wysocka, I.; Gębicki, J.; Namieśnik, J. Technologies for deodorization of malodorous gases. Environ. Sci. Pollut. Res. 2019, 26, 9409–9434. [Google Scholar] [CrossRef] [Green Version]
- Dec, J.; Bruns, M.A.; Cai, L.; Koziel, J.A.; Snyder, E.M.; Kephart, K.B.; Watson, J.E. Removal of odorants from animal waste using Fenton’s reaction. In Proceedings of the International Symposium on Air Quality and Waste Management for Agriculture, Broomfield, Colorado, 16–19 September 2007; American Society of Agricultural and Biological Engineers: St. Joseph, MI, USA, 2007; p. 38. [Google Scholar] [CrossRef]
- Zhou, H.; Zhang, H.; He, Y.; Huang, B.; Zhou, C.; Yao, G.; Lai, B. Critical review of reductant-enhanced peroxide activation processes: Trade-off between accelerated Fe3+/Fe2+ cycle and quenching reactions. Appl. Catal. B Environ. 2021, 286, 119900. [Google Scholar] [CrossRef]
- Tsoumachidou, S.; Berberidou, C.; Kitsiou, V.; Poulios, I. Photocatalytic oxidation of simulated and real hazardous medical wastewater: Decolorization, mineralization and toxicity evaluation. J. Chem. Technol. Biotechnol. 2021, 96, 3207–3215. [Google Scholar] [CrossRef]
- Robles, Á.; Aguado, D.; Barat, R.; Borrás, L.; Bouzas, A.; Giménez, J.B.; Seco, A. New frontiers from removal to recycling of nitrogen and phosphorus from wastewater in the Circular Economy. Bioresour. Technol. 2020, 300, 122673. [Google Scholar] [CrossRef]
- Guo, R.T.; Pan, W.G.; Zhang, X.B.; Ren, J.X.; Qiang, J.; Xu, H.J.; Jiang, W. Removal of NO by using Fenton reagent solution in a lab-scale bubbling reactor. Fuel 2011, 90, 3295–3298. [Google Scholar] [CrossRef]
- Zhao, Y.; Wen, X.; Guo, T.; Zhou, J. Desulfurization and denitrogenation from flue gas using Fenton reagent. Fuel Process. Technol. 2014, 128, 54–60. [Google Scholar] [CrossRef]
- Gozzi, F.; Sirés, I.; de Oliveira, S.C.; Machulek Jr, A.; Brillas, E. Influence of chelation on the Fenton-based electrochemical degradation of herbicide tebuthiuron. Chemosphere 2018, 199, 709–717. [Google Scholar] [CrossRef] [Green Version]
- Xu, M.; Wu, C.; Zhou, Y. Advancements in the Fenton process for wastewater treatment. In Advanced Oxidation Processes—Applications, Trends, and Prospects; IntechOpen: London, UK, 2020; p. 61. [Google Scholar]
- Timoshnikov, V.A.; Kobzeva, T.V.; Polyakov, N.E.; Kontoghiorghes, G.J. Redox Interactions of Vitamin C and Iron: Inhibition of the Pro-Oxidant Activity by Deferiprone. Int. J. Mol. Sci. 2020, 21, 3967. [Google Scholar] [CrossRef]
- Liu, Y.; Xu, W.; Pan, J.; Wang, Q. Oxidative removal of NO from flue gas using ultrasound, Mn2+/Fe2+ and heat coactivation of Oxone in an ultrasonic bubble reactor. Chem. Eng. J. 2017, 326, 1166–1176. [Google Scholar] [CrossRef]
- Wang, Y.; Wang, Z.; Pan, J.; Liu, Y. Removal of gaseous hydrogen sulfide using Fenton reagent in a spraying reactor. Fuel 2019, 239, 70–75. [Google Scholar] [CrossRef]
- Lu, D.; Anthony, E.J.; Tan, Y.; Dureau, R.; Ko, V.; Douglas, M.A. Mercury removal from coal combustion by Fenton reactions–Part A: Bench-scale tests. Fuel 2007, 86, 2789–2797. [Google Scholar] [CrossRef]
- Zhang, X.; Li, H.; Li, Y.; Guo, F.; Yang, Z.; Bai, J. Do Wet-Dry Ratio and Fe-Mn System Affect Oxidation-Reduction Potential Nonlinearly in the Subsurface Wastewater Infiltration Systems? Int. J. Environ. Res. Public Health 2018, 15, 2790. [Google Scholar] [CrossRef] [PubMed] [Green Version]
- Mamun, K.A.; Islam, F.R.; Haque, R.; Khan, M.G.M.; Prasad, A.N.; Haqva, H.; Mudliar, R.R.; Mani, F.S. Smart Water Quality Monitoring System Design and KPIs Analysis: Case Sites of Fiji Surface Water. Sustainability 2019, 11, 7110. [Google Scholar] [CrossRef] [Green Version]
- Rahman, M.; Hasan, M.S.; Islam, R.; Rana, R.; Sayem, A.; Sad, M.A.A.; Matin, A.; Raposo, A.; Zandonadi, R.P.; Han, H.; et al. Plasma-Activated Water for Food Safety and Quality: A Review of Recent Developments. Int. J. Environ. Res. Public Health 2022, 19, 6630. [Google Scholar] [CrossRef]
- Martín de la Vega, P.T.; Jaramillo-Morán, M.A. Multilevel Adaptive Control of Alternating Aeration Cycles in Wastewater Treatment to Improve Nitrogen and Phosphorous Removal and to Obtain Energy Saving. Water 2019, 11, 60. [Google Scholar] [CrossRef] [Green Version]
- Walker, G.A.; Nelson, J.; Halligan, T.; Lima, M.M.M.; Knoesen, A.; Runnebaum, R.C. Monitoring Site-Specific Fermentation Outcomes via Oxidation Reduction Potential and UV-Vis Spectroscopy to Characterize “Hidden” Parameters of Pinot Noir Wine Fermentations. Molecules 2021, 26, 4748. [Google Scholar] [CrossRef]
- Dębowski, M.; Krzemieniewski, M. The influence of Fenton’s reagent on the raw sludge disinfection. Environ. Protect. Engin. 2007, 33, 65–76. [Google Scholar]
- Xu, Y.; Zeng, L.; Li, L.; Chang, Y.; Gong, J. Enhanced oxidative activity of zero-valent iron by citric acid complexation. Chem. Eng. J. 2019, 373, 891–901. [Google Scholar] [CrossRef]
- Dębowski, M.; Krzemieniewski, M.; Zieliński, M. Constant Magnetic Field Influence on Stabilization of Excess Sludge with Fenton’s Reagent. Pol. J. Environ. Stud. 2007, 16, 43–50. [Google Scholar]
- Konkol, D.; Popiela, E.; Skrzypczak, D.; Izydorczyk, G.; Mikula, K.; Moustakas, K.; Opaliński, S.; Korczyński, M.; Witek-Krowiak, A.; Chojnacka, K. Recent innovations in various methods of harmful gases conversion and its mechanism in poultry farms. Environ. Res. 2022, 214, 113825. [Google Scholar] [CrossRef] [PubMed]
- Krüger, R.L.; Dallago, R.M.; Di Luccio, M. Degradation of dimethyl disulfide using homogeneous Fenton’s reaction. J. Hazard. materials 2009, 169, 443–447. [Google Scholar] [CrossRef]
- Yi, Q.; Ji, J.; Shen, B.; Dong, C.; Liu, J.; Zhang, J.; Xing, M. Singlet oxygen triggered by superoxide radicals in a molybdenum cocatalytic Fenton reaction with enhanced REDOX activity in the environment. Environ. Sci. Technol. 2019, 53, 9725–9733. [Google Scholar] [CrossRef] [PubMed]


| VARIANT | STAGE 1 (S1) | STAGE 2 (S2) | STAGE 3 (S3) | STAGE 4 (S4) | STAGE 5 (S5) | ||
|---|---|---|---|---|---|---|---|
| Fe2+ [g/dm3] | H2O2 [g/dm3] | Fe3+ [g/dm3] | H2O2 [g/dm3] | H2O2 [g/dm3] | Fe2+ [g/dm3] | Fe3+ [g/dm3] | |
| 1 (V1) | 0.1 | 0.5 | 0.1 | 0.5 | 0.5 | 0.1 | 0.1 |
| 1 (V2) | 0.1 | 1.0 | 0.1 | 1.0 | 1.0 | - | - |
| 3 (V3) | 0.1 | 2.0 | 0.1 | 2.0 | 2.0 | - | - |
| Parameter | Unit | Value |
|---|---|---|
| COD | mgO2/dm3 | 519 ± 91 |
| TOC | mg/dm3 | 132 ± 19 |
| BOD5 | mgO2/dm3 | 271 ± 36 |
| TSS | mgd.m./dm3 | 380 ± 101 |
| TN | mgNtot./dm3 | 68.3 ± 4.2 |
| TP | mgPtot./dm3 | 7.1 ± 1.9 |
| Sulfates | mgSO4/dm3 | 78 ± 4.9 |
| Sulfides | mgS2−/dm3 | 0.123 ± 10 |
| pH | - | 7.25 ± 0.25 |
Publisher’s Note: MDPI stays neutral with regard to jurisdictional claims in published maps and institutional affiliations. |
© 2022 by the authors. Licensee MDPI, Basel, Switzerland. This article is an open access article distributed under the terms and conditions of the Creative Commons Attribution (CC BY) license (https://creativecommons.org/licenses/by/4.0/).
Share and Cite
Dębowski, M.; Kazimierowicz, J.; Zieliński, M. Advanced Oxidation Processes to Reduce Odor Emissions from Municipal Wastewater—Comprehensive Studies and Technological Concepts. Atmosphere 2022, 13, 1724. https://doi.org/10.3390/atmos13101724
Dębowski M, Kazimierowicz J, Zieliński M. Advanced Oxidation Processes to Reduce Odor Emissions from Municipal Wastewater—Comprehensive Studies and Technological Concepts. Atmosphere. 2022; 13(10):1724. https://doi.org/10.3390/atmos13101724
Chicago/Turabian StyleDębowski, Marcin, Joanna Kazimierowicz, and Marcin Zieliński. 2022. "Advanced Oxidation Processes to Reduce Odor Emissions from Municipal Wastewater—Comprehensive Studies and Technological Concepts" Atmosphere 13, no. 10: 1724. https://doi.org/10.3390/atmos13101724