Article

Effect of Odor-Treatment Biofilter on Bioaerosols from an Indoor Wastewater Treatment Plant

by
Amélia Bélanger Cayouette
1,2,
Arthur Ouradou
3,
Marc Veillette
1,
Nathalie Turgeon
1,
Paul B. L. George
1,2,
Stéphane Corbin
4,
Christian Boulanger
4,
Caroline Duchaine
1,2 and
Emilie Bédard
3,*
1
Centre de Recherche de l’Institut Universitaire de Cardiologie et de Pneumologie de Québec, Université Laval, Québec, QC G1V 4G5, Canada
2
Département de Biochimie, de Microbiologie et de Bio-Informatique, Faculté des Sciences et de Génie, Université Laval, Québec, QC G1V 0A6, Canada
3
Department of Civil, Geological and Mining Engineering, Polytechnique Montréal, Québec, QC H3T 1J4, Canada
4
Ville de Repentigny, Repentigny, QC J6A 0A6, Canada
*
Author to whom correspondence should be addressed.
Atmosphere 2022, 13(10), 1723; https://doi.org/10.3390/atmos13101723
Submission received: 13 September 2022 / Revised: 13 October 2022 / Accepted: 17 October 2022 / Published: 20 October 2022
(This article belongs to the Special Issue Airborne Microbiota in Indoor and Occupational Environments)

Abstract

:
Wastewater treatment plants (WWTPs) are confirmed sources of bioaerosols and can be a hotspot for both antibiotic-resistant bacteria and antibiotic-resistant genes (ARGs). Bioaerosols can be a source of dispersion for bacteria and ARGs into the environment. Biofiltration is one of the most effective technologies to mitigate odors from WWTPs. The objective of this study was to evaluate the capacity of an odor biofiltration system designed to remove volatile compounds, to influence the airborne bacterial diversity and to reduce the aerosolized microbial and ARG concentrations. In total, 28 air samples were collected before and after treatment of an interior WWTP. Overall, air samples collected upstream had higher total bacterial concentrations, and a shift in bacterial diversity was observed. Legionella and Mycobacterium were detected in low abundance upstream and downstream, whereas Legionella pneumophila was detected but not quantifiable in two samples. Of the 31 ARGs and mobile genetic elements detected by quantitative polymerase chain reaction, 15 exhibited a significant reduction in their relative abundance after biofiltration, and none were significantly higher in the effluent. Overall, these results show the benefits of odor biofiltration systems to reduce bacterial and antimicrobial resistance in treated air, a promising application to limit environmental dispersion.

1. Introduction

Wastewater treatment plants (WWTPs) are confirmed sources of bioaerosols containing microorganisms present in water and sediments, including bacteria, viruses, and protozoa [1,2,3]. They can also be a hotspot for the spread of antibiotic-resistant bacteria (ARB) and antibiotic-resistant genes (ARGs) [4,5,6]. Antimicrobial resistance is a global issue that will only worsen over time. If no changes are made, the World Health Organization (WHO) predicts that the number of associated deaths will reach 10 million yearly by 2050. Resistance to different antibiotics, such as β-lactams, aminoglycosides, glycopeptides, quinolones, sulfonamides, tetracyclines, polymyxin, and macrolides, is of particular concern for health authorities [7,8]. There is a need to better understand and control how antibiotic-resistant bacteria (ARB) and antibiotic-resistant genes (ARGs) spread. Bioaerosols emitted through wastewater treatment can be a source dispersing ARB and ARGs into the environment [9].
Bioaerosols are produced through all steps of the wastewater treatment process, reaching bacterial concentrations between 104 and 108 colony-forming units (CFU) per cubic meter for indoor facilities, regardless of the season [10]. These bioaerosols can be dispersed within the plant or to the environment through the ventilation system. These microorganisms can cause respiratory disease and gastroenteritis in workers [11]. Their dispersion in the environment is subject to many factors. Wind strength is critical in dispersing airborne loads [12], while relative humidity prevents the inactivation of microorganisms by solar UV radiation [13]. The chemical composition of generated bioaerosols can also be conducive to the survival of airborne microorganisms [14]. Thus, depending on meteorological factors and the sampling period, the bioaerosol can be dispersed up to 10 km beyond the plant’s emission point (30 CFU total bacteria/m3) [9,15]. Opportunistic pathogens can also be present in the wastewater and be aerosolized. For example, the presence of Legionella spp. and Mycobacterium spp. was confirmed in bioaerosols sampled in WWTPs [14,16,17,18,19,20]. It is therefore important to identify approaches to reduce the release of bioaerosols from WWTPs to reduce workers’ exposure, as well as that of the nearby population.
Odor control can also be a challenge for WWTPs. The odors and other air pollutants emitted by WTTPs located in residential areas may affect quality of life for the residents. Various compounds are responsible for such odors: acetone, propanol, butanol, hydrogen sulfide, and acetic acid are amongst the chemicals emitted at various steps [21]. Several technologies and solutions exist to mitigate odors. One of the most effective methods to date is biofiltration, providing a removal efficiency between 75% and 99% of all undesirable volatile organic and inorganic compounds from a WWTP [22]. This proven method has been used since the early 1950s, due to its efficiency, low energy consumption, and moderate process water demand [22]. The main disadvantage is the space required.
Biofiltration systems are designed and optimized to remove volatile compounds from the air in WTTPs. They could, however, also play a role in reducing bioaerosol emissions by the plants. Although not designed for this purpose, the possible efficiency of biofiltration odor control systems in reducing bioaerosol emissions is an important but poorly studied question. The objective of this study was to evaluate the capacity of an odor control biofiltration system to reduce the concentration of bacteria and ARGs emitted in the treated air of the plant to its immediate surroundings. In a context where all efforts should be geared toward slowing down the dispersion and progression of antimicrobial resistance, this study provides new data on the impact and performance of biofiltration systems toward this goal. The efficiency of the system to remove odors was not studied, because this has already been researched and it is a proven technology.

2. Materials and Methods
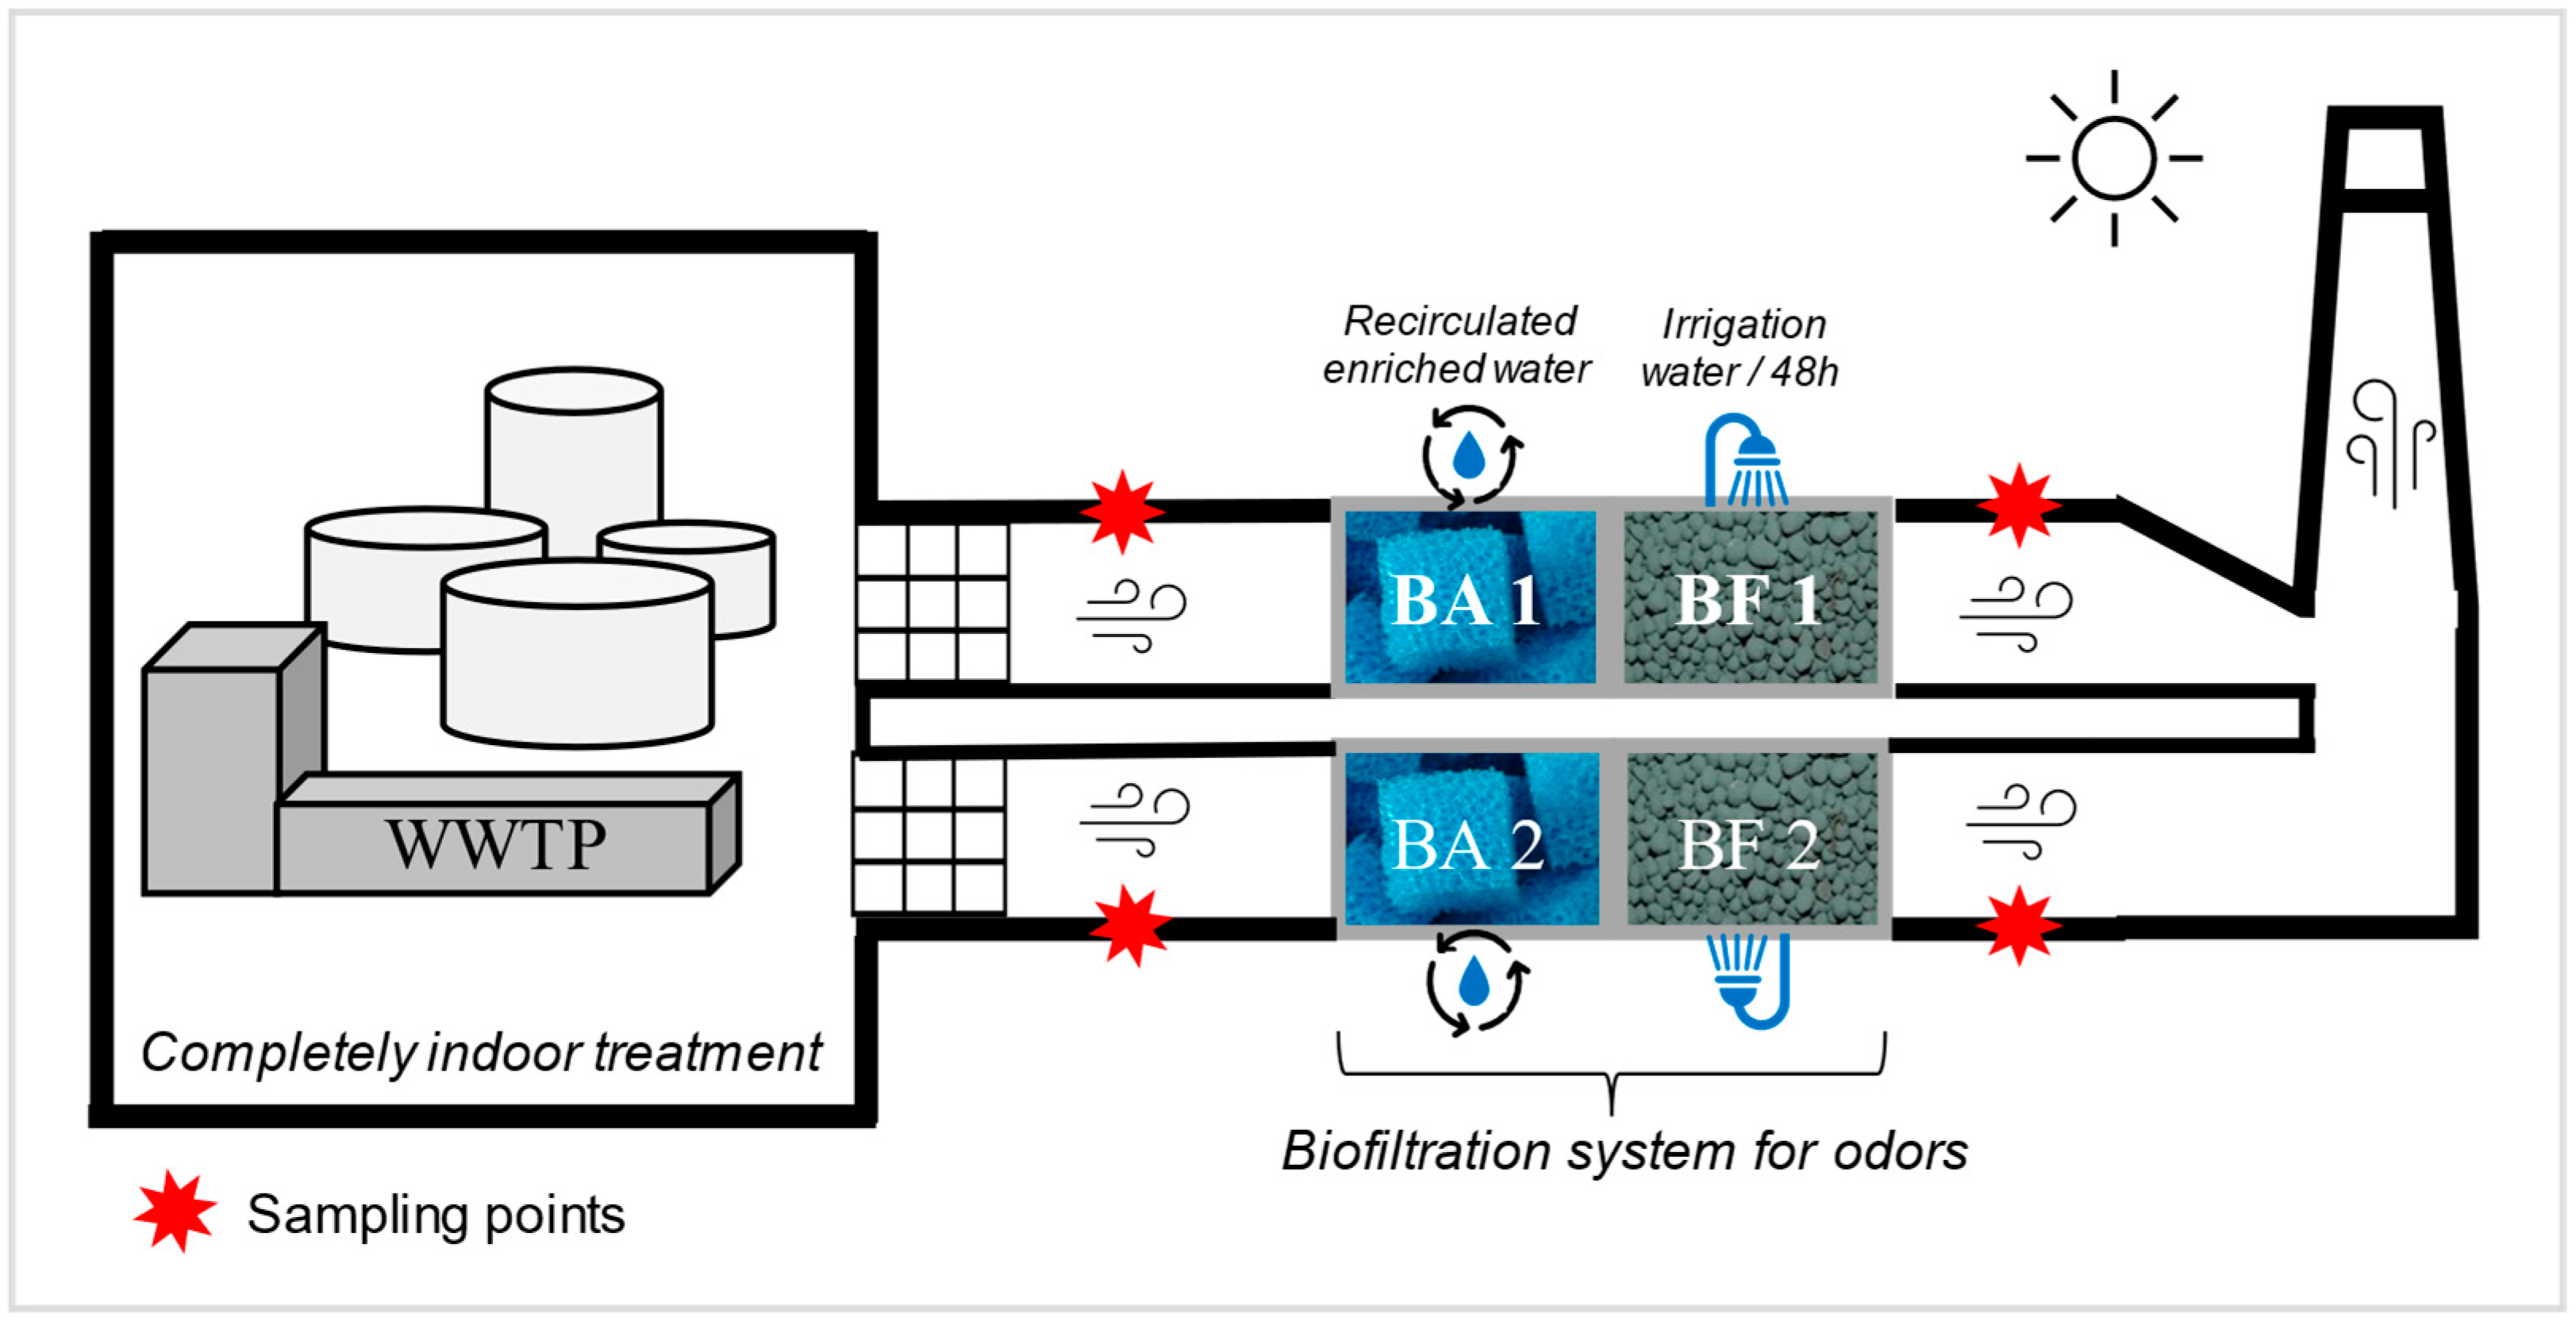
2.1. Sampling Site

Air samples were collected upstream and downstream of an air treatment system, from an indoor wastewater treatment plant located in the province of Québec. The plant treats an average 22,650 m3 of wastewater per day for a population of 65,000 people. The samples were collected on three separate days: 16, 22 and 30 June 2021. Summer was chosen for sampling, because previous studies suggested higher bacterial load emissions occurred during the summer in the eastern Canadian climate [10].
The odor treatment system was set up in 2013 in the studied WWTP and treats an airflow of 24,000 m3/h, divided into two parallel channels. The system consists of two treatment subunits. The first subunit is the bio-atomizer (Figure 1), which operates as a bio-trickling filter. It is composed of chemically inert sponge-like porous engineered media. The process water is enriched with mineral nutrients (nitrogen, phosphorus, potassium, and oligoelements). The objective is to maintain an environment conducive to the survival and growth of bacteria able to oxidize hydrogen disulfide (H2S) [23]. The aerosolized pollutant compounds are then dissolved in the liquid phase and attached to biofilms formed on the engineered media to be degraded by the microorganisms [24]. The second treatment subunit is the engineered medium biofilter (Figure 1), which is irrigated every 48 h and maintained at a neutral pH. Unlike the bio-atomizer, the irrigation water is not recirculated and is discarded afterwards. The engineered biological filtration media is the XLD® media developed by Biorem Inc© (Biorem Technologies Inc., Ontario, Canada). The objective of such media is to allow the growth of chemoheterotrophic bacteria (in charge of oxidizing carbon) and nitrifying and denitrifying bacteria (ammonia converted to nitrogen) [25]. The temperature, humidity, pH, air residence time, and pressure drop are controlled to ensure maximum removal efficiency [24]. Upstream of this treatment system, the air intakes in the WWTP are equipped with coarse pre-filters to avoid the entry of coarse particles and dust through the ducts and the air flow. This prevents the system from becoming overloaded or clogged.

2.2. Air Sampling

Two SASS 3100 dry air samplers (Research International, inc. Monroe, WA, USA) were used simultaneously to collect air samples [26]. They were simultaneously connected to the ventilation system upstream and downstream of the biofilter, on each of the two channels in parallel (red stars, Figure 1). Each channel had a diameter of 76 cm and existing ports located 210 cm before and after the air treatment unit (Figure S1). Existing ports of 2.54 cm in diameter were used to connect the samplers. A sampling tube of 2.54 cm diameter was connected between the sampler and the sampling port in the channel (Figure S1). Fans located upstream of the sampling ports ensured mixing of the air and turbulent flow. With a sampling flow rate of 300 L/min, 28 samples were collected upstream and downstream of the odor filtration system on three separate days. On the first two sampling days, a volume of 9 m3 of air was collected per sample, for a total of 10 samples upstream and 10 samples downstream. On the third day, 6 samples of 9 m3 were collected upstream, while 2 samples of 27 m3 were collected downstream. The results are expressed per cubic meter of sampled air. For each sampling day, a field blank was included. The field blank consisted of removing a filter from its packaging and inserting it on the sampler without collecting any air. The blank was then processed as a regular sample. After analysis, the blank concentration was subtracted from the concentration value of the samples.

2.3. DNA Extraction

Particles were eluted from the filters using the SASS Particle Extractor (Research International, Inc., Monroe, WA, USA) with 7 mL of a sterile elution buffer (138 mM sodium chloride, 2.7 mM potassium chloride, 10.0 mM sodium phosphate, 15.4 mM sodium azide, and 0.8 mM Triton X-100® (Fisher BioReagents™, Massachusetts, USA), following the manufacturer’s instructions. Following extraction, the recovered elution buffer was centrifuged at 20,000× g for 10 min and the pellets were used for DNA extraction using the DNeasy PowerLyzer PowerSoil Kit (Qiagen, Chatsworth, CA, USA). Manufacturer’s instructions were followed, except for the elution step where 300 µL of IDTE were used rather than 100 µL of C6 solution. The change was made to ensure a sufficient sample volume for all analyses to be performed on the DNA extract. After the DNA extraction, samples were stored at −20 °C.

2.4. Real-Time Quantitative Polymerase Chain Reaction of Total Bacteria, ARGs and Legionella Pneumophila

For each sample, the concentration of total bacteria was quantified by real-time quantitative polymerase chain reaction (qPCR) by targeting the 16S rRNA [27]. Additionally, 38 ARG and mobile genetic elements (MGE) were targeted. The selected ARGs encoded resistance to eight types of antibiotics (β-lactams, aminoglycosides, glycopeptides, quinolones, sulfonamides, tetracyclines, polymyxin, and macrolides).
The primers and probes [28] were supplied by Integrated DNA Technologies (IDT, Coralville, IA, USA) and are listed in the supplementary material (Table S1). Probes were labeled with FAM in 5′ and with a combination of Zen and Iowa black FQ quencher in 3′. Plasmids for standard curves were ordered from IDT; sequences are provided in the supplementary material (Table S2). The reaction mix for the qPCR detection of 16S total bacteria was as follows: 1000 nM forward and reverse primers, 100 nM probe, 2X BioRad iQ supermix (BioRad Laboratories, Missisauga, Canada), and 2 μL of sample DNA in 20 μL total. The reaction mix for the qPCR detection of mcr-1 and blaCTX-M-1 was as follows: 250 nM forward and reverse primers, 50 nM probe, 2X BioRad iQ supermix (BioRad Laboratories), and 2 µL of sample DNA in 20 µL total. The reaction mix for the qPCR detection of aac(6′)-II, aac(6′)-Ib, aac(3)-iid_iii_iif_iia_iie, blaCMY2, blaGES, blaVEB, blaTEM, blaVIM, blaIMP, blaMOX, blaSHVII, blaOXA, ermB, ermF, ermX, erm35, tet32, tetA, tetL, tetO, tetQ, tetS, tetW, tetX, tetM, vanA, vanB, vanRA, vanSA, sul1, sul2, qnrB, is26, tnpA, and int1-A was: 300 nM forward and reverse primers, 1X BioRad iQ SYBR green supermix, and 2 µL of sample DNA in 20 µL. Reactions were performed in BioRad CFX384 using the following protocol: 95 °C 2 min (3 min for 16S) followed by 40 cycles of 95 °C for 20 s, 62 °C for 60 s.
Legionella pneumophila (Lp), an opportunistic pathogen previously recovered in the bioaerosols of a WWTP [29], was quantified in duplicate by real-time PCR on 8 of 28 samples collected. The iQ-Check Quanti L. pneumophila Kit #3578103 (Bio-Rad, Mississauga, Canada) was used according to the manufacturer’s instructions. Briefly, each reaction included 40uL of mastermix with primers, 5 μL of fluorescent probe, and 5 μL of DNA or negative control. Reactions were performed using a Bio-Rad CFX Opus 96 thermocycler following the thermoprotocol: held at 95 °C for 2 min; cycling: 50 repeats at 95 °C for 15 s, 50 °C for 20 s, and 72 °C for 30 s. The manufacturer’s guidelines were followed for analysis. The detection limit was set at 5 genome units (GU)/5 μL of DNA, and the quantification limit was equal to the concentration of the least concentrated standard, which was 20 GU/5 μL of DNA.

2.5. 16S Sequencing

Amplicon preparation for sequencing was performed using the genomic analysis platform from the Institute of Integrative and Systems Biology (IBIS, Université Laval). Fusion primers targeting the V3–V4 region of prokaryotic 16S rDNA were used to assign a different barcode to each sample. Sequencing was performed on the MiSeq platform (Illumina®, San Diego, CA, USA) using a 2 × 250 base pair (2 × 250 bp) approach. The sequences generated by the MiSeq sequencer were processed and analyzed as described in previous studies [26,30]. The sequences were paired using the make.contigs command of mothur V1.43.1 [31]. One step was also carried out using mothur to eliminate ambiguous sequences, homopolymers and sequences that were too short or too long (unassembled). Similar sequences were grouped together to reduce the computational burden using VSEARCH 2.10.14. Sequences were then aligned with reference sequences from the SILVA 123 database. Chimeric sequences were identified and eliminated using the UCHIME algorithm. Sequences showing at least 97% similarity were grouped into operational taxonomic units (OTUs). The assignment of the OTU taxonomic identity was performed using the SILVA 123 database. Microbial ecology analysis results were obtained using mothur scripts, as described by P. Schloss [32]. For alpha and beta diversity, the samples were rarefied at 14,728 sequences per sample to include all samples and avoid the clustering of samples with a higher number of sequences in NMDS analysis (non-metric multidimensional scaling). The non-parametric HOMOVA (homogeneity of molecular variance) test was used to evaluate the statistical significance of the differences between the types of samples (p = 0.05).

2.6. Data Analysis for the Presence of ARGs

The relative abundance of each gene was determined with the 2−ΔCT, where ΔCT (variation in cycle threshold) is calculated as per Equation (1):
ΔCT = CTARG − CT16S
where CTARG corresponds to the cycle threshold value for the targeted ARG, while the CT16S corresponds to the cycle threshold value for 16S detection in this sample.
Data are expressed as the mean ± SD to summarize the trial characteristics. Environmental parameters from samplers before and after filters were analyzed using a mixed analysis of variance (ANOVA) with one fixed experimental factor: the comparison before and after filters. Two other factors were defined as random: the replicates during one day and three days of experimentation. Different statistical models were applied to obtain the best-fitted model for covariance structure; likelihood ratio tests were carried out among models. Comparisons of Akaike’s information criteria for the different models were also performed. The univariate normality assumption was verified with Shapiro–Wilk tests on the error distribution from the statistical model after Cholesky factorization. The Brown and Forsythe’s variation of Levene’s test statistic was used to verify the homogeneity of variances. A log-transformation was performed on all variables to meet the assumptions in the model. Many variables with non-detectable values (left censored) were reported, and many times the assumptions were not fulfilled; therefore, a non-parametric mixed statistical model on longitudinal data proposed by Brunner [33] was performed. The values were transformed by their ranks, and the statistical model proposed previously was applied with corrections for p-values on the fixed factor. The results were considered significant with p-values of 0.05. SAS software version 9.4 was used in the analysis (SAS Institute Inc., Cary, NC, USA).

3. Results and Discussion

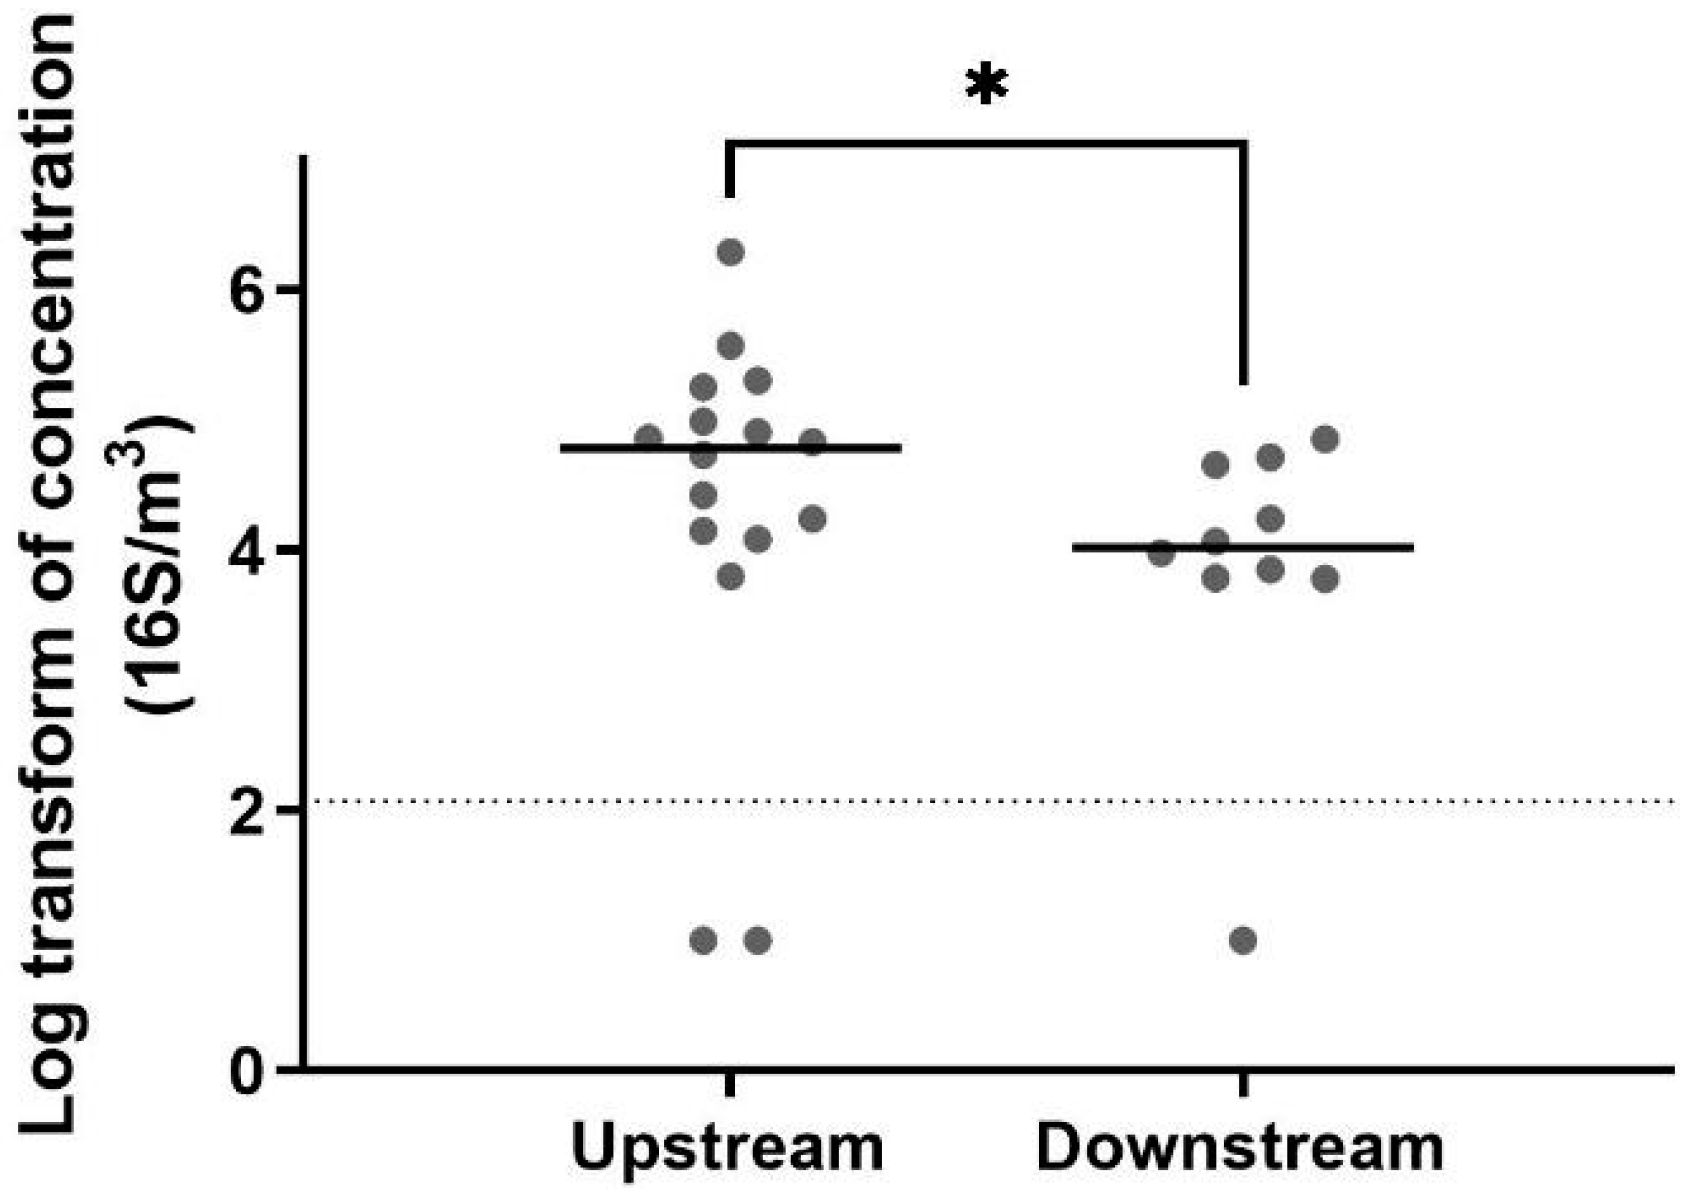
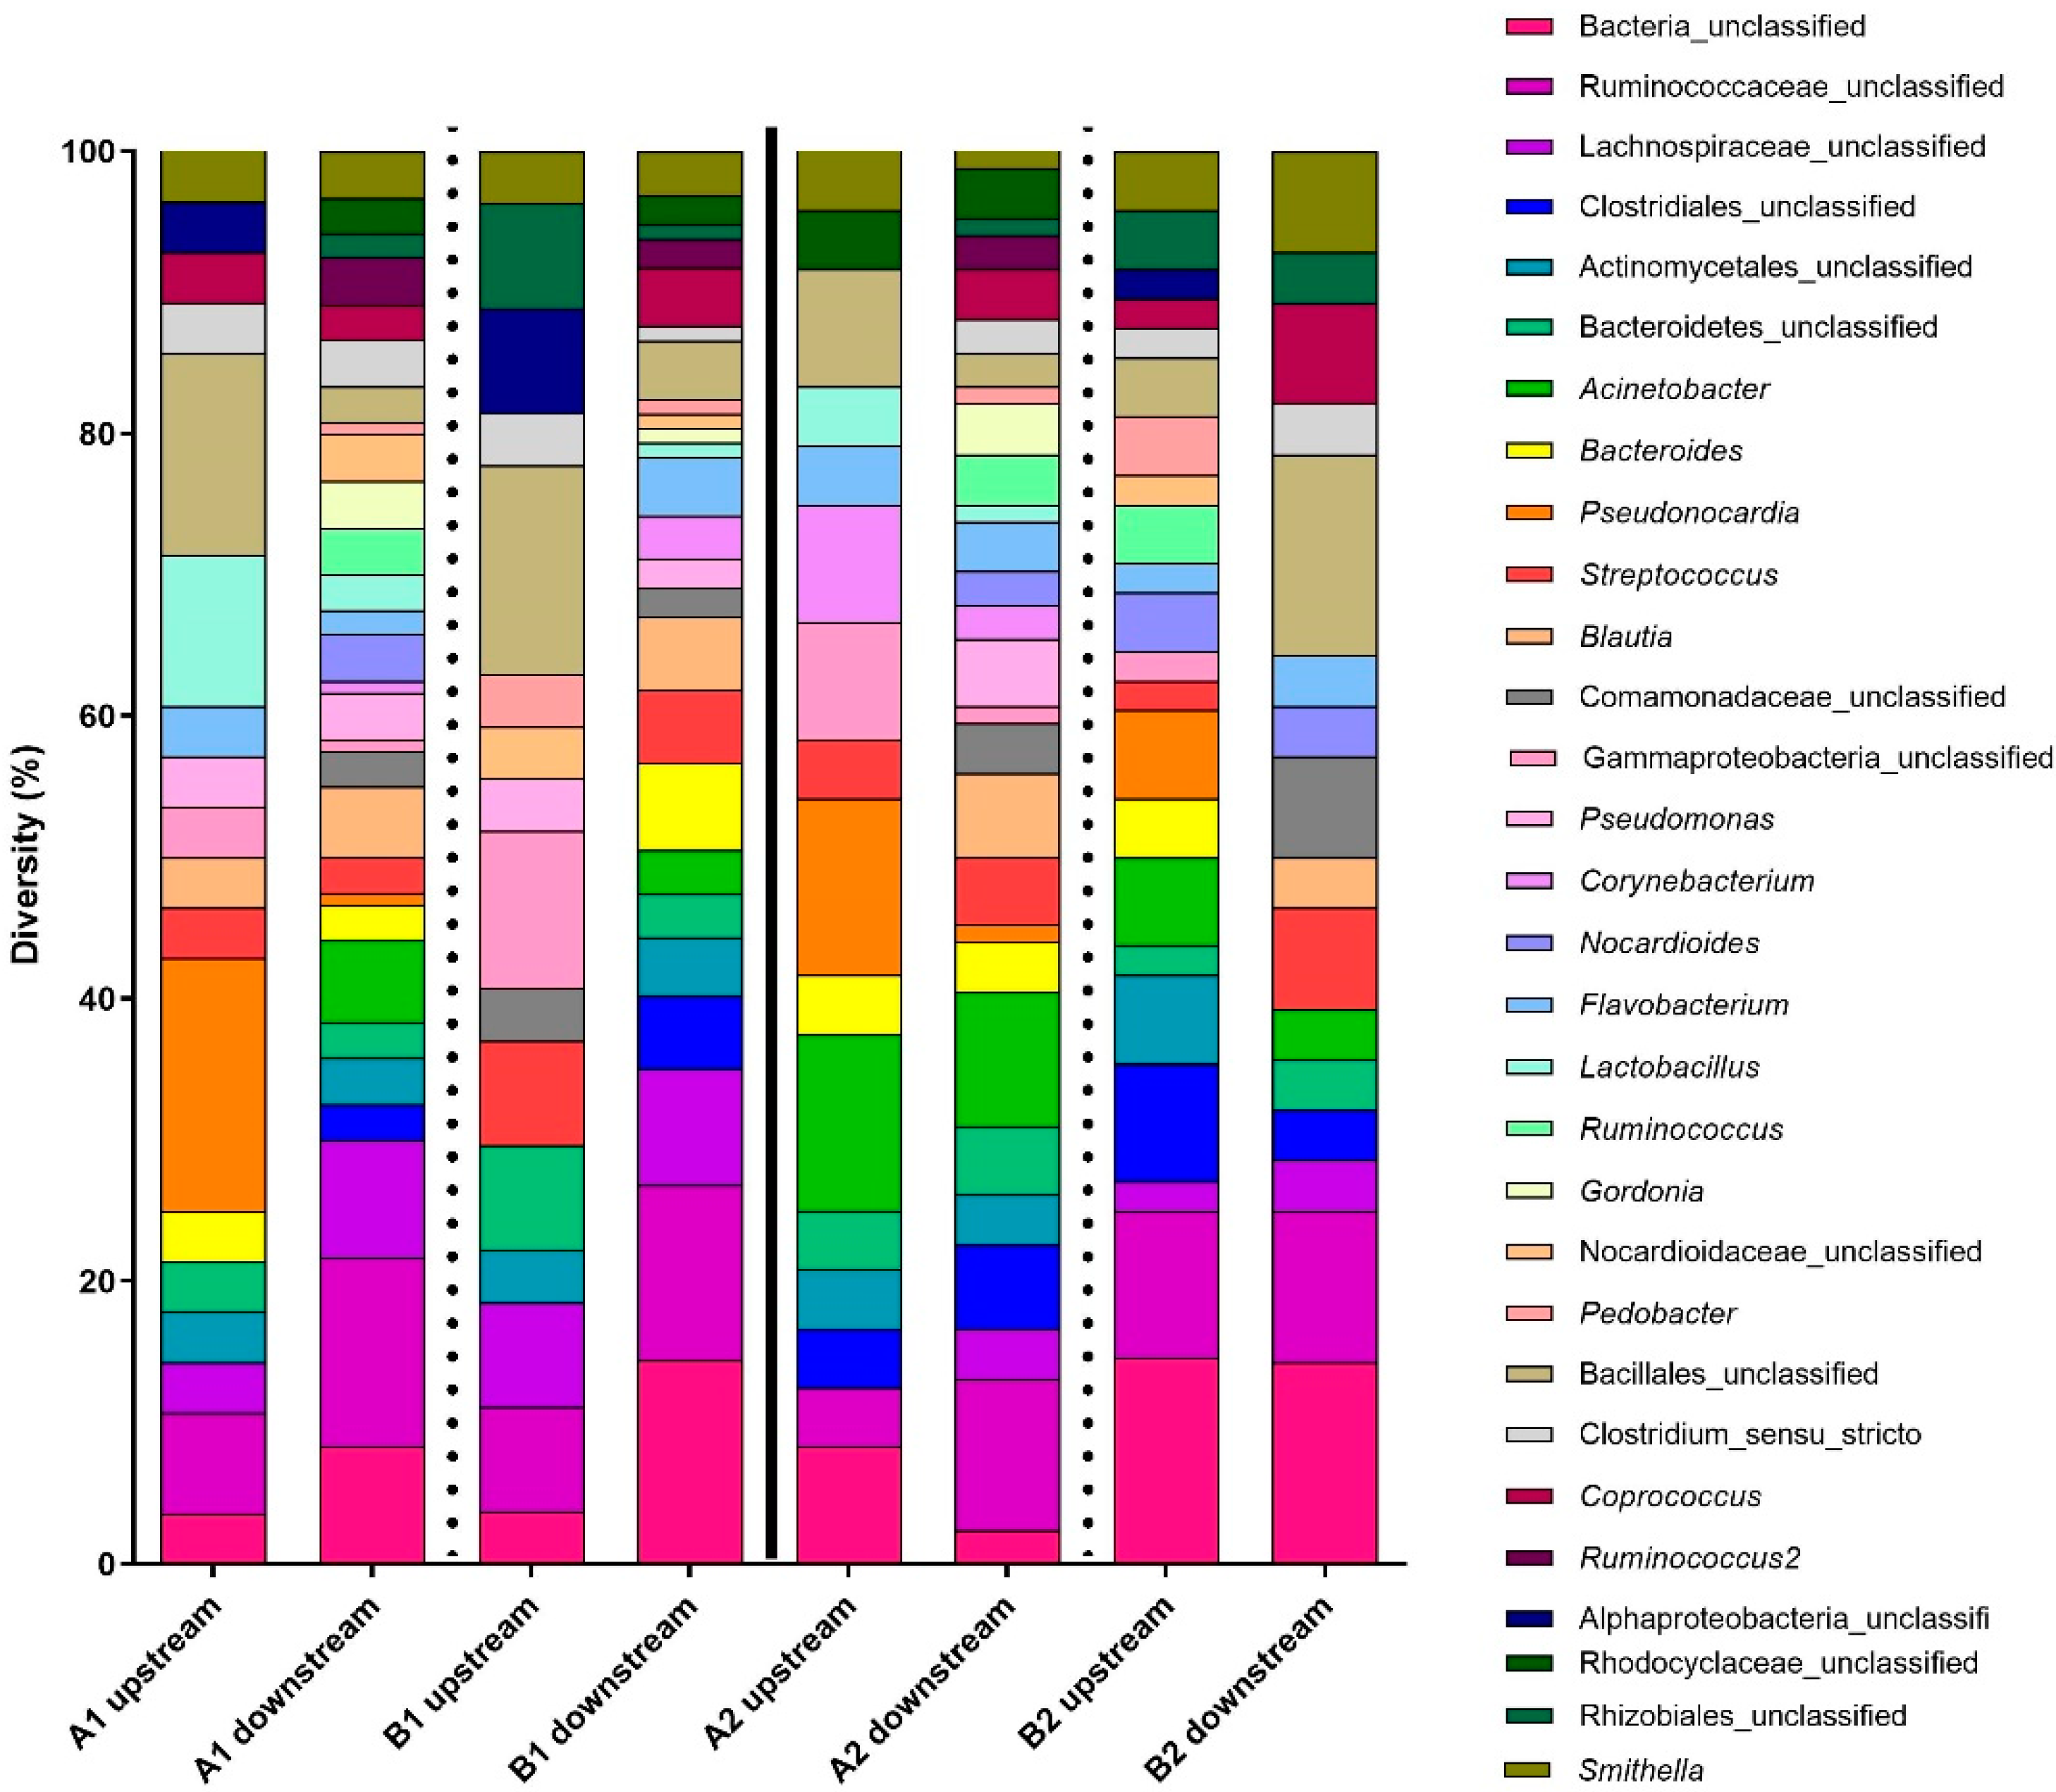
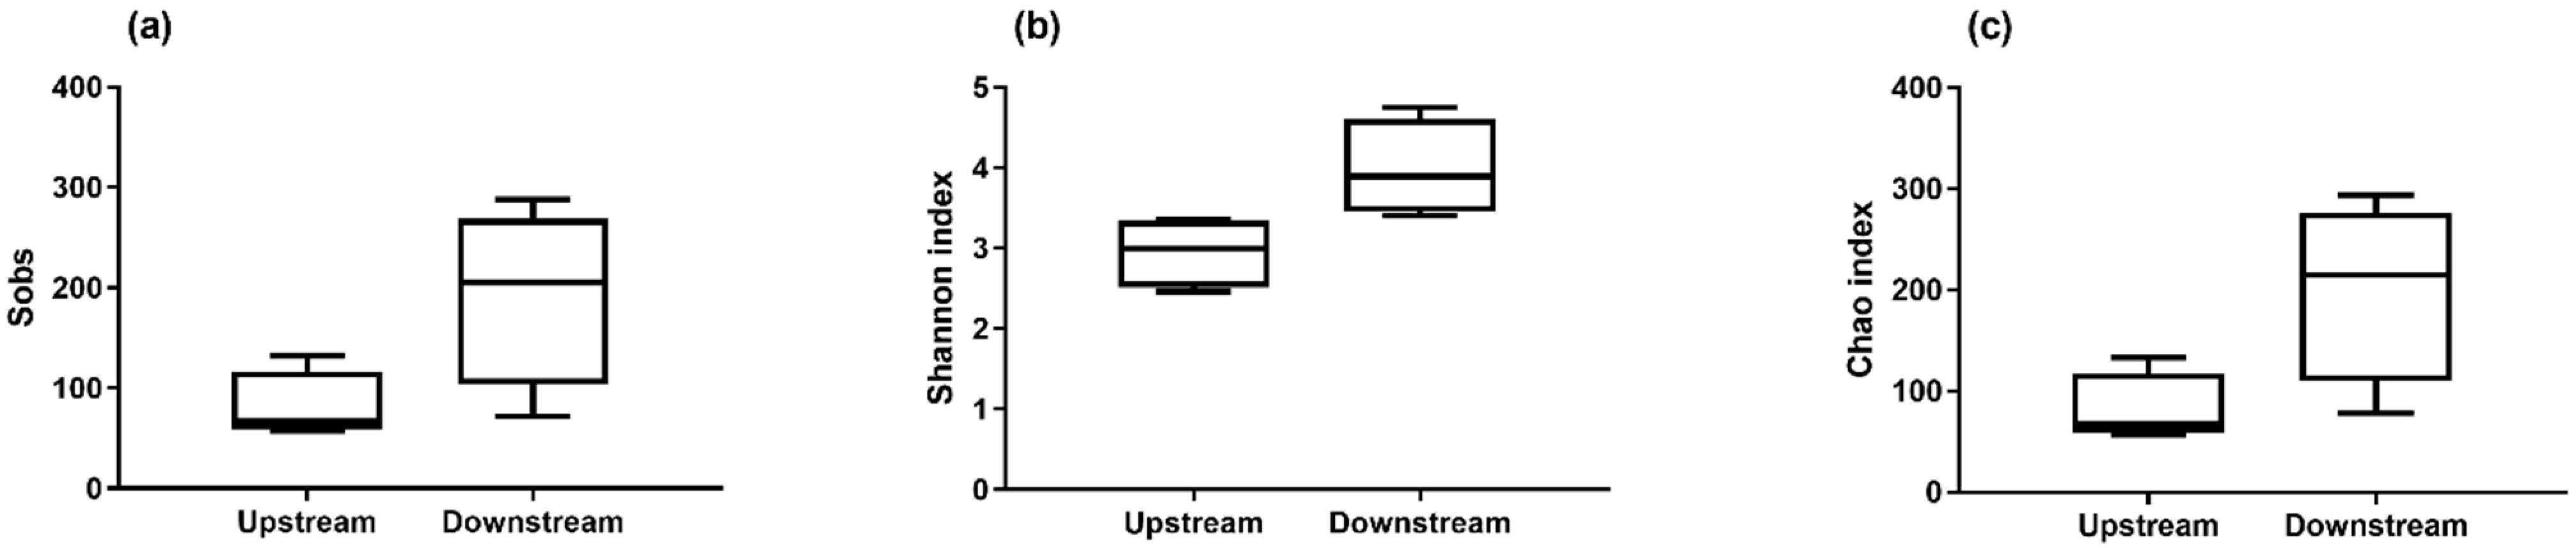
3.1. Concentration and Diversity of Bioaerosols

The detection of total bacteria by 16S qPCR revealed a higher biomass in the air upstream from the biofilter (Figure 2). The biomass concentration measured in the air upstream of the biofilter was between 103 and 106 genomic units (GU)/m3 and decreased to a range of 103 to 104 GU/m3, representing a reduction of 88% in the mean concentrations. A non-parametric test (Mann–Whitney test) confirmed that the biomass was significantly higher before the biofiltration. These results suggest that the biofiltration odor control system installed in this wastewater treatment plant also helps reduce the biomass. However, the number of observed taxa was greater downstream from the biofilter (Figure 3). This observation was confirmed by the Shannon index and Chao index, also demonstrating that the operating taxonomic units (OTUs) were more diverse downstream than upstream (Figure 4).
Biofiltration systems utilized for odor control harbor an active and diverse biomass [21,25]. It is possible that the biomass present in the filter influences the microbial diversity of the filtered air through the shedding of bacteria. Likewise, some of the taxa present in the effluent could be preferentially adsorbed on the filter and washed out during irrigation of the filter. In addition, despite periodic irrigation of the biofilters, the high volume of air flowing through the system causes drying of both media (bio-atomizer and biofilter). This may also contribute to a reduction in biomass after treatment, and a variation in diversity at the system outlet. A more in-depth study of the biofilm, the water used for irrigation, and the discharged water after irrigation could help understand the driver. Nonetheless, the increased diversity can have a positive impact; previous studies in other settings have demonstrated a reduced presence of pathogenic or opportunistic bacteria in the presence of a more diverse microbiome [34].
A PHYLIP-formatted distance matrix based on the Jaccard coefficient was generated and visualized using nonmetric multidimensional scaling (Figure 5). A clear separation between the two groups was observed. Both groups were found to be significantly different using AMOVA (analysis of molecular variance) (p = 0.034). The diversity between the groups is clear (MS = 0.62), but the clustering also shows some heterogenicity in the diversity within the groups (MS = 0.22). A larger number of samples and higher biomass concentration of samples could help reduce the diversity heterogenicity observed within each group.
Focusing on the 10 most abundant taxa present in the affluent and in the effluent, a difference in the diversity is observed (Table 1). Some of the OTUs were more abundant upstream of the biofiltration system (representing untreated plant air) (Bacillales_unclassified, Pseudonocardia, Gammaproteobacteria_unclassified, Actinomycetales_unclassified, Bacteroidetes_unclassified, and Smithella), but some OTUs were more abundant downstream of the biofiltration system (Bacteria_unclassified, Ruminococcaceae_unclassified, Acinetobacter, Streptococcus, Lachnospiraceae_unclassified, Blautia, Streptococcus, Clostridiales_unclassified, Bacteroides, and Coprococcu) (Table 1). These results suggest that even if the biofilter retains some OTUs, there is shedding from the biofilter. This contributes to the increased biodiversity in the effluent air and may act as a protective microbiome against pathogens.
Desulfurizing microorganisms are also expected within the biofilter. The objective of the biofilter is to remove odors, particularly H2S, generally produced at high levels in WWTPs. Bacteria present within the biofilter are responsible for the decrease in sulfide concentrations in the air. The biofilter was initially inoculated with Thiobacillacea, a family of bacteria that can reduce the presence of H2S [23]. The majority of Thiobacillacea species are chemolithotrophic bacteria. They do not need light as a source of metabolic energy, but oxidize various inorganic substances to ensure cell maintenance and the synthesis of new cells. For example, Thiobacillus and Thiomicrospira oxidize H2S to sulfide ions (S2−) and then to sulfate ions (SO42−) or directly to sulfur element (S0), depending on the pH conditions [35]. Nevertheless, the production of sulphate ions must be controlled: the production of sulphuric acid (H2SO4) can take place and disrupt the H2S biotreatment system.
However, the diversity results obtained within this study did not identify the presence of the Thiobacillacea family. The Betaproteobacteria class (including the Thiobacillacea family) accounted for 2.10% of total OTUs at the downstream of odor treatment system. Other taxa able to reduce sulfides were identified: Desulfuromonadales, Sulfurospirillum, Sulfuricurvum, Sulfurimonas (each of them between 0.01% and 0.03% of total downstream OTUs), and Chromatiales (at 0.21% of total downstream OTUs). Except for the latter, all these taxa are chemolithoautotrophic organisms which perform anaerobic or facultative anaerobic respiration. The element sulfide forms part of their electron acceptors, which allows them to oxidize sulfides (H2S, S2−) to sulfates (SO42−), from which they draw their metabolic energy. They are known to be able to survive under extreme stress conditions which are usually toxic for most bacteria [36,37]. Meanwhile, the Chromatiales order represents a group of photolithoautotrophic bacteria capable of oxidizing sulfide as well. They draw their metabolic energy source from light photons [38,39]. Interestingly, this sulfur-oxidizing taxa is the majority in terms of downstream OTUs capable of oxidizing sulfur (0.21%), although the system is theoretically immersed in darkness. It is possible that, after 8 years of continuous use, the biofilm community adapts to the local conditions in the plant and the Thiobacillacea are gradually replaced over time with these other communities, especially considering the low mass load of H2S feeding into the system.

3.2. Presence of Taxa Associated with Opportunistic Pathogens

The presence of opportunistic pathogens in wastewater and associated bioaerosols has been documented in WWTPs [17,29,40]. In this study, taxa associated with opportunistic pathogens were identified in low abundance. For example, although the Legionellaceae family was not predominant in the biodiversity analysis, it was identified both upstream (0.57% of total upstream OTUs) and downstream (0.02% of total downstream OTUs) of the odor biofilter. Legionella pneumophila (Lp), a pathogenic Legionella species belonging to the Legionellaceae family, was detected by real-time PCR. Of the eight samples analyzed, two were positive but not quantifiable (between 1 and 4 GU/μL), whereas it was not detected in the other samples. The source of Lp detected in the air was likely the WWTP itself. In fact, municipal and industrial WWTPs are an emerging and confirmed source of Lp [17], offering ideal conditions for its proliferation: high concentrations of nitrogen and oxygen, ideal temperature, and the presence of Lp host organisms [34,41]. It also transpires that wastewater treatment steps requiring vigorous mixing and agitation (pumping) or intense mechanical aeration (activated sludge basin) are the main sources of Legionella spp.-contaminated bioaerosols [40].
The detection of Lp in WWTP air suggests its presence in the wastewater of the plant. The literature agrees on this subject, reporting Lp concentrations in the wastewater in a range of 102- to 107-fold higher compared with that found in bioaerosols [29]. Moreover, the detection of Lp at low concentrations in the treated air suggests a source of dispersion of this pathogen in the plant’s immediate surroundings. Bioaerosols can be dispersed over several kilometers [9,15]; therefore, the nearby population could be affected in cases of high concentration. Nevertheless, the aerosolized concentration must be considered. In the study by Blatny J. M. et al. [29], the maximum aerosolized concentration in Lp found above an aerated pond treatment plant was 3300 CFU/m3. At 200 m from the pond in the wind direction, the concentration decreased to 300 CFU/m3. In this study, considering the low concentration detected in the air prior to releasing into the environment, the risk of exposure likely became negligible within a few meters from the plant.
The presence of Mycobacterium spp. was also identified in the upstream and downstream air samples, at a low abundance: 0.27% of upstream OTUs vs. 0.65% of downstream OTUs (0.92% of total sequenced OTUs). Mycobacterium is an emerging pathogenic bacterium which is widely recognized in drinking water and water distribution systems [42]. It can be divided into two subgroups—the tuberculous mycobacteria (M. tuberculosis and M. bovis), responsible for human and bovine tuberculosis, and the environmental non-tuberculous mycobacteria (NTM), of which several strains are recognized as pathogenic (M. avium, M. leprae, M. abscessus, etc.) and can cause infections in humans [42,43]. Key pulmonary problems and skin diseases have been associated with NTM [44].
Mycobacteria have the particularity of having a cell wall rich in mycolic acids, which gives them a particular resistance to antiseptics and certain antibiotics [43,44]. They are therefore known to be particularly resistant to drinking water disinfection techniques [44]. Moreover, the hydrophobic characteristics of their wall and the absence of surface charge are determining factors which facilitate aerosolization [44,45,46,47]. Respiratory NTM infections have been reported in several aerosol-generating activities: waterfalls and sprays from swimming pools, hot tubs, metal-working fluid, or water-damaged buildings [44]. A study by Han et al. [47] compared the microbial ecology of bioaerosols from a WWTP produced by mechanical agitation (horizontal rotors in an oxidation ditch process) and aeration (fine bubble aeration in an anaerobic–anoxic–oxic process). Both remain the main drivers of aerosol generation in a WWTP [40,47]. Of the 44 most abundant bacteria identified, Mycobacterium was the second most easily aerosolized species (with an aerosolization factor of 192.56 [47,48]) by both processes. This is of interest and should be investigated further to determine whether the pathogenic species of Mycobacterium are present, because they may present a health risk to WWTP workers, especially in indoor plants.

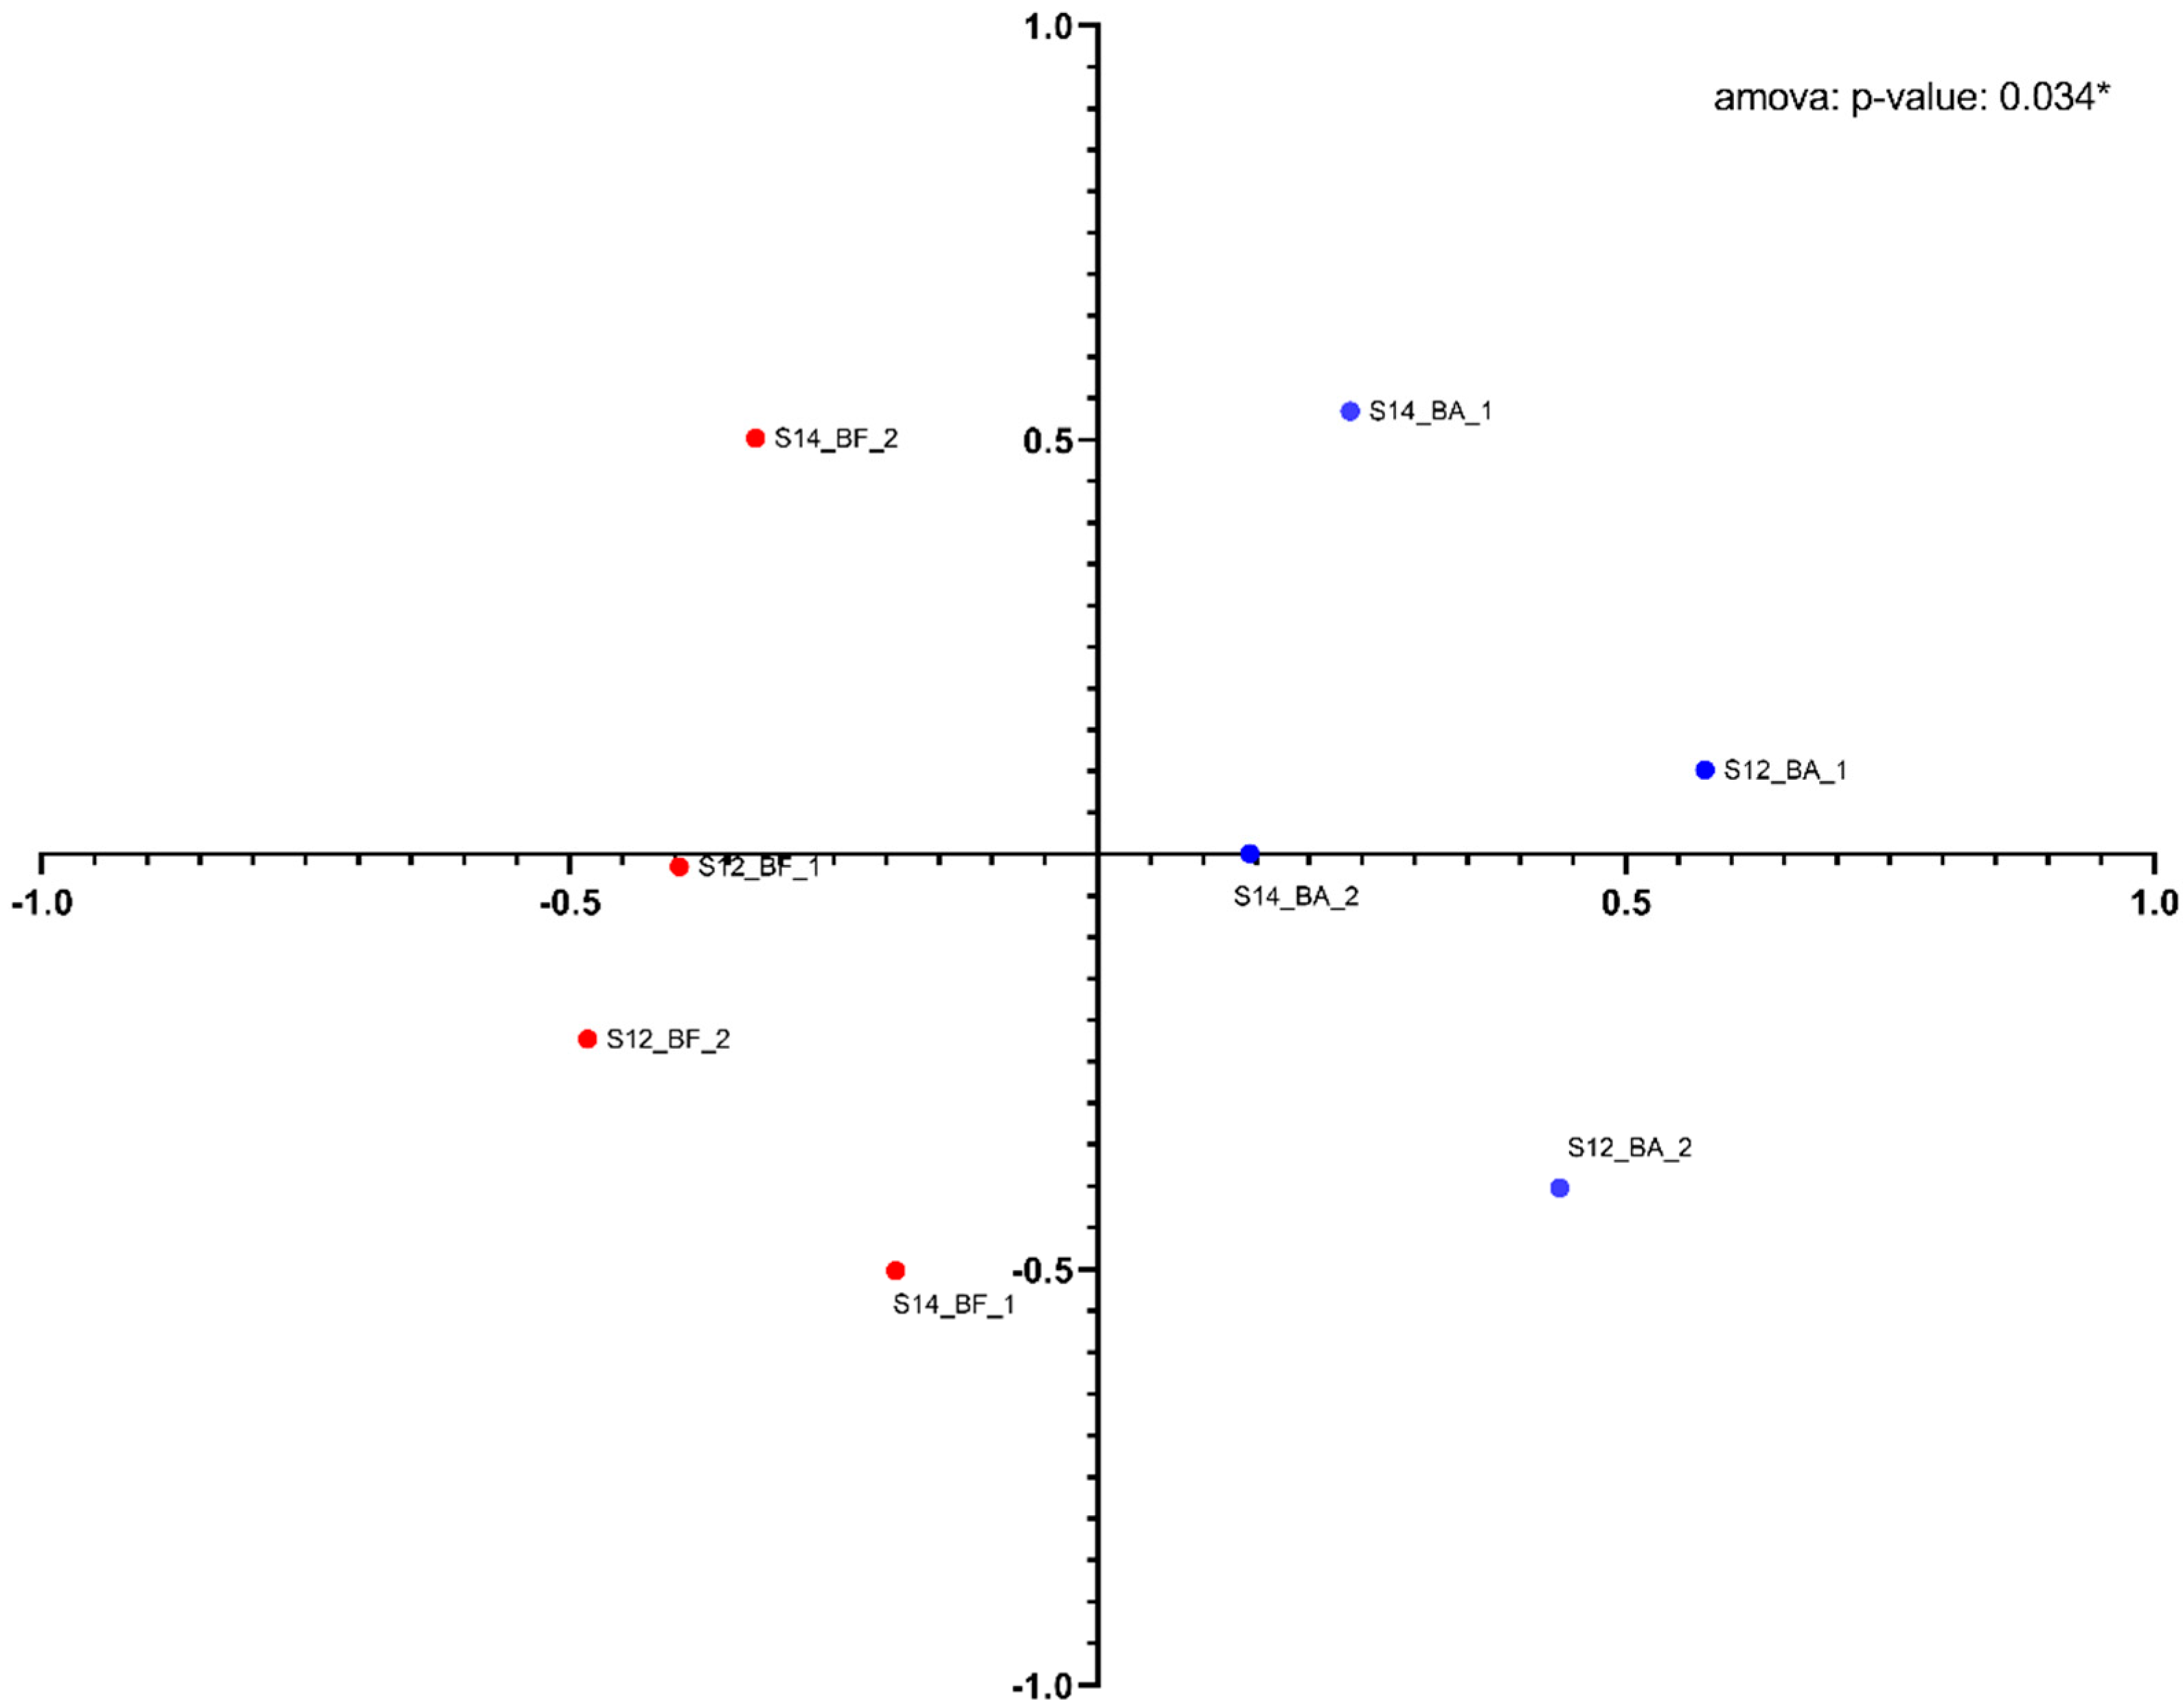
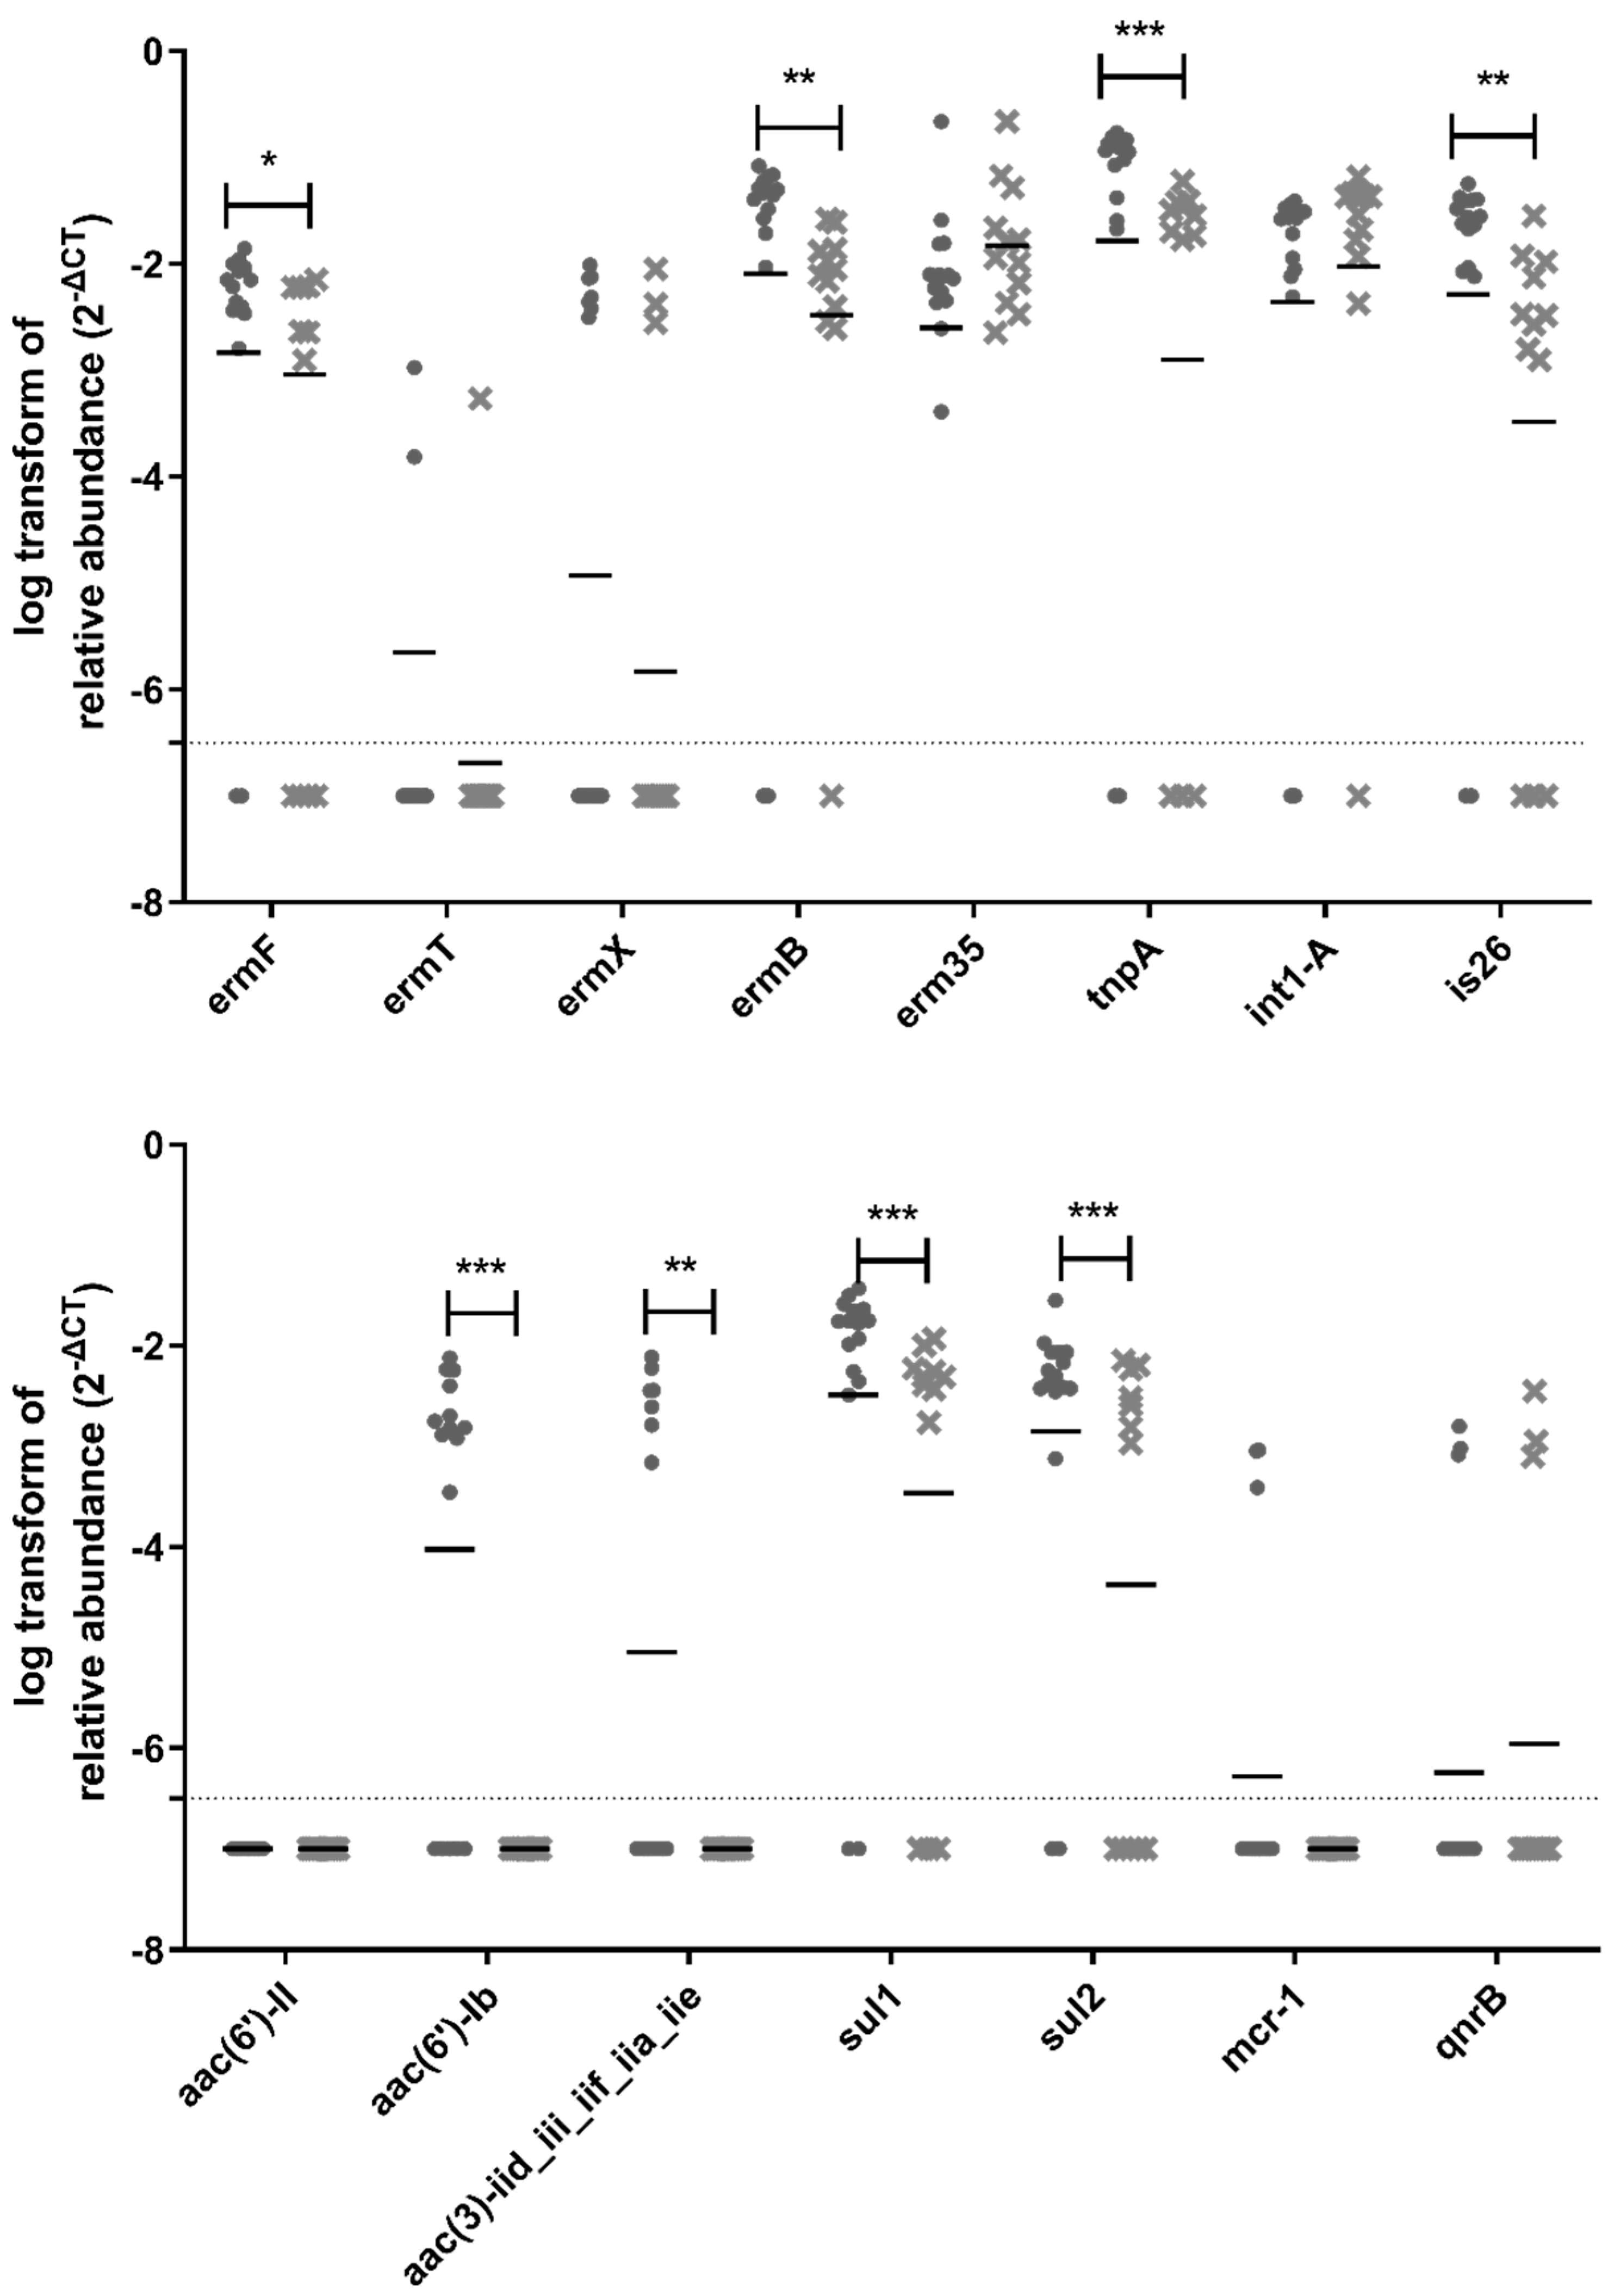
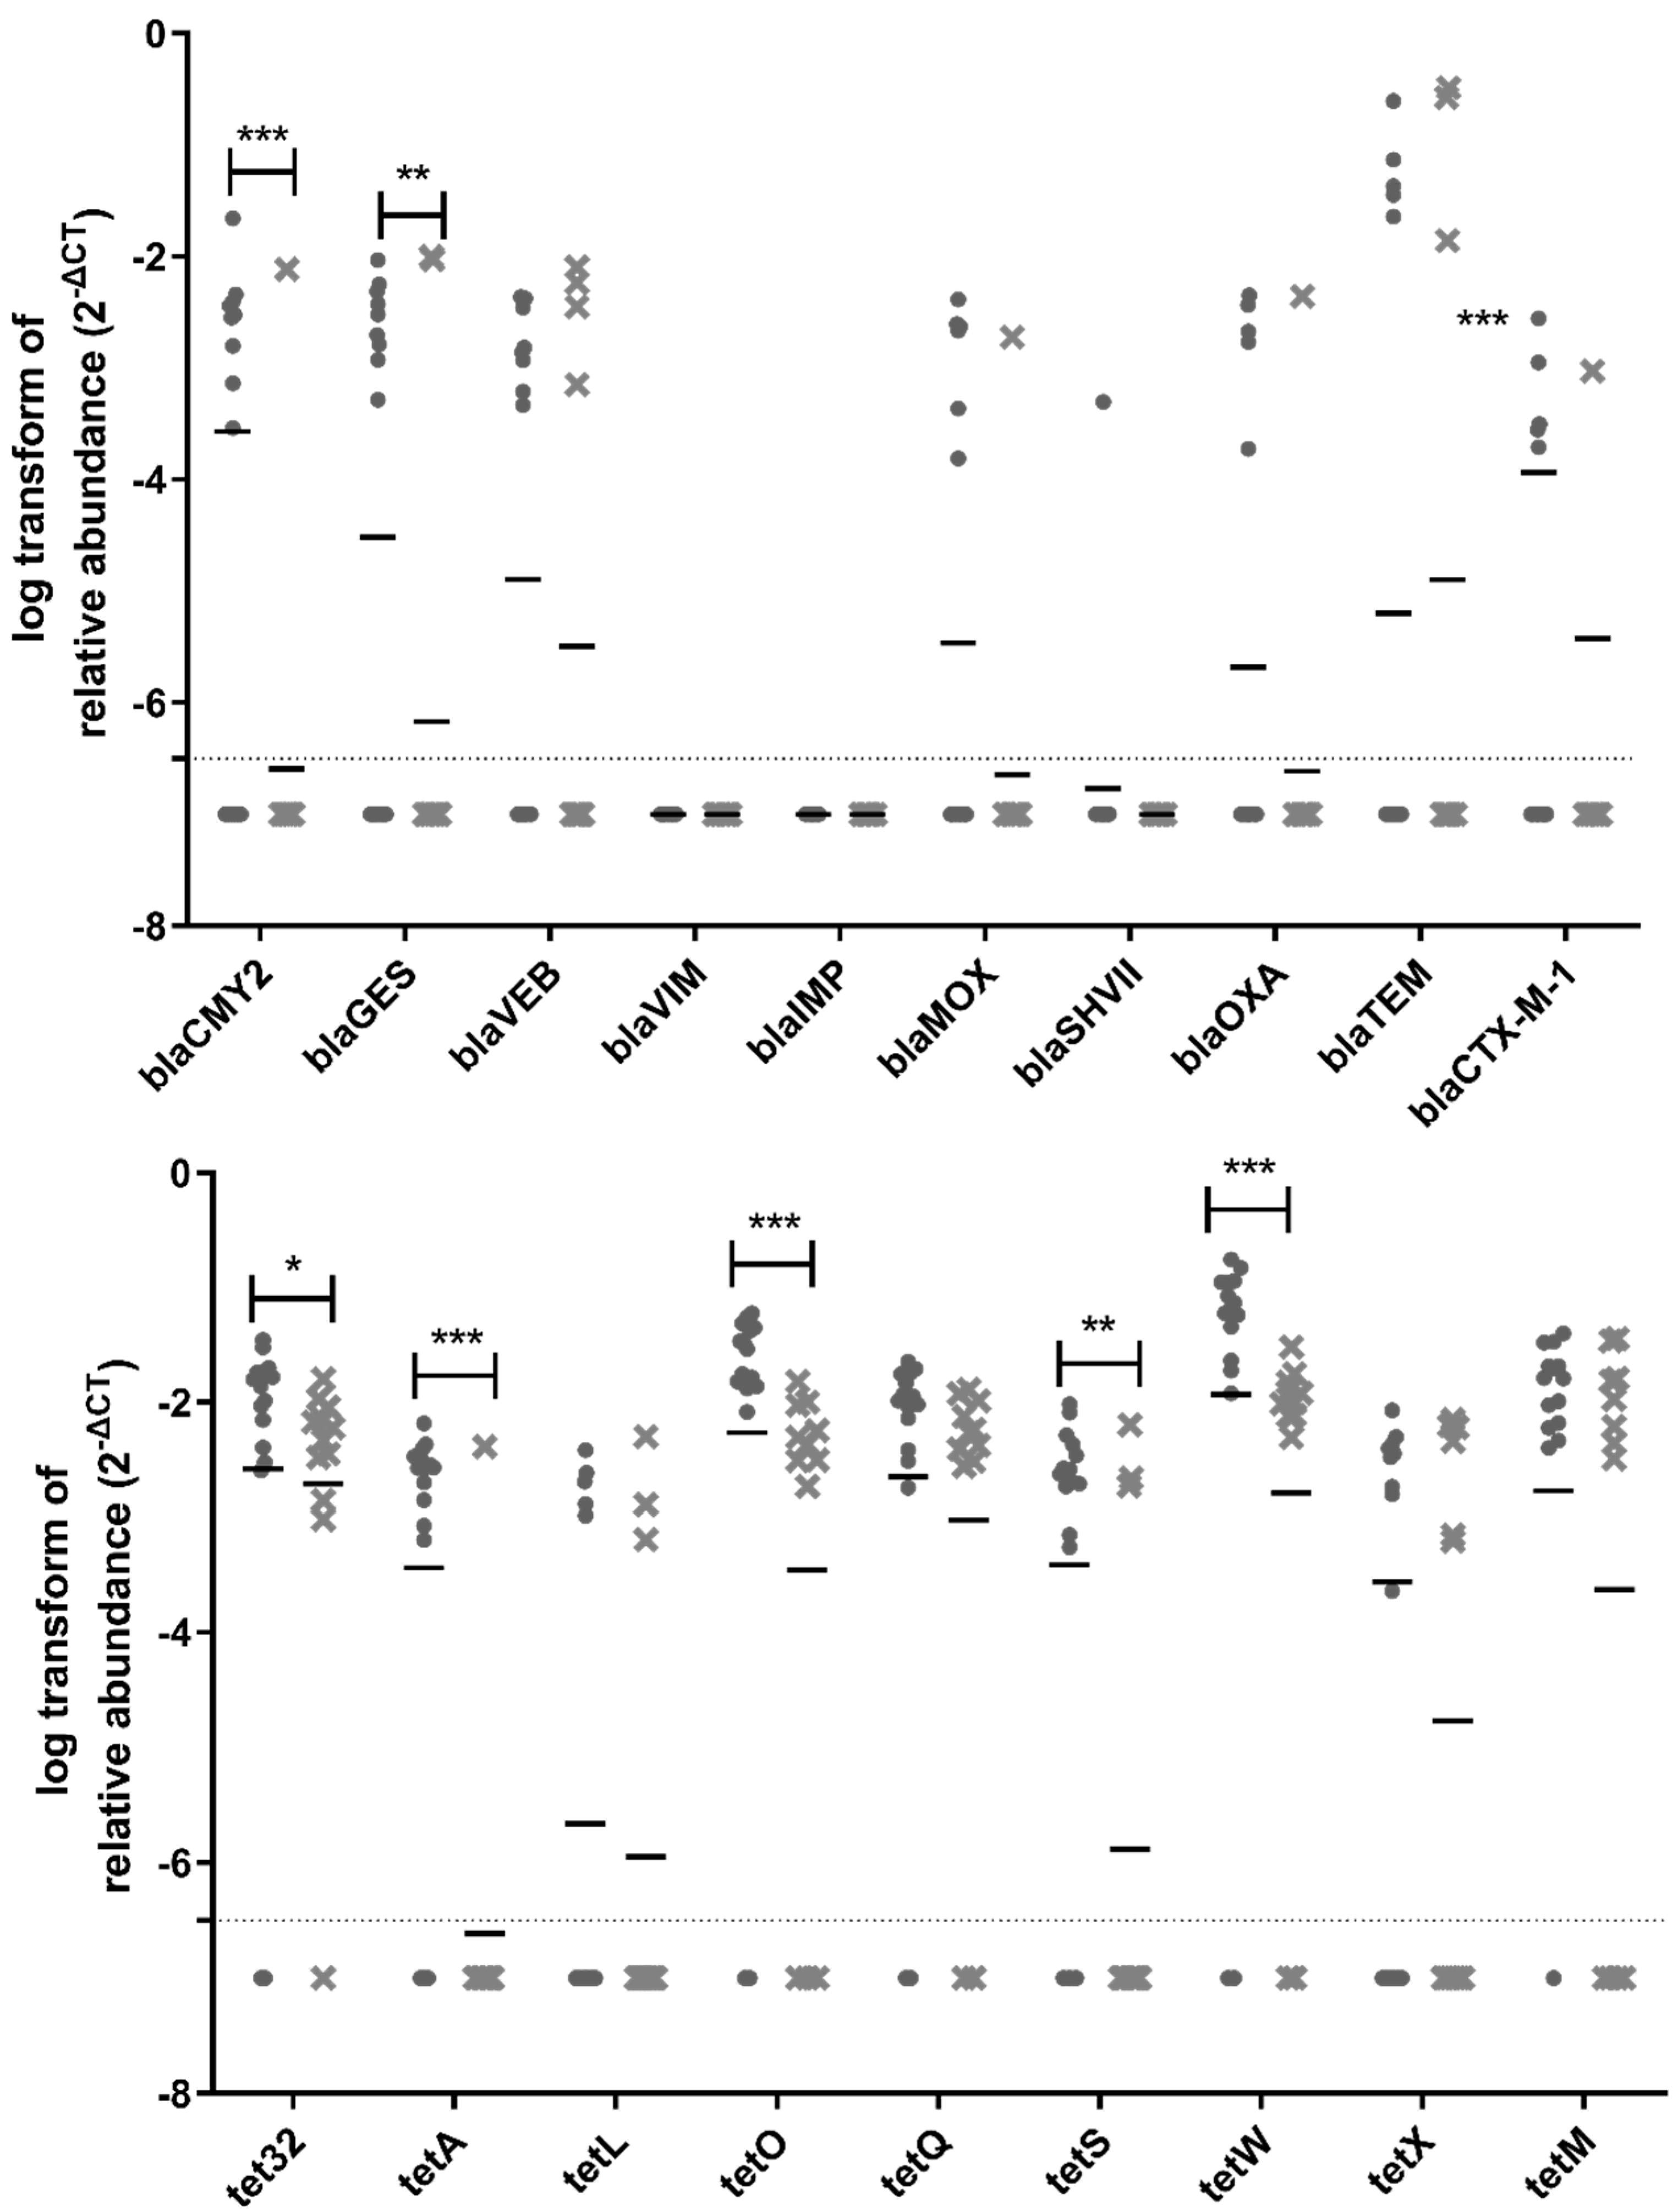
3.3. Impact of Odor Biofiltration System on ARGs and MGEs

Out of the 38 ARGs and MGEs tested in this study, 31 genes were detected and quantified upstream of the biofiltration system, whereas 27 genes were still detectable and quantifiable downstream of the biofilter (Figure 6). Vancomycin resistance genes (vanA, vanB, vanRA, and vanSA) are not included in Figure 6 because they were not detected in any samples. There was a significant reduction in the relative abundance for 15 ARGs and MGEs downstream of the biofiltration system: ermF, ermB, tnpA, is26, aac(6′)-Ib, aac(3)-iid_iii_iif_iia_iie, sul1, sul2, blaCMY2, blaGES, tet32, tetA, tetO, tetS, and tetW, (Figure 6). The most significant reduction was observed for tnpA, aac(6′)-Ib, sul1, sul2, tetA, tetO, and tetW.
According to a study performed on untreated sewage collected from countries around the globe, the classes of antimicrobials for which there were the most resistance genes were macrolides, β-lactams, tetracyclines, aminoglycosides, and sulfonamides [49]. In our study, the presence of resistance genes for these classes of antibiotics was detected in bioaerosols collected before the odor control biofilter: blaCMY2, blaGES (betalactams); ermB and ermF (macrolides); aac(6′)-Ib and aac(3)-iid_iii_iif_iia_iie (aminoglycoside); sul1 and sul2 (sulfonamides); tet32, tetA, tetO, tetS, and tetW (tetracyclines).
Tetracycline resistance genes were detected with the highest abundance in the air samples collected before and after the biofilter; most of them significantly reduced after odor control treatment. The presence of tetracycline resistance genes in bioaerosols from WWTP is not surprising, because their detection has been previously reported in WWTP influent and effluent water [50]. Furthermore, tetracycline has increasingly been used in animals [51]. Runoff from agricultural areas can contribute to the presence of tetracycline resistance genes in WWTP influent and effluent water, which may explain its presence in bioaerosols produced at WWTPs. The tetA, tetO, and tetW genes were some of the seven genes exhibiting the most significant reduction after air biofiltration. This important reduction is interesting to explore, especially considering the health relevance of these genes. The tetO and tetW genes were recently classified as the highest risk ARGs for future threats based on their enrichment in human-associated environments and their mobility [52].
β-lactam resistance genes (blaCMY2, blaGES, blaVEB, blaVIM, blaIMP, blaMOX, blaSHVII, blaOXA, blaTEM, and blaCTX-M-1) were detected less frequently and in lower abundance in collected air samples. The absence or low abundance of these genes was not expected, because penicillin is one of the most widely used classes of antibiotics in Québec to treat human infections, along with macrolides and fluoroquinolones [53]. Furthermore, previous studies have reported the presence of β-lactam-resistant genes in water samples collected from WWTPs, including after the final disinfection step, prior to discharge in the environment [54]. A significant reduction in the relative abundance was observed for blaCMY2 and blaGES, after biofiltration. On the other hand, the presence of sulfonamide-resistant genes was detected as expected. This class of antibiotics was amongst the first class of antibiotics to be widely used [52]. Sulfonamide-resistant genes have been isolated from environments deemed as non-associated with humans [52], revealing their widespread presence in the environment.
The observed reduction in the relative abundance of ARG in the treated air could be associated with the decrease in total bacteria also observed. It is hypothesized that the irrigation of biofiltration media every 48 h helps to maintain a stable bacterial community. However, the percentage decrease observed in the total bacterial content cannot be directly translated to the genera level. Indeed, the microbial diversity analysis indicated an increase in diversity despite the overall reduction in the total number of bacteria. This suggests that some genera tend to be stopped by the biofilter, whereas others might be released from the biofilm established on the media or in the process water. For example, Pseudonocardia were one of the 10 most abundant OTUs in the upstream air, but not in the downstream samples; Table 1 details a decrease in their relative abundance. On the other hand, H2S-reducing bacteria exhibited increased relative abundance in the treated air. It would be interesting to pursue the investigation to understand the actual impact of the biofilter on targeted opportunistic pathogens such as Mycobacteria, Legionella, and Pseudomonas through quantification before and after the treatment.

4. Conclusions

Biofiltration odor control systems present interesting potential to help reduce the bacterial concentration in effluent air from WWTPs, while increasing diversity. The studied system also led to a significant reduction in the measured relative abundance of 50% of detected ARG and MGE in the air upstream of the biofilter. Although these air biofiltration systems are not designed for bacterial and antimicrobial resistance reductions, key findings from this study suggest their potential to do so. A reduction of 88% in the total bacteria was observed after biofiltration and ARGs of concern, such as tetracycline resistance genes, were significantly reduced. This could have implications in the reduction of antimicrobial resistance gene/bacteria dispersion in the environment and help improve the health of workers and the surrounding population if the relative abundance of opportunistic pathogens such as Mycobacterium spp. is also reduced. Further studies will help understand how operating conditions and type of odor control system can influence the potential for these technologies to address some of the concerns regarding ARG dispersion and microbial contamination of air associated with WWTP.

Supplementary Materials

The following supporting information can be downloaded at: https://www.mdpi.com/article/10.3390/atmos13101723/s1, Table S1: Sequence of primers and probes used for targeted ARGs and MGEs; Table S2: Plasmid sequence used for qPCR detection of targeted ARGs and MGEs. Figure S1: Detailed schematic of the air sampling before and after the biofilter.

Author Contributions

Conceptualization, A.O., A.B.C., M.V., C.D. and E.B.; methodology, A.O., A.B.C. and M.V.; formal analysis, A.B.C., A.O. and M.V.; investigation, A.O., A.B.C., S.C. and C.B.; resources, M.V., N.T., P.B.L.G., S.C. and C.B.; writing—original draft preparation, A.B.C. and A.O.; writing—review and editing, M.V., N.T., P.B.L.G., S.C., C.B., C.D. and E.B.; supervision, M.V., C.D. and E.B.; funding acquisition, C.D. and E.B. All authors have read and agreed to the published version of the manuscript.

Funding

This work was funded by an NSERC grant (539024-2019) and an Alliance grant (570466–21). C.D. holds a Tier-1 Canada Research Chair on Bioaerosols. E.B. holds an NSERC Discovery grant (RGPIN-2021-03277).

Institutional Review Board Statement

Not applicable.

Informed Consent Statement

Not applicable.

Data Availability Statement

Not applicable.

Acknowledgments

The authors would like to thank Serge Simard for conducting the statistical analysis. The authors are also thankful for the technical support provided by Richard Rousseau (H2OFlow) and Dereck Webb (Biorem), and for the help from the wastewater treatment plant staff.

Conflicts of Interest

The authors declare no conflict of interest.

References

  1. Moreno-Mesonero, L.; Ferrús, M.A.; Moreno, Y. Determination of the bacterial microbiome of free-living amoebae isolated from wastewater by 16S rRNA amplicon-based sequencing. Environ. Res. 2020, 190, 109987. [Google Scholar] [CrossRef] [PubMed]
  2. Brisebois, E.; Veillette, M.; Dupont, V.D.; Lavoie, J.; Corbeil, J.; Culley, A.; Duchaine, C. Human viral pathogens are pervasive in wastewater treatment center aerosols. J. Environ. Sci. 2017, 67, 45–63. [Google Scholar] [CrossRef] [PubMed]
  3. Sanchez-Monedero, M.A.; Aguilar, M.I.; Fenoll, R.; Roig, A. Effect of the aeration system on the levels of airborne microorganisms generated at wastewater treatment plants. Water Res. 2008, 42, 3739–3744. [Google Scholar] [CrossRef]
  4. Karkman, A.D.T.; Walsh, F.; Virta, M.P.J. Antibiotic-Resistance Genes in Waste Water. Trends Microbiol. 2018, 26, 220–228. [Google Scholar] [CrossRef] [Green Version]
  5. Amos, G.C.H.P.; Gaze, W.H.; Wellington, E.M. Waste water effluent contributes to the dissemination of CTX-M-15 in the natural environment. J. Antimicrob. Chemother. 2014, 69, 1785–1791. [Google Scholar] [CrossRef] [PubMed]
  6. Marti, E.J.J.; Balcazar, J.L. Prevalence of antibiotic resistance genes and bacterial community composition in a river infuenced by a wastewater treatment plant. PLoS ONE 2013, 8, e78906. [Google Scholar] [CrossRef] [PubMed]
  7. World Health Organization. Global Action Plan on Antimicrobial Resistance. 2015. Available online: https://ahpsr.who.int/publications/i/item/global-action-plan-on-antimicrobial-resistance (accessed on 14 December 2021).
  8. World Health Organization. Global Priority List of Antibiotic-Resistant Bacteria to Guide Research, Discovery, and Development of New Antibiotics. 2017. Available online: https://www.who.int/news/item/27-02-2017-who-publishes-list-of-bacteria-for-which-new-antibiotics-are-urgently-needed (accessed on 14 December 2021).
  9. Li, J.; Zhou, L.; Zhang, X.; Xu, C.; Dong, L.; Maosheng, Y. Bioaerosol emissions and detection of airborne antibiotic resistance genes from wastewater treatment plant. Atmos. Environment. 2016, 124, 404–412. [Google Scholar] [CrossRef]
  10. Mbareche, H.; Veillette, M.; Dion-Dupont, V.; Lavoie, J.; Duchaine, C. Microbial composition of bioaerosols in indoor wastewater treatment plants. Aerobiologia 2022, 38, 35–50. [Google Scholar] [CrossRef]
  11. Thorn, J.; Kerekes, E. Health effects among employees in sewage treatment plants: A literature survey. Am. J. Ind. Med. 2001, 40, 170–179. [Google Scholar] [CrossRef]
  12. Fannin, K.F.; Vana, S.C.; Jakubowski, W. Effect of an Activated Sludge Wastewater Treatment Plant on Ambient Air Densities of Aerosols Containing Bacteria and Viruses. Appl. Environ. Microbiol. 1985, 49, 1191–1196. [Google Scholar] [CrossRef]
  13. Reinthaler, F.F.; Posch, J.; Feierl, G.; Wust, G.; Haas, D.; Ruckenbauer, G.; Mascher, F.; Marth, E. Antibiotic resistance of E. coli in sewage and sludge. Water Res. 2003, 37, 1685–1690. [Google Scholar] [CrossRef]
  14. Han, Y.; Yang, T.; Xu, G.; Li, L.; Liu, J. Characteristics and interactions of bioaerosol microorganisms from wastewater treatment plants. J. Hazard. Mater. 2020, 391, 12256. [Google Scholar] [CrossRef] [PubMed]
  15. Loenenbach, A.D.; Beulens, C.; Euser, S.M.; van Leuken, J.P.G.; Bom, B.; van der Hoek, W.; de Roda Husman, A.M.; Ruijs, W.L.M.; Bartels, A.A.; Rietveld, A.; et al. Two Community Clusters of Legionnaires’ Disease Directly Linked to a Biologic Wastewater Treatment Plant, the Netherlands. Emerg. Infect. Dis. 2018, 24, 1914–1918. [Google Scholar] [CrossRef] [PubMed] [Green Version]
  16. Brissaud, F.; Blin, E.; Hemous, S.; Garrelly, L. Water reuse for urban landscape irrigation: Aspersion and health related regulations. Water Sci. Technol. 2008, 57, 781–787. [Google Scholar] [CrossRef]
  17. Caicedo, C.; Beutel, S.; Scheper, T.; Rosenwinkel, K.H.; Nogueira, R. Occurrence of Legionella in wastewater treatment plants linked to wastewater characteristics. Environ. Sci. Pollut. Res. 2016, 23, 16873–16881. [Google Scholar] [CrossRef]
  18. Kulkarni, P.; Olson, N.D.; Paulson, J.N.; Pop, M.; Maddox, C.; Claye, E.; Goldstein, R.E.R.; Sharma, M.; Gibbs, S.G.; Mongodin, E.F.; et al. Conventional wastewater treatment and reuse site practices modify bacterial community structure but do not eliminate some opportunistic pathogens in reclaimed water. Sci. Total Environ. 2018, 639, 1126–1137. [Google Scholar] [CrossRef]
  19. Lund, V.; Fonahn, W.; Pettersen, J.E.; Caugant, D.A.; Ask, E.; Nysaeter, Å. Detection of Legionella by cultivation and quantitative real-time polymerase chain reaction in biological waste water treatment plants in Norway. J. Water Health 2014, 12, 543–554. [Google Scholar] [CrossRef]
  20. Radomski, N.; Betelli, L.; Moilleron, R.; Haenn, S.; Moulin, L.; Cambau, E.; Rocher, V.; Gonçalves, A.; Lucas, F.S. Mycobacterium Behavior in Wastewater Treatment Plant, A Bacterial Model Distinct From Escherichia coli and Enterococci. Environ. Sci. Technol. 2011, 45, 5380–5386. [Google Scholar] [CrossRef]
  21. Swanson, W.J.; Loehr, R.C. Biofiltration: Fundamentals, Design and Operations Principles, and Applications. J. Environ. Eng. 1997, 123, 538–546. [Google Scholar] [CrossRef]
  22. Estrada, J.M.; Kraakman, N.B.; Muñoz, R.; Lebrero, R. A comparative analysis of odour treatment technologies in wastewater treatment plants. Environ. Sci. Technol. 2011, 45, 1100–1106. [Google Scholar] [CrossRef]
  23. Oprime, M.E.A.G.; Garcia, O., Jr.; Cardoso, A.A. Oxidation of H2S in acid solution by Thiobacillus ferrooxidans and Thiobacillus thiooxidans. Process Biochem. 2001, 37, 111–114. [Google Scholar] [CrossRef]
  24. Burgess, J.E.; Parsons, S.A.; Stuetz, R.M. Developments in odour control and waste gas treatment biotechnology: A review. Biotechnol. Adv. 2001, 19, 35–63. [Google Scholar] [CrossRef]
  25. Sonil, N.; Prakash, K.S.; Jayanthi, A. Microbial biofiltration technology for odour abatement: An introductory review. J. Soil Sci. Environ. Manag. 2012, 3, 28–35. [Google Scholar] [CrossRef] [Green Version]
  26. Mbareche, H.; Veillette, M.; Bilodeau, G.J.; Duchaine, C. Bioaerosol sampler choice should consider efficiency and ability of samplers to cover microbial diversity. Appl. Environ. Microbiol. 2018, 84, e01589-18. [Google Scholar] [CrossRef] [Green Version]
  27. Bach, H.J.; Tomanova, J.; Schloter, M.; Munch, J.C. Enumeration of total bacteria and bacteria with genes for proteolytic activity in pure cultures and in environmental samples by quantitative PCR mediated amplification. J. Microbiol. Methods 2002, 49, 235–245. [Google Scholar] [CrossRef]
  28. Stedtfeld, R.D.; Guo, X.; Stedtfeld, T.M.; Sheng, H.; Williams, M.R.; Hauschild, K.; Gunturu, S.; Tift, L.; Fang, W.; Howe, A.; et al. Primer set 2.0 for highly parallel qPCR array targeting antibiotic resistance genes and mobile genetic elements. FEMS Microbiol. Ecol. 2018, 94, fiy130. [Google Scholar] [CrossRef] [Green Version]
  29. Blatny, J.M.; Reif, B.A.P.; Skogan, G.; Andreassen, O.; Høiby, E.A.; Ask, E.; Waagen, V.; Aanonsen, D.; Aaberge, I.S.; Caugant, D.A. Tracking Airborne Legionella and Legionella pneumophila at a Biological Treatment Plant. Environ. Sci. Technol. 2008, 42, 7360–7367. [Google Scholar] [CrossRef]
  30. Veillette, M.; Bonifait, L.; Mbareche, H.; Marchand, G.; Duchaine, C. Preferential aerosolization of Actinobacteria during handling of composting organic matter. J. Aerosol Sci. 2018, 116, 83–91. [Google Scholar] [CrossRef]
  31. Schloss, P.D. A high-throughput DNA sequence aligner for microbial ecology studies. PLoS ONE 2009, 4, e8230. [Google Scholar] [CrossRef]
  32. Schloss, P.D. Reintroducing mothur: 10 years later. Appl. Environ. Microbiol. 2020, 86, e02343-19. [Google Scholar] [CrossRef]
  33. Brunner, E.; Domhof, S.; Langer, F. Nonparametric Analysis of Longitudinal Data in Factorial Experiments. Biometrics 2002, 54, 1040. [Google Scholar] [CrossRef] [Green Version]
  34. Paranjape, K.; Bédard, E.; Whyte, L.G.; Ronholm, J.; Prévost, M.; Faucher, S.P. Presence of Legionella spp. in cooling towers: The role of microbial diversity, Pseudomonas, and continuous chlorine application. Water Res. 2020, 169, 115252. [Google Scholar] [CrossRef] [PubMed]
  35. Ranalli, G.; Zanardini, E.; Sorlini, C. Biodeterioration—Including Cultural Heritage. In Encyclopedia of Microbiology, 3rd ed.; Academic Press: Cambridge, MA, USA, 2009; pp. 191–205. [Google Scholar] [CrossRef]
  36. Goris, T.; Diekert, G. The Genus Sulfurospirillum. In Organohalide-Respiring Bacteria; Adrian, L., Löffler, F., Eds.; Springer: Berlin/Heidelberg, Germany, 2016. [Google Scholar] [CrossRef]
  37. Kodama, Y.; Watanabe, K. Sulfuricurvum kujiense gen. nov., sp. nov., a facultatively anaerobic, chemolithoautotrophic, sul-fur-oxidizing bacterium isolated from an underground crude-oil storage cavity. Int. J. Syst. Evol. Microbiol. 2004, 54, 2297–2300. [Google Scholar] [CrossRef] [PubMed] [Green Version]
  38. Imhoff, J.F. Chromatiales ord. nov. In Bergey’s Manual of Systematic Bacteriology, 2nd ed.; Springer: New York, NY, USA, 2005; Volume 2 (The Proteobacteria), part B (The Gammaproteobacteria), pp. 1–3. [Google Scholar] [CrossRef]
  39. Storelli, N.; Peduzzi, S.; Saad, M.M.; Frigaard, N.U.; Perret, X.; Tonolla, M. CO2 Assim Chemocline Lake Cadagno is dominated by a few types of phototrophic purple sulfur bacteria. FEMS Microbiol. Ecol. 2013, 84, 421–432. [Google Scholar] [CrossRef] [Green Version]
  40. Carducci, A.; Tozzi, E.; Rubulotta, E.; Casini, B.; Cantiani, L.; Rovini, E.; Muscillo, M.; Pacini, R. Assessing airborne biological hazard from urban wastewater treatment. Water Res. 2000, 34, 1173–1178. [Google Scholar] [CrossRef]
  41. Valster, R.M.; Wullings, B.A.; Bakker, G.; Smidt, H.; van der Kooij, D. Free-Living Protozoa in Two Unchlorinated Drinking Water Supplies, identified by Phylogenic Analysis of 18S rRNA Gene Sequences. Appl. Environ. Microbiol. 2009, 75, 4736–4746. [Google Scholar] [CrossRef] [Green Version]
  42. Haig, S.J.; Kotlarz, N.; LiPuma, J.J.; Raskin, L. A High-Throughput Approach for Identification of Nontuberculous Mycobacteria in Drinking Water Reveal Relationship between Water Age and Mycobacterium avium. Am. Soc. Microbiol. 2018, 9, e02354-17. [Google Scholar] [CrossRef]
  43. Gupta, R.S.; Lo, B.; Son, J. Phylogenomics and Comparative Genomic Studies Robustly Support Division of the Genus Mycobacteriuminto an Emended Genus Mycobacterium and Four Novel Genera. Front. Microbiol. 2018, 9, 1–41. [Google Scholar] [CrossRef] [Green Version]
  44. Falkinham, J.O., III. Mycobacterial aerosols and respiratory disease. Emerg. Infect. Dis. 2003, 9, 763–767. [Google Scholar] [CrossRef]
  45. Parker, B.C.; Ford, M.A.; Gruft, H.; Falkinham, J.O., 3rd. Epidemiology of infection by nontuberculous mycobacteria. IV. Preferential aerosolization of Mycobacterium intracellu-lare from natural water. Am. Rev. Respir. Dis. 1983, 128, 652–656. [Google Scholar] [CrossRef]
  46. Wendt, S.L.; George, K.L.; Parker, B.C.; Gruft, H.; Falkinham, J.O., 3rd. Epidemiology of infection by nontuberculous mycobacteria. III. Isolation of potentially pathogenic mycobacteria in aerosols. Am. Rev. Respir. Dis. 1980, 122, 259–263. [Google Scholar] [CrossRef] [PubMed]
  47. Han, Y.; Yang, T.; Yan, X.; Li, L.; Liu, J. Effect of aeration mode on aerosol characteristics from the same wastewater treatment plant. Water Res. 2020, 170, 115324. [Google Scholar] [CrossRef] [PubMed]
  48. Michaud, J.M.; Thompson, L.R.; Kaul, D.; Espinoza, J.L.; Richter, R.A.; Xu, Z.Z.; Lee, C.; Pham, K.M.; Beall, C.M.; Malfatti, F.; et al. Taxon-specific aerosolization of bacteria and viruses in an experimental ocean-atmosphere mesocosm. Nat. Commun. 2018, 9, 1–10. [Google Scholar] [CrossRef] [PubMed] [Green Version]
  49. Hendriksen, R.S.; Munk, P.; Njage, P.; van Bunnik, B.; McNally, L.; Lukjancenko, O.; Röder, T.; Nieuwenhuijse, D.; Pedersen, S.K.; Kjeldgaard, J.; et al. Global monitoring of antimicrobial resistance based on metagenomics analyses of urban sewage. Nat. Commun. 2019, 10, 1124. [Google Scholar] [CrossRef] [Green Version]
  50. Triggiano, F.; Calia, C.; Diella, G.; Montagna, M.T.; De Giglio, O.; Caggiano, G. The Role of Urban Wastewater in the Environmental Transmission of Antimicrobial Resistance: The Current Situation in Italy (2010–2019). Microorganisms 2020, 8, 1567. [Google Scholar] [CrossRef]
  51. Government of Canada. 2020 Veterinary Antimicrobial Sales Highlights Report. 2020. Available online: https://www.canada.ca/en/health-canada/services/publications/drugs-health-products/2020-veterinary-antimicrobial-sales-highlights-report.html (accessed on 12 September 2022).
  52. Zhang, A.N.; Gaston, J.M.; Dai, C.L.; Zhao, S.; Poyet, M.; Groussin, M.; Yin, X.; Li, L.G.; van Loosdrecht, M.C.M.; Topp, E.; et al. An omics-based framework for assessing the health risk of antimicrobial resistance genes. Nat. Commun. 2021, 12, 4765. [Google Scholar] [CrossRef]
  53. Fortin, E.; Quach, C.; Dionne, M.; Irace-Cima, A.; Sirois, C.; Simard, M.; Jean, S.; Magali-Ufitinema, N. Impact des Maladies Chroniques sur les Taux D’utilisation des Antibiotiques dans la Communauté; Institut National de Santé Publique du Québec: Québec, QC, Canada, 2022. [Google Scholar]
  54. Nnadozie, C.F.; Kumari, S.; Bux, F. Status of pathogens, antibiotic resistance genes and antibiotic residues in wastewater treatment systems. Rev. Environ. Sci. Bio/Technol. 2017, 16, 491–515. [Google Scholar] [CrossRef]
Figure 1. Schematic of the biofiltration system installation. Sampling points are indicated with red stars. The two channels are represented by 1 and 2. BA: bio-atomizer; BF: biofilter.
Atmosphere 13 01723 g001
Figure 2. Biomass concentration for air samples collected upstream (n = 16) and downstream (n = 10) of the biofilter (*: 0.01 < p-value < 0.05). The horizontal line represents the median value. The dots represent the value concentration for each sample. A reduction of 88% was observed between the mean concentration measured in air samples collected upstream and downstream.
Atmosphere 13 01723 g002
Figure 3. Bacterial diversity (16S) for upstream and downstream samples combined per biofilter and per day. The letters represent the sampling day (A = 16 June 2021; B = 30 June 2021), and the numbers 1 or 2 represent each of the channels of the biofilter. This figure presents the 30 most abundant OTUs in the samples. The vertical lines indicate the separation between the two channels (full line) and between the sampling days (dotted lines).
Atmosphere 13 01723 g003
Figure 4. Number of observed OTUs calculated with the Sobs index (a), and diversity analysis performed using the Shannon index (b) and Chao index (c) for air samples collected upstream (n = 16) and downstream (n = 10) from the biofilter. Results are presented as the median and box plots (25–75%) with whiskers (10–90%).
Atmosphere 13 01723 g004
Figure 5. Nonmetric multidimensional scaling (NMDS) distance matrix analysis between the upstream samples (red dots) and the downstream samples (blue dots) based on Jaccard distances. Each dot is labeled with the following code: Sampling date (S12: 16 June; S14: 30 June, sample type (BA: before the bioatomizer, upstream; BF: after the biofilter, downstream), and the biofilter number (1: channel 1; 2: channel 2).
Atmosphere 13 01723 g005
Figure 6. Relative abundance of ARGs in samples. The circles represent samples upstream of the biofilter, and the crosses represent samples downstream of the biofilter. The samples for all three sampling days are grouped in these graphs. The median is shown as a horizontal line for each set of data. The dotted line represents the quantification limit. A non-parametric mixed statistical model was performed to assess whether the change between upstream and downstream samples was significant for each ARG. Significant differences are indicated with stars (*: 0.01 < p-value < 0.05; **: 0.001 ≤ p-value < 0.01, ***: p-value < 0.001).
Atmosphere 13 01723 g006aAtmosphere 13 01723 g006b
Table 1. Comparison of the 10 most abundant taxa in the air from the biofilter affluent (upstream) and effluent (downstream).
UpstreamOTU%DownstreamOTU%
Bacillales_unclassified121.76Ruminococcaceae_unclassified402.55
Bacteria_unclassified111.61Bacteria_unclassified301.91
Pseudonocardia111.61Lachnospiraceae_unclassified221.40
Ruminococcaceae_unclassified101.47Acinetobacter191.21
Gammaproteobacteria_unclassified71.03Blautia171.08
Actinomycetales_unclassified60.88Streptococcus140.89
Acinetobacter60.88Clostridiales_unclassified140.89
Bacteroidetes_unclassified50.73Bacillales_unclassified130.83
Streptococcus50.73Bacteroides120.76
Smithella50.73Coprococcus120.76
Publisher’s Note: MDPI stays neutral with regard to jurisdictional claims in published maps and institutional affiliations.

