Article

Source Apportionment of Heavy Metals in Wet Deposition in a Typical Industry City Based on Multiple Models

1
College of Energy and Environment Engineering, Hebei University of Engineering, Handan 056038, China
2
Hebei Key Laboratory of Air Pollution Cause and Impact, Hebei University of Engineering, Handan 056038, China
3
Institute of Environmental Planning and Management, College of Environmental Science and Engineering, Tongji University, Shanghai 200092, China
4
School of Information and Electrical Engineering, Hebei University of Engineering, Handan 056038, China
*
Author to whom correspondence should be addressed.
Atmosphere 2022, 13(10), 1716; https://doi.org/10.3390/atmos13101716
Submission received: 28 August 2022 / Revised: 26 September 2022 / Accepted: 28 September 2022 / Published: 19 October 2022
(This article belongs to the Topic Climate Change, Air Pollution, and Human Health)

Abstract

:
Handan city as a transportation hub in North China, air quality ranks at the bottom all year round, causing environmental pollution that has aroused widespread concern. In order to explore the pollution characteristics and main sources of heavy metals in atmospheric wet deposition in the city, and comparison of the applicability of multiple traceability models, a total of 76 wet deposition samples were collected in the three functional areas from December 2017 to November 2019 by a dry and wet deposition automatic sampler. Concentrations of Cu, Zn, Cr, Ni, Pb, and As were determined and enrichment factors were calculated. Sources of these heavy metals were apportioned by PMF, Unmix, and APCS-MLR models, and analyzed using a backward trajectory analysis model. The results showed that the concentrations of these heavy metals in the atmospheric wet deposition were in order of Zn, Cr, Pb, Cu, Ni, and As, and their mean concentrations were 29.53, 14.11, 9.18, 7.03, 6.41, and 1.21 μg·L−1, respectively. According to the results of EF, the studied heavy metals were mainly affected by anthropogenic activities. The source apportionment results showed that heavy metal pollution in the wet deposition was mainly affected by traffic sources, industrial sources, and coal combustion sources, and PMF identified an additional source factor: metal smelting source. By comparing the relevant parameters of the source apportionment results of the three models, the APCS-MLR model has better accuracy results than PMF and Unmix models. The analysis of the backward trajectory of the air mass showed that the wet deposition of Handan in the study time was mainly from the southwest direction, accounting for 54.35%. In the future, more evaluation methods and models will be used to compare and analyze the different application scenarios and parameter selection requirements in order to contribute to urban atmospheric environmental pollution prevention and control work.

1. Introduction

In recent years, heavy metal pollution has received widespread attention all over the world, due to its toxicity, difficult degradation, and strong bioaccumulation [1,2]. Heavy metals in the environment seriously threaten the stability and balance of ecosystems, so their spatial distribution characteristics and main sources of pollution have also become a hot topic at present. Studies have shown that the primary source and carrier of pollutants are atmospheric deposition [3,4,5]. Wet deposition refers to the process in which particulate and gaseous pollutants in the atmosphere settle to the surface after weather processes such as wet deposition, snowfall, hail, and fog, and is one of the main ways these air pollutants are moved [6]. Wet deposition carries heavy metal pollutants into the surface environment, which will have a serious impact on the ecosystem health of land and water bodies [7]. Heavy metals are difficult to degrade and accumulate continuously after deposition on the surface, causing harm to soil or plants and even affecting human health. Routine monitoring of trace metal elements in atmospheric wet deposition began as early as 1983 [8]. Since the 1990s, chromium (Cr), copper (Cu), nickel (Ni), zinc (Zn), lead (Pb), arsenic (As), and other elements in a wet deposition have been successively included in routine detection in various countries [9]. It has been shown that heavy metal deposition fluxes were affected by emission sources, emission intensity, prevailing wind direction, and precipitation, heavy metals present a serious health risk to humans when the concentration level and exposure time are increased [10,11]. For example, wet deposition in Spain and France accounted for 70–97% of the total metal deposition, while the Mediterranean and less wet deposition in semi-arid areas showed the opposite trend [12,13]. In winter and spring, wet deposition fluxes of trace elements along the Japan Sea coast were strongly affected by the long-range transport of air pollutants from Eurasia [14]. Scholars in China have also reported the pollution characteristics and sources of heavy metals in wet deposition, for example, the concentrations of heavy metals in wet deposition in Beijing and Tangshan were higher than those in Chengdu and Xiaogan [6,15,16,17], and Zn, Pb, Cu and Cd in wet deposition in Xinghua Bay, Fujian Province were mainly derived from industrial activities [18].
It is important to study the characteristics of metal elements in atmospheric wet deposition and analyze the source of metal elements for understanding the geochemical cycle of pollutants and regional soil ecological environment quality. At present, the research on atmospheric heavy metals in Handan mainly focuses on PM2.5/10 and atmospheric dry deposition, and there are relatively few studies on heavy metals in wet deposition. As a typical heavy industrial city in Northern China, heavy pollution enterprises such as steel smelters and coking plants are located in Handan urban area, and coal, steel, and cement are its pillar industries, all of this high-energy consumption and high-emission industries produce a large number of atmospheric pollutants [19,20]. Its atmospheric pollutant emissions ranked at the forefront of urban China all year round [21], which is a frequent area of particulate matter pollution [22,23]. Studies have shown that coal carbon combustion sources are the main sources of wet deposition in cities [24]. Therefore, the concentration and pollution characteristics of heavy metals in atmospheric wet deposition in Handan were studied, and the pollution sources were discussed, which provided a scientific basis for the prevention and control of heavy metal pollution.
Source apportionment of heavy metals in the atmosphere was investigated by absolute principal component score-multiple linear regression (APCS-MLR), positive matrix factorization (PMF), and Unmix model. These models can identify major pollution sources of heavy metals, such as agricultural, industrial, and natural sources [25,26]. APCS-MLR is based on principal component analysis to calculate the absolute true score (APCS) of the factor, and then calculate the contribution rate of the common factor to the index in combination with the multiple linear regression model [27]. PMF has non-negative elements in the decomposition matrix without the need to measure the source fingerprint spectrum, can be optimized by using the standard deviation of the data, and can deal with missed and imprecise data [28]. The Unmix model estimates the number of sources by reducing the dimensionality of the data by using the method of singular value decomposition (SVD) [29]. In this study, the results obtained from the above three receptor models were compared in order to obtain reasonable source apportionment results and provide a more reliable basis for the prevention and control of air pollution. In addition, Meteoinfo software (Chinese Academy of Meteorological Sciences, Beijing, China) is used to cluster the wet deposition weather data to obtain different types of air mass transport trajectories [30], which is convenient to study the pollution source distribution and transmission characteristics.
The major objectives of this research were to: (a) the concentrations of Cr, Cu, Ni, Zn, Pb and As in wet deposition of Handan were determined, calculate enrichment factors to investigate their pollution enrichment degree; (b) identify the sources of heavy metals by Unmix, PMF, and APCS-MLR models, and the suitability of the three models was compared; (c) further analyze the region and source of influencing pollutant concentration by backward trajectory model.

2. Materials and Methods

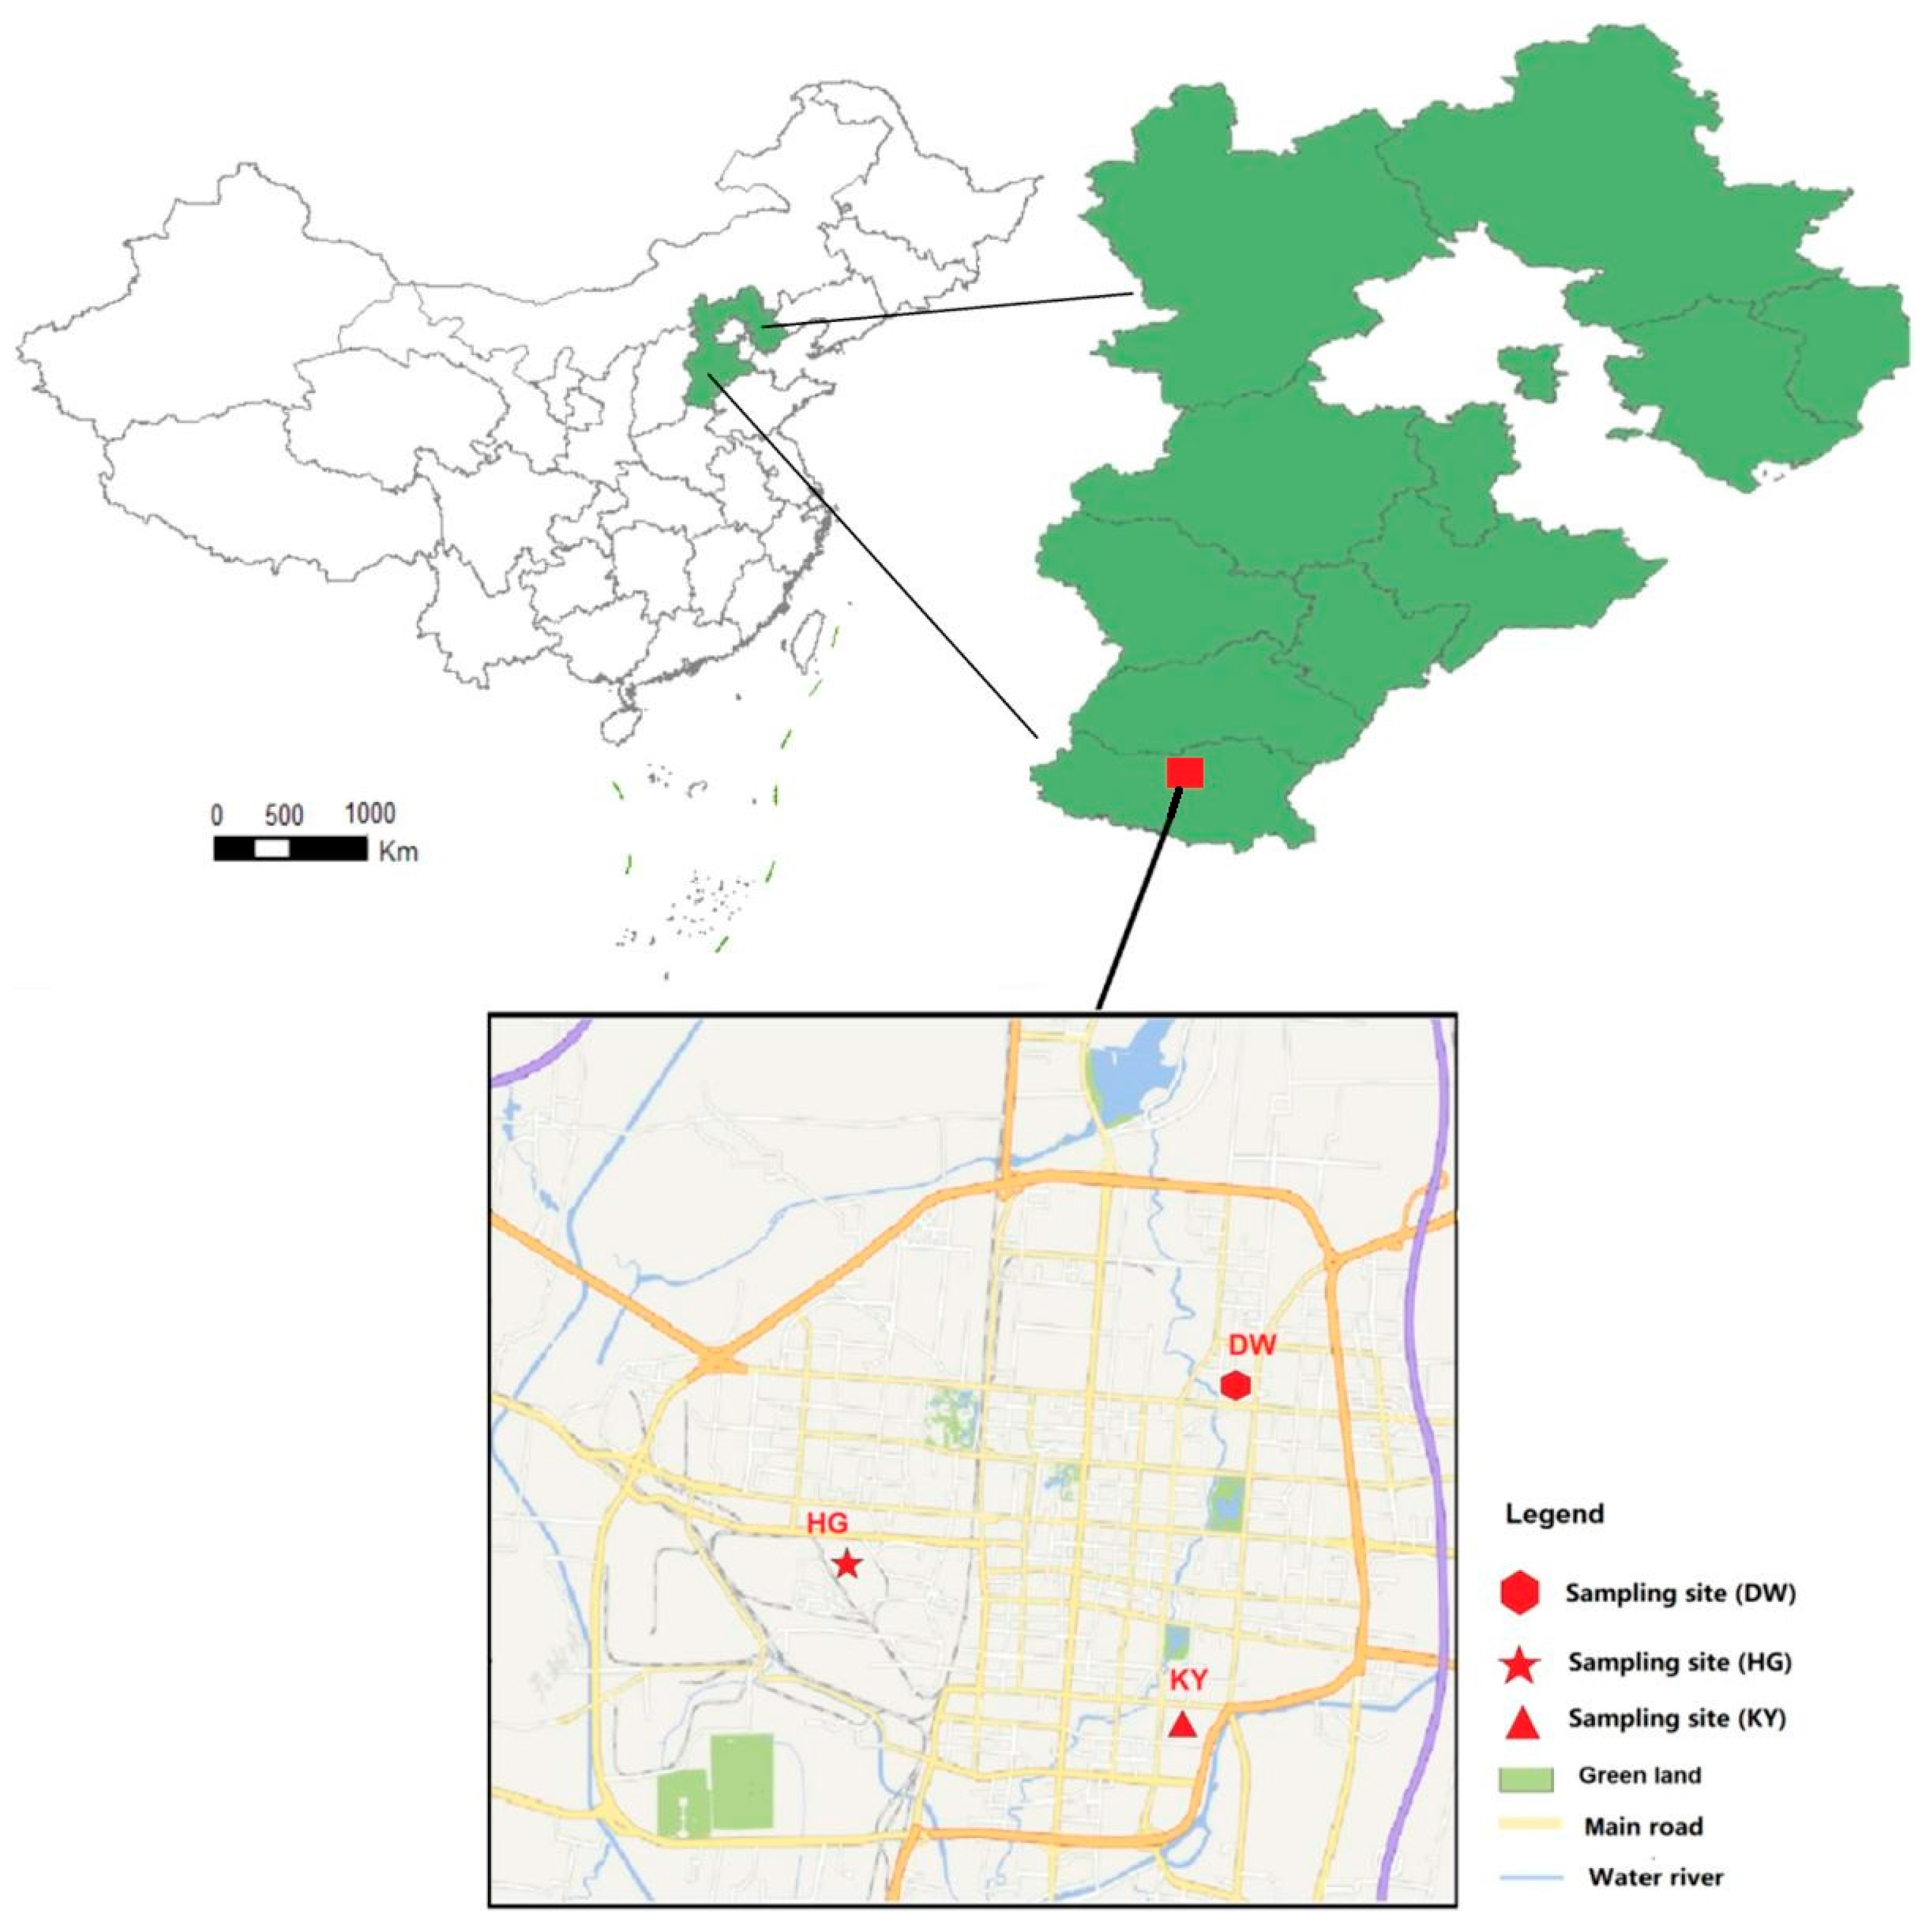
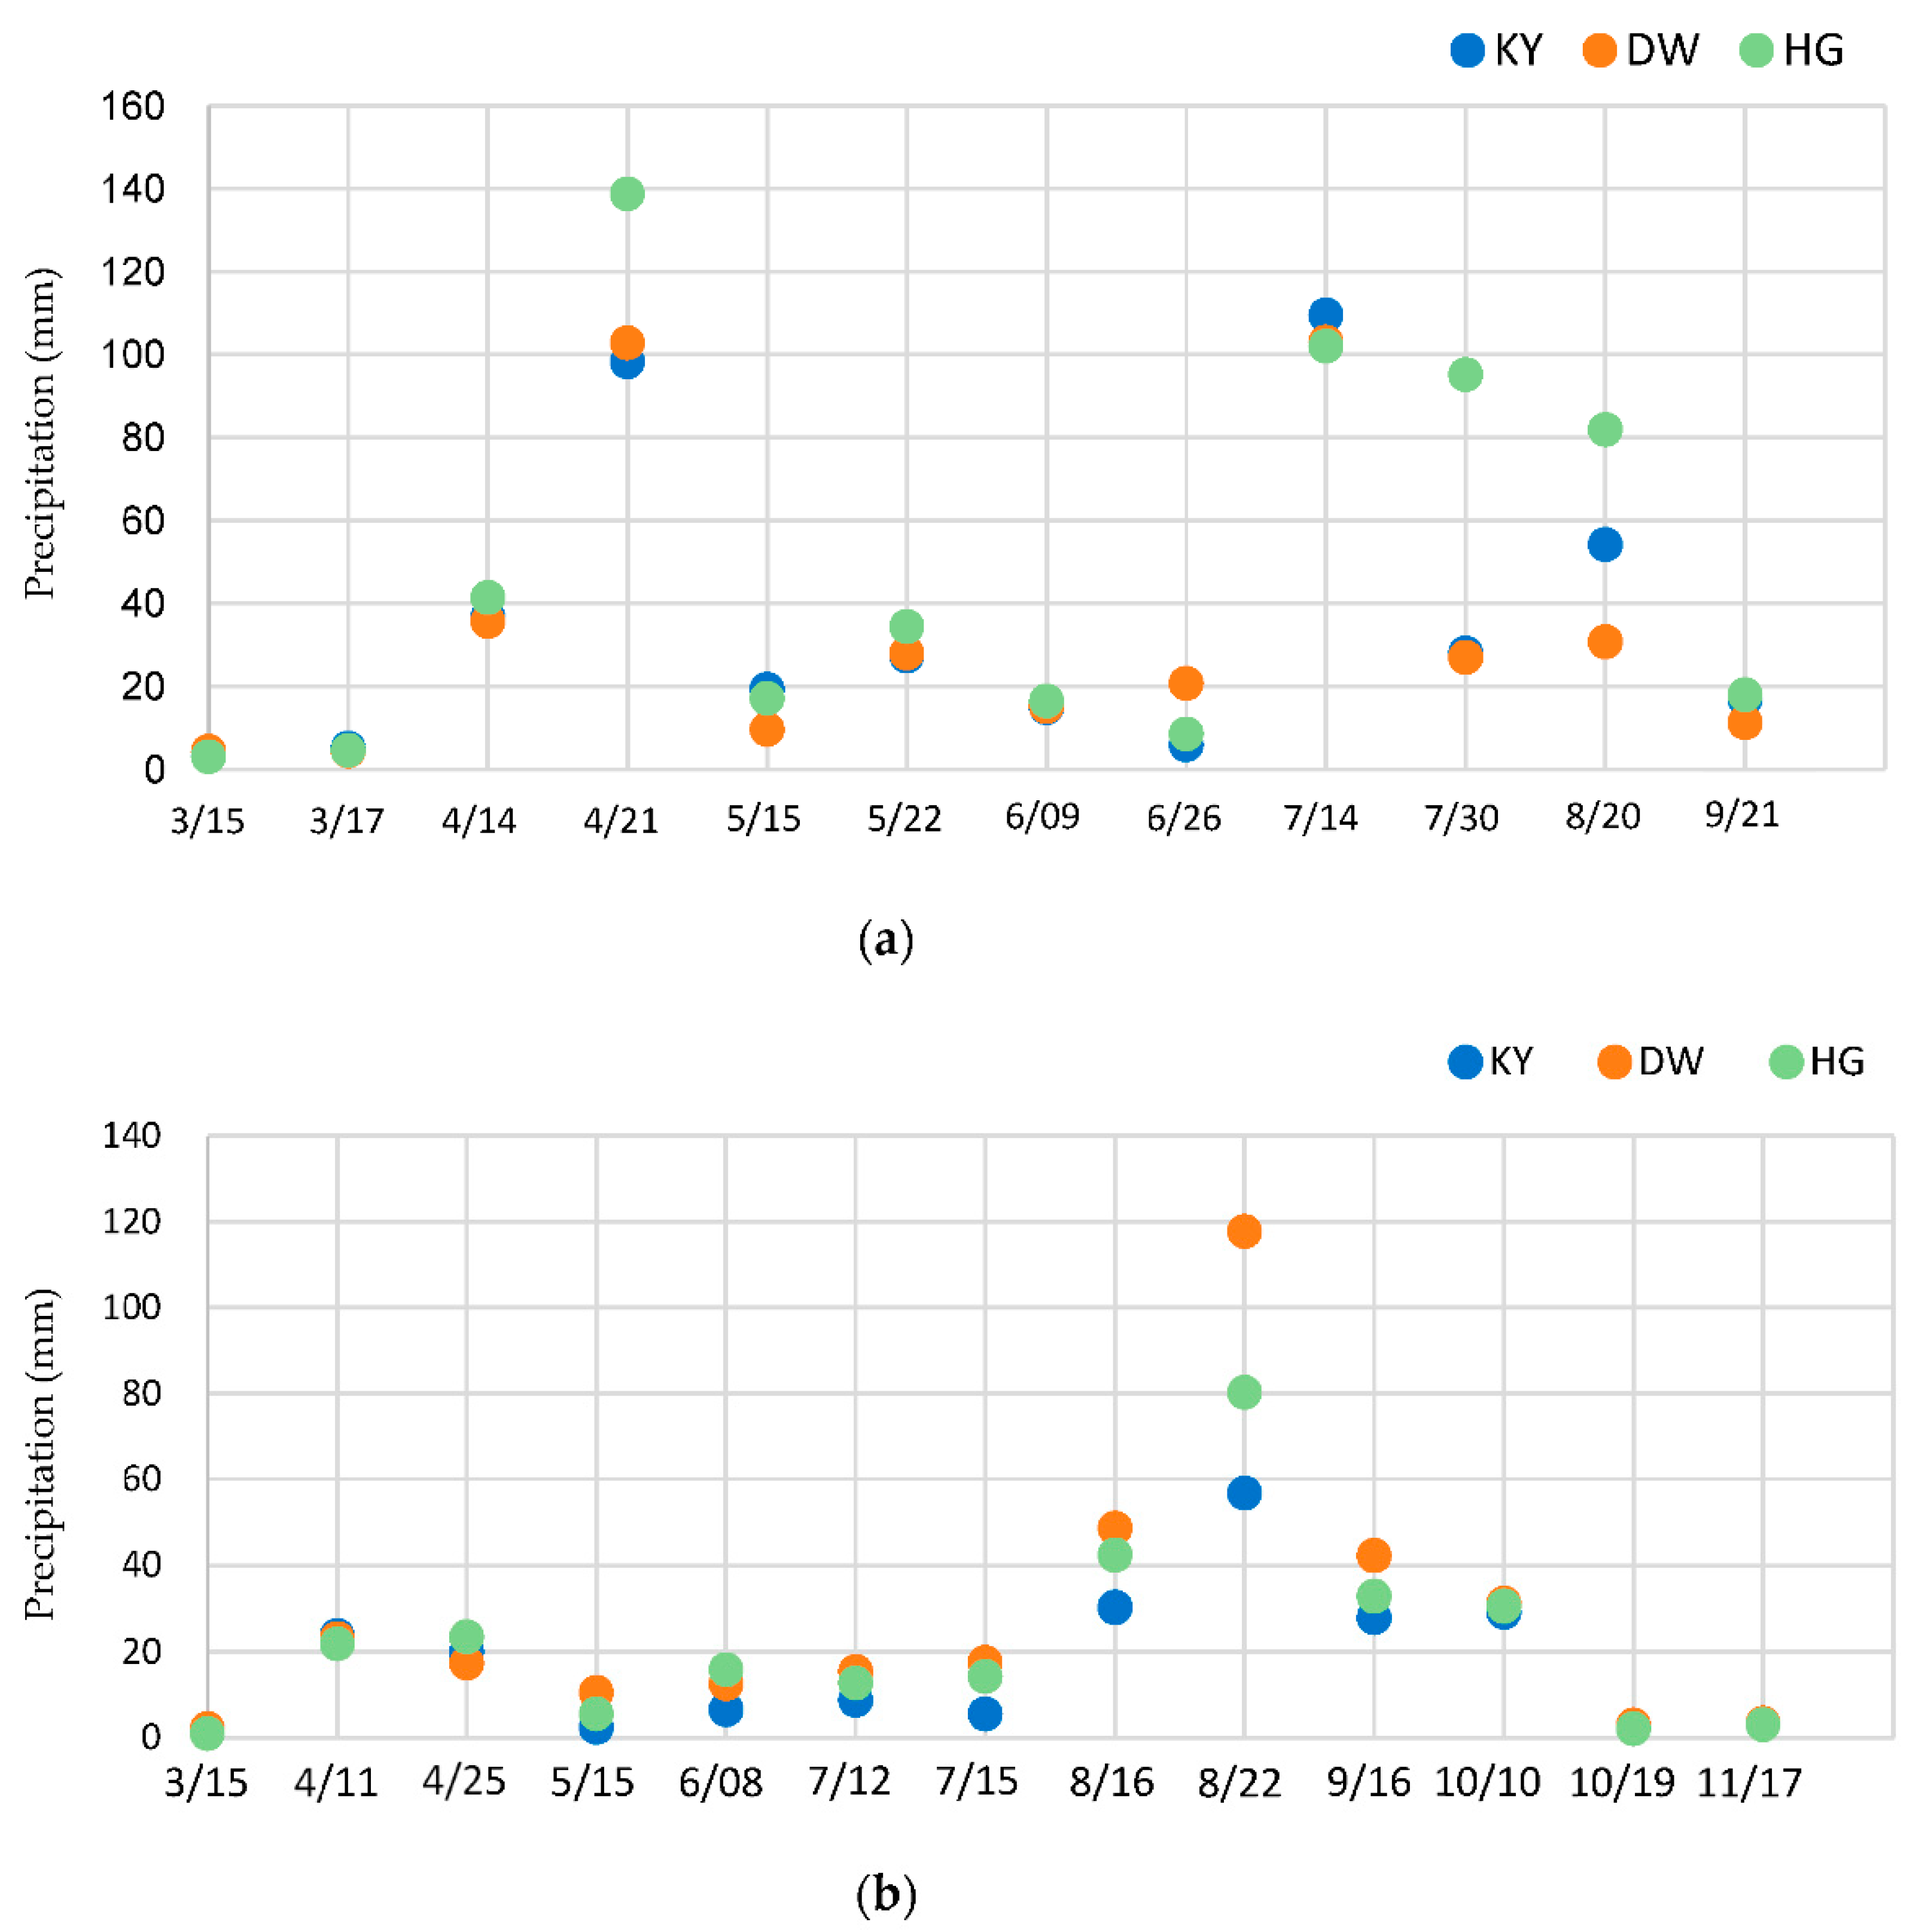
2.1. Study Area and Sampling

Handan is located in Southern Hebei Province, China, bordering Shanxi Province and Henan Province, with Taihang Mountain in the west and North China Plain in the east. The total urban area is 12,073.8 km2, and the resident population is 9,549,700. Taking into account the urban function division of Handan City, three sampling stations were laid in the main urban area City (KY, DW, and HG). KY was located in Hebei University of Engineering (N 36.57°, E 114.50°), representing the high parish area; DW was located in the East Sewage Treatment Plant in Handan (N 36.63°, E 114.53°), representing the living area; HG was located in Handan Iron and Steel Co, Ltd. (N 36.60°, E 114.44°) of HBIS Group Hansteel Company, representing the industrial area. The specific distribution of sampling points was shown in Figure 1.
All sampling points were set up on an open building roof, with a height of about 12 to 15 m. There were no tall shielding objects and local pollution sources around. Dry and wet deposition samples were monitored and collected monthly from December 2017 to November 2019 by dry–wet deposition automatic collector (TE-78-100X, Tisch. Cleveland, OH, USA). The sampling barrel was soaked in 10% HCl solution for 24 h, washed with deionized water, dried, and placed at the sampling point for collection [8,12]. In this study, 76 wet deposition samples were collected after wet deposition.

2.2. Chemistry Analysis

After the wet deposition samples were collected and sent to the laboratory, the falling leaves, insects, and other foreign bodies were removed, the particulate matter in the samples was filtrated with a 0.45 µm microporous membrane, the filtrate was loaded into a dry and clean polyethylene plastic bottle, a part of the samples were taken to determine the pH (PHS-3C) and conductivity (DDS-11A) on the spot, and the remaining samples were placed in a refrigerator at 4 °C for preservation. Wet deposition samples adopted water quality-digestion of total metals-nitric acid digestion method (HJ677-2013) standard. Take 100 mL water sample into a beaker, add 5 mL concentrated HNO3, and mix it with sample. Cover the beaker and put it on the electric heating plate (EH20A plus, LabTech. Beijing, China) and kept at 95 ± 5 °C until the sample had completely reacted with HNO3, then removed the cover and evaporated the solution to about 5 mL. After the reaction, the resulting solution was cooled down to room temperature, added 3 mL H2O2, and continued heating until the general appearance of the solution did not change. Transfer the solution to a volumetric bottle of 100 mL, add distilled water to the scale mark, and filter with 0.45 µm filter film. Cu, Zn, Cr, Ni, and Pb were analyzed using an inductively coupled plasma atomic emission spectrometer (ICP-OES) (Agilent 5100, Agilent Technologies. Santa Clara, CA, USA) [16]. As was determined by atomic fluorescence spectrometer (AFS-230E. Runqee, Beijing, China). In the wet deposition water-soluble blank ion test, rinsed sample bottle with 50 mL deionized water, preserved and determined according to the above test method. Prepare 2 blank tests for each batch of digested samples and took the average [8].

2.3. Quality Control and Quality Assurance

All data were subjected to strict quality assurance and control procedures. The detection limits (3× the standard deviation of the blanks) were as follow: Cr (0.0002 μg·L−1), Ni (0.004 μg·L−1), Cu (0.0002 μg·L−1), Zn (0.0003 μg·L−1), As (0.0006 μg·L−1) and Pb (0.008 μg·L−1). Calibrating the standard curve for every 10 samples analyzed, and the analytical error was <5%, the recovery rates for the elements were between 85 and 105%, the correlation coefficients (R2) of the calibration curves were ≥0.999 for all elements, each sample was operated in parallel three times. LODs of heavy metals was determined by triple standard deviations from seven replicates at the lowest level of the standard solution (1 to 20 ug/L), and it showed the linearity16. When parallel samples were collected, the number of parallel samples was controlled at 10% of the total number of samples, and the deviation between the determination results of parallel samples and samples was less than 10% [10]. The concentration of each metal in the blank sample determined was lower than the detection limit.

3. Data Analysis

3.1. Enrichment Factor

The enrichment factor (EF) was a method used to express the enrichment degree of elements, and judge and evaluate the source of elements in particulate matter (natural source and anthropogenic source). We generally choose elements such as Ti and Al which have little anthropogenic pollution impact and stable geochemical properties as reference elements, Al was chosen as the reference element in this study. The calculation formula is as follows [31]:
EF = (Ci/CAl)wet deposition/(Ci/CAl)background
where Ci is the concentration of element i (μg·L−1), CAl is the concentration of Al. The element concentration average value of layer A soil in Hebei Province was used as the background value [32]. The enrichment factor was calculated for each sample collected and averaged separately based on the number of collections within each month. Pollution degrees can be divided into three categories according to the EF values, and their specific grading criteria and pollution source are presented in Table 1.

3.2. Unmix Model

The Unmix model is one of the source apportionment models recommended by the U.S. Environmental Protection Agency (EPA), which is an acceptor model developed on the basis of PCA. The Unmix model is simple to perform, does not require complex adjustments to parameters, and does not require knowing the source component spectrum [33]. The basic formula is as follows [34,35]:
C ij = k = 1 m F j k S i k + E
where Cij is the concentration of the jth specie in the ith sample; Fjk is the concentration of the jth specie in source k (1 …. m) mass fraction; Sik is the total amount of source k in the ith sample, representing the contribution rate of the source; E is the standard deviation of each source composition. It is generally believed that the use of this model must meet the following two conditions simultaneously: ① MinR2 > 0.8, R2 is the correlation coefficient of the calculated value and the measured value of specie concentration; ② MinS/N > 2, S/N represents the signal to noise ratio, the model analysis results are credible.

3.3. PMF Model

The PMF model was first proposed by Paatero in 1994 [27]. The sample concentration in the model is expressed by factor contribution, factor distribution and residual error. The principle is based on the weighted least squares method for bounded and iterative calculation. The matrix X is continuously decomposed to obtain the matrices G and F, and the new matrix is optimized and solved. When the objective function Q is the smallest, it is the optimal solution [26,28]. In the operation process, the model needs to repeatedly calculate and select the optimal result according to the signal and noise ratio (S/N) and Q value. The calculation formula is as follows:
X ij = k = 1 p G i k F k j + E ij
Q = i = 1 n j = 1 m [ E i j k = 1 p G i k F k j U i j ]
where Xij is the measurement matrix of the jth heavy metal in sample i; Gik is the contribution matrix of the kth source factor in sample i; Fkj is the distribution matrix of the jth heavy metal in the kth source factor; Eij is the residual value of the jth heavy metal in sample i; Q is the objective function defined by the PMF model; Uij is the uncertainty value of the jth element in the ith sample.
Running the PMF model requires the import of uncertainty data, and if the heavy metal concentration is less than the species-specific method detection limit (MDL), then the uncertainty value is equal to 5 6 of the MDL; if heavy metal concentration exceeds MDL value, the uncertainty value is calculated by the Equation (5):
U ij = ( R S D × C ) 2 + ( M D L ) 2
where C is measured heavy metal concentration and RSD is the relative standard deviation of the heavy metal concentration.

3.4. APCS-MLR Model

Absolute principal component score-multiple linear regression (APCS-MLR) receptor model was proposed by Thurston and Spengler (1985) [26]. The purpose of multiple linear regression is to further determine the contribution rate of different pollution sources on the basis of source identification. To standardize the concentration of data processing, the basic formula is as follows:
Z ij = C ij C _ i σ i
Zij is the standardization concentration value (dimensionless); Cij is the concentration of element i; Ci and σ i are the mean concentration and standard deviation of element i, respectively.
Introduced the artificial sample with concentration of 0, calculate the factor fraction of this sample, and calculate the formula as:
Z 0 i = 0 C i _ σ i = C i _ σ i
The standardized factor scores of heavy metal concentration samples can be obtained by principal component analysis (PCA), and the absolute principal component scores (APCS) of each heavy metal element can be obtained by subtracting the factor score of the sample from the factor score of the zero-concentration human sample corresponding to heavy metals. Then taking APCS as independent variable and the concentration of heavy metal element as dependent variable, multiple linear regression was performed. The calculation formula is as follows:
C i = b i 0 + p = 1 n ( b pi × A P C S p )
where Ci is the element concentration; bi0 is the constant term of multiple linear regression; n is the total source number; bpi is the regression coefficient of multiple linear regression; APCSp is the absolute principal component factor score; bpi × APCSp is the contribution rate of source p to Ci concentration, and the average value of bpi × APCSp of all samples is the contribution rate of this source.

4. Result and Discussion

4.1. Heavy Metal Concentration Level in Wet Deposition

In this study, the precipitation during the wet deposition samples collection period is shown in Figure 2 below, and precipitation ranged from 393–561 mm at the three sampling sites in 2018 and 219–344 mm in 2019. Precipitation in 2018 was mainly concentrated in April and July, and in 2019 in August. The other three sampling sites had some differences in precipitation, with 36 and 39 valid wet deposition samples collected in 2018 and 2019, respectively.
According to the results of chemical analysis, the average concentrations of six metal elements in wet deposition from December 2017 to November 2019 in three functional areas of Handan were statistically analyzed. It can be seen from Table 2 that the average concentrations of elements from high to low were Zn, Cr, Pb, Cu, Ni, and As. Among them, The average concentration of Zn was 29.52 μg·L−1, which was much higher than other elements; the mean value of As was only 1.21 μg·L−1. Elements also vary in concentration in different functional regions. The concentrations of Cr, Ni, and Pb were highest in high parishes, As was highest in living areas, and Cu and Zn were highest in industrial areas. In the three functional regions, Zn and Cr were the highest. Among them, Zn is a metallurgical dust characteristic element, and Zn is also produced by the wear of rubber tires [36,37], while Cr is closely related to industrial production [38], indicating that industrial and traffic sources contribute the most to heavy metal particulate matter in atmospheric wet deposition in Handan City. This city is also dominated by heavy industry, and there are industrial enterprises such as machinery factories and smelters around [39]; due to its special geographical location of the city, it is located at the junction of the four provinces of Hebei, Shandong, and Henan, and its developed transportation may also be the reason for the high concentration of elements in wet deposition in this area [40].

4.2. Enrichment Factor

Because there had been few rainfalls and snowfalls from October to next February in Handan, no effective wet deposition samples were collected, so only samples from March to September were selected for comparative analysis. The EF value of each heavy metal was calculated according to Equation (2), as shown in Figure 3. There were differences in the enrichment levels between different heavy metals during different months in the study area, while their EF values were all above 10. Most of the EF values of Cr, Cu, Pb, Zn, and Ni were above 100, and the EF values of As were mostly between 10 and 100, indicating that the study area was mainly affected by anthropogenic sources. Some of the EF values of Cr, Cu, Pb, Zn, and Ni were greater than 1000, showing a high enrichment, indicating that they were seriously affected by anthropogenic activities. The above results were consistent with other scholars’ research reports, indicating that the concentration of six elements in wet deposition in this study was seriously affected by human activities [6,41].

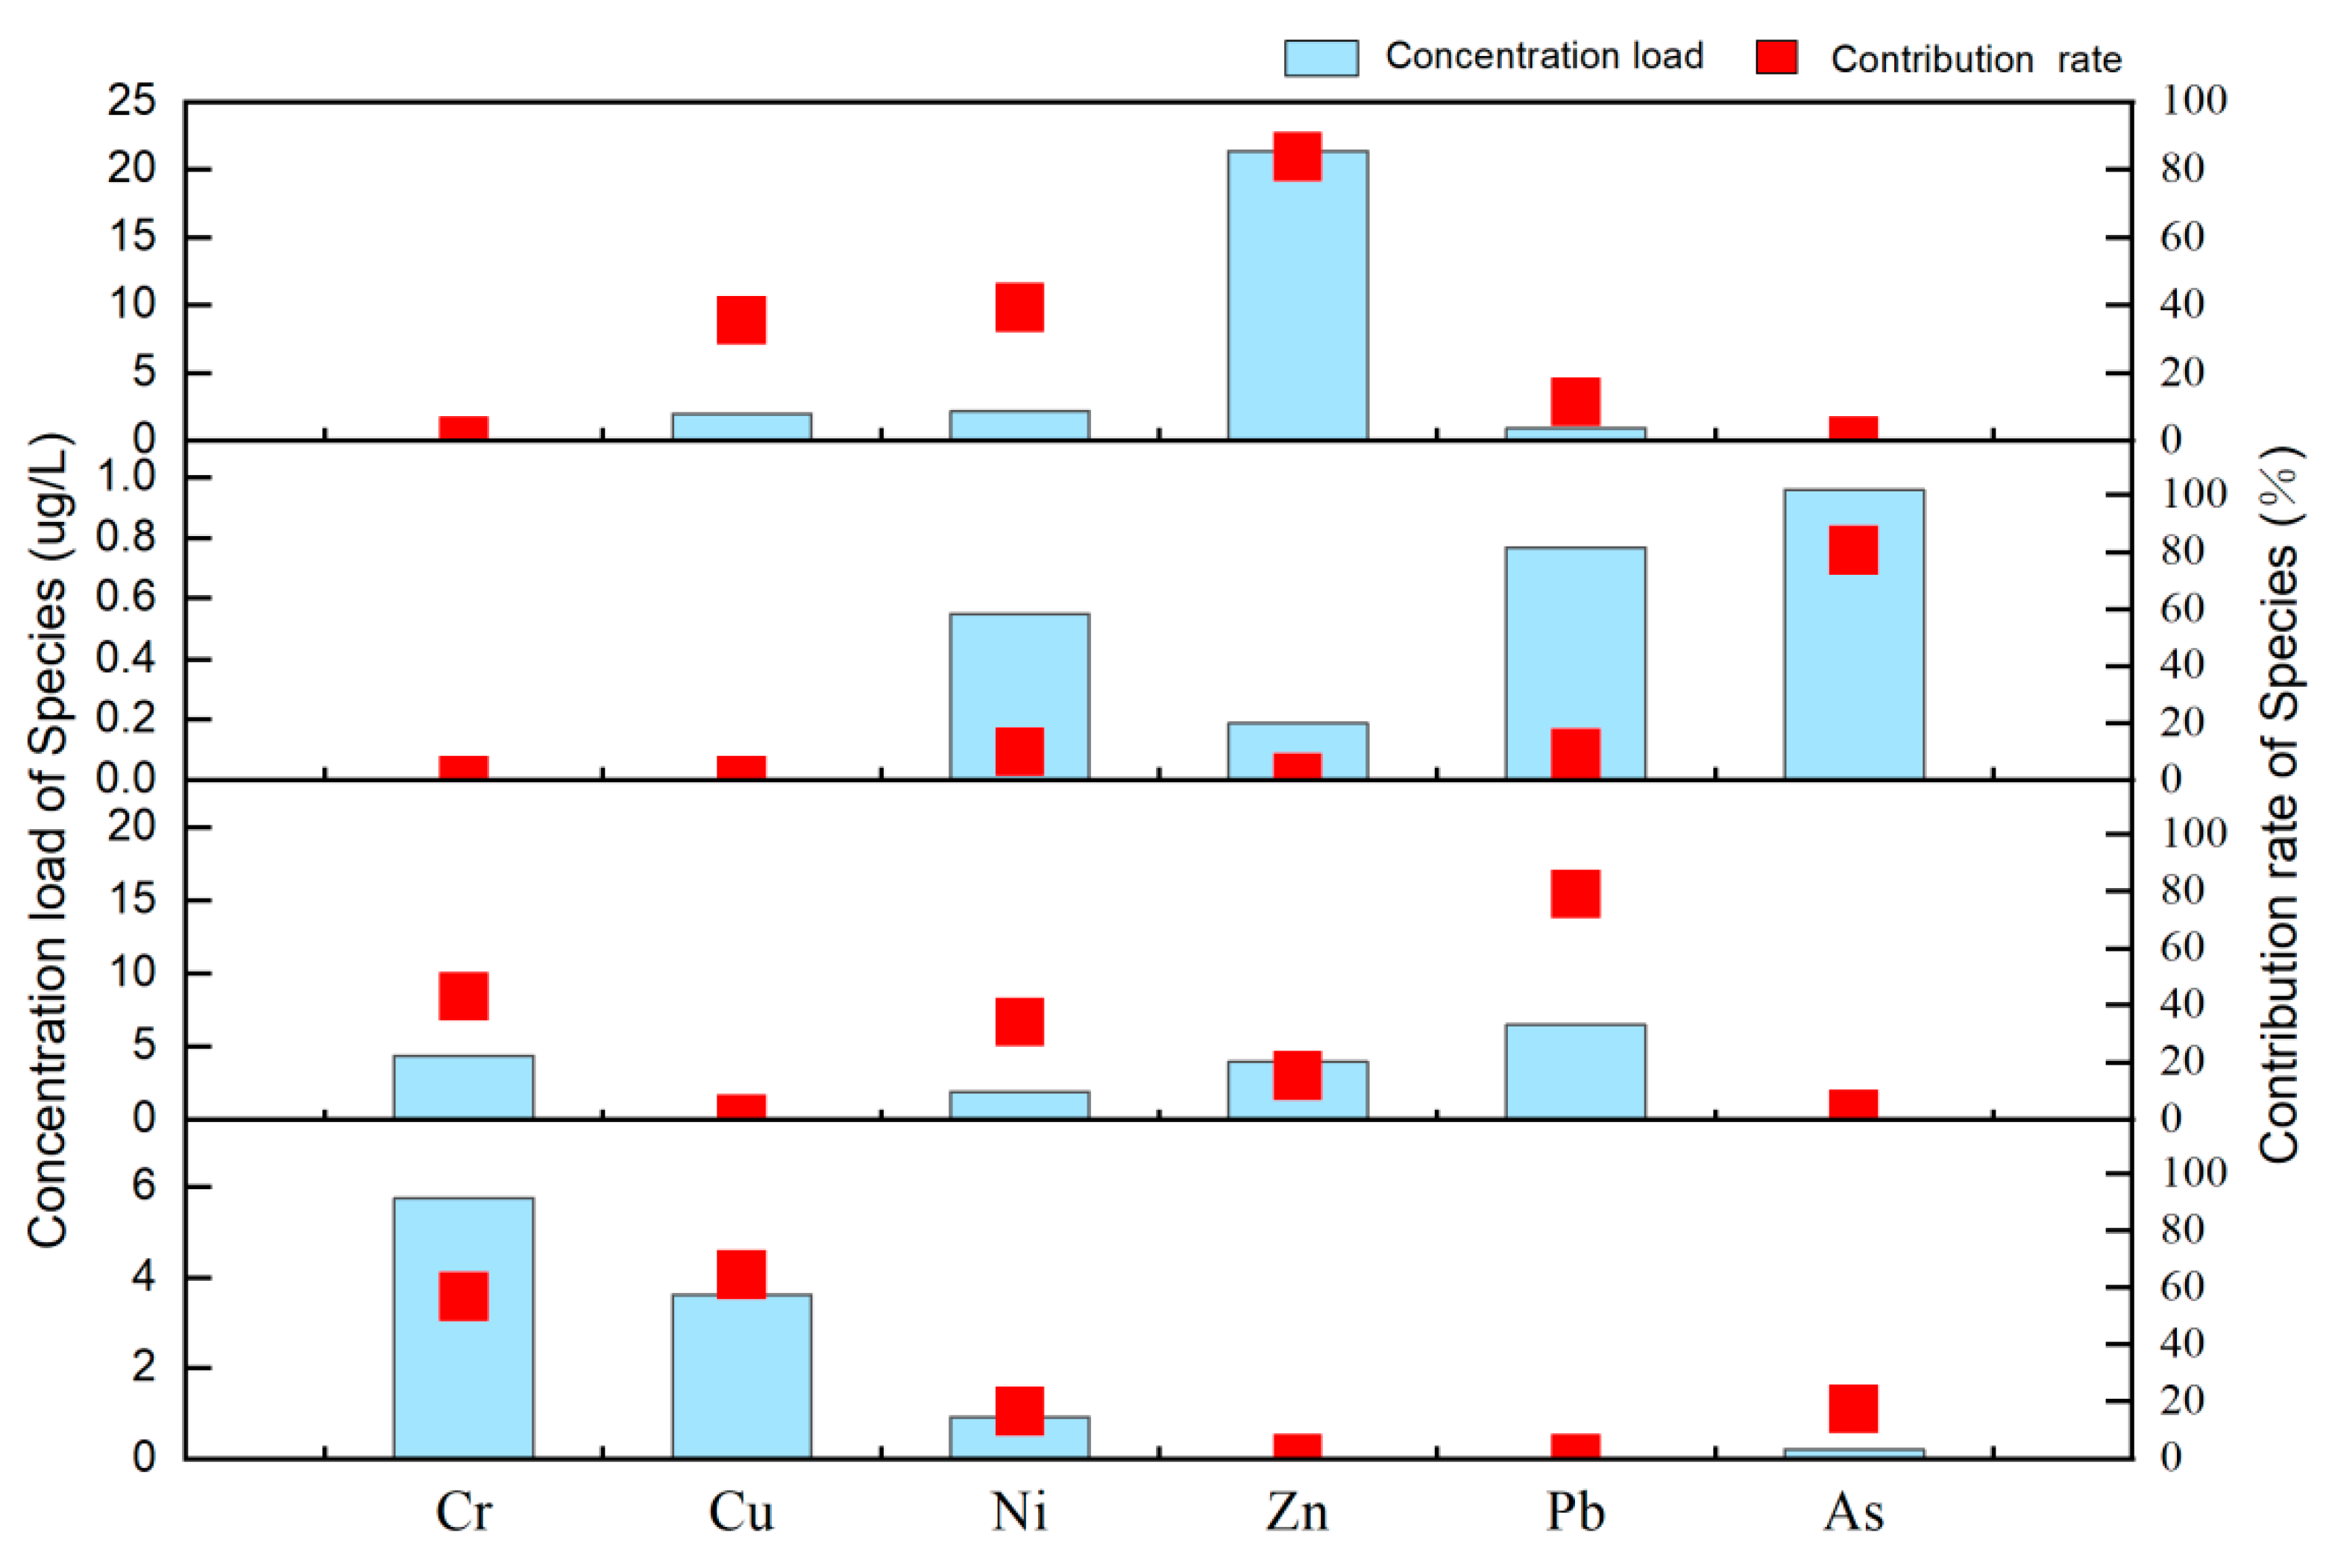
4.3. Source Apportionment

4.3.1. Results of the PMF Model

The contribution load and rate of each element source analyzed by the PMF model was shown in Figure 4. The factor probability value obtained by PMF model decomposition was an important basis for the quantitative allocation of heavy metals to sources [6]. In this study, the PMF model completed 20 probability matrix decomposition until the factors number was 4, and the QRobust/QTrue value tended to converge and reached a minimum value (QTrue was the goodness-of-fit parameter calculated including all points, QRoubust was the goodness-of-fit parameter calculated excluding points not fit by the model), while the residual size was basically located between −3 and 3, S/N ≥ 8.9, R2 ≥ 0.54, which met the optimal result requirements, and the model analysis effect was good.
The concentration load of Zn in factor 1 was the highest, and its contribution rate was as high as 83.83%, and the contribution rate of Ni was 39.33%. Zn was mainly derived from smelting and mining, was a marker element of industrial pollution, and was also widely used in the production of tires in the rubber products industry; the corrosion-resistant alloy that constitutes the shell of motor vehicles contains Ni, and it was also associated with coal burning [42,43]. Therefore, factor 1 can be identified as a mixed source of industry and transportation.
As had the highest concentration load in factor 2, and its contribution rate was 96%. Ni and Pb also had a certain concentration load on factor 2, but the contribution rates were below 10%. Therefore, As was the main element of factor 2, and it was also a characteristic and tracer element of coal-burning emissions [44], Handan is a typical heavy industrial city, with coal consumption of 4.01 × 10⁷ and 4.10 × 10⁷ t in 2018 and 2019, respectively [45,46]. Therefore, it was considered that factor 2 was mainly the source of coal combustion.
Pb had the highest concentration load in factor 3, with a contribution rate of 79.03%, and the other elements had a low concentration load. Pb was generally derived from traffic emissions and industrial activities, but with the use of unleaded gasoline, the contribution of traffic emissions to Pb in the atmosphere had decreased, and industrial emissions had gradually become the main source of atmospheric dust Pb [45]. Therefore, factor 3 was considered to be of industrial origin.
The concentration loading of Cr and Cu in factor 4 was much higher than those of other elements, and the contribution rates were as high as 56.87% and 64.45%. Cu was a marker element in the nonferrous metallurgy industry, while Cr had a close association with metal smelting in the atmospheric environment [46,47]. Factor 4 was therefore considered to be a metal smelting source.

4.3.2. Results of the Unmix Model

The contribution rate of different sources by Unmix model is shown in Figure 5. The numerical value for the solution’s diagnostic indicators (MinR2 = 0.85 and MinS/N = 2.14) is consistent with the recommendations, and the analytical results obtained from these three sources were credible.
The heavy metals accounted for 30.90%, 55.80%, and 13.30% in source 1, source 2, and source 3, respectively. Pb and Cr accounted for high concentrations of load on source 1, which were typical industrial sources and were also closely related to metal smelting, and large state-owned smelters were located in the study area [48,49], so source 1 was defined as the industrial source. Source 2 accounted for the largest proportion of interpretation of heavy metals, Cu, Ni, and Zn were representative elements, accounting for 51.65%, 57.14%, and 87.93%, respectively. Ni and Zn were a significant correlation with transportation, and Cu was used as an additive for automotive braking and heat dissipation systems [50], so source 2 was defined as a traffic source. The representative element in source 3 was As, accounting for 80.56% and consisting of of the factor 2 elucidation result of PMF. Cr and Cu also had a certain concentration load in source 3, but the contribution rate was below 50%, much lower than that of As, so source 3 was judged as coal-fired.

4.3.3. Results of the APCS-MLR Model

In this study, six heavy metals were tested for suitability (Kaiser–Meyer–Olkin, KMO), their KMO was 0.568 > 0.5, and Bartlett’s sphericity test p value was ≤0.001, indicating that there was a good correlation between the elements, and they were suitable for factor analysis. According to the APCS-MLR receptor model, the scores of the three principal factors in factor analysis were converted into absolute principal factor scores, and then analyzed by multiple linear regression, respectively, to obtain the multiple linear regression equations on the six heavy metals, and the fitted values of the concentrations of each element could be obtained from the equations and compared with the measured values, the closer this value was to 1 indicating that the better the fitting degree of multiple linear regression [49,50]. The factor analysis results of heavy metals are shown in Table 3. After Varimax rotation, selecting the factor with characteristic value greater than 1, the three factors cumulatively explained 78.22%. It was inferred that there were three main sources of heavy metal pollution.
According to the results of reference PMF and Unmix models, these three factors represent traffic source, coal-burning source, and industrial source, respectively. The proportion of different pollution factors could be seen in Figure 6. Factor 3 (44.18%) accounts for the highest proportion, followed by factor 1 (41.75%) and factor 2 (14.07%). After the Varimax rotation method, the coefficients of the factor matrix (Table 3), and factor 1 (traffic source) explained 30.01% of the total factor score, with a large load on Cr, Ni, and Pb, and the load decreased in turn; factor 2 (coal-fired source) explained 27.60% of the whole, with high loading on As and Cu, and the load decreased in turn; factor 3 (industrial source) explained 20.61% of the whole, with a large load on Zn, and the load was much higher than other elements.

4.3.4. Comparison of Three Receptor Models

In this study, we compared the fitting degree of the three models as well as R2 to determine their advantages and disadvantages. The fitting degree of the predictive value and the measured value (P/M) were considered the fitting degree of the models. The regression coefficient and residual value were the common parameters used to estimate the fitting goodness of the model. The closer the R2 value and slope of the former were to 1, the closer the intercept was to 0, and the better the fitting effect; while the closer the mean value of the latter was to 0, the smaller the range was, the better the fitting effect was. The relevant results of the model were shown in the following Table 4.
The fitting effect of Pb in the Unmix model was far lower than in other models (R2 = 0.35 and P/M = 0.60), the R2 of Pb was as high as 0.77 and 0.78 in PMF and APCS-MLR, respectively. The PMF and APCS-MLR models were therefore more persuasive for the source apportionment results of Pb. In the PMF model, the fitting effect of each heavy metal was good, the R2 of the remaining elements except Ni was more than 0.60, and the P/M of all elements was more than 0.70, of which the R2 value of As was as high as 0.99. In the APCS-MLR model, the R2 of the six heavy metals was above 0.70, both P/M values were 1.00, indicating that the operation range error of the model was small, the predictive value was basically consistent with the actual value, and the analysis results of each heavy metal in the model have good accuracy.
In summary, although the PMF, Unmix, and APCS-MLR receptor models were operated with different algorithms and mechanisms, the results were more consistent in the study area, and the analysis results could validate each other. The three source apportionment models were used in this study concluded that metal elements in wet deposition in Handan affected by anthropogenic impacts such as industry, traffic, and coal combustion, and were basically consistent with the soil, PM2.5, and dry deposition results studied by Cai et al. [51,52,53,54]. Compared with the results of source apportionment in this study, the APCS-MLR model had a better fitting degree, the fitting effect was more prominent when explaining individual elements, which could more accurately explain the source category and contribution of heavy metals in the study area, this model is more suitable for the study of wet deposition.

4.4. Air Pellet Backward Trace

Air mass transport could bring pollutants or clean air to the local area, affecting the local wet deposition and wet deposition chemical composition [55]. In this study, a backward trajectory model (Meteoinfo) was used to analyze the trajectory of wet deposition clouds at 500 m height for 48 h in 25 wet depositions fields in Handan during 2018 to 2019 (Figure 7). Combined with the backward trajectory of the air mass, it could be seen that the wet deposition air mass in Handan in this year mainly came from the southwest direction, the wet deposition times reached 14 times, and the wet deposition reached 1207.57 mm, accounting for 54.35% of the total; the wet deposition brought about by the northwest and northeast air masses for Handan was relatively small, 627.89 mm and 386.38 mm, respectively, accounting for 28.26% and 17.39% of the total wet deposition. The clouds in the northeast direction mainly came from Inner Mongolia, through Beijing, Langfang, and other places; the two clouds in the northwest direction pass through Shanxi Province, and pass through Taiyuan, Jinzhong and other areas; the southwest clouds mainly came from Changzhi City, Shanxi Province. Through the analysis of the air mass trajectory in the southwest direction, it was found that the air mass operation trajectory operation path was short, indicating that Handan was mainly controlled by the short-distance transport air mass in the inner and southern regions of Shanxi Province. Combined with the topographic analysis of Shanxi Province, the Taihang Mountains are distributed in the east, most of which were above 1200 m above sea levels, and there was a block of Luliang Mountains in the west, most of which were above 1000 m above sea level, and the city was an energy heavy chemical base in China, with coal power, coking, metallurgy as the main industries, which contributes greatly to the metal Zn, Cr and As in the air mass; there were large thermal power plants in Jinzhong and Changzhi, such as Yangcheng Power Plant and Zhangze Power Plant, which contribute greatly to the metal Ni, Cu and Pb in the air mass [56].

5. Conclusions

(1)
The mean concentrations of Zn, Cr, Pb, Cu, Ni, and As in wet deposition were 29.53, 14.11, 9.18, 7.03, 6.41, and 1.21 μg·L−1, respectively. The concentration of elements in different functional areas varied, indicating that human activity was one of the main reasons affecting the concentration of different heavy metals in wet deposition.
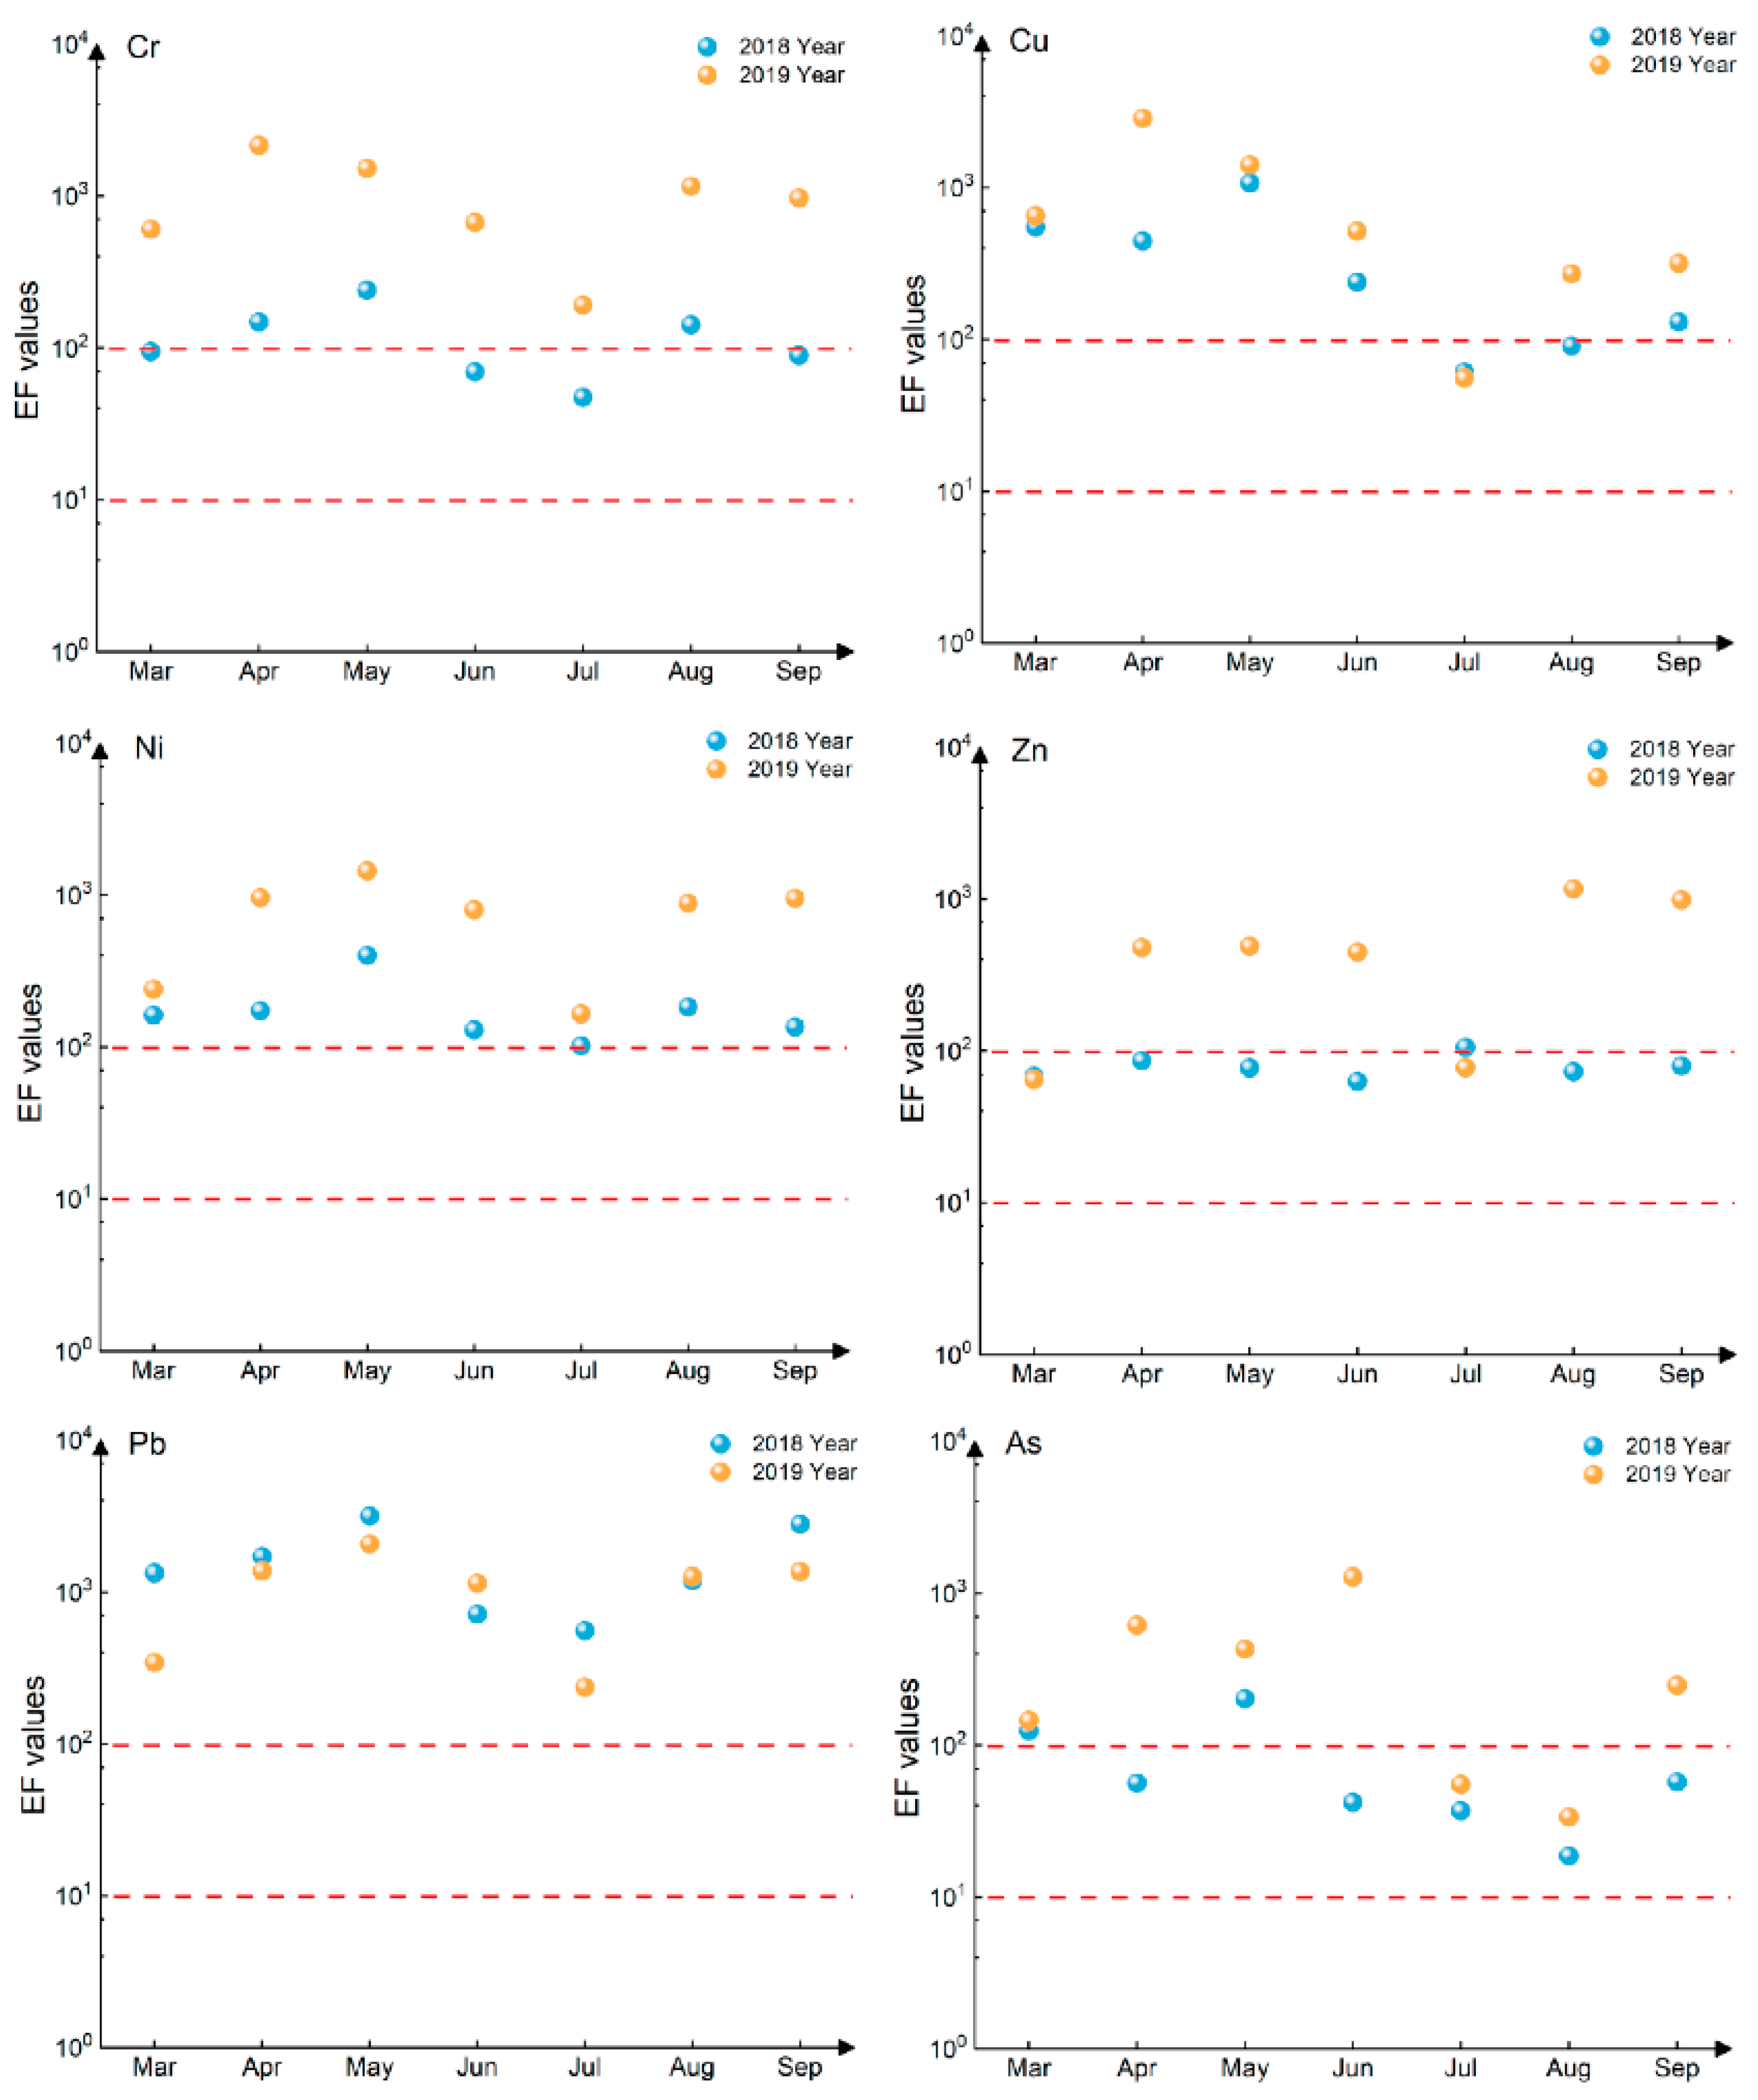
(2)
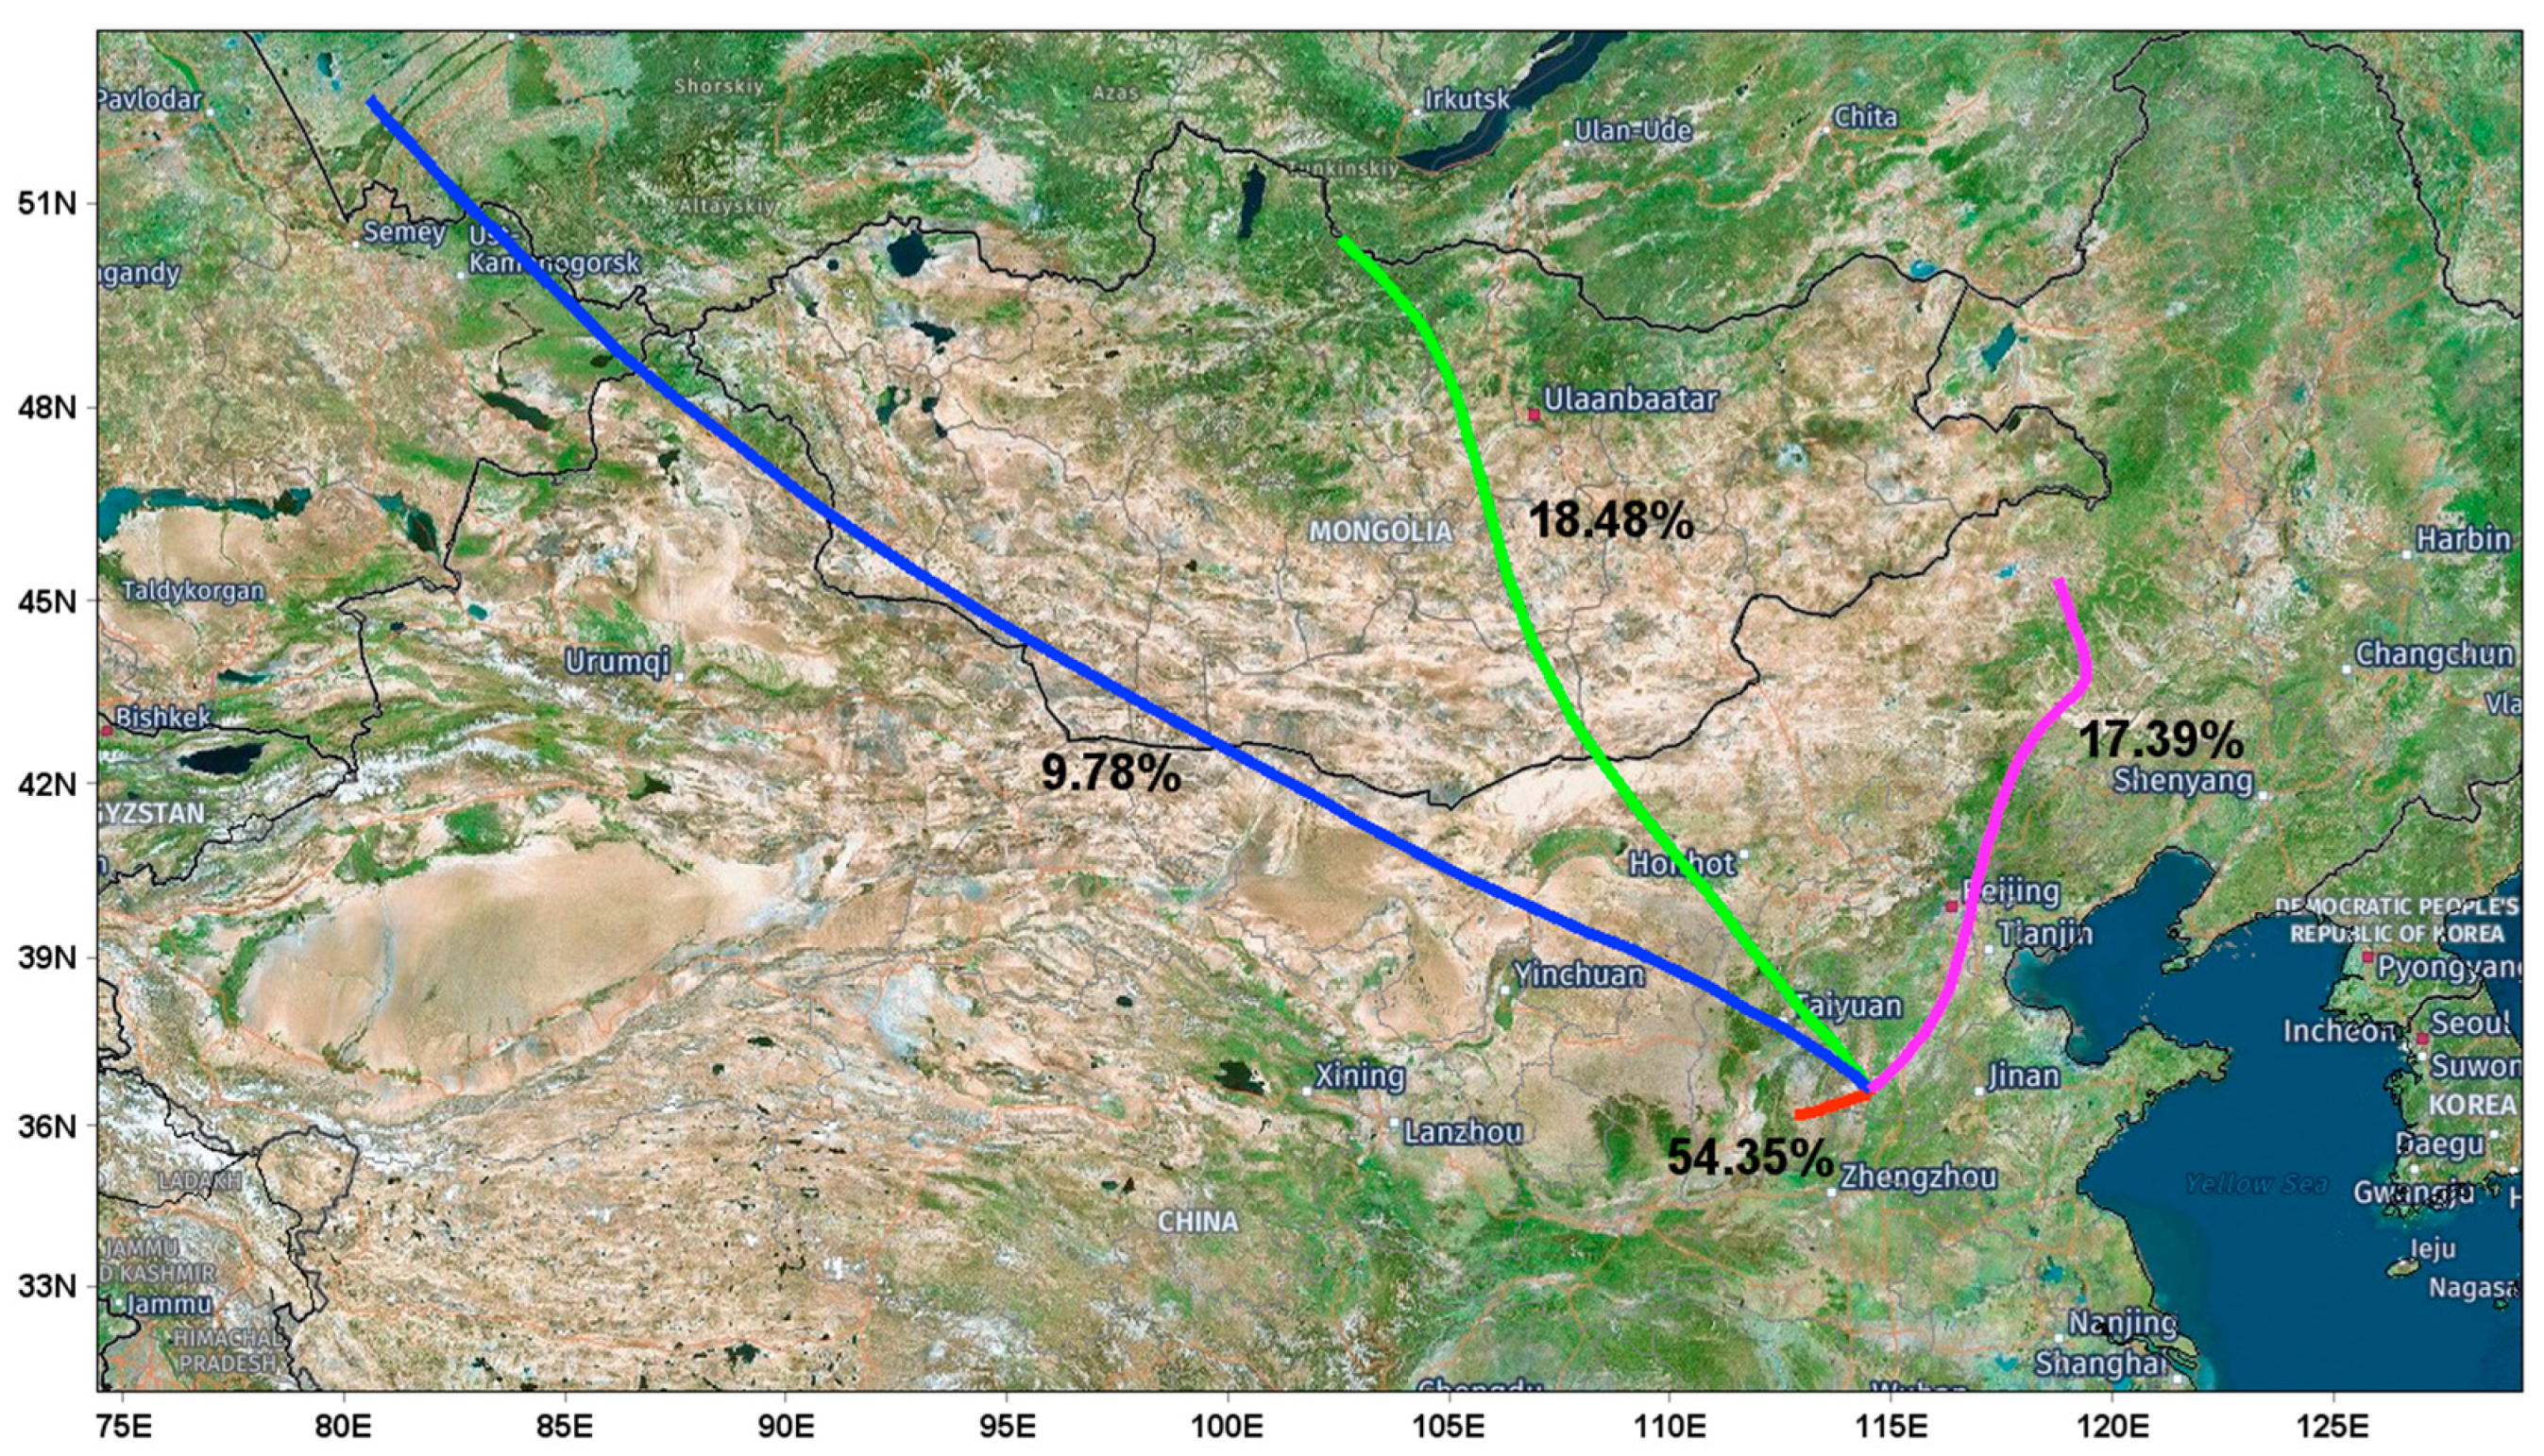
In this study, the EFs of the six heavy metals were above 10, and Pb and Zn were above 100, and the highest values were even above 1000, which were greatly affected by anthropogenic activities and showed moderate enrichment and high enrichment characteristics. In addition, according to the backward trajectory analysis, the wet deposition in Handan was mainly affected by the gas mass from the southwest direction. The coking and power industrial areas through which the gas mass trajectory passed had a greater impact on the wet deposition of heavy metals, the joint prevention and control of the area should be the main improvement measure for the heavy metal pollution of wet deposition in the future, while requiring all regions to strictly implement the emission limit requirements of air pollutants.
(3)
By comparing the analytical results of PMF, Unmix, and APCS-MLR multiple receptor models, the analytical results of the three models confirm each other and have a good consistency. In particular, the APCS-MLR model had better analysis results, and its fitting degree and applicability were better than other models, which was more suitable for source analysis of heavy metals in wet deposition in this study.
In this study, multiple models were used for comparison, and more suitable models for the case area were selected to ensure the scientificity and rationality of the results, with specific characteristics and applications. In the future study, we will select more elements and models to analyze and compare, so that the source assignment is more objective.

Author Contributions

Conceptualization, Z.Z. and H.Z. (Haixia Zhang); methodology, Z.Z.; software, Z.Z., H.Z. (Hui Zhao) and R.L.; validation, Z.Z.; formal analysis, Z.Z.; investigation, H.Z. (Haixia Zhang) and A.C.; re-sources, H.Z. (Hui Zhao), H.Z. (Haixia Zhang) and Q.W.; data curation, Z.Z.; writing—original draft preparation, Z.Z.; writing—review and editing, H.Z. (Haixia Zhang), A.C. and Q.W.; visualization, Z.Z. and B.L.; supervision, H.Z. (Haixia Zhang), R.L. and X.W.; project administration, H.Z. (Hui Zhao); funding acquisition, Q.W. All authors have read and agreed to the published version of the manuscript.

Funding

This work was supported by the National Natural Science Foundation of China (42077393).

Institutional Review Board Statement

Not applicable.

Informed Consent Statement

Not applicable.

Data Availability Statement

The data presented in this study are available on request from the corresponding author. The data are not publicly available due to participants not having consented to the data being shared.

Acknowledgments

The authors wish to express thanks to the editors and anonymous reviewers for their positive comments and suggestions to improve the quality of this manuscript, and We are also very grateful to the Natural Science Foundation of China for its strong support.

Conflicts of Interest

The authors declare no conflict of interest.

References

  1. Zhao, J.; Hua, P.; Krebs, P. Influences of land use and antecedent dry-weather period on pollution level and ecological risk of heavy metals in road-deposited sediment. Environ. Pollut. 2017, 228, 158–168. [Google Scholar]
  2. Agnan, Y.; Séjalon-Delmas, N.; Probst, A. Comparing early twentieth century and present-day atmospheric pollution in SW France: A story of lichens. Environ. Pollut. 2013, 172, 139–148. [Google Scholar] [CrossRef] [PubMed] [Green Version]
  3. Jiang, W.Q.; Zhu, X.; Shen, J.L.; Huang, Z.T.; Gong, D.L.; Li, Y.; Wu, J.S. Atmospheric sulfur deposition in a paddy rice region in the hilly region in central China. China Environ. Sci. 2020, 40, 4848–4856. [Google Scholar]
  4. Vanessa, B.; Jane, K.W. Chemical and physical drivers of beryllium retention in two soil end members. Sci. Total Environ. 2020, 754, 141591. [Google Scholar]
  5. Li, K.F. Research on the Wet Cleaning Effect of air Pollution in BTH Region. Master’s Thesis, Nanjing University of Information Sience and Technology, Nanjing, China, 2018. [Google Scholar]
  6. Li, Y.M.; Pan, Y.P.; Wang, Y.S.; Wang, S.F.; Li, X.R. Chemical Characteristics and Sources of Trace Metals in wet deposition Collected from a Typical Industrial City in Northern China. Environ. Sci. 2012, 33, 3712–3717. [Google Scholar]
  7. Ross, H.B. Trace metals in wet deposition in Sweden. Water Air Soil Pollut. 1987, 36, 349–363. [Google Scholar] [CrossRef]
  8. Yang, Z.P.; Lu, W.X.; Long, Y.; Liu, X. Current situation of pH and wet deposition of heavy metals in wet deposition in Changchun City. China J. Jilin Univ. (Earth Sci. Ed.) 2009, 39, 887. [Google Scholar]
  9. Kara, M.; Dumanoglu, Y.; Altiok, H.; Elbir, T.; Odabasi, M.; Bayram, A. Seasonal and spatial variations of atmospheric trace elemental deposition in the Aliaga industrial region, Turkey. Atmos. Res. 2014, 149, 204–216. [Google Scholar] [CrossRef]
  10. Mijić, Z.; Stojić, A.; Perišić, M.; Rajšić, S.; Tasić, M.; Radenković, M.; Joksić, J. Seasonal variability and source apportionment of metals in the atmospheric deposition in Belgrade. Atmos. Environ. 2010, 44, 3630–3637. [Google Scholar] [CrossRef]
  11. Saleh, M.Q.; Hamad, Z.A.; Hama, J.R. Assessment of some heavy metals in crude oil workers from Kurdistan Region, northern Iraq. Environ. Monit. Assess. 2021, 193, 1–8. [Google Scholar] [CrossRef]
  12. Migon, C.; Journel, B.; Nicolas, E. Measurement of trace metal wet, dry and total atmospheric fluxes over the Ligurian Sea. Atmos. Environ. 1997, 31, 889–896. [Google Scholar] [CrossRef]
  13. Sakata, M.; Marumoto, K.; Narukawa, M.; Asakura, K. Regional variations in wet and dry deposition fluxes of trace elements in Japan. Atmos. Environ. 2006, 40, 521–531. [Google Scholar] [CrossRef]
  14. Pan, Y.P.; Wang, Y.S. Atmospheric wet and dry deposition of trace elements at 10 sites in Northern China. Atmos. Chem. Phys. 2015, 15, 951–972. [Google Scholar] [CrossRef] [Green Version]
  15. Wang, H.; Ma, N.; Yang, X.J.; Yang, K.M.; Han, G.L. Heavy metal characteristics of rain water in Chengdu. Earth Environ. 2010, 38, 49–53. [Google Scholar]
  16. Xu, H.L.; Li, D.Y.; Yang, J.; Zhang, X.; Zhu, L.L. Preliminary Study on Flux of Atmospheric Dry and Wet Deposition of Heavy Metal Elements in Yunmeng County, Hubei Province. Resour. Environ. Eng. 2015, 29, 816–821. [Google Scholar]
  17. Gong, X.Y.; Qi, S.; Su, Q. Atmospheric Deposition of Heavy Metals to Xinghua Bay, Fujian Province. Res. Environ. Sci. 2006, 19, 31–34. [Google Scholar]
  18. Pian, W. Individual Particle Characteristics of Depositional and Suspended Particles During the Haze Pollution in Handan City. Master’s Thesis, Hebei University of Engineering, Handan, China, 2016. [Google Scholar]
  19. Li, H.Y.; Zhang, Q.; Chen, C.R.; Wang, L.T.; Wei, Z.; Zhou, S.; Parworth, C.; Zheng, B.; Canonaco, F.; Prévôt, A.S.H.; et al. Wintertime aerosol chemistry and haze evolution in an extremely polluted city of the North China Plain: Significant contribution from coal and biomass combustion. Atmos. Chem. Phys. 2017, 17, 4751–4768. [Google Scholar] [CrossRef] [Green Version]
  20. Wu, D.; Liao, B.T.; Wu, M.; Chen, H.Z.; Wang, Y.C.; Liao, X.N.; Sun, D. The long-term trend of haze and fog days and the surface layer transport conditions under haze weather in North China. Acta Sci. Circumstantiae 2014, 34, 1–11. [Google Scholar]
  21. Xu, Y.X.; Li, X.M.; Yu, H.T. Characteristics of air pollution complex in Handan. Acta Sci. Circumstantiae 2015, 35, 2710–2722. [Google Scholar]
  22. China Statistics Press. Handan Statistics Bureau, 2012 Handan Statistical Yearbook; China Statistics Press: Beijing, China, 2012. [Google Scholar]
  23. China Statistics Press. Chinese Statistics Bureau, 2013 China Statistical Yearbook; China Statistics Press: Beijing, China, 2013. [Google Scholar]
  24. Lynam, M.M.; Dvonch, J.T.; Hall, N.L.; Morishita, M.; Barres, J.A. Trace elements and major ions in atmospheric wet and dry deposition across central Illinois, USA. Air Qual. Atmos. Health 2015, 8, 135–147. [Google Scholar] [CrossRef]
  25. Pathak, A.K.; Kumar, R.; Kumar, P.; Yaday, S. Sources apportionment and spatio-temporal changes in metal pollution in surface and sub-surface soils of a mixed type industrial area in India. J. Geochem. Explor. 2015, 159, 169–177. [Google Scholar] [CrossRef]
  26. Thurston, G.D.; Spengler, J.D. A quantitative assessment of source contributions to inhalable particulate matter pollution in metropolitan Boston. Atmos. Environ. 1985, 19, 9–25. [Google Scholar] [CrossRef]
  27. Paatero, P. Least squares formulation of robust non-negative factor analysis. Chemom. Intell. Lab. Syst. 1997, 37, 23–35. [Google Scholar] [CrossRef]
  28. Henry, R.C. Multivariate receptor modeling by N-dimensional edge detection. Chemom. Intell. Lab. Syst. 2003, 65, 179–189. [Google Scholar] [CrossRef]
  29. Wang, Y.Q. MeteoInfo: GIS software for meteorological data visualization and analysis. Meteorol. Appl. 2014, 21, 360–368. [Google Scholar] [CrossRef]
  30. Zoller, W.H.; Gladney, E.S.; Duce, R.A. Atmospheric concentrations and sources of trace metals at the South Pole. Science 1974, 183, 198–200. [Google Scholar] [CrossRef]
  31. China Environmental Monitoring Station. Background Value of Soil Elements in China; China Environmental Science Press: Beijing, China, 1990; pp. 334–379. [Google Scholar]
  32. Cai, A.Z.; Zhang, H.X.; Wang, X.J.; Wu, X.Q. Review on the Pollution Source Apportionment by Unmix Model and Application Prospect. Chin. J. Soil Sci. 2021, 52, 747–756. [Google Scholar]
  33. Cao, J.Y. Source Analysis and Pollution Loss Assessment of Heavy Metals in Farmland Soil Based on Unmix Model: A Case Study of a Town in South China. Master’s Thesis, China University of Geosciences, Beijing, China, 2019. [Google Scholar]
  34. Hopke, P.K. Recent developments in receptor modeling. J. Chemometr. 2003, 17, 255–265. [Google Scholar] [CrossRef]
  35. Paatero, P.; Tapper, U. Positive matrix factorization: A non-negative factor model with optimal utilization of error estimates of data values. Environmetrics 1994, 5, 111–126. [Google Scholar] [CrossRef]
  36. Rogge, W.F.; Hildemann, L.M.; Mazurek, M.A.; Cass, G.R.; Simoneit, B.R. Sources of fine organic aerosol. 3. Road dust, tire debris, and organometallic brake lining dust: Roads as sources and sinks. Environ. Sci. Technol. 1993, 27, 1892–1904. [Google Scholar] [CrossRef]
  37. China Statistics Press. Handan Statistics Bureau, 2019 Handan Statistical Yearbook; China Statistics Press: Beijing, China, 2019. [Google Scholar]
  38. Notice of the Handan Government on Issuing the Development Plan for the Fine Steel Industry of Handan City (2019–2025). March 2020. Available online: https://www.hd.gov.cn/hdzfxxgk/gszbm/auto23692/202003/t20200318_1254763.html (accessed on 6 June 2022).
  39. Qi, M.Y.; Wang, L.T.; Zhang, C.Y.; Ma, X.; Zhao, L.; Ji, S.P.; Lu, X.H.; Wang, Y. Variation of black carbon aerosol concentration and its influencing factors in Handan Cit, Hebei Province. Acta Sci. Circumstantiae 2018, 38, 1751–1758. [Google Scholar]
  40. Peng, Y.L.; Wang, Y.M.; Qin, C.Q.; Wang, D.Y. Concentrations and deposition fluxes of heavy metals in wet deposition in core urban areas, Chongqing. Environ. Sci. 2014, 35, 2490–2496. [Google Scholar]
  41. Lv, J.; Liu, Y. An integrated approach to identify quantitative sources and hazardous areas of heavy metals in soils. Sci. Total Environ. 2019, 646, 19–28. [Google Scholar] [CrossRef] [PubMed]
  42. Li, W.Q. Chemical Basis of Atmospheric Aerosol Pollution; Yellow River Water Conservancy Press: Zhengzhou, China, 2010; pp. 88–96. [Google Scholar]
  43. Wang, M.S.; Cao, J.L.; Li, H.; Gui, C.L.; Song, D.Y. Ecological risk assessment and source analysis of heavy metals in dust-fall in Jiaozuo City, China. Ecol. Environ. Sci. 2017, 26, 824–830. [Google Scholar]
  44. China Statistics Press. Handan Statistics Bureau, 2018 Handan Statistical Yearbook; China Statistics Press: Beijing, China, 2018. [Google Scholar]
  45. Cheng, K.; Wang, Y.; Tian, H.Z.; Gao, X.; Zhang, Y.X.; Wu, X.C.; Zhu, C.Y.; Gao, J.J. Atmospheric emission characteristics and control policies of five precedent-controlled toxic heavy metals from anthropogenic sources in China. Environ. Sci. Technol. 2015, 49, 1206–1214. [Google Scholar] [CrossRef]
  46. Ma, Y. Study on the Occupation Health Risk Assessment of Metallurgical Coking Toxic Substances. Master’s Thesis, Jilin University, Changchun, China, 2012. [Google Scholar]
  47. Manno, E.; Varrica, D.; Dongarra, G. Metal distribution in road dust samples collected in an urban area close to a petrochemical plant at Gela, Sicily. Atmos. Environ. 2006, 40, 5929–5941. [Google Scholar] [CrossRef]
  48. Das, A.; Kumar, R.; Patel, S.S.; Saha, M.C.; Guha, D. Source apportionment of potentially toxic elements in street dust of a coal mining area in Chhattisgarh, India, using multivariate and lead isotopic ratio analysis. Environ. Monit. Assess. 2020, 192, 396. [Google Scholar] [CrossRef]
  49. Yu, S.J. Analysis of Heavy Metal Pollution in Groundwater on the Lower Reaches of the Luanhe River Taking Iron Ions as an Example. Master’s Thesis, Hebei University of Geosciences, Shijiazhuang, China, 2019. [Google Scholar]
  50. Hingorani, R.; Jimenez-Relinque, E.; Grande, M.; Castillo, A.; Nevshupa, R.; Castellote, M. From analysis to decision: Revision of a multifactorial model for the in situ assessment of NOx abatement effectiveness of photocatalytic pavements. Chem. Eng. J. 2020, 402, 126250. [Google Scholar] [CrossRef]
  51. Cai, A.Z. Source Apportionment and Pollution Assessment of Heavy Metals in Industrial Area Soil in Handan. Master’s Thesis, Hebei University of Engineering, Hebei, China, 2022. [Google Scholar]
  52. Cai, A.Z.; Zhang, H.X.; Wang, L.T.; Wang, Q.; Wu, X.Q. Source apportionment and health risk assessment of heavy metals in PM2.5 in Handan: A typical heavily polluted city in north China. Atmosphere 2021, 12, 1232. [Google Scholar] [CrossRef]
  53. Zhang, H.X.; Cai, A.Z.; Wang, X.J.; Wang, L.T.; Wang, Q.; Wu, X.Q.; Ma, Y.Q. Risk assessment and source apportionment of heavy metals in soils from Handan city. Appl. Sci. 2021, 11, 9615. [Google Scholar] [CrossRef]
  54. Zhao, Y.W. Study on Characteristics of Atmospheric Dry and Wet Deposition and its Influence on Water Body in Handan. Master’s Thesis, Hebei University of Engineering, Hebei, China, 2019. [Google Scholar]
  55. Zhan, X.; Cui, Y.; Zhang, G.X.; He, Q.S.; Wang, X.M. Charateristics of polycyclic aromatic hydrocarbons in rainwater in Taiyuan. Environ. Chem. 2014, 33, 2144–2151. [Google Scholar]
  56. Ye, A.L.; Cheng, M.C.; Zhang, L.; He, Q.S.; Guo, L.L.; Wang, X.M. Characteristics and Sources of Dissolved Heavy Metals in Summer wet deposition of Taiyuan City, China. Environ. Sci. 2018, 39, 3075–3081. [Google Scholar]
Figure 1. Location of study area and distribution of sampling sites.
Atmosphere 13 01716 g001
Figure 2. Sampling time and sampling points precipitation: (a) 2018 sampling points precipitation; (b) 2019 sampling points precipitation.
Atmosphere 13 01716 g002
Figure 3. EFs of heavy metals for wet deposition samples from March to September.
Atmosphere 13 01716 g003
Figure 4. Factor profiles and source apportionment of heavy metals by PMF model.
Atmosphere 13 01716 g004
Figure 5. Contribution rate of different sources by Unmix model.
Atmosphere 13 01716 g005
Figure 6. The proportion of different pollution factors by APCS-MLR.
Atmosphere 13 01716 g006
Figure 7. Forty-eight-hour air mass backward trajectories for wet deposition in Handan City.
Atmosphere 13 01716 g007
Table 1. Enrichment degree classification and contamination source.
Pollution DegreeEnrichment DegreeEF ValuesContamination Source
IMild<10Natural
Moderate10–100Anthropogenic and Natural
Severe>100Anthropogenic
Table 2. Concentration of metal elements in wet deposition at different sampling points.
ElementsHigh ParishLiving AreaIndustrial AreaMean Value
Cr (μg·L−1)16.74 ± 20.1315.16 ± 16.9810.45 ± 9.8714.11 ± 3.27
Cu (μg·L−1)7.13 ± 7.536.49 ± 6.417.48 ± 7.497.03± 0.50
Ni (μg·L−1)6.65 ± 2.916.18 ± 3.136.39 ± 3.696.41± 0.24
Zn (μg·L−1)28.53 ± 18.9927.22 ± 17.8132.83 ± 35.4629.53 ± 2.93
Pb (μg·L−1)9.89 ± 11.219.03 ± 7.248.61 ± 6.969.18 ± 0.65
As (μg·L−1)1.17 ± 1.231.33 ± 1.411.12 ± 1.331.21 ± 0.11
Note: Data shown in the table is mean ± standard deviation.
Table 3. Factor analysis result by APCS-MLR.
SpeciesFactorRotation Matrix of Factor
123123
Cr0.7240.355−0.2990.7630.348−0.192
Cu0.776−0.4080.0930.2880.720.419
Ni0.8100.3010.1970.8010.2330.300
Zn0.243−0.3020.874−0.008−0.0070.956
Pb0.1460.8500.1890.694−0.543−0.057
As0.566−0.416−0.4520.1160.817−0.131
Characteristic value2.1831.3691.4141.8001.6561.237
Total variance explained (%)36.3922.8219.0130.0127.6020.61
Table 4. Comparison of fitting degree of three receptor models.
ElementsMeasured Value
(μg/L)
Predictive Value
(μg/L)
UnmixPredictive Value
(μg/L)
PMFPredictive Value
(μg/L)
APCS-MLR
R2P/MR2P/MR2P/M
Cr14.1111.690.870.8310.130.700.7214.110.741.00
Cu7.0354.7260.690.675.6190.670.807.0350.781.00
Ni6.4076.3290.580.995.5400.540.866.4070.791.00
Zn29.5217.800.580.6125.520.770.8629.520.911.00
Pb9.1745.4800.350.608.1660.770.899.1740.781.00
As1.2060.8330.590.691.1900.990.991.2060.701.00
Publisher’s Note: MDPI stays neutral with regard to jurisdictional claims in published maps and institutional affiliations.

