Article

The Effect of Sea Surface Temperature on Relative Humidity and Atmospheric Visibility of a Winter Sea Fog Event over the Yellow-Bohai Sea

1
Tianjin Key Laboratory for Oceanic Meteorology, Tianjin Meteorological Bureau, Tianjin 300074, China
2
Tianjin Institute of Meteorological Science, Tianjin 300074, China
*
Author to whom correspondence should be addressed.
Atmosphere 2022, 13(10), 1718; https://doi.org/10.3390/atmos13101718
Submission received: 28 August 2022 / Revised: 11 October 2022 / Accepted: 12 October 2022 / Published: 19 October 2022
(This article belongs to the Section Biosphere/Hydrosphere/Land–Atmosphere Interactions)

Abstract

:
Sea fog is one of the main types of dangerous weather affecting offshore operations. The sea surface temperature (SST) has an important influence on the water vapor content and intensity of sea fog. In order to study the impact of SST on local relative humidity and atmospheric visibility, a sea fog episode that occurred over the Yellow Sea and Bohai Sea on 21 January 2013 was investigated through observational data, reanalysis data, and Weather Research and Forecasting (WRF) simulation. The results show that the influence of SST on the distribution of sea fog with different properties is inconsistent. Based on the time-varying equation of relative humidity, the changes in the advection, radiation, and turbulence effects on the relative humidity with respect to SST are explored through control and sensitivity experiments. The results show that the advection effect plays a decisive role in the generation and dissipation stages of sea fog. The increase (decrease) in SST weakens (strengthens) the radiative cooling and relative humidity. The contribution magnitude of advection effect to relative humidity is 10−5, while those of radiation and turbulence are 10−6 and 10−7, respectively. The atmospheric visibilities in the Bohai Sea and northern Yellow Sea decrease with increasing SST, which are mainly affected by the positive turbulence effect; whereas the atmospheric visibility in the central and southern Yellow Sea increases with SST, which is mainly influenced by the combined effects of U-direction advection, radiation, and turbulence. The stability related to boundary layer height plays an important role in water vapor condensation.

1. Introduction

Sea fog is one kind of weather phenomenon that widely occurs over oceans and coastal regions, wherein tiny water droplets sustained in the atmospheric boundary layer lead to low atmospheric visibility (<1 km) [1]. Many scholars have long noticed the influence of sea surface temperature (SST) anomalies on the atmospheric circulation pattern and weather phenomena [2]; in addition, the importance of SST to sea fog generation cannot be ignored [3,4]. In a brief review of sea fog research in China, Fu et al. [5] concluded that sea fog is highly sensitive to SST. Both mixed fog and advection fog are greatly affected by SST [6]. The local SST is a key driver of the interannual variation in summertime sea fog [7]. The occurrence frequency and spatial distribution of sea fog are associated with a difference in air–sea temperature [8,9,10,11], which was supported by observational evidence in Bohai [12]. Qu et al. [13] showed that the SST difference could affect the value and location distribution of liquid water content in foggy areas. In addition, the variation trends of dense sea fog with respect to SST are inconsistent with those of thin sea fog [14]. Hee et al. [15] compared the variation in autumntime sea fog between different coastal waters. However, the above studies mainly focused on the effects of SST on sea fog distribution, while the mechanism of SST influence on sea fog needs to be further investigated.
The influence mechanism on sea fog from the perspective of advection, turbulence, and radiation has been explored [16,17]. Li et al. [18] found that the moisture originates from the advection, and the turbulence in the lower atmosphere promotes fog formation and evolution. Gao et al. [19] simulated a real advection cooling fog in the Yellow Sea and pointed out that the turbulent near-sea-surface mixing and cooling were the primary mechanisms of fog formation. Long-wave radiation cooling at the top of the fog and near-sea-surface buoyancy turbulence are equally important [20,21,22]. Yun et al. [23] classified and discussed the turbulence characteristics related to the formation of cold and warm fog. Yang et al. [24] emphasized the importance of long-wave radiation cooling on advection fog top. Yang et al. [25] noted that turbulent mixing caused by fog top radiation and evaporative cooling is crucial to the development of fog. However, there is a lack of understanding of the trends in the advection, turbulence, and radiation regimes with respect to SST.
Temperature change has an important impact on humidity. For example, Zhu et al. [26] considered that warmer air was able to hold more humidity. The influence of SST variation on relative humidity also needs to be studied. Considering that the formation process of sea fog is essentially the result of water vapor saturation and condensation by increasing the relative humidity of the air through cooling or humidification, Hu et al. [27] attributed the effects of advection, turbulence, and radiation on the formation process of sea fog to their effects on relative humidity through the time-varying equation of relative humidity. The advantage of this method is that the covariance of relative humidity makes the effects comparable in analyzing the differences in and interactions of these effects in the generation process of sea fog, which helps to explore the physical mechanism of sea fog formation. However, in the theoretical analysis of the three effects, the relative humidity change rate was calculated from the climate state value, the source–sink terms of temperature and humidity were simplified, and the two-dimensional idealized numerical simulation experiment was adopted. With an improved numerical simulation model, the influence of SST change on the above three effects can be further explored through three-dimensional numerical model experiments.
Thus, we performed a set of control and sensitive experiments using the three-dimensional numerical prediction model, and the effects of SST variation on horizontal atmospheric visibility and the vertical distribution characteristics of the three effects were identified during the generation, maintenance, and dissipation of sea fog.
Our modeling design and theoretical basis are provided in the following section, Section 3 gives results and discussion, and the conclusions are given in Section 4.

2. Material and Methods

2.1. Study Area

In this study, a sea fog process in the Yellow Sea and Bohai Sea on 21 January 2013 was selected. To carefully analyze the evolution process of this sea fog case, the Weather Research and Forecasting (WRF) model was employed. Figure 1 shows the main simulation area with 3 km resolution, the buoy observation stations, and two key regions for analyzing the differences in sea fog formation and evolution mechanism.

2.2. Data and Methods

The NCEP final operational global 6-hourly analysis data (FNL, 1° × 1°) and the real-time global daily sea surface temperature (RTG_SST_HR, 0.083° × 0.083°) were used for the initial field of Weather Research and model (WRF) Forecasting. The FNL data were available four times per day at 00, 06, 12 and 18 UTC, and were downloaded from http://dss.ucar.edu/datasets/ds083.2 accessed on 01 June 2021. The RTG_SST_HR are daily average data and can be downloaded from ftp://polar.ncep.noaa.gov/history/sst/ accessed on 16 July 2020.
The FNL data and buoy observation data (No. 54646 and 58573) were used for analysis and verification of simulation results.

2.2.1. Modeling and Experimental Design of Sea Fog Simulation

In our study, the simulation period was from 00 UTC 21 January to 00 UTC 23 January 2013. Two domains with two-way nest interaction were designed with the outer range of 9–49° N, 98–155° E and inner range of 26–47° N, 112–131° E. The two domains had grid numbers of 484 × 445 and 478 × 730 at horizontal resolutions of 9 and 3 km, respectively. The domain had 35 unevenly spaced full-sigma levels in the vertical resolution (8 levels below 850 hPa), and identical physical options applied to both domains. The parameterization schemes mainly included the WSM6 scheme [28] for microphysical process, YSU scheme [29] for planetary boundary layer, and RRTM [30] and Dudhia schemes [31] for long- and short-wave radiation schemes, respectively.
The control simulation and two sensitivity experiments were used to simulate the variation in atmospheric visibility with SST during the sea fog event (Table 1). The RTG_SST_HR and FNL data were used in the control experiment. For the model, the ocean underlying surface was provided by the former while the background field was provided by the latter for the model.

2.2.2. Time-Varying Equation of Relative Humidity

On the basis of the time-varying equation of relative humidity [32], the effects of advection, turbulence, and radiation can be analyzed. The time-varying equations of relative humidity are as follows:
ln f t = u ln f x ω ln f z + z ( k ln f z ) + M 1 + M 2 + M 3
M 1 = L R v T 2 ( T t ) r a d
M 2 = ( 1 ε 2 ) [ ln P t + u ln P x + ω ln P z z ( k ln P z ) ]
M 3 = k { ( ln q z ) L R v T [ ( ln θ z ) 2 + ( ln T z ) 2 ] }
where f is the relative humidity; u is the horizontal wind speed; ω is the vertical wind speed; k is the turbulent exchange coefficient, k = 1 m2 s−1;   T is the air and sea temperature; P is the pressure;   q is the specific humidity;   θ is the virtual potential temperature of the air; R v is the gas constant of water vapor ratio; ( T t ) r a d is the rate of temperature change due to radiation;   L = 2500.7 J g−1. On the right side of the equation, the first three terms are horizontal advection, convection, and turbulent diffusion. The last three terms ( M 1 + M 2 + M 3 ) can be regarded as the “source and sink” of the logarithm of relative humidity ( ln f ), in which M 1 , M 2 , and M 3 are the radiation term, air pressure term, and interaction term between temperature and humidity, respectively.
In this study, the contributions of the three effects of advection (the first and second terms on the right side of the equation), turbulence (the third and sixth terms on the right side of the equation), and radiation (the fourth term on the right side of the equation) with respect to relative humidity were separately analyzed based on the time-varying equation of relative humidity. A vertical hierarchical analysis of the three effects was also performed to obtain the variation characteristics of the three effects with SST during sea fog.

2.2.3. Atmospheric Visibility Method

Atmospheric visibility related to the extinction coefficient is an important physical quantity for identifying foggy areas. SST anomalies also affect the change in extinction coefficient [33]. The atmospheric visibility can be generated according to the atmospheric visibility calculation formula established by Kunkel [34] and Stoelinga et al. [35]:
X vis = ln 0.02 β
β = β c w + β c i + β s n o w + β r a i n
where X vis is the horizontal atmospheric visibility; the extinction coefficient β includes the effects from cloud water ( β c w ), cloud ice ( β c i ), snow ( β s n o w ), and rain water ( β r a i n ).

3. Results

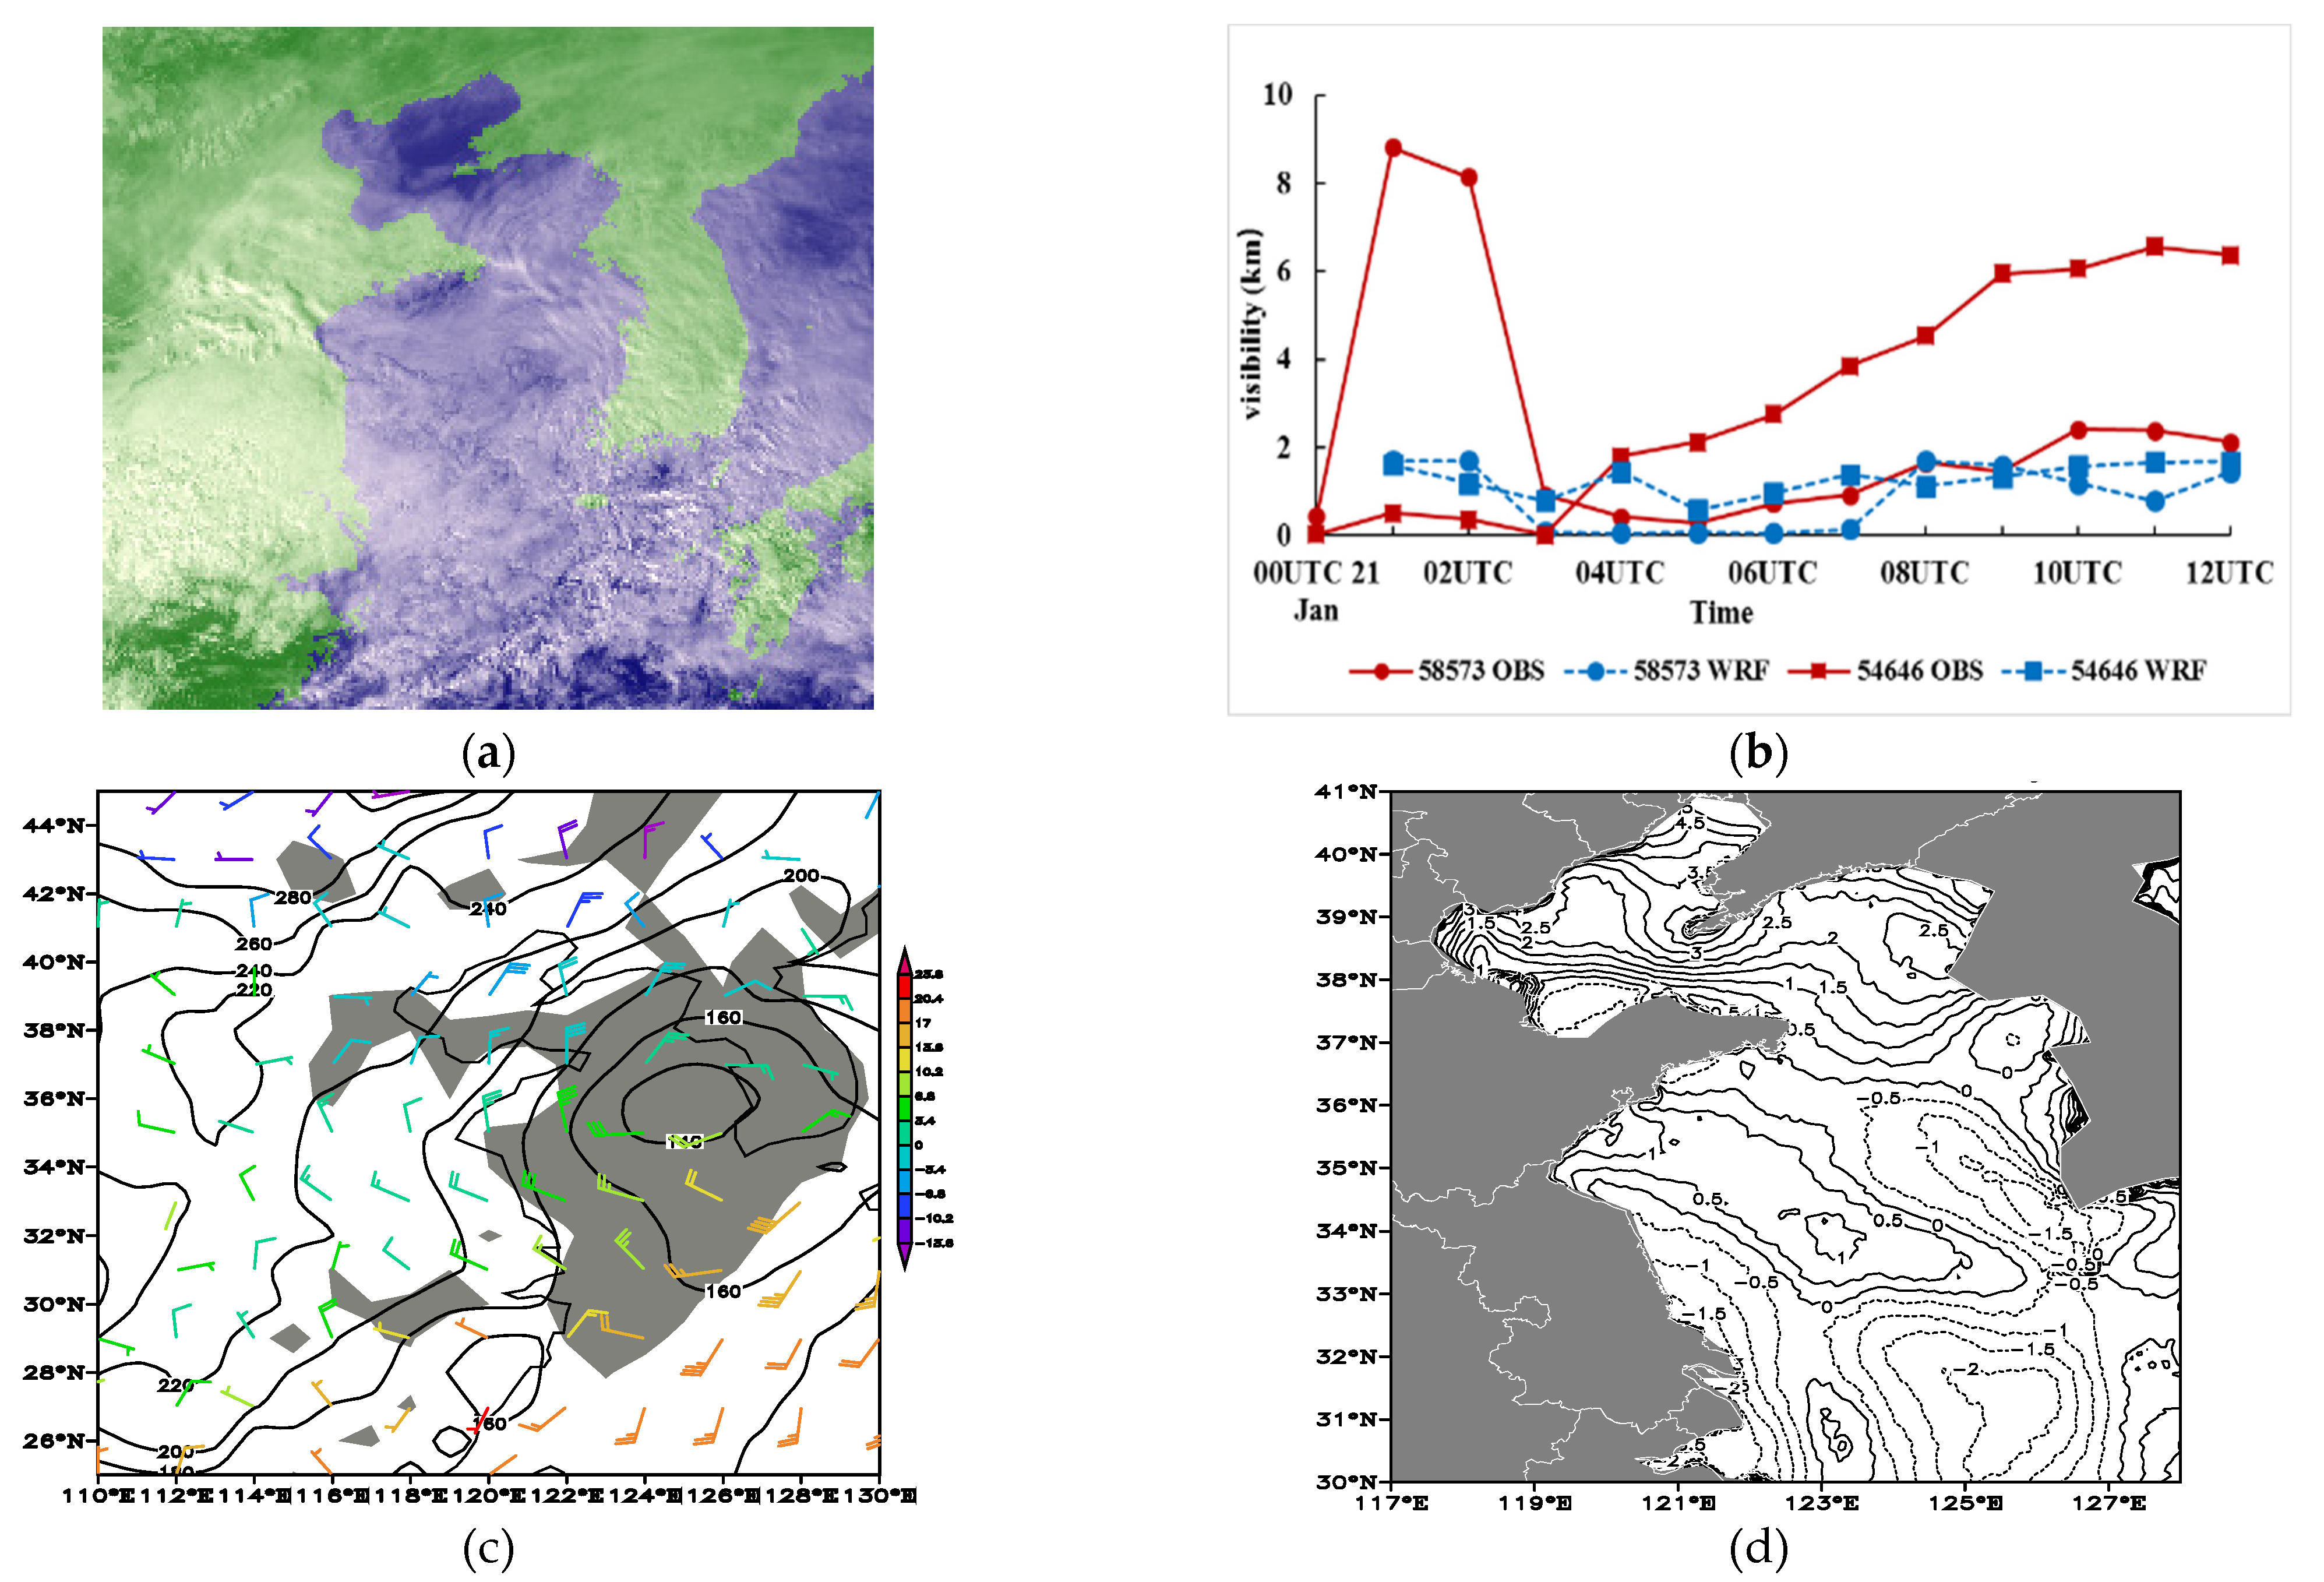
3.1. Observational Analysis and Comparison between Simulation and Observation

The sea fog process was characterized by a short duration, complex weather conditions, and a large distribution.
Throughout most of this fog event, high clouds were present; thus, it was difficult to detect the fog using satellite data (Figure 2a). However, in the Yellow Sea and Bohai Sea region, some stratus clouds are stable and less moving, and low visibility is observed with ground observations (Figure 2b). Sea fog was observed at station 58573 (29.75° N, 122.75° E) at about 03 UTC, and dense fog was observed at station 54646 (38.45° N, 118.44° E) at 00 UTC, which then turned to light fog at 04 UTC.
At 06 UTC 21 January 2013, the southern and central Yellow Sea, which was in front of the trough on the 850 hPa level, was controlled by the warm advection. Warm advection can bring abundant water vapor to a region [36]. The Bohai Sea and northern Yellow Sea were located behind the trough. On the ground level, the Bohai Sea and the northern Yellow Sea were located in front of the cold high pressure, which brought weak cold air (Figure 2c). The wind speed on the sea surface decreased to 4 m s−1, which was favorable to the stability of the sea surface stratification. At the same time, relative humidity in most areas of the Yellow and Bohai Seas reached more than 90%. In the maintenance period of sea fog, it was controlled by two weather systems. One was controlled by the front of cold high pressure in the Bohai Sea and the northern Yellow Sea, and the other was controlled by warm advection in the front of low pressure in the central and southern Yellow Sea.
The sea–air temperature difference in the northern Yellow Sea was positive (Figure 2d), and this situation promoted the formation of sea fog due to the humidification of sea surface evaporation. On the contrary, the SST difference in the south-central Yellow Sea was mainly negative, and the cooling and condensation effect of the sea temperature on the sea fog maintained the development of sea fog. Thus, it could be concluded that SST played different roles in the development of sea fog in different regions of the Yellow Sea and Bohai Sea.
From the viewpoint of weather conditions and SST difference, it was relatively complex in the whole sea fog area. Radiation fog occurred over the Bohai Sea and the northern Yellow Sea, and advection fog was observed over the central and southern Yellow Sea.
The WRF simulation results were interpolated using those from the observation station. The comparison between observational and simulation results showed that the WRF model could simulate the sea fog phenomenon. For station 58573, although the simulation results failed to reproduce the visibility values about 8–9 km in the first three hours, the variation trend in the simulated visibility showed a sharp change in visibility at 3–4 h, which was similar to the observed data. The simulation results were generally reliable. For station 54646, the model could simulate the low visibility in the first three hours. After 4 h, the observation turned to higher atmospheric visibility (light fog), while the density of simulated sea fog was relatively strong. Station 58573 was located in the Yellow Sea area, and the simulation results were relatively good. Station 54646 was located in the Bohai Sea area, and the simulation results of visibility were relatively low. Based on the simulation results, the Yellow Sea area was selected as the main study area for the subsequent discussion.

3.2. Atmospheric Visibility Simulation Results

The simulated fog patches were identified as the atmospheric visibility (<1 km). Based on the control experiment result, the sea fog was distributed in the Laizhou Bay of the Bohai Sea, the north of the Yellow Sea, the south of Shandong Peninsula, and the middle and southern parts of the Yellow Sea (Figure 3a). The simulated sea fog range during the sensitivity experiments changed with the variation in SST (Figure 3b,c). When the SST increased/decreased by 2 °C, the atmospheric visibility in the Bohai Sea and the northern Yellow Sea region decreased/increased based on the difference between Exp. 2 and Exp. 1; the atmospheric visibility changes in the central and southern Yellow Sea region were reversed.

4. Discussion

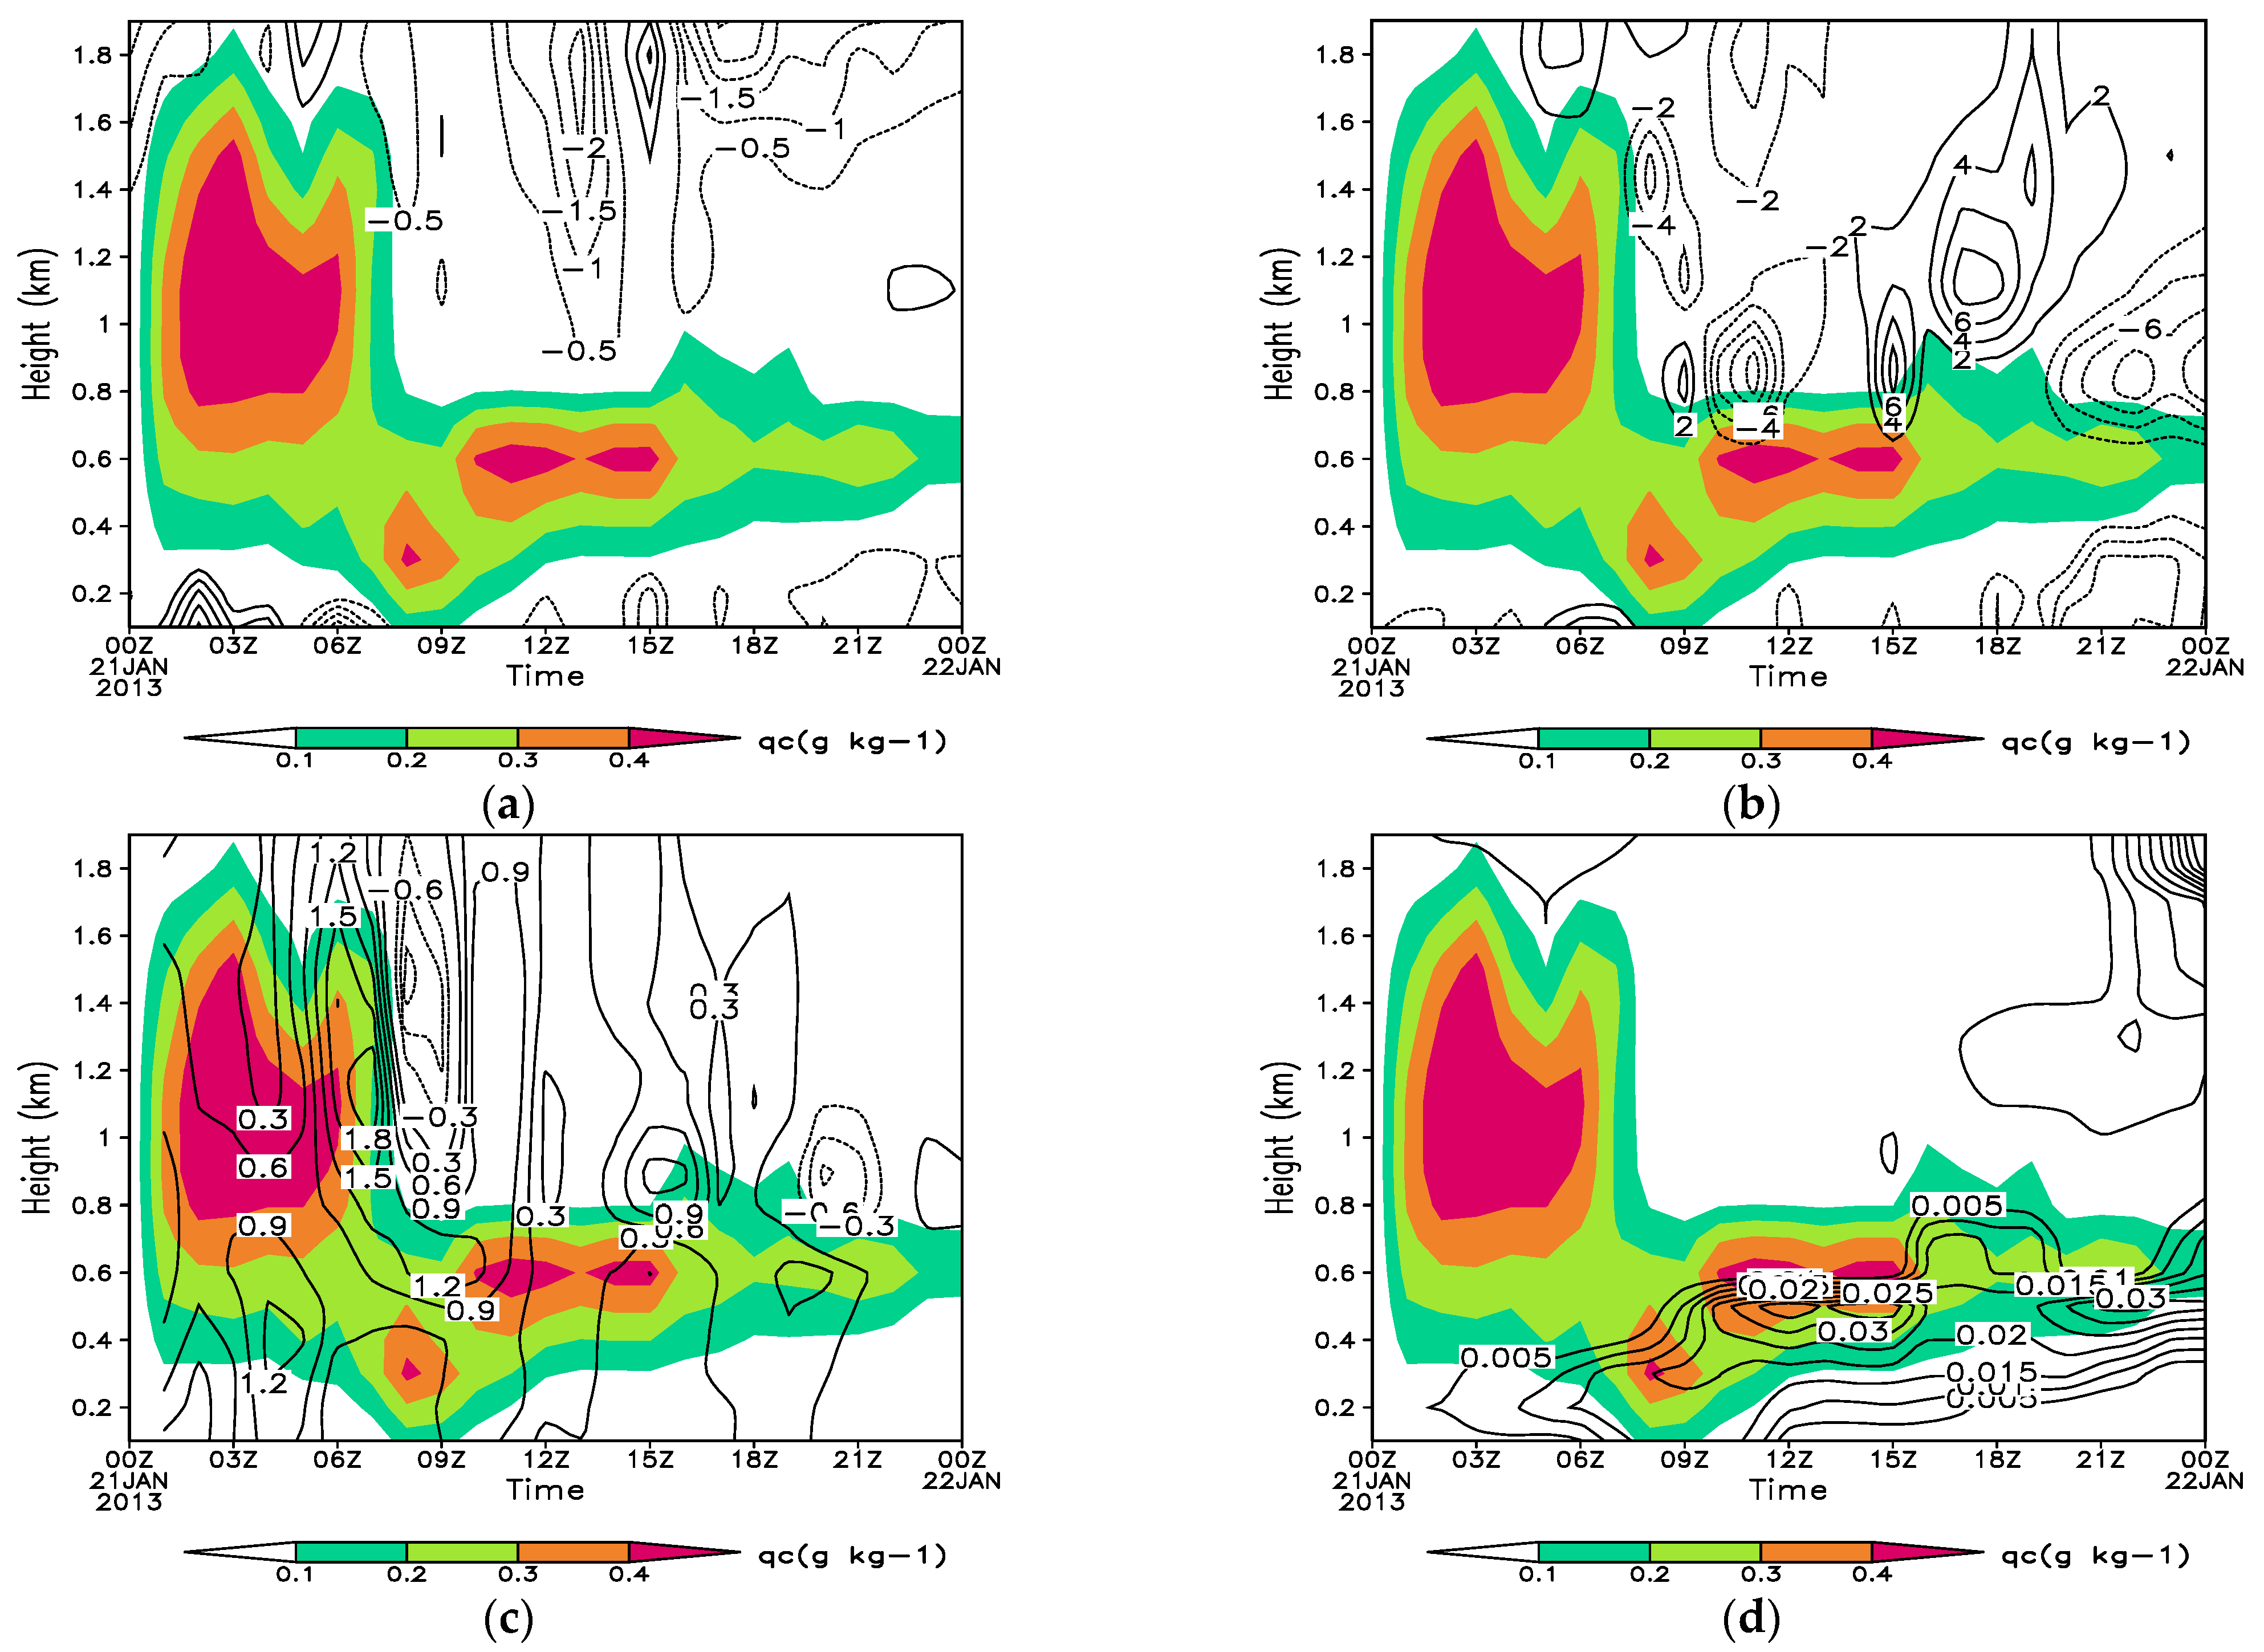
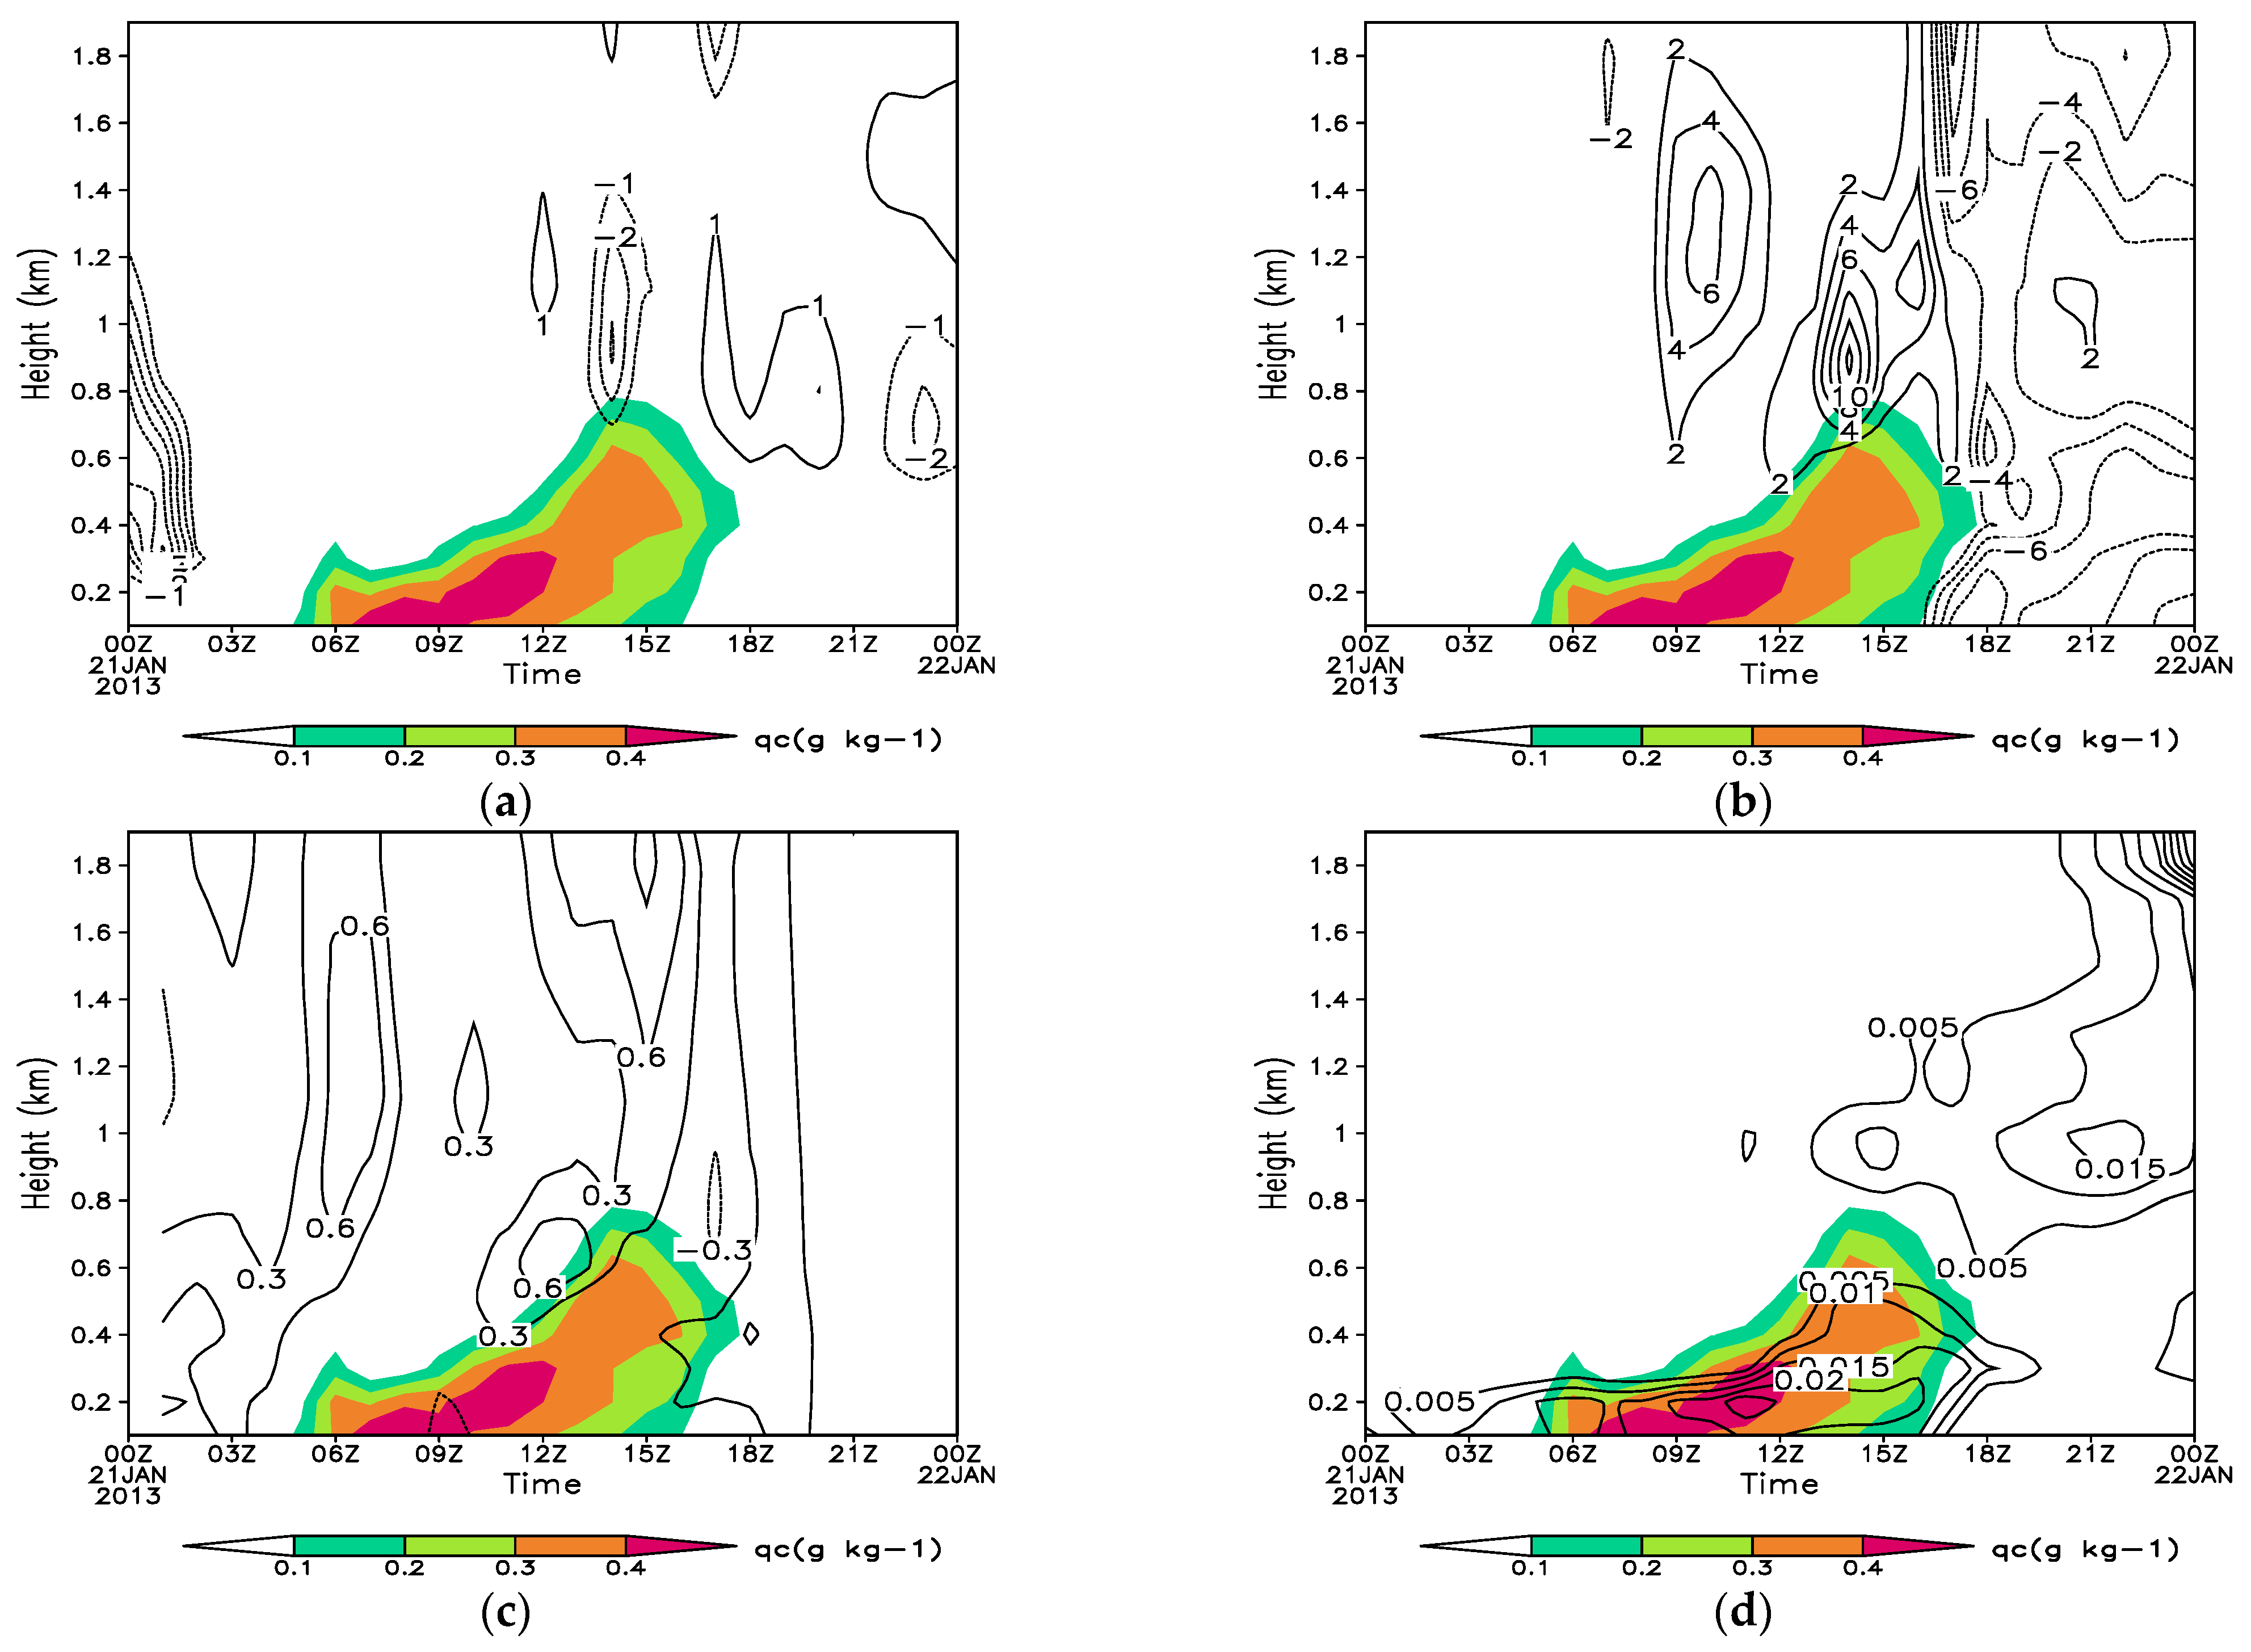
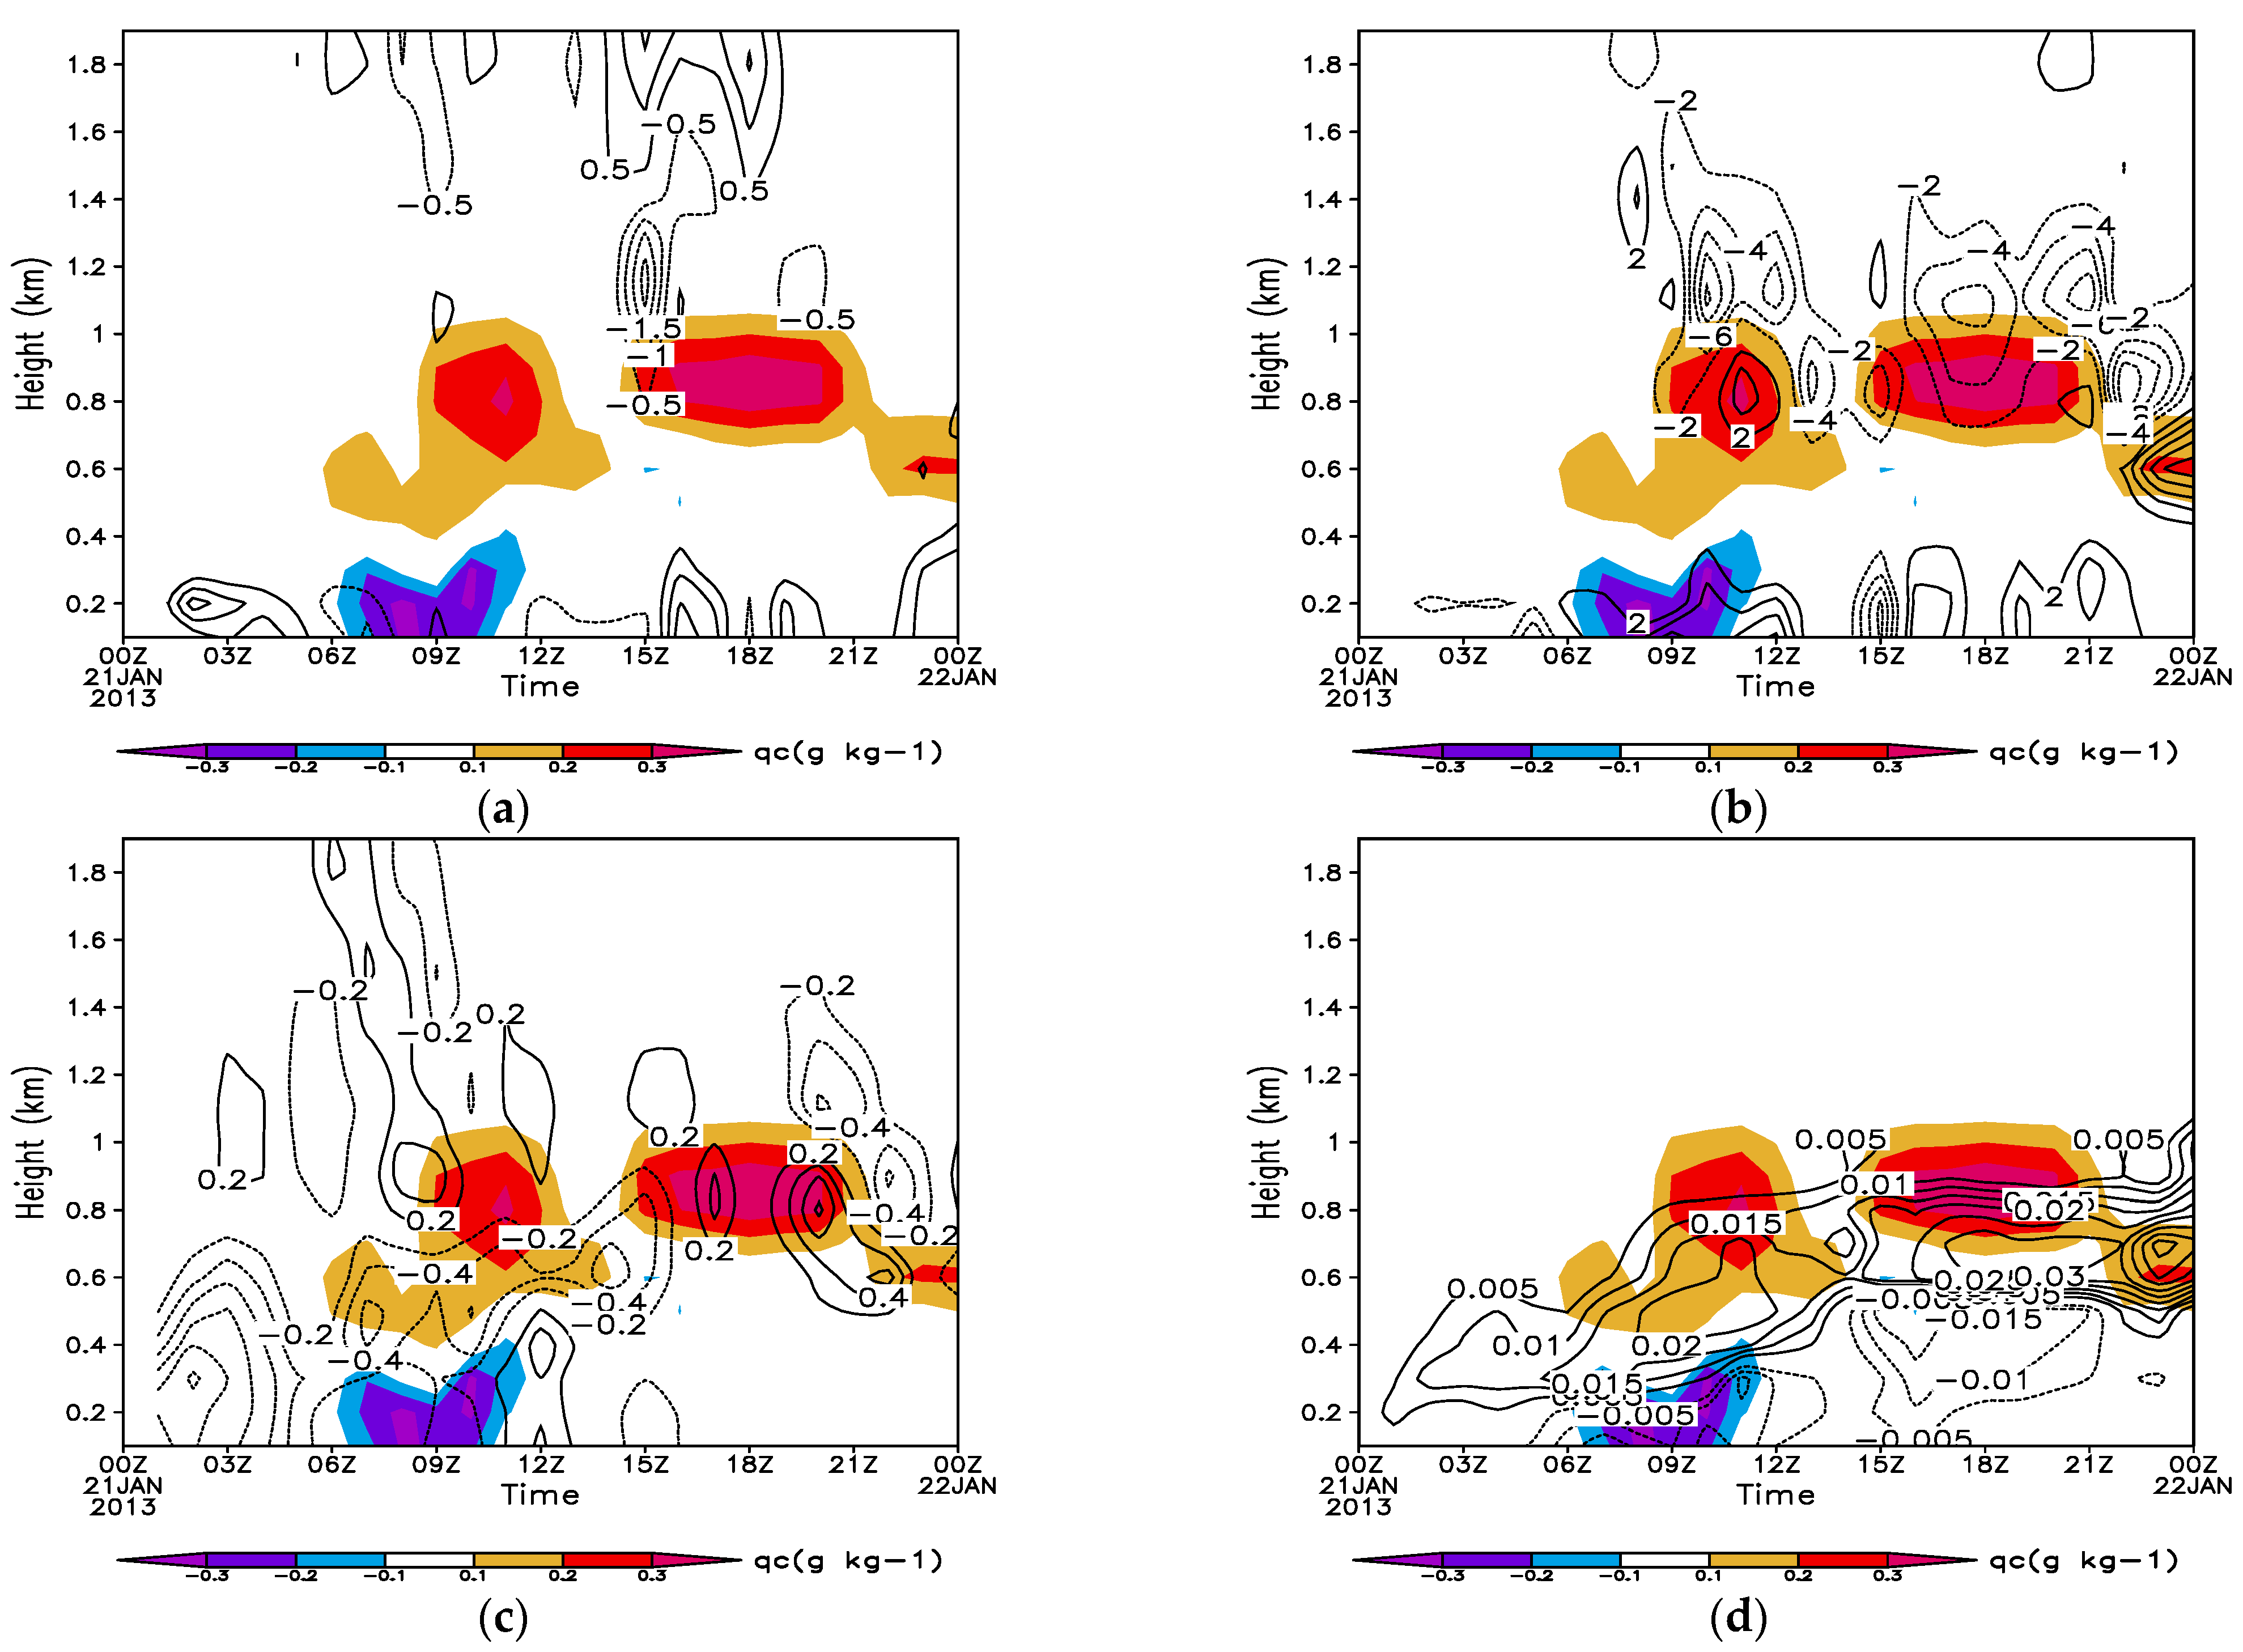
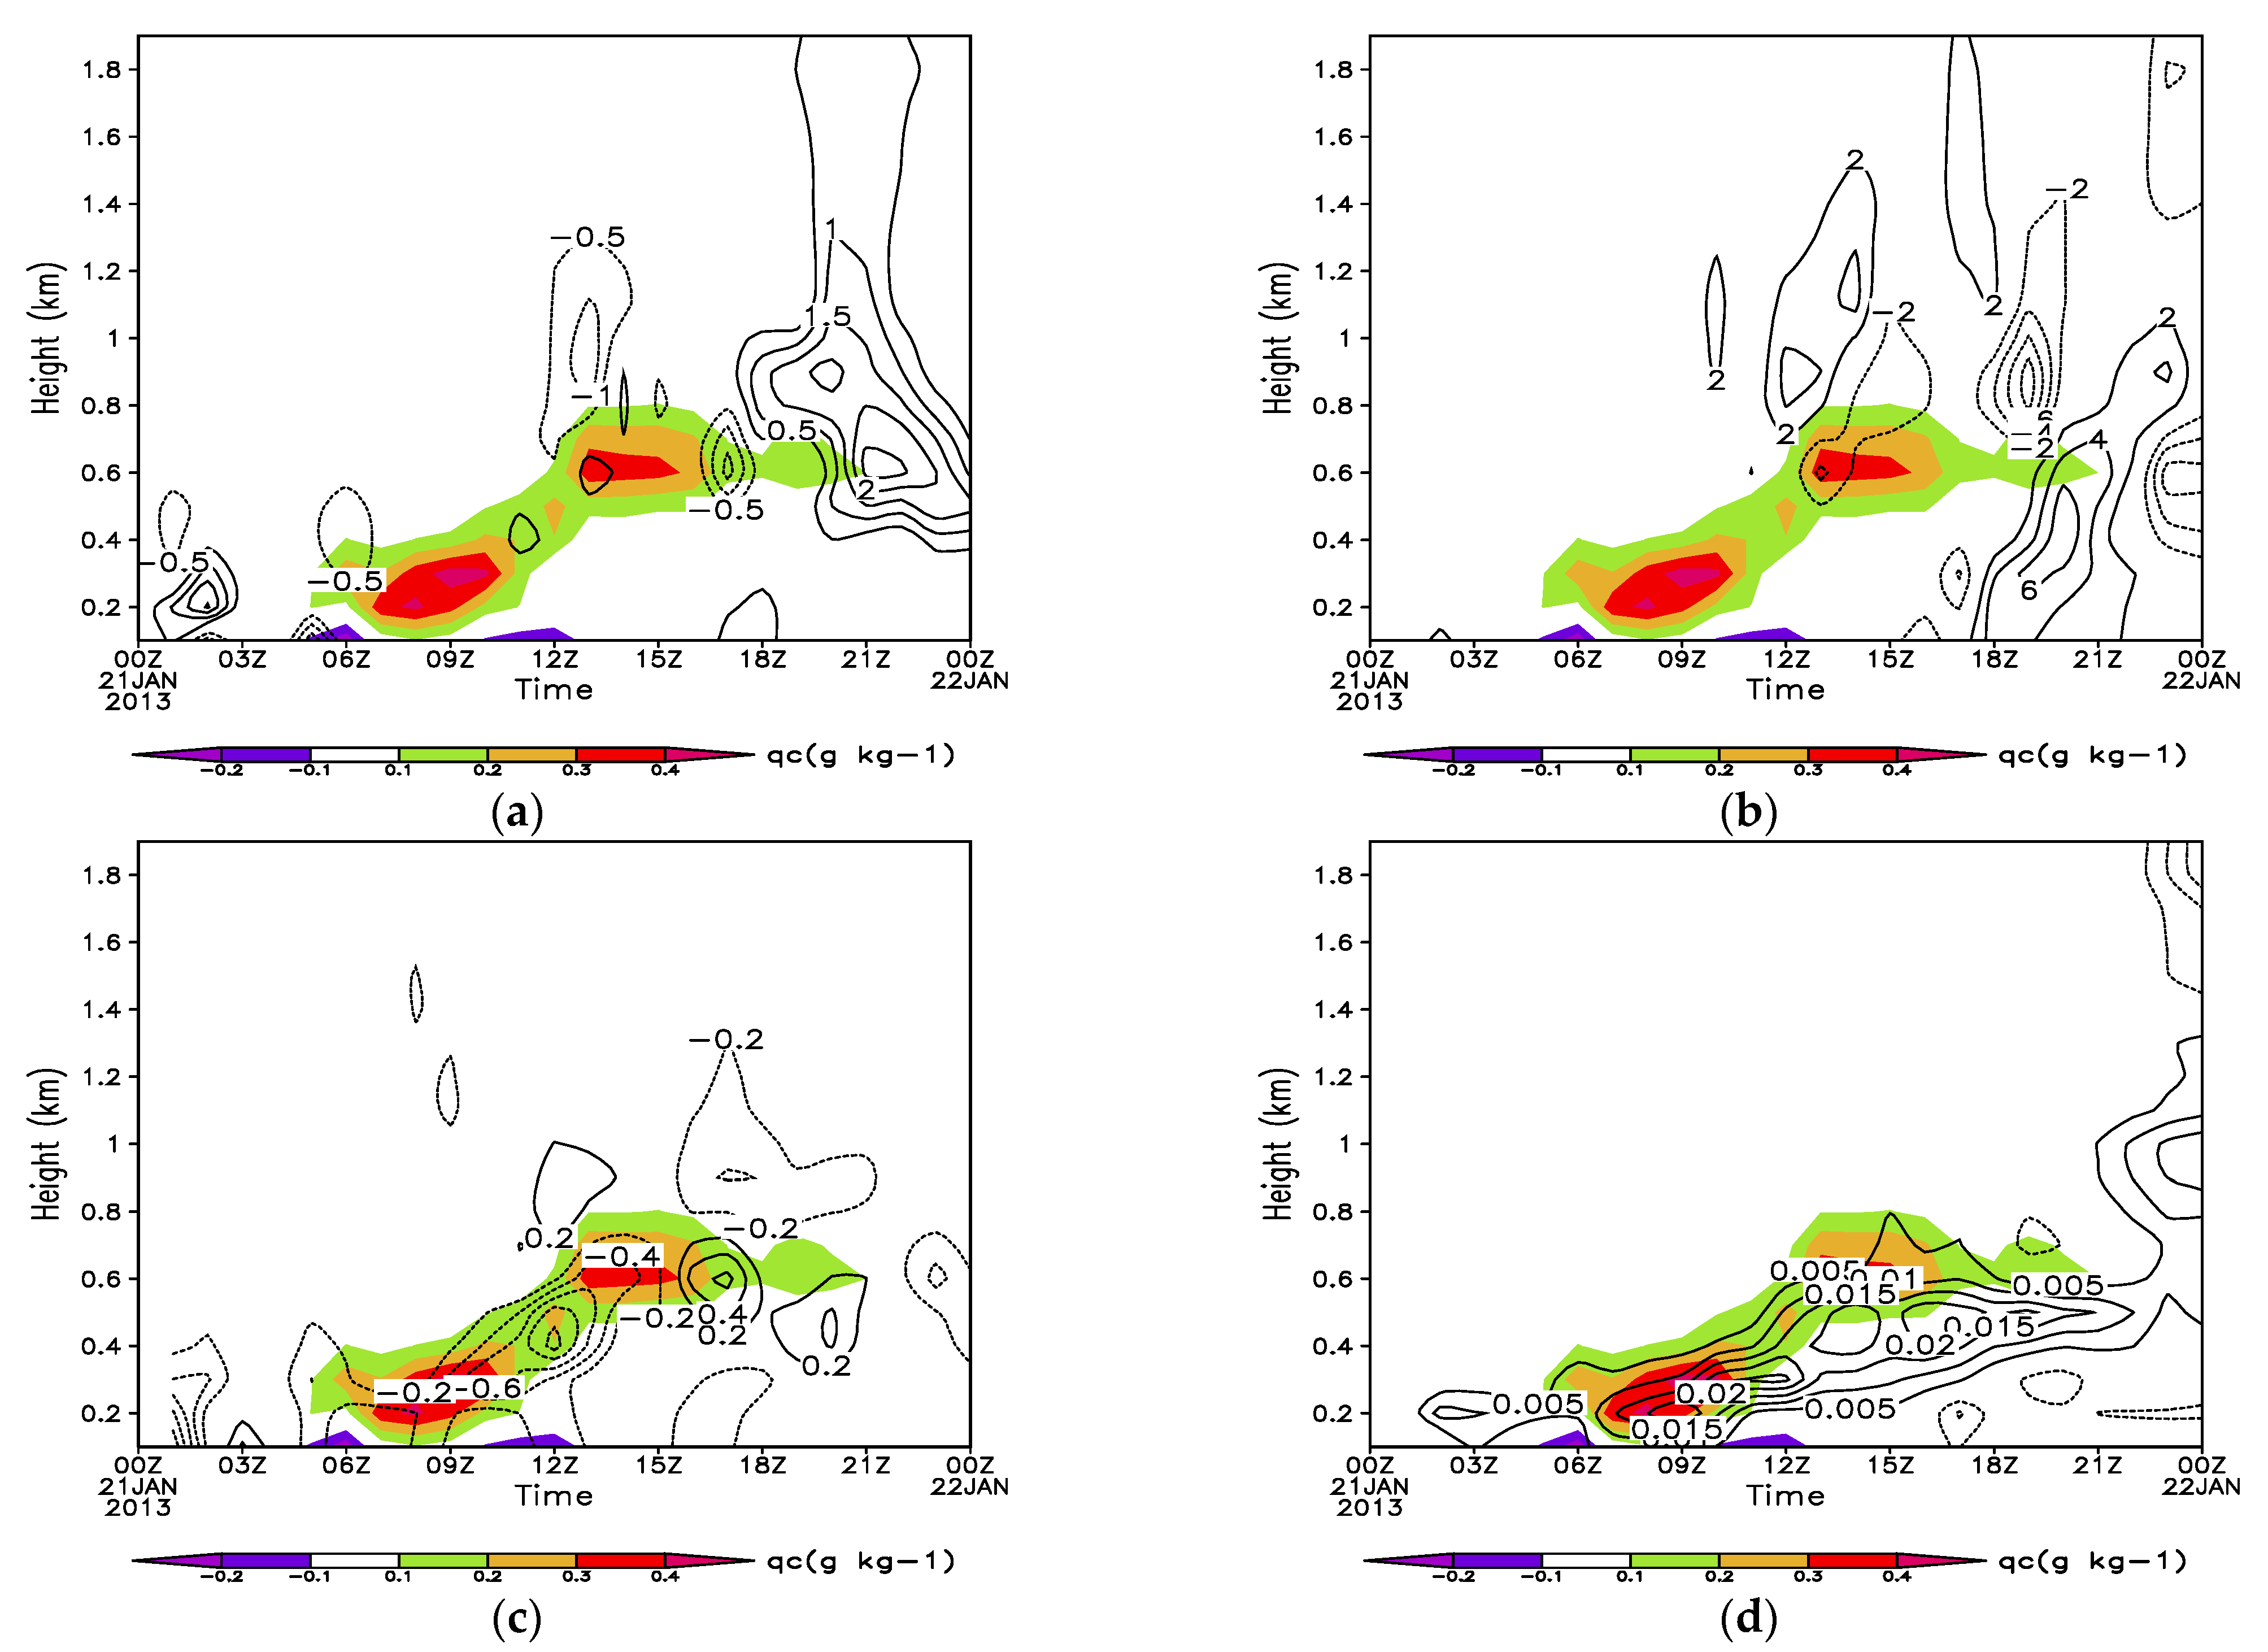
4.1. Analysis of Humidifying Effects of Advection, Radiation, and Turbulence

In order to further investigate the reasons for the opposite changes of sea fog, two regions were selected. One region (36.4° N–36.6° N, 123.4° E–123.6° E) was in the central Yellow Sea, and the other region (37.9° N–38.1° N, 124.4° E–124.6° E) was in the northern Yellow Sea (showed in Figure 1). Based on the control simulation results, the average of the advection, radiation, and turbulences effect of the above two regions was separately analyzed. A positive value indicated that the corresponding mechanism had obvious humidification effects on sea fog, while a negative value indicated responsibility for dehumidification. The simulated fog patches were identified as the cloud water mixing ratio at the model’s lowest level, which was greater than 0.01 g kg−1.
The control experiment results showed that the advection, radiation, and turbulence effects basically differed by an order of magnitude. The contribution magnitude of the advection effect to relative humidity was 10−5 in the middle of the Yellow Sea (Figure 4a,b), while those of radiation and turbulence relative to relative humidity were 10−6 and 10−7, respectively (Figure 4c,d). Therefore, for the humidifying effects, the advection humidification was the largest, followed by radiation cooling, and the turbulence humidification was relatively small. The magnitudes of the three humidification effects are generally consistent with the results found by Hu et al. [27]. However, at different stages of sea fog, the advection, radiation, and turbulence effects had different humidifying effects.
Before sea fog generation (0–5 h), the advection in the U-direction, radiation, and turbulence had positive effects on the increase in relative humidity. The advection in the V-direction had weak negative effects, and the positive effects of radiation and turbulence gradually increased with time.
When the sea fog occurred (7 h), the contribution of advection to relative humidity became positive in the V-direction and negative in the U-direction. The radiative cooling of the whole layer (especially at the top of the fog) and the turbulence humidifying effect in the lower layer promoted the transformation of stratiform clouds to fog. In the development stage of sea fog (8–10 h), the maintenance of relative humidity in the lower layer was dominated by the positive effects of radiation and turbulence.
In the dissipation stage of sea fog (>10 h), the radiation and turbulence effects were still beneficial to the maintenance and increase in relative humidity, but the advection effect in both directions in the lower layer became negative. We concluded that advection effect played a key role in the reduction of relative humidity, and the dissipation of sea fog mainly depended on the changes in the advection effect.
In the second study area in the northern Yellow Sea, the humidifying effects in the control experiment were different from those in the central Yellow Sea. Before the generation of sea fog, the primary effects were radiation and turbulence (Figure 5c,d), which promoted the increase in relative humidity, and the advection humidifying effect in the middle and lower layers was almost zero (Figure 5a,b). During the formation and development stages of sea fog, the turbulence humidifying effect and radiative cooling were dominant in the lower and upper layers, respectively. In the sea fog dissipation stage, the strong negative advection effect in the V-direction destroyed the water vapor supply and led to sea fog dissipation. The dissipation mechanism of the sea fog in this area was the same as that in the central Yellow Sea.
There were different generation mechanisms for the sea fog occurrences in the two study areas. In the first study area, the surface fog was caused by the upper-level cloud touching the sea surface; however, the sea fog in the second study area occurred on the sea surface and developed into the upper level.

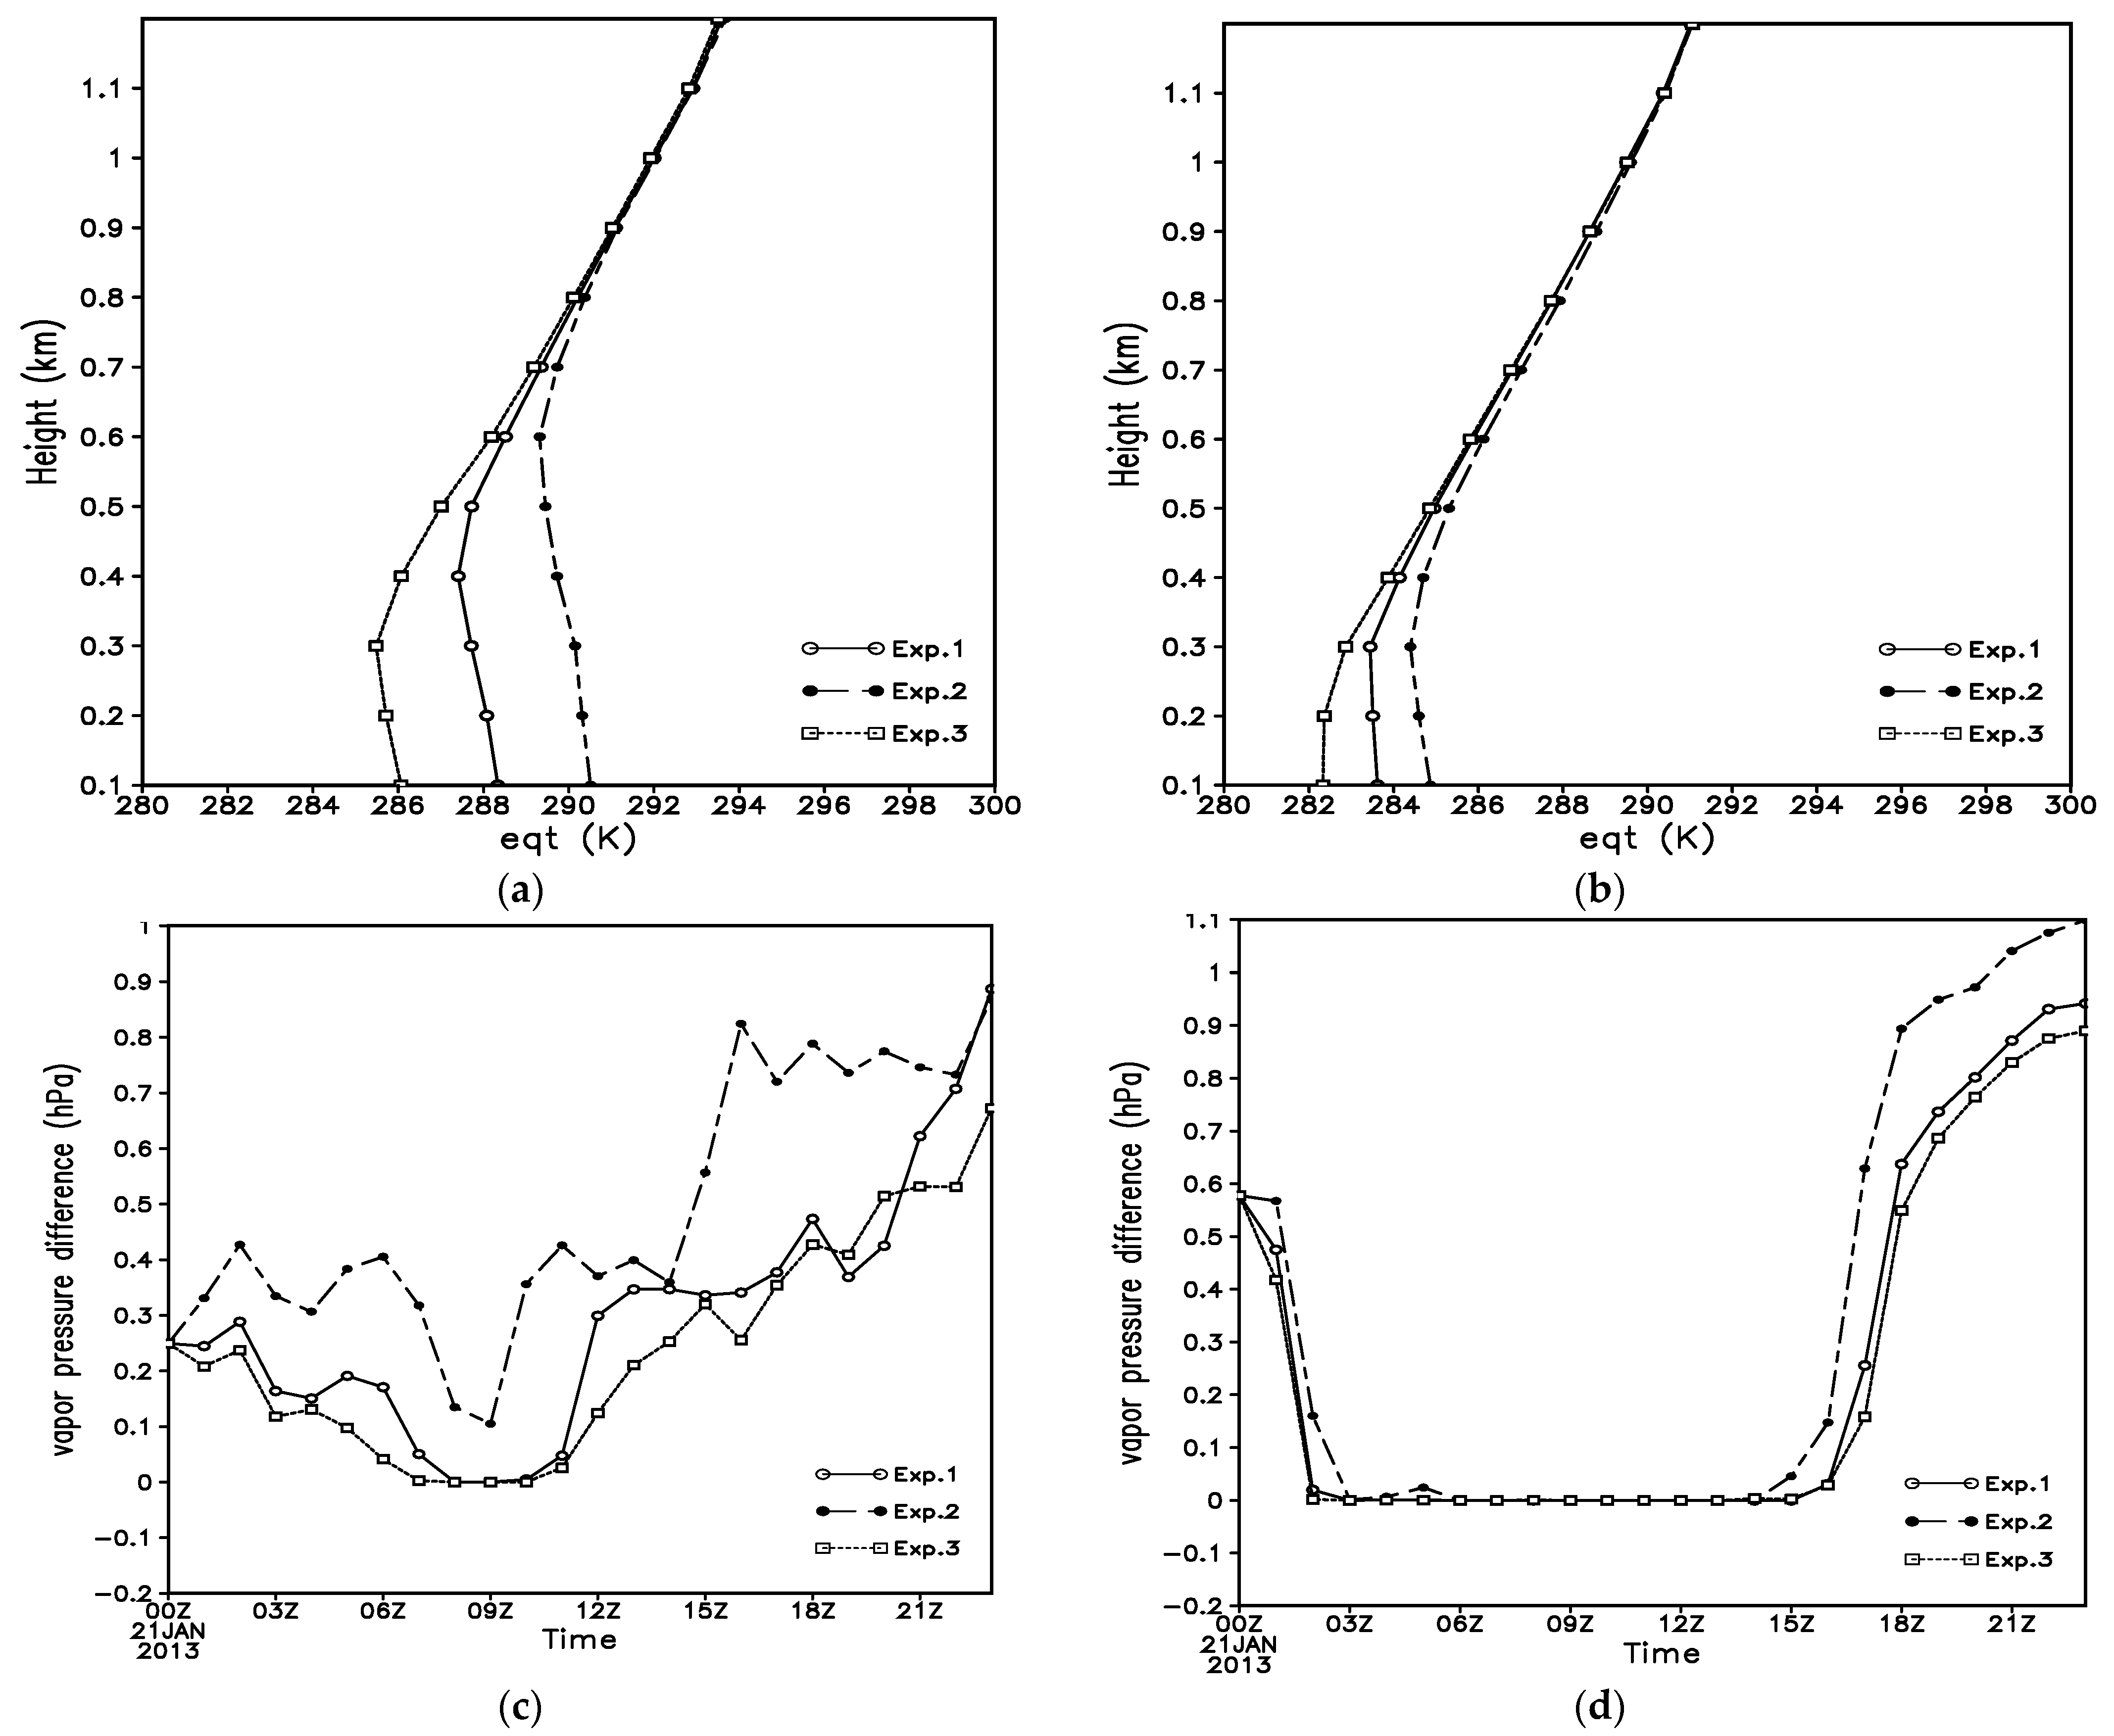
4.2. Analysis of the Effect of SST Changes on Sea Fog

The direct effect of SST changes on sea fog belonged to the thermal processes in Equation (1), which is the sum of M 1 and M 3 . The thermal imbalance changed the pressure distribution and indirectly affected advection. The change in cloud water mixing ratio with respect to SST was consistent with the variation in atmospheric visibility, which also reflected the opposite characteristics of the sea fog with SST in the two selected regions.
Comparing the three effects in the two regions, the humidifying effect of radiative cooling significantly reduced with increasing SST (Figure 6c and Figure 7c); thus, the radiation effect was not the main reason for the opposite changes in the sea fog.
The changes in the humidifying effect of advection with SST were different in the two regions (Figure 6a,b and Figure 7a,b). For the northern Yellow Sea, irrespective of control or sensitivity experiment, there was no obvious humidification or dehumidification by advection with increasing SST in the low layer during the maintenance period of sea fog (Figure 7a,b). The effect of turbulent humidification increased with the growth in SST (Figure 7d). The boundary layer stability changed from neutral to stable with increasing SST, and the SST change had little effect on the height of the inversion layer (Figure 8b). Thus, the water vapor saturation state was maintained in the lower layer (Figure 8d).
For the central Yellow Sea region, the variation in relative humidity was more affected by advection and radiation effects. The dissipation of the sea fog with increasing SST in the lower layer was related to the negative advection effect in the U-direction (Figure 7a) and the reduced stability (Figure 8a), which caused an increase in the height for the top of the inversion layer. The turbulent humidifying effect decreased with increasing SST below a height of 300 m. These factors were not conducive to water vapor accumulation in the central Yellow Sea region. Lee et al. [37] also found that strong turbulent mixing increases the boundary layer height, which contributes to the rapid growth of the height of sea fog.
As a result, the main reasons for the opposite change in sea fog induced by the SST variation were the advection effect in the U-direction, the turbulence effect in the lower layer, and the stability related to the height of the inversion layer.

5. Conclusions

We conducted numerical simulation experiments on SST variation for a winter sea fog process in the Yellow and Bohai Seas. Based on the time-varying equation of relative humidity, the reasons for the contrary atmospheric visibility changes in the central and northern Yellow Sea caused by SST were analyzed. The following conclusions were drawn for this work:
(1) The direct turbulence effect on the relative humidity changes was less than the radiation and advection effects.
(2) In this sea fog process, the influence of SST on advection may have been the main reason for sea fog dissipation.
(3) The increase in SST weakened the radiative cooling and the relative humidity, whereas the decrease in SST strengthened the radiation cooling and relative humidity.
(4) The opposite change in atmospheric visibility of the sea fog event in the two regions was mainly affected by advection and turbulence effects with changing SST, and the stability related to boundary layer height played an important role in water vapor condensation.
Shen et al. [38] indicated that there was significant differences in moisture advection conditions and inversion layer intensities at different sites during the sea fog according to the observation data, which confirms the view that sea fog with different properties appear in the unified area in this study. Our inversion layer changes with the SST during the sea fog through simulation analysis are also in accordance with those obtained by Rousta et al. [39,40,41]. In this study, only an individual case was investigated. Large-scale studies must be conducted to verify the three effects on relative humidity for different types of sea fog. Moreover, the intensity of the turbulence and radiation effects depends on the vertical resolution of the boundary layer, and the feedback of turbulence and radiation effects may change if the vertical resolution is changed. The time-varying equation of relative humidity is a two-dimensional equation, which can be re-derived from a three-dimensional perspective to generate a more realistic result. The influence of evaporation and condensation on the relative humidity changes is not considered in the equation, so that the three effects on humidification do not fully reflect the variation of sea fog density.

Author Contributions

Conceptualization, L.L.; methodology, W.W.; validation, L.L. and Y.L.; writing—original draft preparation, L.L.; writing—review and editing, L.L. and X.W.; supervision, X.W. All authors have read and agreed to the published version of the manuscript.

Funding

This research was funded by the National Natural Science Foundation of China, grant number 42105009 and Natural Science Foundation of Tianjin, grant number 20JCYBJC00780.

Institutional Review Board Statement

Not applicable.

Informed Consent Statement

Not applicable.

Data Availability Statement

Not applicable.

Acknowledgments

The authors gratefully acknowledge the financial support from the Meteorological Bureau Key Research Project of Tianjin, grant numbers 202133cgzsxm02 and 202002zdxm01. They also acknowledge the Mesoscale and Microscale Meteorology Laboratory of National Center for Atmospheric Research (NCAR) for providing the WRF model. They also thank the computing resource support of the National Supercomputer Center in Tianjin, China.

Conflicts of Interest

The authors declare no conflict of interest.

References

  1. WMO. International Meteorological Vocabulary, 2nd ed.; Secretariat of the World Meteorological Organization: Geneva, Switzerland, 1992; p. 782. [Google Scholar]
  2. Song, L.Y.; Chen, S.F.; Chen, W.; Guo, J.P.; Cheng, C.L.; Wang, Y. Distinct evolutions of haze pollution from winter to the following spring over the North China Plain: Role of the North Atlantic sea surface temperature anomalies. Atmos. Chem. Phys. 2022, 22, 1669–1688. [Google Scholar] [CrossRef]
  3. Park, S.Y.; Yoo, J.W.; Song, S.K.; Kim, C.H.; Lee, S.H. Numerical study on advective fog formation and its characteristic associated with cold water upwelling. PLoS ONE 2022, 17, e0267895. [Google Scholar] [CrossRef] [PubMed]
  4. Kim, S.; Moon, J.H.; Kim, T. A coupled numerical modeling study of a sea fog case after the passage of Typhoon Muifa over the Yellow Sea in 2011. J. Geophys. Res. Atmos. 2021, 126, e2020JD033875. [Google Scholar] [CrossRef]
  5. Fu, G.; Li, P.Y.; Zhang, S.P.; Gao, S.H. A brief overview of the sea fog study in China. Adv. Met. S. T. 2016, 6, 20–28. [Google Scholar] [CrossRef]
  6. Yang, W.B.; Zhang, S.P.; Xue, D.Q. The mechanism of winter sea fog over Yellow sea in February, 2010. Period. Ocean Univ. China 2012, 2, 24–33. [Google Scholar]
  7. Liu, J.W.; Sun, Y.; Yang, L. Interannual variability in summertime sea fog over the Northern Yellow Sea and its association with the local sea surface temperature. J. Geophys. Res. Atmos. 2021, 126, e2020JD034439. [Google Scholar] [CrossRef]
  8. Wang, J.Q. An observational and numerical study on a sea fog event over the Yellow and Bohai seas in spring of 2005. Master’s Thesis, Ocean University of China, Qingdao, China, 2006. [Google Scholar]
  9. Zhang, S.P.; Bao, X.W. The main advances in sea fog research in China. Period. Ocean Univ. China 2008, 38, 359–366. [Google Scholar]
  10. Meng, X.G.; Zhang, S.P. The effect of cold SST on summer atmosphere boundary layer and sea fog over the Yellow sea. Period. Ocean Univ. China 2012, 42, 16–23. [Google Scholar] [CrossRef]
  11. Koračin, D.; Clive, E.D.; John, M.L.; James, G.H.; Eric, M.W.; Alicia, T. Marine fog: A review. Atmos. Res. 2014, 143, 142–175. [Google Scholar] [CrossRef]
  12. Wang, W.; Wang, Y.; Qu, P.; Liu, L.L.; Wang, Q.L. Diurnal variation of SST in relation to season and weather phenomena in the Bohai region. J. Trop. Meteorol. 2019, 25, 339–413. [Google Scholar] [CrossRef]
  13. Qu, P.; Wang, W.; Liu, Z.J.; Gong, X.Q.; Shi, C.X.; Xu, B. Assessment of a fusion sea surface temperature product for numerical weather predictions in China: A case study. Atmospher 2021, 12, 604. [Google Scholar] [CrossRef]
  14. Zhang, S.P.; Ren, Z.P. The influence of the thermal effect of underlaying surface on the spring sea fog over the Yellow sea: Observations and numerical simulations. Acta Meteorol. Sin. 2010, 68, 439–449. [Google Scholar]
  15. Hee, P.S.; Keen, S.S.; Park, H. Temporal and Spatial variations of marine meteorological elements and characteristics of sea fog occurrence in Korean coastal waters during 2013–2017. J. Environ. Sci. Int. 2020, 29, 257–272. [Google Scholar] [CrossRef]
  16. Huang, H.J.; Liu, H.N.; Huang, J.; Mao, W.K.; Bi, X.Y. Atmospheric boundary layer structure and turbulence during sea fog on the Southern China coast. Mon. Weather Rev. 2015, 143, 1907–1923. [Google Scholar] [CrossRef]
  17. Huang, B.; Xu, J.M.; Shi, D.D.; Liu, L.S. Deformation feature of a continuous sea fog process over the Yellow sea and Bohai sea and its genesis analysis. Meteorol. Mon. 2018, 44, 1342–1351. [Google Scholar] [CrossRef]
  18. Li, X.B.; Zhang, S.P.; Koracin, D.; Yi, L.; Zhang, X. Atmospheric conditions conductive to marine fog over the northeast Pacific in winters of 1979-2019. Front. Earth Sci. 2022, 10, 942846. [Google Scholar] [CrossRef]
  19. Gao, S.H.; Lin, H.; Shen, B.; Fu, G. A heavy sea fog event over the Yellow sea in March 2005: Analysis and numerical modeling. Adv. Atmos. Sci. 2007, 24, 65–81. [Google Scholar] [CrossRef]
  20. Yang, Y.; Gao, S.H. Sensitivity study of vertical resolution in WRF numerical simulation for sea fog over the Yellow sea. Acta Meteorol. Sin. 2016, 74, 974–988. [Google Scholar] [CrossRef]
  21. Wilson, T.H.; Fovell, R.G. Modeling the evolution and life cycle of radiative cold pools and fog. Weather Forecast. 2018, 33, 203–220. [Google Scholar] [CrossRef]
  22. Kim, C.K.; Yum, S.S. A numerical study of sea-fog formation over cold sea surface using a one-dimensional turbulence model coupled with the Weather Research and Forecasting model. Bound. Layer Meteorol. 2012, 143, 481–505. [Google Scholar] [CrossRef]
  23. Yun, J.; Ha, K.J. Physical processes in sea fog formation and characteristics of turbulent air-sea fluxes at Socheongcho ocean research station in the Yellow sea. Front. Mar. Sci. 2022, 9, 825973. [Google Scholar] [CrossRef]
  24. Yang, L.; Liu, J.W.; Ren, Z.P.; Xie, S.P.; Zhang, S.P.; Gao, S.H. Atmospheric conditions for advection-radiation fog over the western Yellow Sea. J. Geophys. Res. Atmos. 2018, 123, 5455–5468. [Google Scholar] [CrossRef]
  25. Yang, Y.; Gao, S.H. The impact of turbulent diffusion driven hy fog-top cooling on sea fog development. J. Geophys. Res. Atmos. 2020, 125, e2019JD031562. [Google Scholar] [CrossRef]
  26. Zhu, J.X.; Huang, G.; Wang, X.Q.; Cheng, G.H. Investigation of changes in extreme temperature and humidity over China through a dynamical downscaling approach. Earths Future 2017, 5, 1136–1155. [Google Scholar] [CrossRef]
  27. Hu, R.J.; Dong, K.H.; ZHOU, F.X. Numerical experiments with the advection, turbulence and radiation effects in the sea fog formation process. Adv. Mar. Sci. 2006, 24, 156–165. [Google Scholar]
  28. Hong, S.Y.; Lim, J. The WRF single-moment 6-Class microphysics scheme (WSM6). J. Korean Meteor. Soc. 2006, 42, 129–151. [Google Scholar]
  29. Hong, S.Y.; Noh, Y.; Dudhia, J. A new vertical diffusion package with an explicit treatment of entrainment processes. Mon. Weather Rev. 2006, 134, 2318–2341. [Google Scholar] [CrossRef] [Green Version]
  30. Mlawer, E.J.; Taubman, S.J.; Brown, P.D.; Iacono, M.J.; Clough, S.A. Radiative transfer for inhomogeneous atmospheres: RRTM, a validated correlated-k model for the longwave. J. Geophys. Res. 1997, 102, 16663–16682. [Google Scholar] [CrossRef] [Green Version]
  31. Dudhia, J. A nonhydrostatic version of the Penn State-NCAR mesoscale model: Validation tests and simulation of an Atlantic cyclone and cold front. Mon. Weather Rev. 1993, 121, 1493–1513. [Google Scholar] [CrossRef]
  32. Hu, R.J.; Zhou, F.X. Effects of advection, turbulence and radiation on formation of sea fog Ⅰ. A theoretical analysis. Acta Oceanol. Sin. 1998, 20, 25–32. [Google Scholar]
  33. Chen, S.F.; Guo, J.P.; Song, L.Y.; Li, J.; Liu, L.; Cohen, J.B. Inter-annual variation of the spring haze pollution over the North China Plain: Roles of atmospheric circulation and sea surface temperature. Int. J. Climatol. 2019, 39, 783–798. [Google Scholar] [CrossRef]
  34. Kunkel, B.A. Parameterization of droplet terminal velocity and extinction coefficient in fog models. J. Clim. Appl. Meteorol. 1984, 23, 34–41. [Google Scholar] [CrossRef]
  35. Stoelinga, M.T.; Warner, T.T. Nonhydrostatic mesobeta-scale model simulations of cloud ceiling and atmospheric visibility for an east coast winter precipitation event. J. Appl. Meteor. 1999, 38, 385–404. [Google Scholar] [CrossRef]
  36. Rousta, I.; Javadizadeh, F.; Dargahian, F.; Olafsson, H.; Shiri-Karimvandi, A.; Vahedinejad, S.H.; Doostkamian, M.; Vargas, E.R.M.; Asadolahi, A. Investigation of vorticity during prevalent winter precipitation in Iran. Adv. Meteorol. 2018, 2018, 6941501. [Google Scholar] [CrossRef] [Green Version]
  37. Lee, E.; Kim, J.H.; Heo, K.Y.; Cho, Y.K. Advection fog over the eastern Yellow Sea: WRF simulation and its verification by satellite and in Situ observation. Remote Sens. 2021, 13, 1480. [Google Scholar] [CrossRef]
  38. Shen, P.F.; Liu, D.Y.; Gultep, I.; Lin, H.J.; Cai, N.H.; Cao, S.Y.; Wang, Z.D. Boundary layer features of one winter fog in the Yangze River delta, China. Pure Appl. Geophys. 2022, 179, 1–18. [Google Scholar] [CrossRef]
  39. Rousta, I.; Doostkamian, M.; Haghighi, E.; Mirzakhani, B. Statistical-synoptic analysis of the atmosphere thickness pattern of Iran’s pervasive frosts. Climate 2016, 4, 41. [Google Scholar] [CrossRef] [Green Version]
  40. Rousta, I.; Doostkamian, M.; Taherian, A.M.; Haghighi, E.; Malamiri, H.R.G.; Ólafsson, H. Investigation of the spatio-temporal variations in atmosphere thickness pattern of Iran and the Middle East with special focus on precipitation in Iran. Climate 2017, 5, 82. [Google Scholar] [CrossRef] [Green Version]
  41. Rousta, I.; Nasserzadeh, M.H.; Jalali, M.; Haghighi, E.; Ólafsson, H.; Ashrafi, S.; Doostkamian, M.; Ghasemi, A. Decadal spatial-temporal variations in the spatial pattern of anomalies of extreme precipitation thresholds (Case study: Northwest Iran). Atmosphere 2017, 8, 135. [Google Scholar] [CrossRef]
Figure 1. Map of the study area. The large square indicates the simulation domain with 3 km resolution. The two small squares indicate the analysis area of humidification effects. + denotes the observational stations 54646 and 58573.
Atmosphere 13 01718 g001
Figure 2. (a) HMWR visible satellite imagery at 06UTC 21 January 2013; (b) observation and simulation visibility at stations 58573 and 54646; (c) the distribution of height, temperature, and wind field at the 1000 hPa level; (d) sea–air temperature difference (unit: °C).
Atmosphere 13 01718 g002
Figure 3. The difference in simulated visibility at 08 UTC 21 January 2013: (a) Exp.1, (b) Exp.2 minus Exp.1, and (c) Exp.3 minus Exp.1. Shading indicates positive difference, dashed line represents negative difference, and square area is the average range of the selected area (units: km).
Atmosphere 13 01718 g003
Figure 4. Regional average time series of contribution of three effects to relative humidity (contour, units: × 10−5 s−1) in central Yellow Sea: (a) advection effect in U-direction, (b) advection effect in V-direction, (c) radiation effect, and (d) turbulence effect (shading: cloud water mixing ratio, units: g kg−1).
Atmosphere 13 01718 g004
Figure 5. Regional average time series of contribution of three effects to relative humidity (contour, units: × 10−5 s−1) in the northern Yellow Sea: (a) advection effect in U-direction, (b) advection effect in V-direction, (c) radiation effect, and (d) turbulence effect (shading: cloud water mixing ratio, units: g kg−1).
Atmosphere 13 01718 g005
Figure 6. Regional average time-series difference diagram of the contribution of three effects to relative humidity (contour, units: × 10−5 s−1) in the sensitivity test of the central Yellow Sea (Exp.2–Exp.3): (a) advection effect in U-direction, (b) advection effect in V-direction, (c) radiation effect, and (d) turbulence effect (shading: difference in cloud water mixing ratio, units: g kg−1).
Atmosphere 13 01718 g006
Figure 7. Regional average time-series difference diagram of the contribution of three effects to relative humidity (contour, units: × 10−5 s−1) in the sensitivity test of the northern Yellow Sea (Exp.2–Exp.3): (a) advection effect in U-direction, (b) advection effect in V-direction, (c) radiation effect, and (d) turbulence effect (shading: difference of cloud water mixing ratio, units: g kg−1).
Atmosphere 13 01718 g007
Figure 8. Vertical profiles of the regional mean pseudo-equivalent temperature for the control and sensitivity experiments (units: K) at 08 UTC on 21 January 2013 in (a) central and (b) northern Yellow Sea; regional average time series of water vapor pressure and saturation water vapor pressure difference (e-es) (units: hPa) for control and sensitivity experiments in (c) central and (d) northern Yellow Sea.
Atmosphere 13 01718 g008
Table 1. Numerical simulation experimental design.
Experiment NameExperimental Design
Exp.1control experiment (RTG_SST+FNL)
Exp.2sensitivity experiment: increasing SST by 2 degrees
Exp.3sensitivity experiment: decreasing SST by 2 degrees
Publisher’s Note: MDPI stays neutral with regard to jurisdictional claims in published maps and institutional affiliations.

