1. Introduction
The Dongting Lake basin is located in the middle reaches of the Yangtze River and the north of the southern Yangtze River, mainly covering the Hunan Province, which is known as a fertile land of fish and rice in China. Historical data show that the Dongting Lake basin has been deeply affected by drought and flood disasters [
1]. Particularly since the mid-20th century, flood and drought disasters frequently occur in the Dongting Lake basin under the background of significant global warming. Moreover, the phenomenon of drought-flood state transition (critical transition) has become more and more frequent [
2,
3]. The duration for the climate maintained in a drought or flood state over the Dongting Lake basin is getting shorter and shorter, that is, the transition cycle of drought-flood state significantly shortens [
1,
4,
5].
The drought-flood state transition often leads to regional flood, drought, or deterioration of water environment [
6]. If effective measures of early-warning can be carried out before the drought-flood state transition, local government and relevant departments will have sufficient time for management planning to minimize disaster losses as much as possible. Therefore, it is very important to explore the prediction and early-warning methods for drought-flood state transition in the Dongting Lake basin.
However, as the drought-flood state transition involves complex nonlinear processes, the existing climate model has poor capability in predicting possible drought-flood transition events [
7,
8,
9,
10,
11]. At present, research into predicting regional abnormal drought or flood events caused by a drought-flood state transition are mainly based on the establishment of models taking the external forcings (sea temperature, sea ice, etc.) as a bridge. However, the results have shown that it is often difficult to overcome the limitations of the linear method adopted in the prediction model, which only contains weak mechanisms due to excessive simplification. Some of the studies have demonstrated that the model’s prediction results over the Dongting Lake basin in 1999 and 2007 are almost opposite to the observations [
12,
13]. In summary, the accurate prediction of regional drought or flood events caused by the drought-flood state transition is a long-term challenge for meteorological departments. Therefore, it is still an extremely difficult task to accurately predict the drought-flood state transition based on the existing prediction theories and technical levels. Previous studies have shown that many complex nonlinear systems have critical thresholds (also called the tipping points, where the behavior or structure of the system changes dramatically) at which the system shifts abruptly from one state to another [
14,
15]. This critical transition phenomenon widely exists in various fields of nature and human society, such as the abrupt changes of climate system, the outbreak of diseases, the sudden collapse of real estate markets, the sudden paralysis of networks, the sudden extinction of species and the sudden disappearance of oasis [
16,
17,
18]. Such transitions are often catastrophic. For example, the abrupt changes of the climate system may result in the decline of the civilization or the rise and fall of dynasties [
18,
19,
20]. However, it is difficult to accurately predict such phenomena based on existing technologies. Therefore, it is urgent to investigate the mechanisms and early-warning signals for critical transitions of nonlinear systems.
According to the definition of the United Nations International Strategy for disaster reduction [
21], the early-warning system is “the set of capacities needed to generate and disseminate timely and meaningful warning information to enable individuals, communities and organizations threatened by a hazard to prepare and to act appropriately and in sufficient time to reduce the possibility of harm or loss”. A generally accepted viewpoint on early-warning system (EWS) is that the EWS is a social process aiming to address the need to avoid harm due to hazards [
22,
23,
24,
25]. EWS embraces the technical aspect, this technology can give warning signals to people when hazards are approaching [
26,
27], and depends on how people define the hazard or the type of hazard they will face. The start time of hazard is a key professional problem that needs to be solved in EWS, because EWS does not play its role until the hazard has appeared [
27]. Some hazards have obvious external characteristics and can be quickly detected by us, such as tsunami or tornado caused by earthquake, we need to warn them in a few minutes; hurricane warnings are on the order of hours to weeks; but other hazards continue to develop at a very slow speed, such as drought, we will issue early-warning a few months in advance according to the prediction of precipitation [
28].
A large amount of research has already indicated that some hazard will occur more frequently over a period of time, especially in the context of climate warming [
29], such as the floods that occurred frequently in Europe between 1985 and 2009 [
30,
31,
32]. Yunnan and other provinces in Southwest China have experienced frequent droughts since 2009 [
33,
34,
35,
36]. If we can warn people in advance that droughts or floods will occur frequently in the next few years, so people can more reasonably arrange the industrial/agricultural production and take defensive measures to minimize the loss or impact of disasters. Therefore, it is necessary to find the early-warning signals longer in advance.
At the beginning of the 21st century, scientists found that the critical slowing down theory has important application potential in the study of early-warning signals for complex dynamical systems [
14,
37,
38]. The critical slowing down is a concept in statistical physics, which refers to the phenomenon that when the dynamic system approaches the critical point before its transition from one phase to another, especially at the critical point, there will be dispersed fluctuations conducive to the formation of new phases. This dispersed fluctuation presents not only increasing amplitude, but also longer duration, slower recovery rate after the perturbation and decreased ability to return to the previous phase. This phenomenon is called “slowing down” [
39]. Research on several real systems such as the climate system and the ecosystem has revealed that when the system approaches to the critical point, there will be a critical slowing down phenomenon featured by the slowing down in recovery rate, and the increases in the variance and autocorrelation coefficient after the system perturbation which provides a new idea for investigating the early-warning signals of abrupt changes in complex dynamical systems [
14]. Based on the critical slowing down theory, Yan et al. [
40] processed the data of radon concentrations in water and revealed that the early-warning signals of increasing variances and autocorrelation coefficients appeared before the Wenchuan earthquake in 2008. In recent years, several scholars [
41,
42,
43,
44,
45] applied this theory to climate data, such as the regional temperature in China, the Pacific Decadal Oscillation index and the intensity of Aleutian low, aiming to study the early-warning signals of abrupt climatic changes. On the basis of existing early-warning signals, He et al. [
46,
47,
48] made some improvements and developed a set of quantitative early-warning signals and methods for abrupt climatic changes. In view of the limitations of the linear method in previous research on the drought-flood state transition and the complex nonlinear processes involved in the drought-flood state transition over the Dongting Lake basin, this kind of state transition can be regarded as a systematic mutation. Therefore, previous research on the early-warning signals of abrupt changes based on the critical slowing down theory can provide effective methods for the research on the early-warning signals of the drought-flood state transition over the Dongting Lake basin.
Considering this, this study investigates the early-warning signals of the drought-flood state transition over the Dongting Lake basin based on the critical slowing theory. Firstly, the moving t-test (MTT) is used to detect the drought-flood state transition over the Dongting Lake basin. Then, by analyzing the variances and autocorrelation coefficients that characterize the phenomenon of critical slowing down, the early-warning signals for drought-flood state transition are explored which provides important reference for the prediction of drought and flood events over the Dongting Lake basin, thereby offering scientific and technological support for disaster prevention and mitigation over the basin.
3. Results and Analysis
Since the mid-20th century, the drought-flood state transition over the Dongting Lake basin occurs more and more frequently under significant global warming, and correspondingly, the duration for the climate maintained in a drought or flood state is getting shorter and shorter. The drought-flood state transition often leads to regional flood, drought or deterioration of water environment [
1,
6]. Therefore, it is of great significance to study the early-warning signals for the drought-flood state transition over the Dongting Lake basin. In this section, the early-warning signals for the drought-flood state transition over the Dongting Lake basin are explored based on the critical slowing down theory.
3.1. Detection of the Drought-Flood State Transition over the Dongting Lake Basin
Firstly, the SPI values over the Dongting Lake basin are calculated through the grid-area-weighted average method [
53]. This section mainly investigates the decadal variation characteristics of the SPI and the characteristics of the drought-flood state transition (abrupt change) over the Dongting Lake basin.
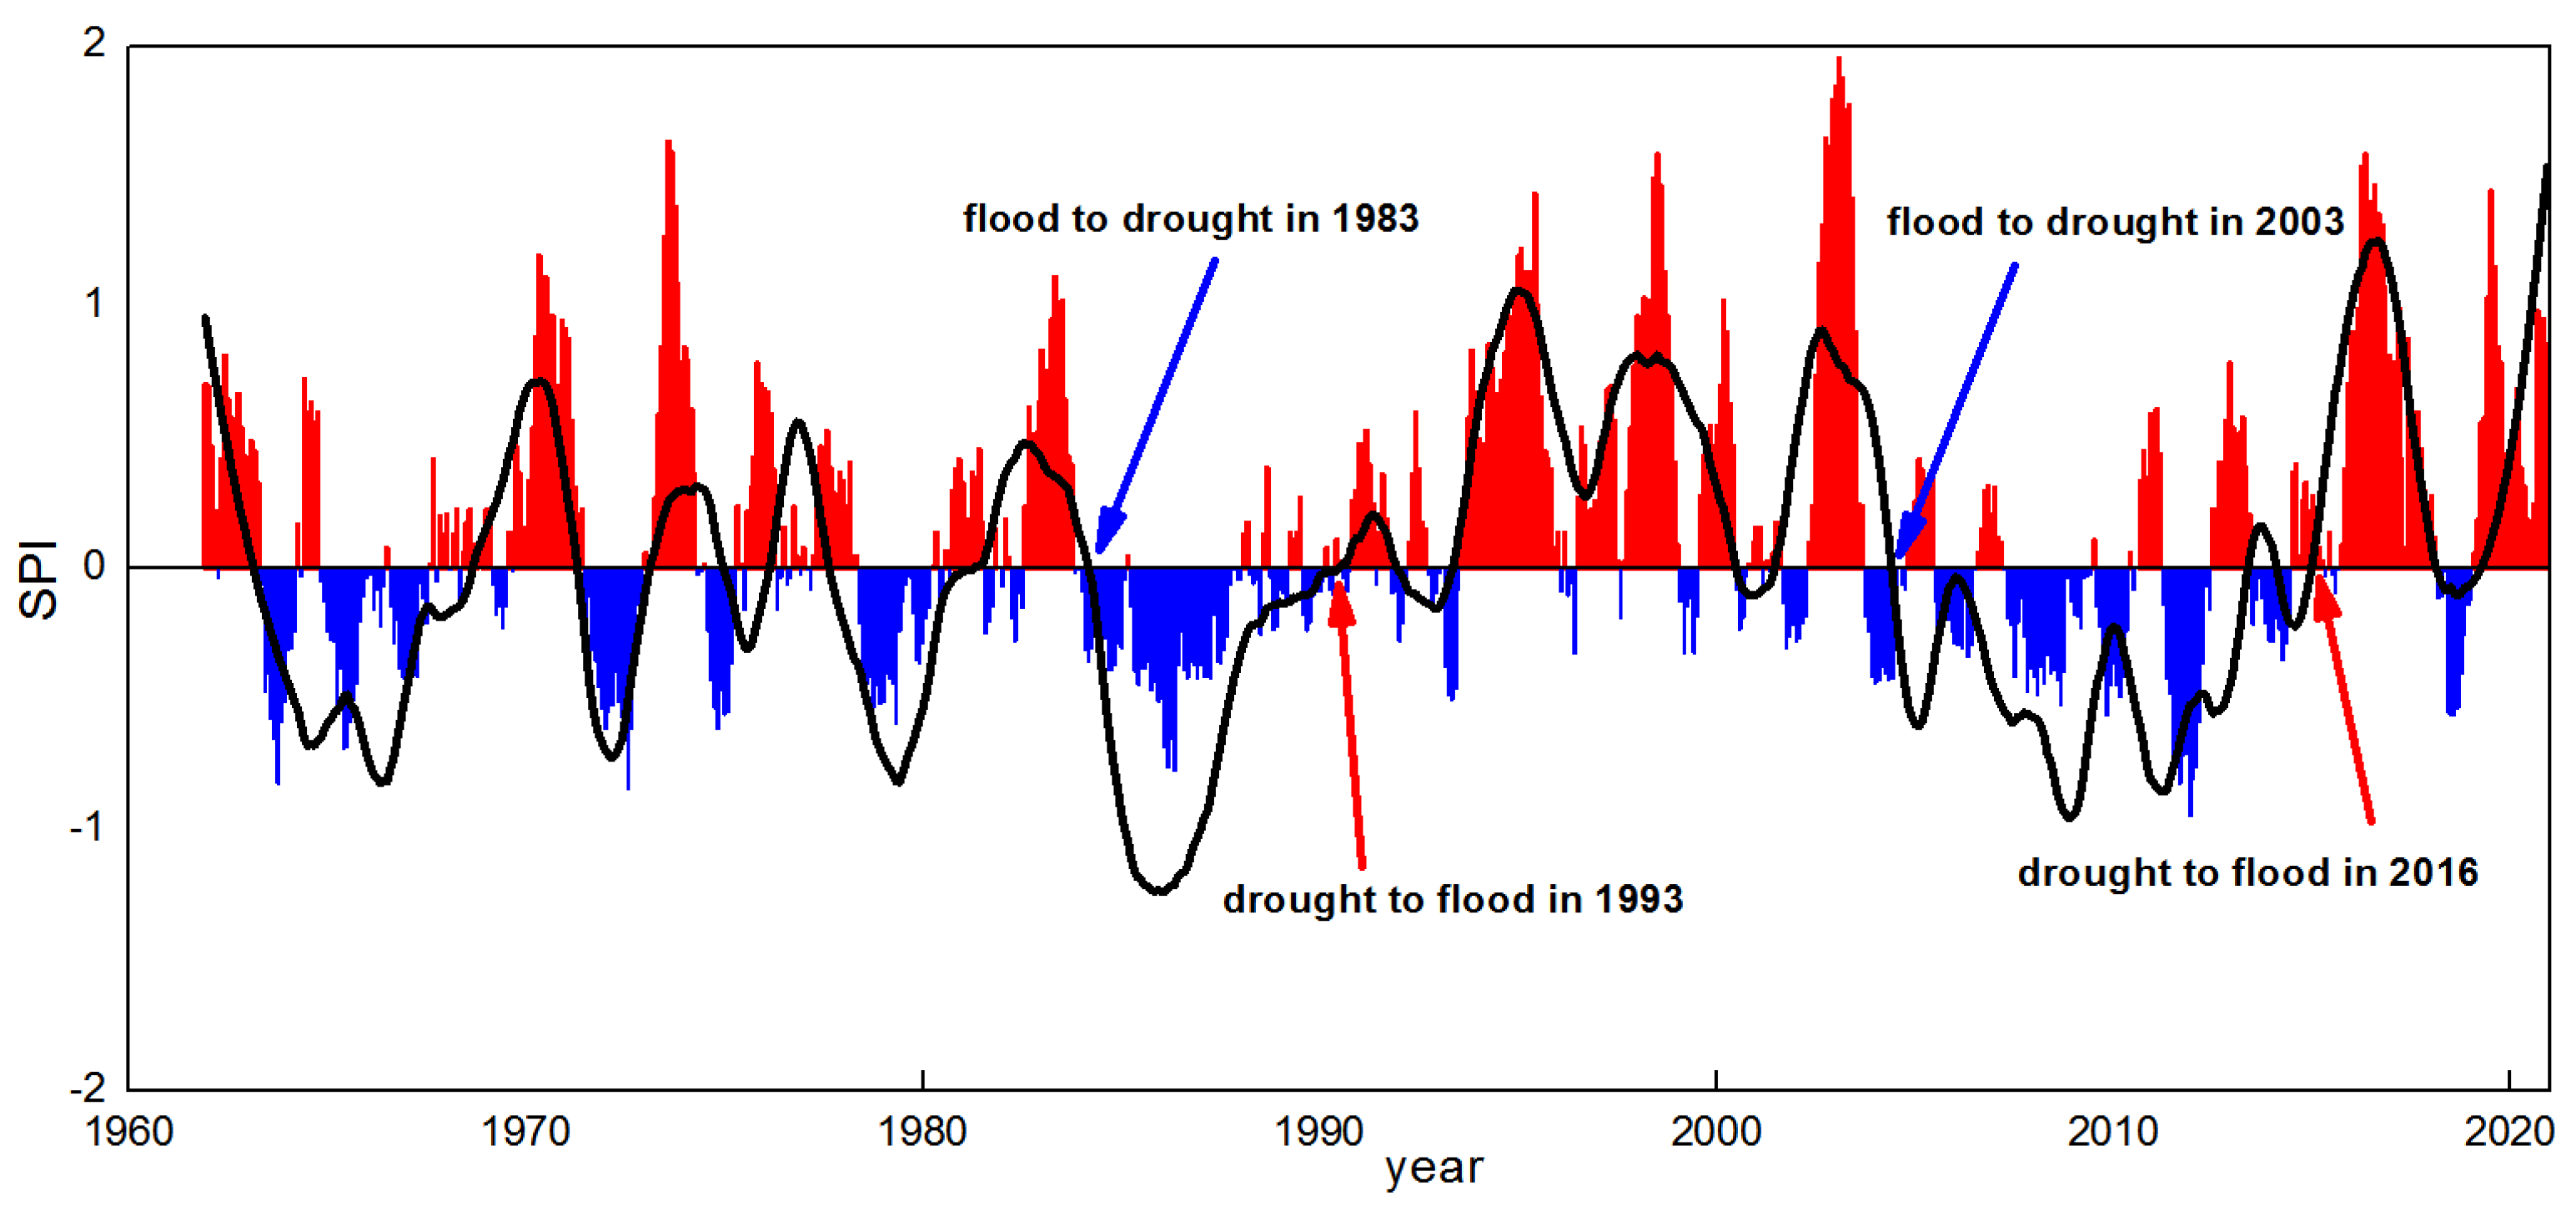
Figure 2 shows that the SPI sequence over the Dongting Lake basin in recent 60 years is featured by obvious decadal changes. The trend of the moving averages reveals that there are obvious more precipitation-to-less precipitation (less precipitation-to-more precipitation) events in 1983 and 2003 (1993 and 2016). All these events are collectively referred to as the drought-flood state transition events (abrupt change). Studies have shown that there are obvious decadal changes for the drought and flood conditions over the Dongting Lake basin. In particular, the less precipitation-to-more precipitation events around 1993 are widely concerned [
4,
5].
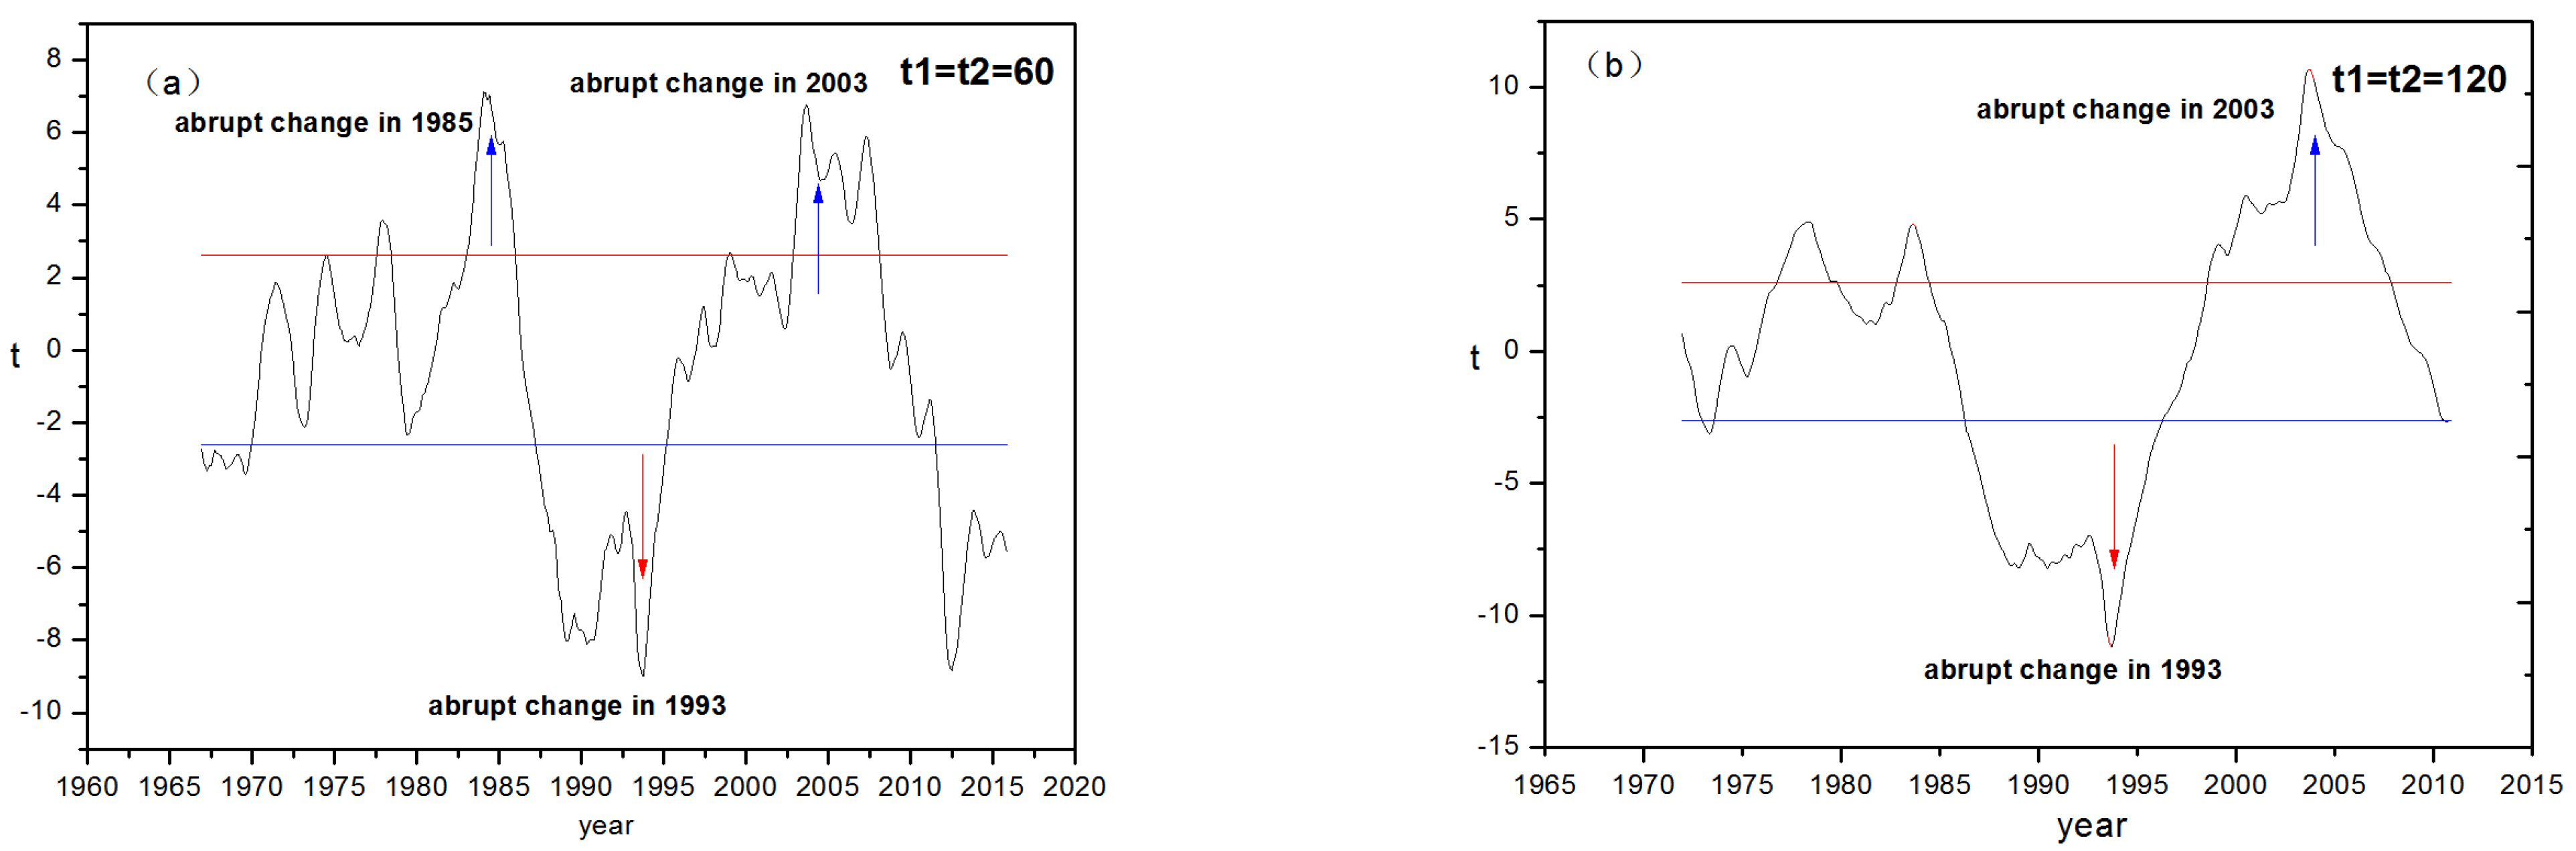
Figure 3 shows the detection curve for the abrupt change in the SPI sequence over the Dongting Lake basin based on the MTT method. When the size
of the sliding window is set as 5 years, multiple abrupt changes will be found in the SPI sequence, which are especially significant in 1985, 1993 and 2003. When
is set as 10 years, two obvious abrupt changes in 1993 and 2003 can also be found. Therefore, it can be considered that the SPI sequence over the Dongting Lake basin has two obvious abrupt changes (drought-flood state transition) in 1993 and 2003. In the following section, the early-warning signals for these two abrupt changes are explored based on the critical slowing down theory.
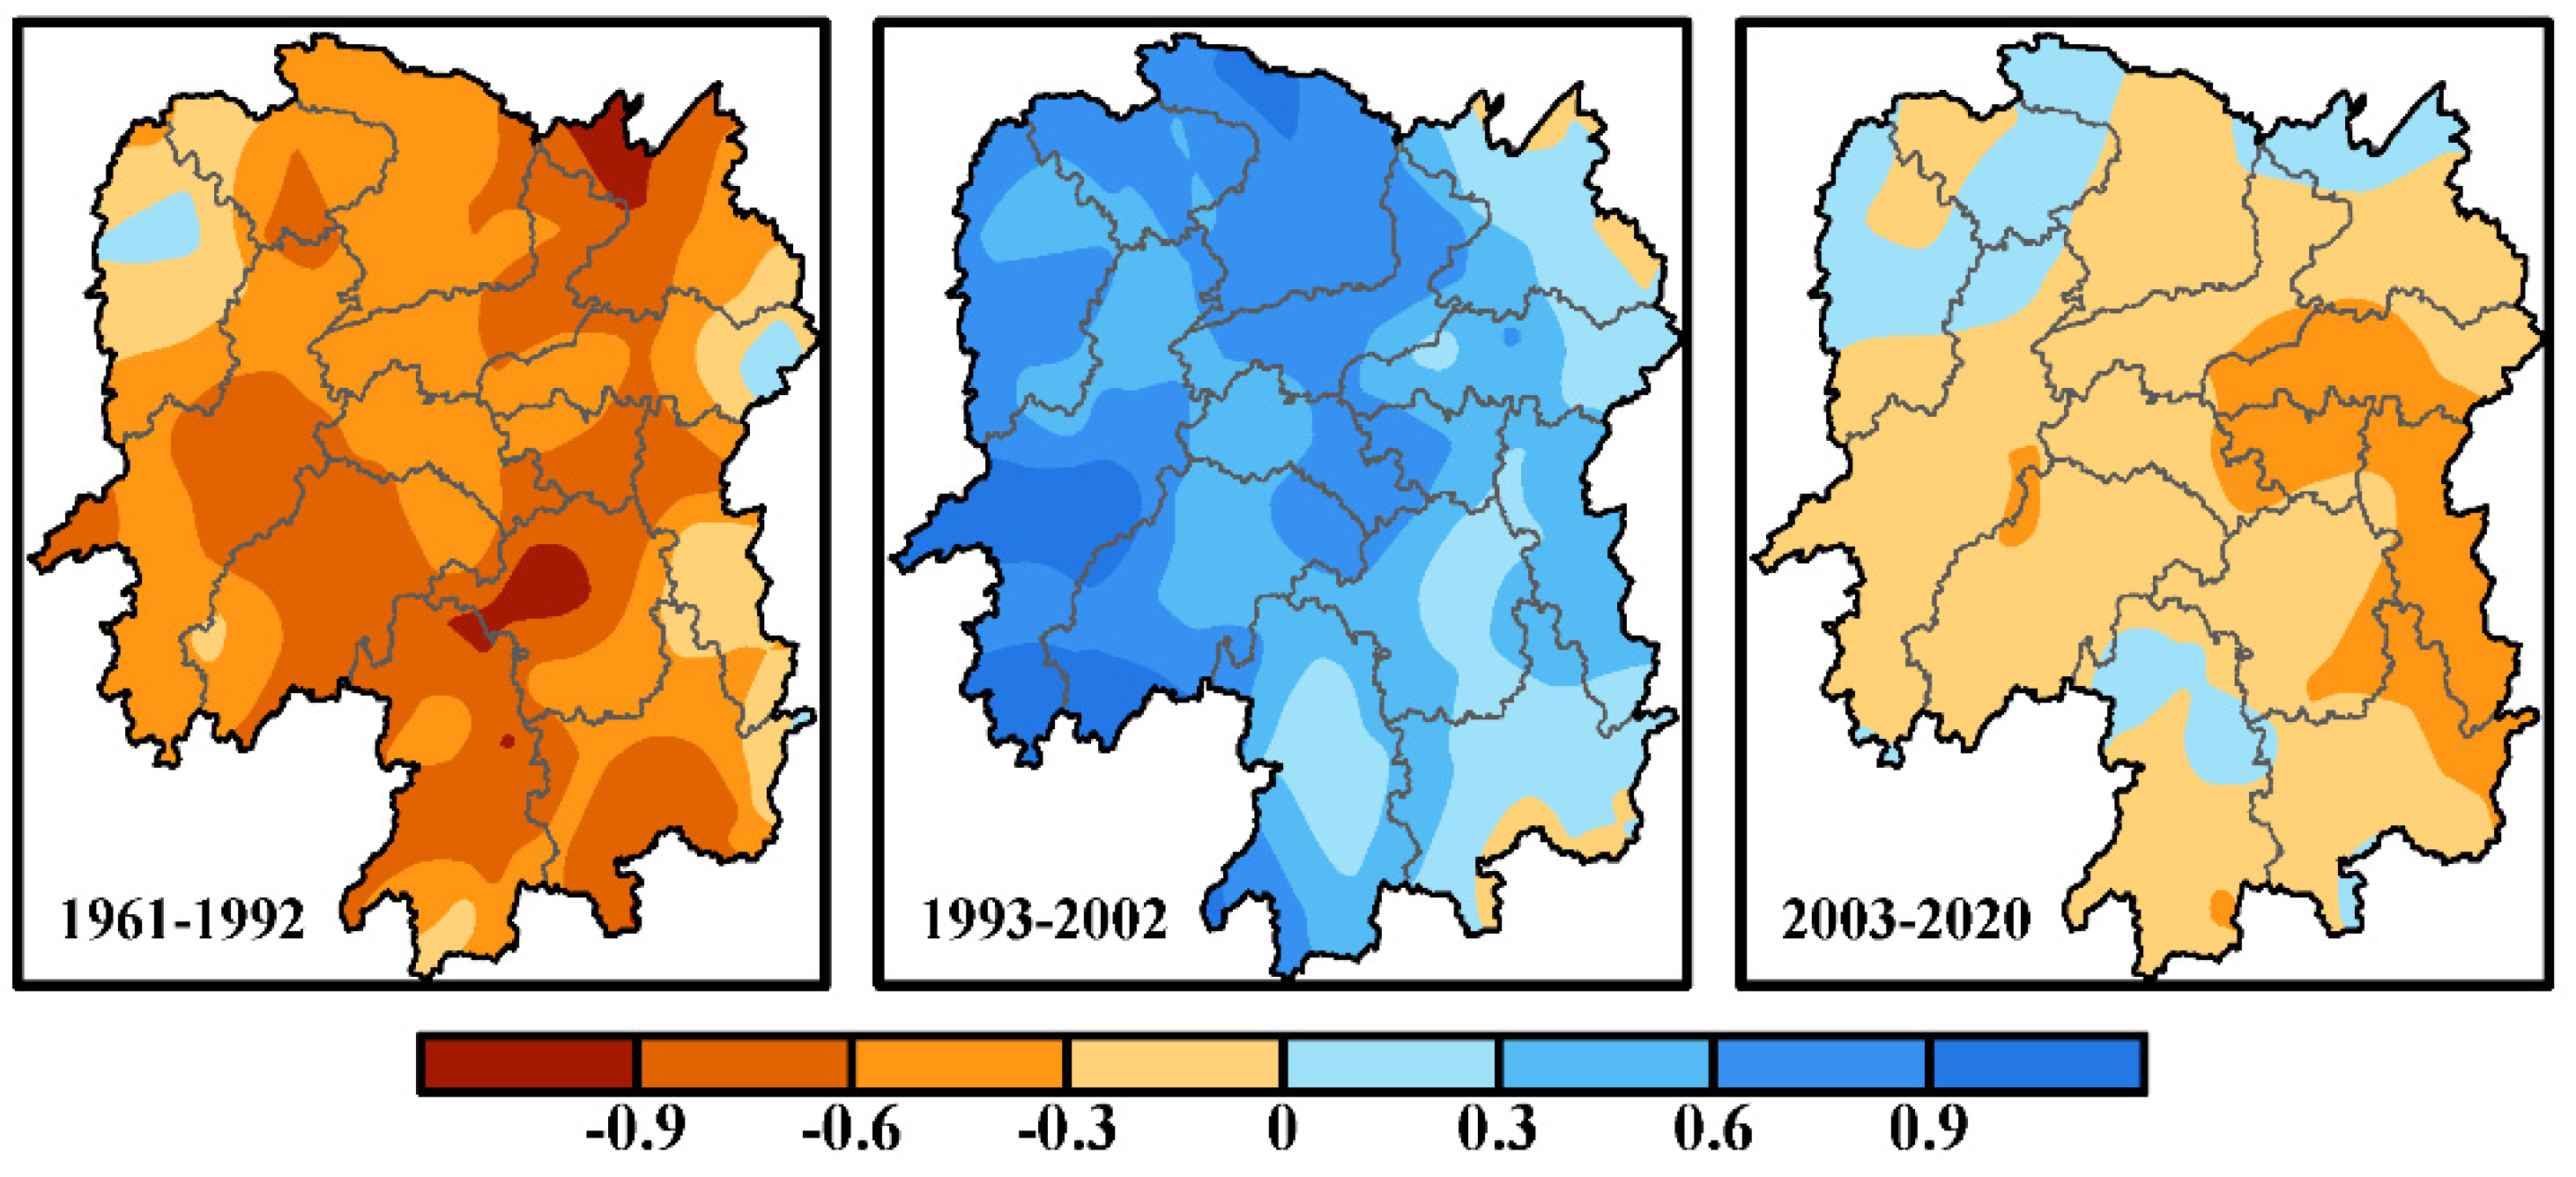
Figure 3 shows that the SPI sequence over the Dongting Lake basin has obvious decadal varaitions, and there are two obvious abrupt changes (drought-flood state transition) in 1993 and 2003. Therefore, the state of the drought or flood over the Dongting Lake basin can be divided into three periods: 1961–1992, 1993–2002 and 2003–2020, all of which experience the state transition of less precipitation-more precipitation-less precipitation (
Figure 4). Specifically, during 1961–1992, the drought intensity in central and southeast Hunan is stronger; during 1993–2002, the waterlogging in western and northern Hunan is more obvious; during 2003–2020, the drought intensity in the east of central Hunan and the waterlogging in northern and western Hunan are stronger. The spatial distribution of the SPI values demonstrates that there are significant differences in the spatial distributions of the drought-flood conditions before and after the transition in 1993.
3.2. Circulation Background of the Drought-Flood Transition over the Dongting Lake Basin
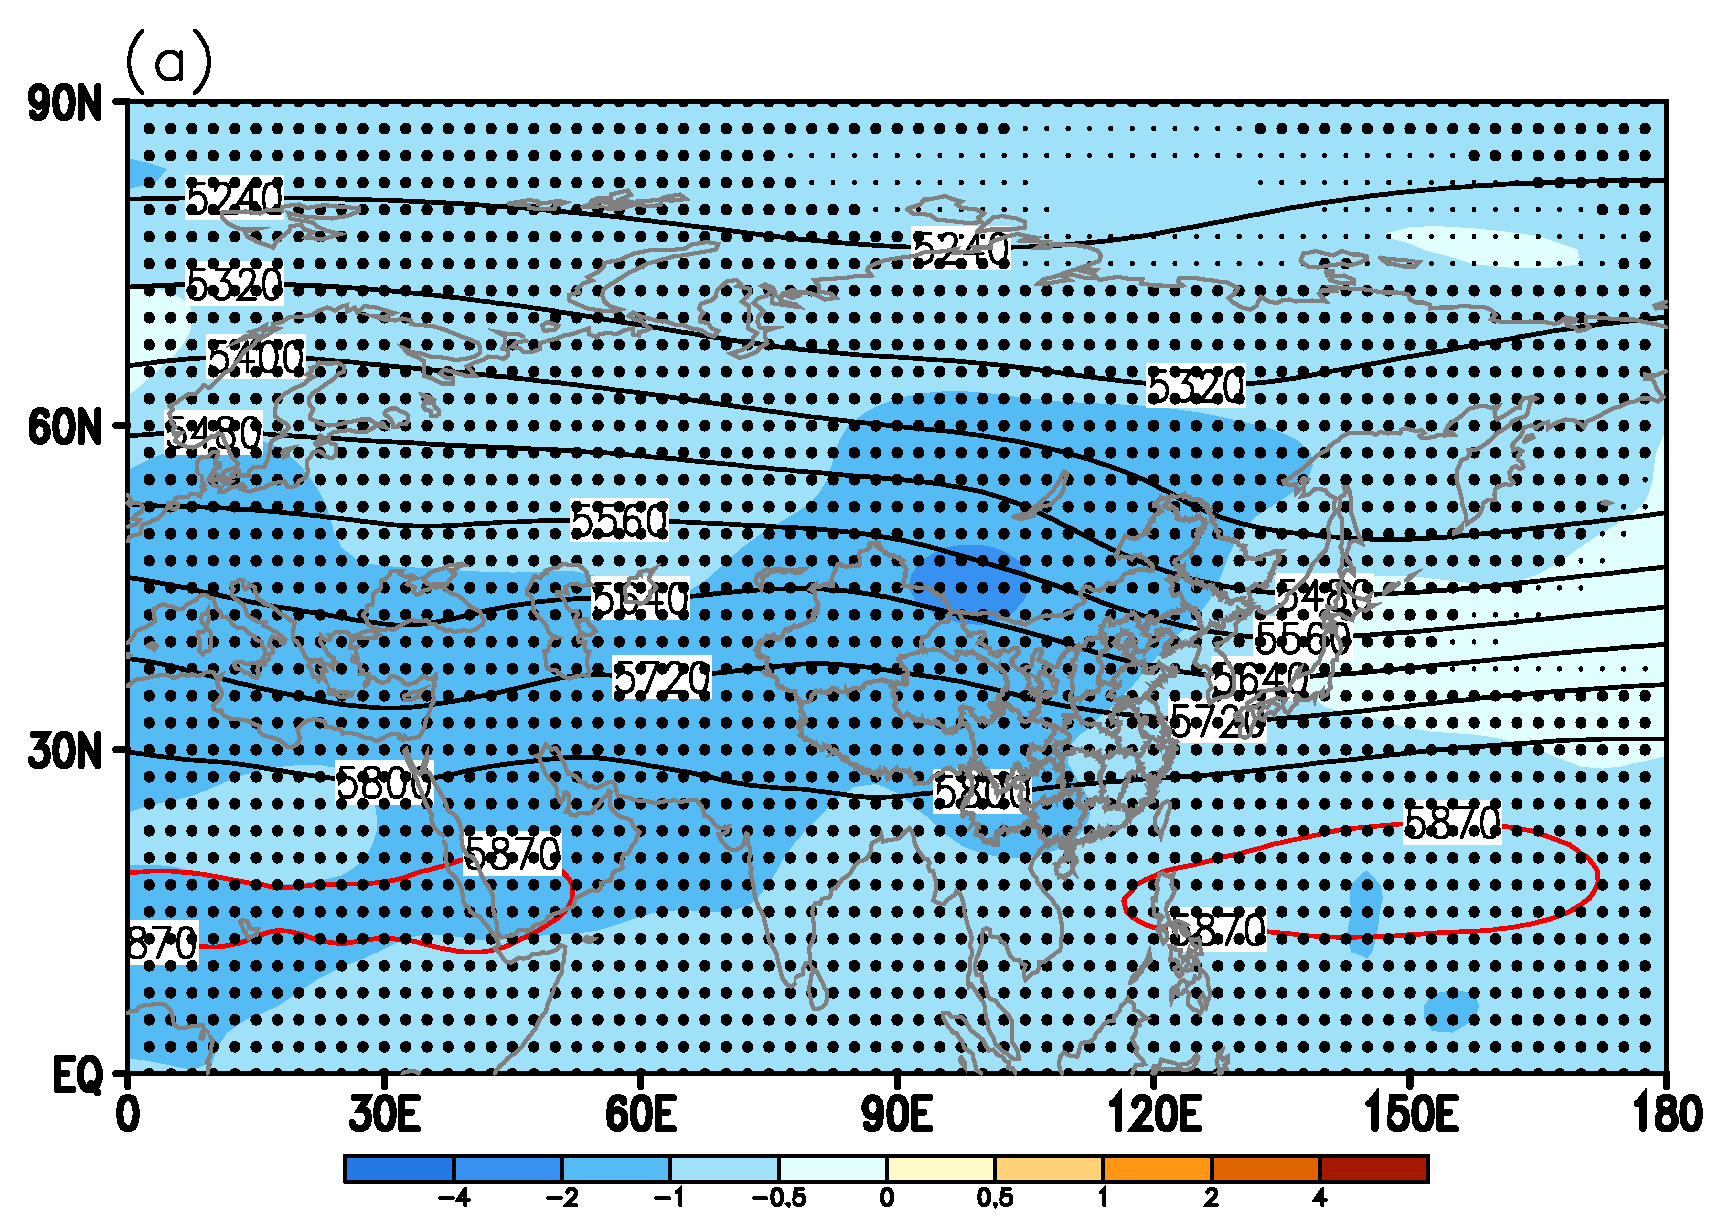
The above analysis shows that the Dongting Lake basin has experienced less precipitation—more precipitation—less precipitation state transitions in three periods of 1961–1992, 1993–2002 and 2003–2020. In order to explore the circulation backgrounds for drought-flood state transitions over the Dongting Lake basin under different decadal backgrounds, the 500-hPa geopotential height and 200-hPa zonal wind are analyzed in this section.
The low-pass filtering is carried out on the 500-hPa geopotential height to filter out the inter-annual components below 10 years.
Figure 5 shows the fields of 500-hPa geopotential height and the composite anomalies corresponding to different decades over the Dongting Lake basin. In the first stage of the drought-flood transition (
Figure 5a), the intensity of the polar vortex in Asian is strong, and there are significant negative anomalies over the Ural Mountains and the Okhotsk Sea, which is unfavorable to the development of the blocking highs over the Ural Mountains and Okhotsk Sea. For the mid-latitude region over the Asia continent, there are also significant negative anomalies, resulting in the relatively straight westerly circulation, which is unfavorable for the southward movement of cold air. Meanwhile, the western Pacific subtropical high (WPSH) is significantly weak, which is not beneficial to the transportation of the warm and humid airflow from the western Pacific and the South China Sea to southern China. This circulation configuration leads to less rainfall in this decade over the Dongting Lake basin. In the second stage of the drought-flood transition (
Figure 5b), the field of 500-hPa geopotential height and corresponding composite anomalies show that the polar vortex is slightly weaker, and the Eurasian mid-high latitudes present a distribution of two-trough and one-ridge. Specifically, the Ural Mountains and its western area as well as the Okhotsk Sea are controlled by significant negative anomalies of geopotential height, indicating weak blocking highs over the Ural Mountains and the Okhotsk Sea. The Lake Baikal and its southern area are dominated by the ridge with obvious meridional circulations, which is beneficial to the southward movement of the cold air to affect China. Meanwhile, the westward extension and enhancement of the WPSH are more significant compared with that in the previous stage, and the Dongting Lake basin is located in the southward water vapor conveyor belt to the west side of the WPSH, which are favorable to more precipitation in this decade over this region. In the third stage of the drought-flood transition over the Dongting Lake basin (
Figure 5c), the Eurasian mid-high latitudes are controlled by positive anomalies of geopotential height. The blocking highs over the Ural Mountains and the Okhotsk Sea significantly strengthen, which is not conducive to the southward movement of cold air. This is also consistent with the overall background of higher decadal temperature. At this stage, the WPSH is obviously stronger with larger area and westward position, and the ridge line is obviously northward to its normal position. The main rain belt is located in northern China, while the weather to the south of the Yangtze River is sunny, hot with less rain under the control of the WPSH.
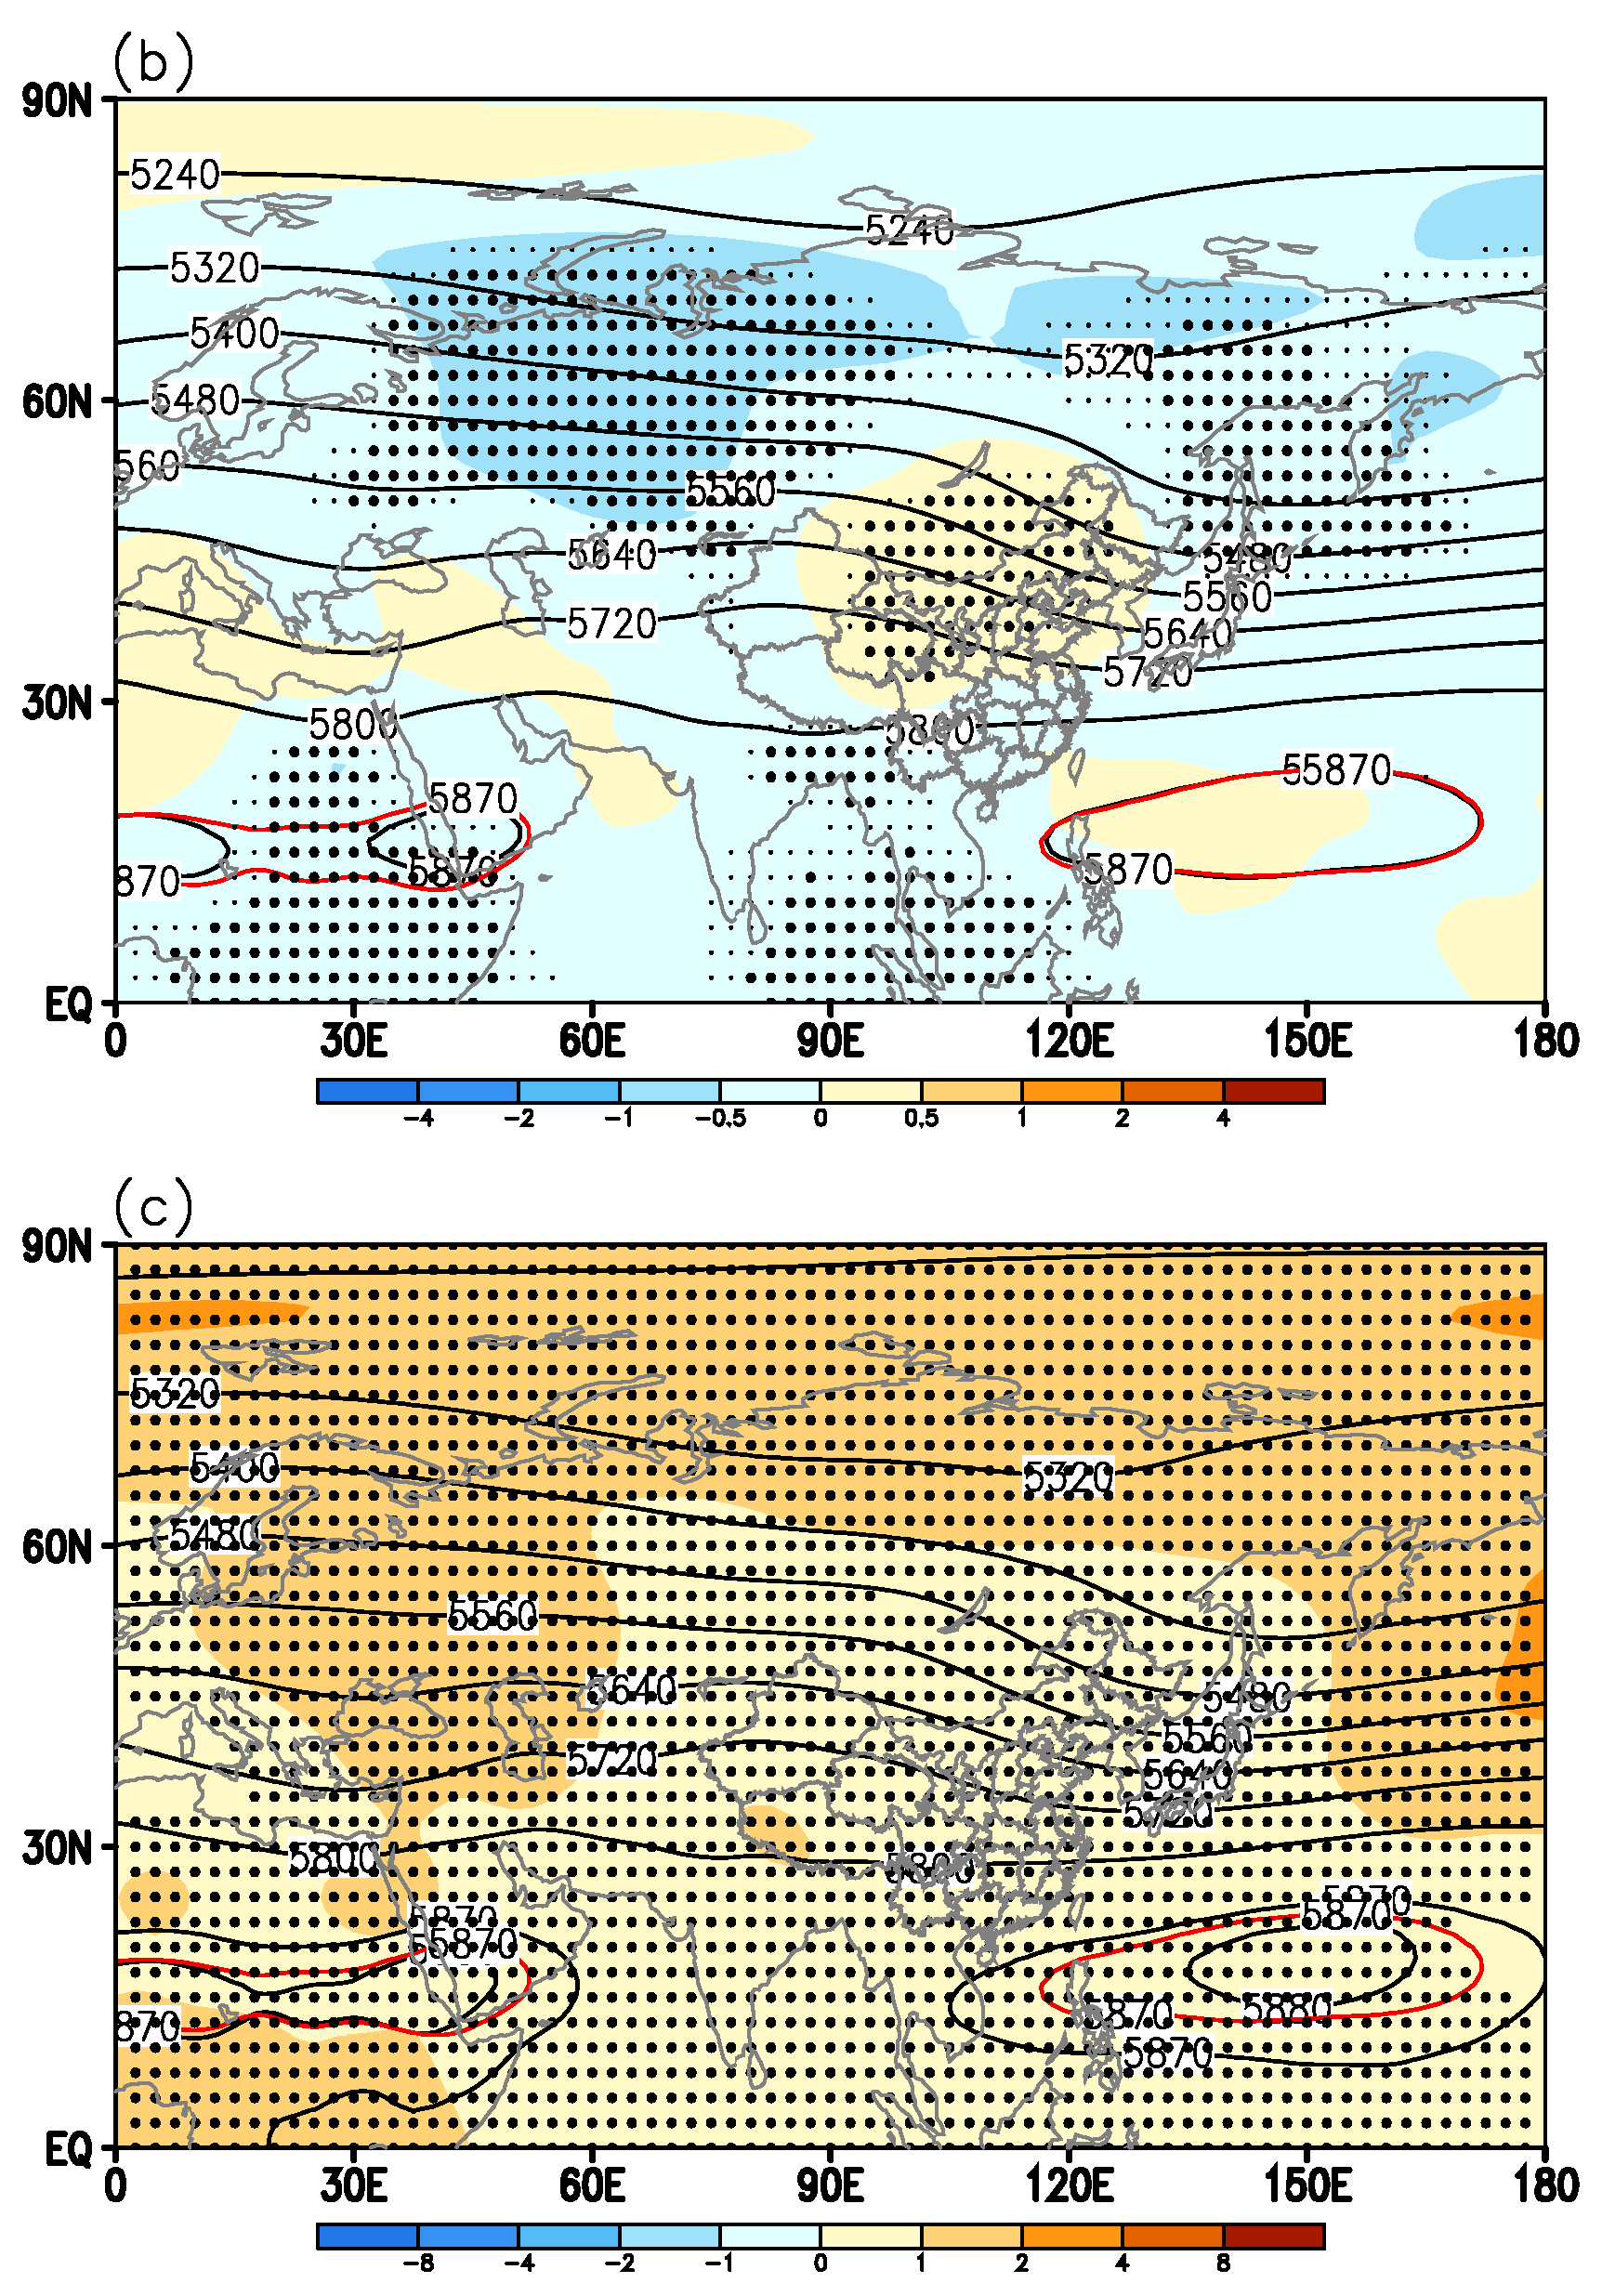
Figure 6 shows the 200-hPa zonal wind and the composite anomalies corresponding to different decades over the Dongting Lake basin. In the first stage (
Figure 6a), the 200-hPa zonal wind over the mid-latitude region in eastern Asia presents a significant “positive-negative” distribution, where positive zonal wind anomalies appear over the northern region of China, and negative zonal wind anomalies over the southern region. This reveals that the location of the westerly jet is more northerly and easterly than its normal position. Therefore, it is difficult for the cyclonic disturbance in the westerlies to affect the southern region of China, leading to less rainfall in the Dongting Lake basin. In the second stage (
Figure 6b), the circulation is obviously opposite to that of the previous stage. Negative zonal wind anomalies prevail over the northern region of China, while positive zonal wind anomalies over the southern region, which implies that the location of westerly jet is more south than its normal location, thus leading to significantly more-than-normal precipitation over the Dongting Lake basin. In the third stage (
Figure 6c), the distribution of 200-hPa zonal wind over the eastern part of the mid-latitude in the Asia continent is similar to that in the first stage, posing a “positive and negative” distribution pattern from north to south. The location of westerly jet stream is slightly norther than normal, causing less precipitation over the Dongting Lake basin, but not as significant as that in the first stage. The results are consistent with the conclusions in previous studies [
4,
54].
3.3. Early-Warning Signals for the Drought-Flood State Transition over the Dongting Lake Basin Based on the Variance
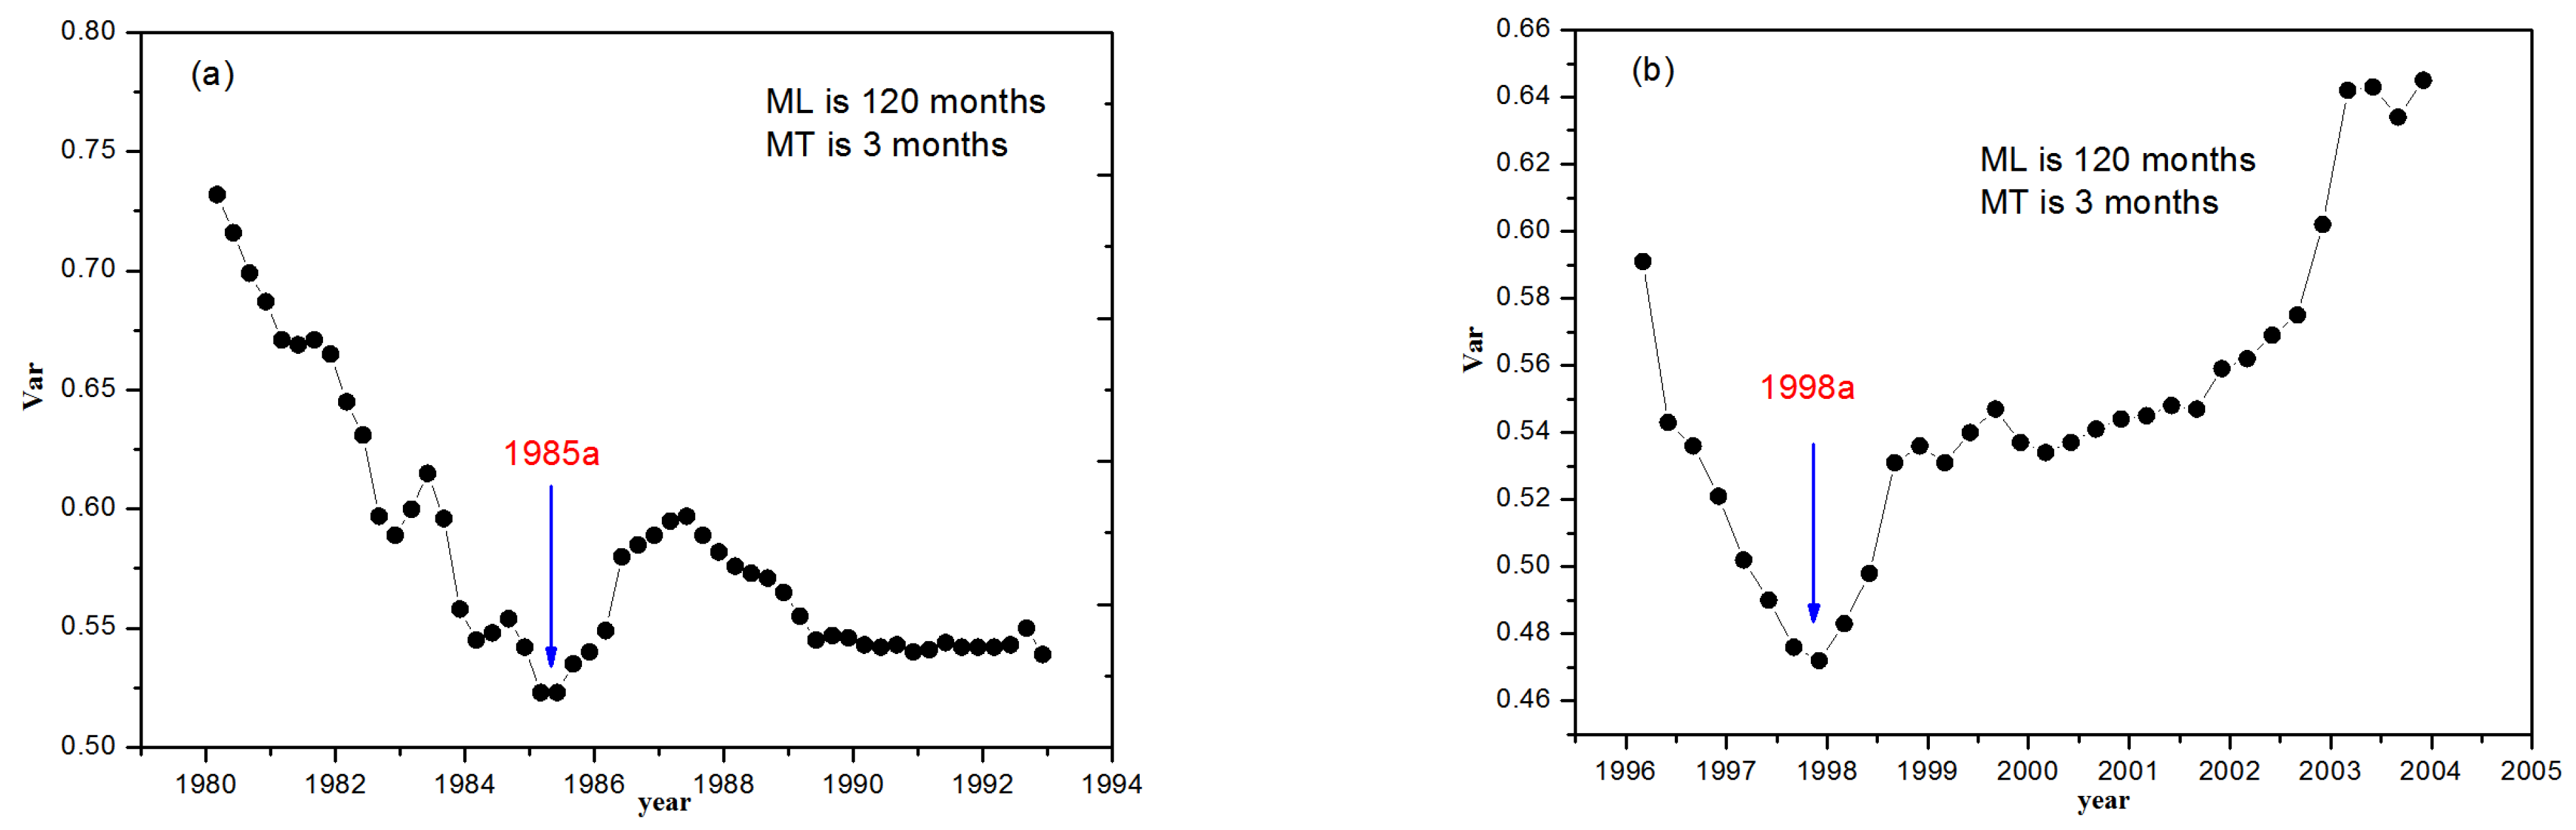
At the beginning of the 21st century, scientists found that the critical slowing down theory has important potentials in studying the early-warning signals for complex dynamical systems. This section explores the early-warning signals for the drought-flood state transition over the Dongting Lake basin by the variance that characterizes the phenomenon of critical slowing down.
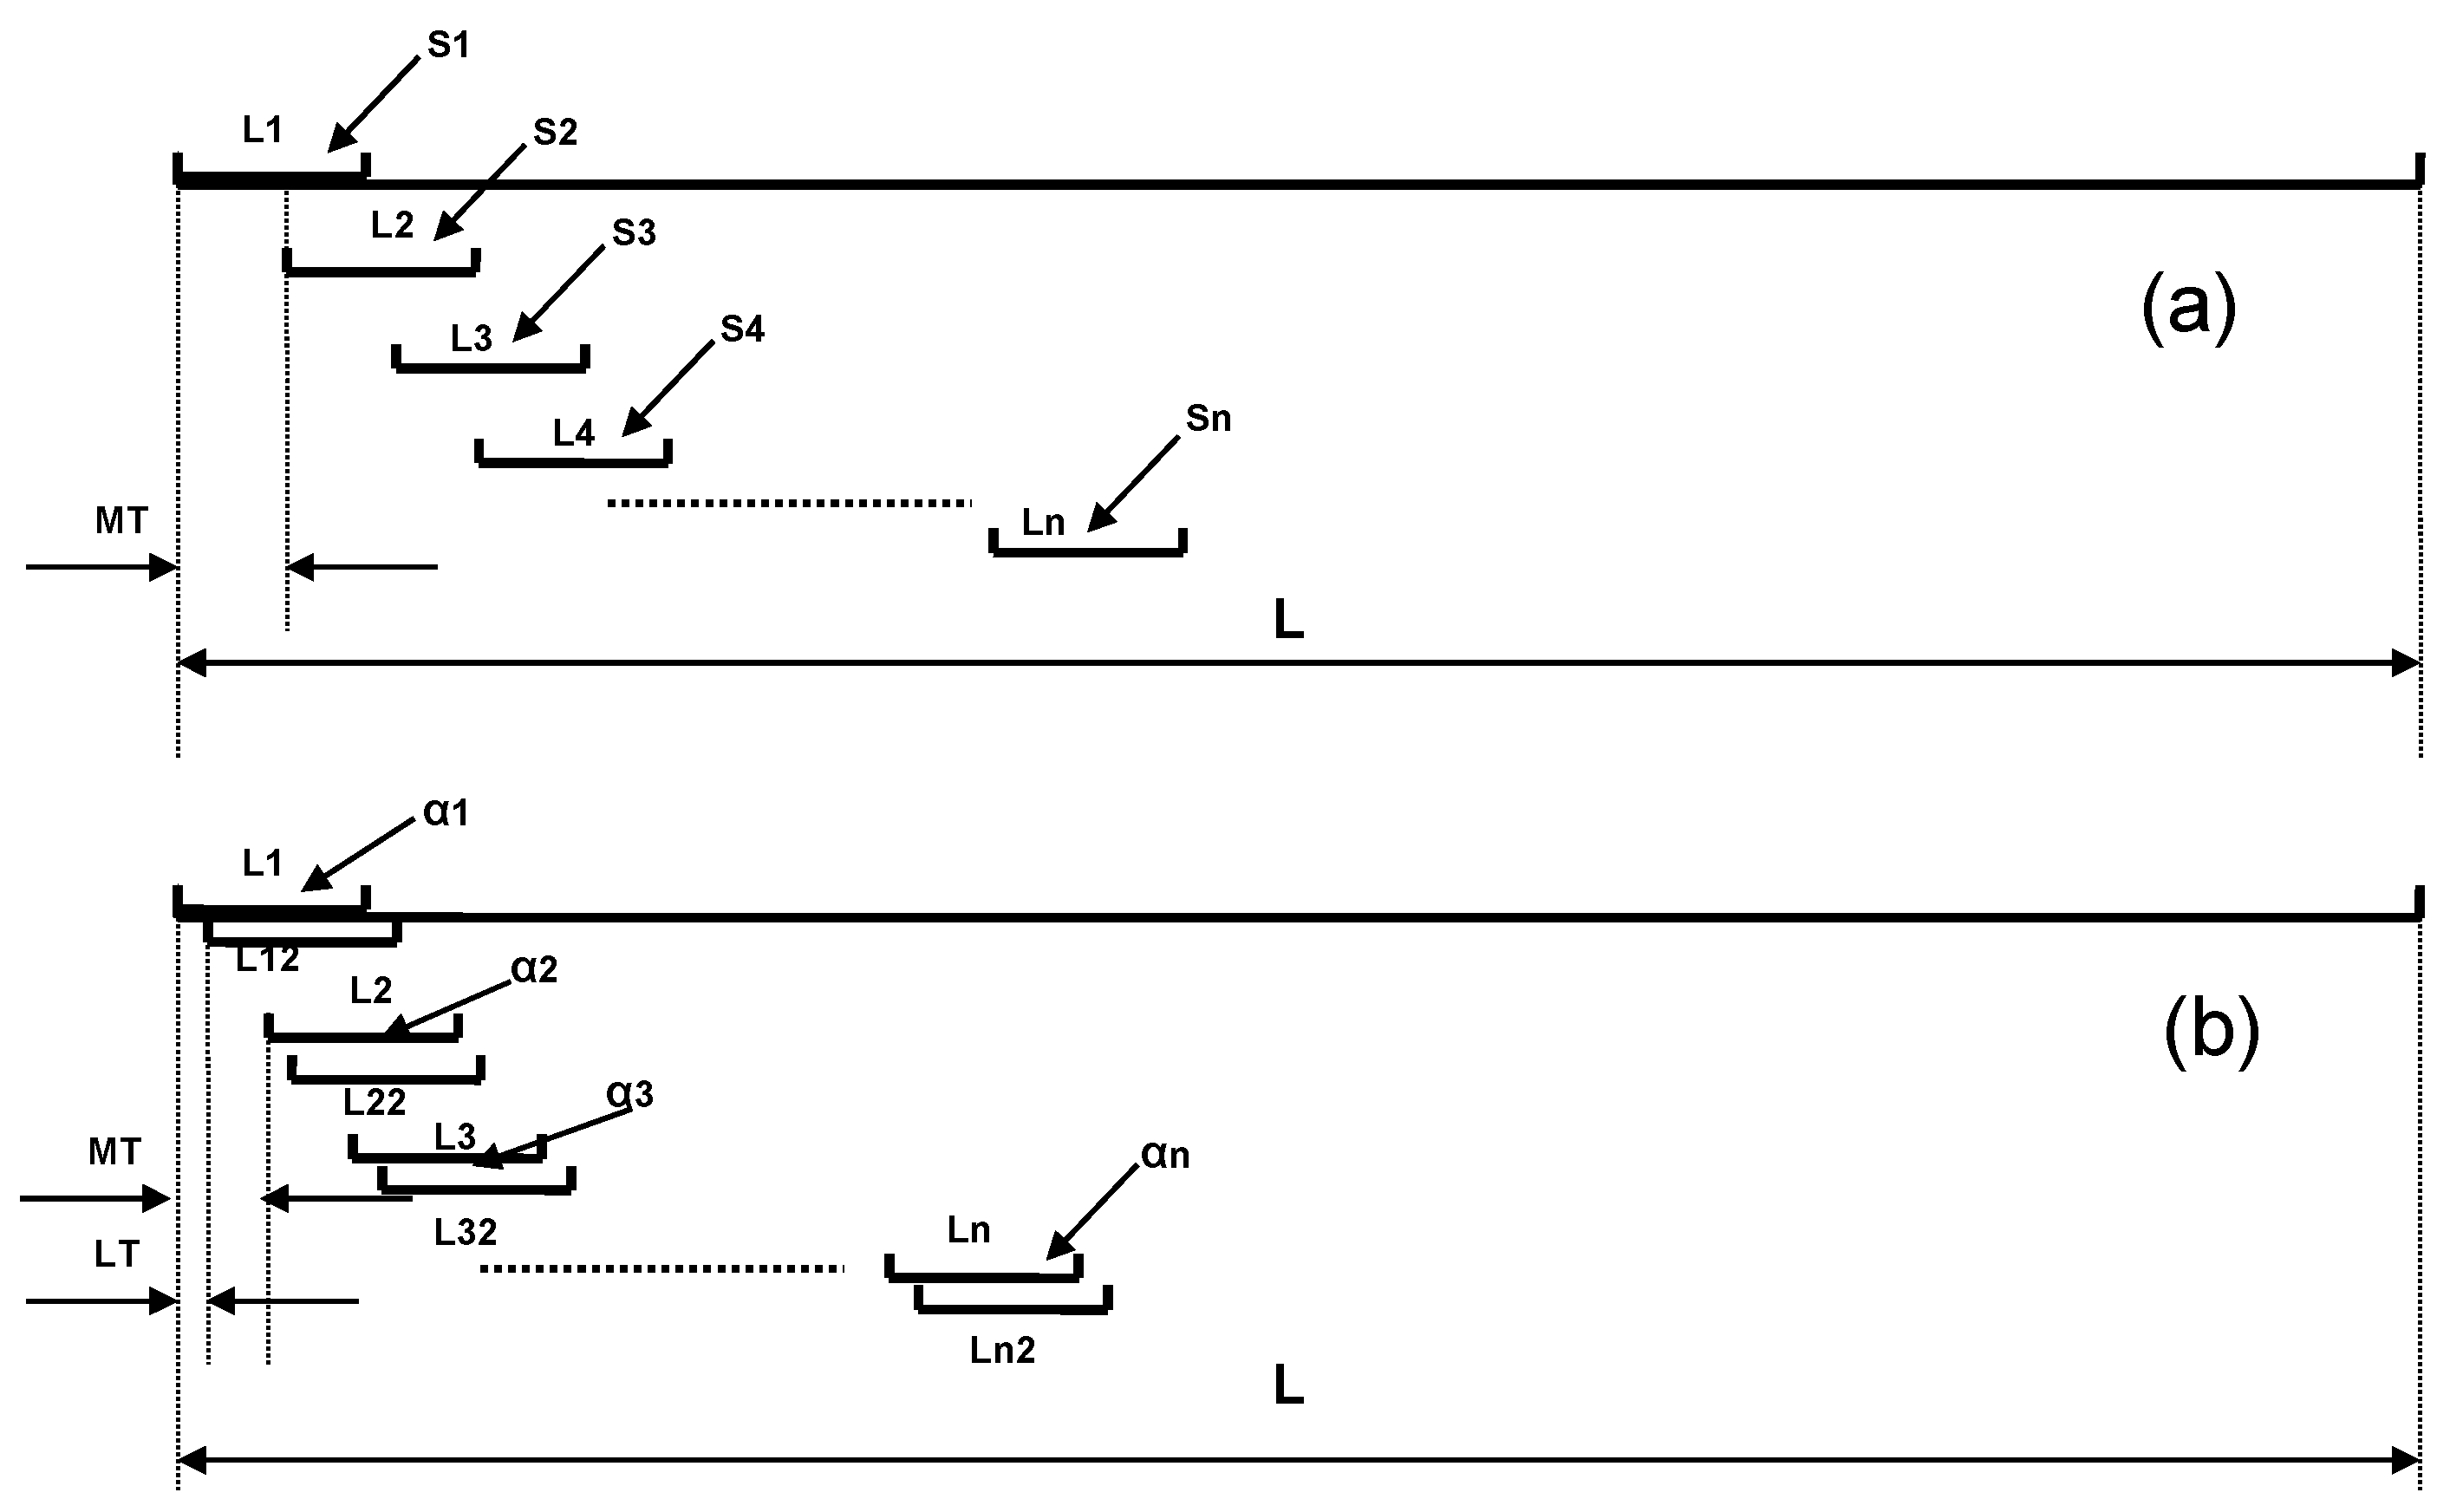
Figure 7 shows the detection of the abrupt changes in the SPI sequence over the Dongting Lake basin based on the variance signal. Here, ML in this study is set to 120 months (10 years), and the MT is set to 3 months. For the variance of the sequence, the window width and the MT, please refer to
Figure 1.
Figure 7a shows the variance-based detection of the SPI sequence for the abrupt change in 1993. As shown in
Figure 1, by sliding forward a fixed-width window with fixed MT in the SPI sequence, a new sequence is obtained in the fixed-width window with the new location. The variance is further calculated for this new sequence. The arrow in
Figure 7a illustrates that the variance starts to increase around 1985. The above theoretical analysis shows that the critical slowing down leads to the decrease in the internal change rate of the drought-flood state, and the similarity between the states at any time and the previous state in the complex nonlinear system as well. Thus, the autocorrelation coefficient is close to one, and the variance is close to infinity according to Formula (3). Therefore, the critical slowing down phenomenon of increasing variance when the complex nonlinear system approaches to the critical point might be an early-warning signal for the abrupt change in complex nonlinear system. It is considered that the early-warning signal for the drought-flood state transition over the Dongting Lake basin occurs around 1985. It can be seen that the early-warning signal is about 8 years ahead of the abrupt change in the SPI sequence, indicating that the variance acts as a good indicator for the prediction of the drought-flood state transition. Similarly, the variance signal for the abrupt change of the SPI sequence in 2003 over the Dongting Lake basin appears in 1998 (in
Figure 7b). The critical slowing down based on increasing variance is a potential early-warning signal for the drought-flood state transition over the Dongting Lake basin.
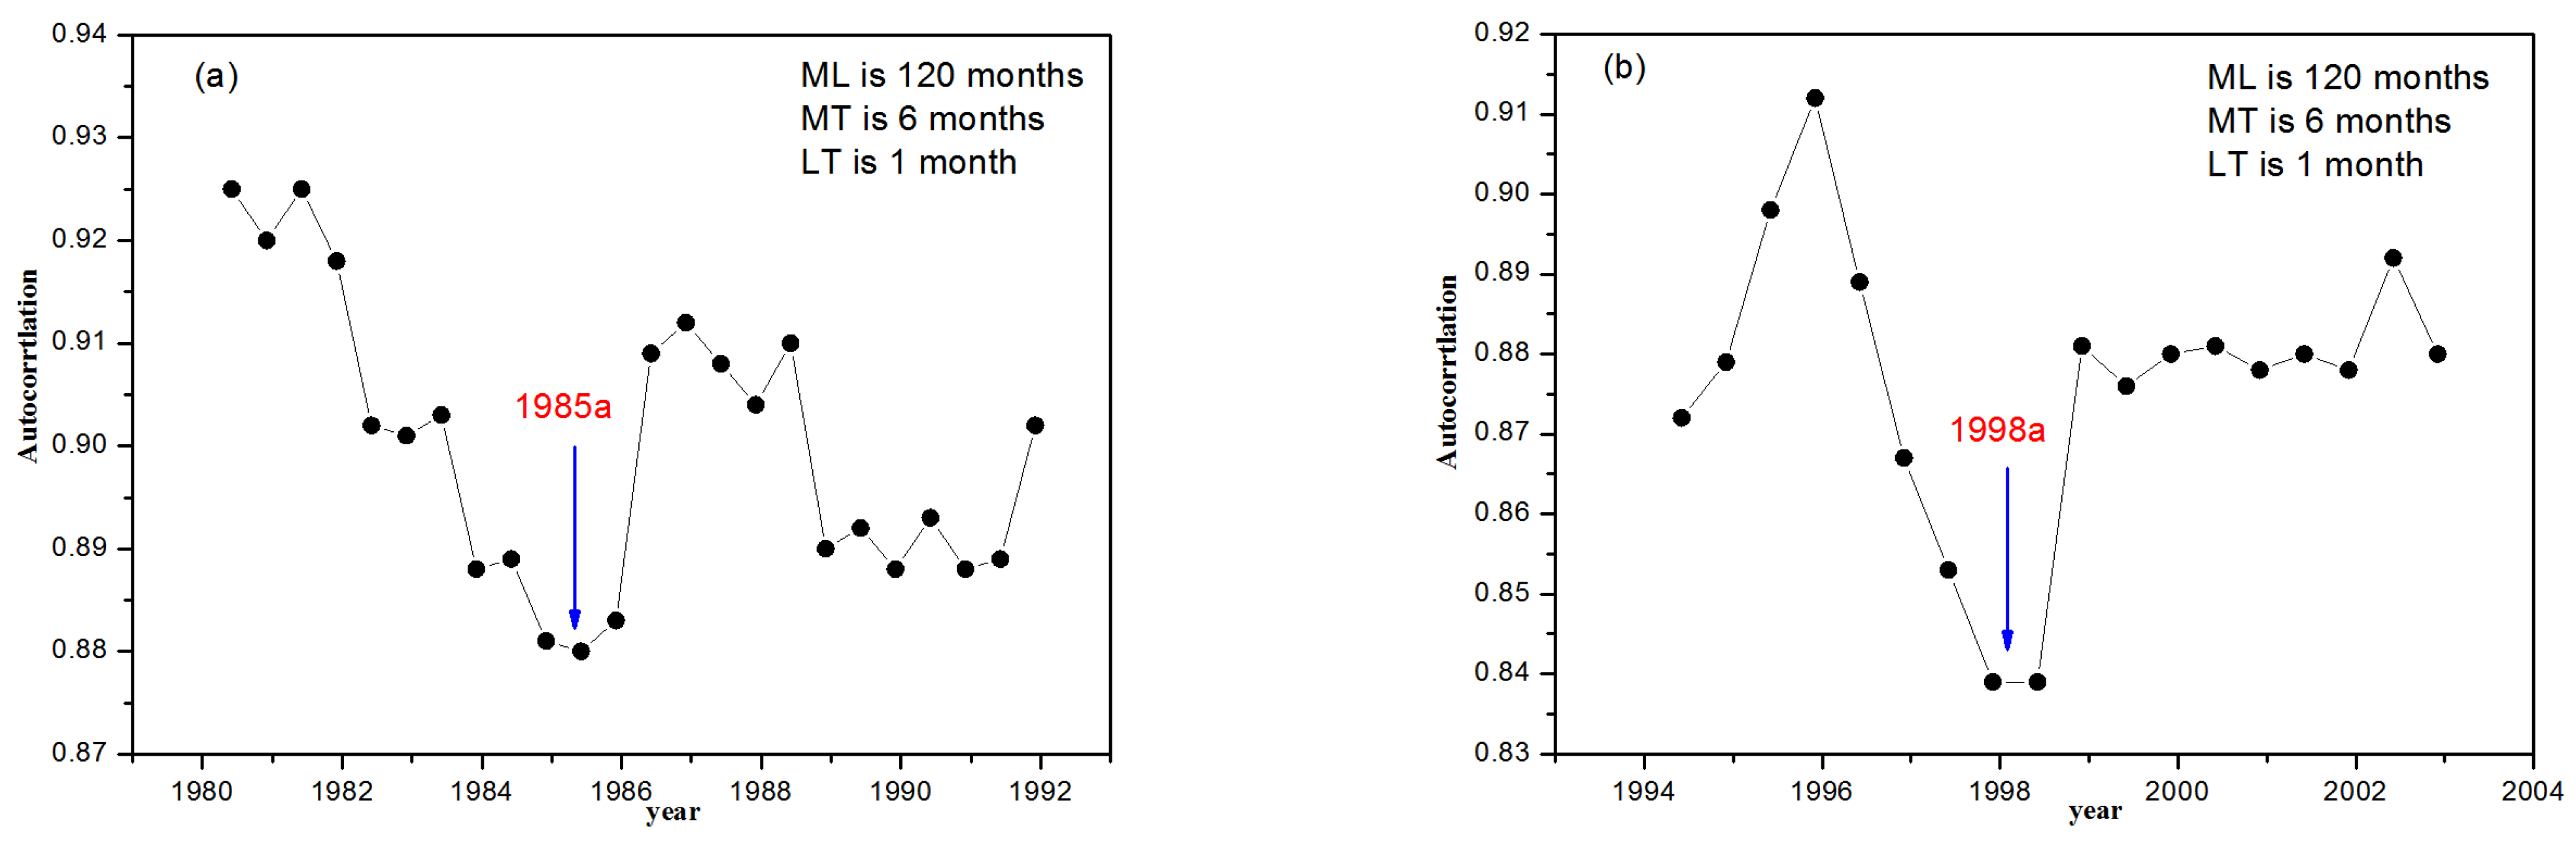
3.4. Early-Warning Signals for the Drought-Flood State Transition over the Dongting Lake Basin Based on the Autocorrelation Coefficient
According to the above studies, the critical slowing down phenomenon based on the increasing variance can be used as an early-warning signal for the drought-flood state transition over the Dongting Lake basin. In this section, another quantity that characterizes the critical slowing down theory, the autocorrelation coefficient, is used to explore the early warning signals for the drought-flood state transition over the Dongting Lake.
Figure 8 shows the autocorrelation coefficient signal-based detection of the abrupt changes in the SPI sequence over the Dongting Lake basin. Similarly, ML in this study is set to 120 months (10 years), the MT is set to 6 months, and the lag time (LT) is set to 1 month. The variance of the sequence, window width and MT are shown in
Figure 1. As shown in
Figure 1, by sliding forward a fixed-width window with one fixed LT in the original SPI sequence, another sequence with the same length as the sequence in the original window is obtained. The correlation between the obtained sequence and the original sequence is calculated, thus obtaining the lag autocorrelation for the sequence itself. The MT is the same as described in the variance signal section.
Figure 8a displays the autocorrelation coefficient-based detection for the abrupt change of the SPI sequence in 1993. The autocorrelation coefficient begins to increase from year marked with an arrow in
Figure 8a. As the critical slowing down leads to the decrease of the internal change rate in the drought-flood state and the state of complex nonlinear system at any time is becoming more and more similar to its previous state, the autocorrelation coefficient of the SPI sequence is close to one. It is considered that the early-warning signal for the drought-flood state transition in 1993 appears around 1985. Therefore, the early-warning signal of the increasing autocorrelation coefficient appears eight years before the drought-flood state transition over the Dongting Lake basin in 1993, which serves as a good indicator for the prediction of the drought-flood state transition over the Dongting Lake basin. Similarly, the autocorrelation coefficient signal for the abrupt change over the Dongting Lake basin in 2003 appears in 1998 in the SPI sequence. Therefore, in view of the two drought-flood state transitions of the SPI sequence over the Dongting Lake basin, the early-warning signal of increasing autocorrelation coefficient for abrupt changes appears 5–10 years before the state transition. The critical slowing down phenomenon based on the increasing autocorrelation coefficient is a potential early warning signal for the drought-flood state transition over the Dongting Lake basin.
Note that when the data amount remains constant, the larger the window width and the longer the MT, the more stable the result will be. Variations in window width and LT do not influence the occurrence of the signal, but only affect the signal stability. Related studies are detailed in Wu et al. [
25,
26,
27,
28], which will not be covered here.
In summary, when the drought-flood system approaches the critical point, the phenomena of critical slowing down will occur, featured by increasing variance and increasing autocorrelation coefficient, indicating the occurrence of a drought-flood state transition. Based on the variance and autocorrelation coefficient, the occurrence times of the early-warning signals for the drought-flood state transition are basically the same, which further proves the feasibility to explore the early warning signals for the drought-flood state transition based on the critical slowing down theory.
4. Conclusions and Discussions
In view of the complex nonlinear characteristics of the drought-flood state transition, the theories and methods related to the nonlinear science are adopted for investigation in this study. First, the MTT method is performed on the SPI sequence over the Dongting Lake basin in recent 60 years for detecting the drought-flood state transitions. Afterwards, the physical basis and statistical significance of the critical slowing down phenomenon are further introduced. On this basis, the theory of critical slowing down is used to explore the early-warning signals for abrupt changes in the SPI sequence over the Dongting Lake basin. The conclusions are as follows.
Detection on the SPI sequence over the Dongting Lake basin reveals that there are two significant drought-flood state transitions, namely the drought-to-flood event in 1993 and the flood-to-drought event in 2003.
- (1)
By analyzing the 500-hPa geopotential height and 200-hPa zonal wind, it is found that the circulation backgrounds during 1961–1992 and 2003–2020 are favorable for less precipitation and drought over the Dongting Lake Basin. While the circulation backgrounds during 1993–2002 results in more precipitation and even floods over the Dongting Lake basin.
- (2)
The critical slowing down phenomena with the increases in variances and autocorrelation coefficients appear 5–10 years before the two drought-flood state transitions, indicating the feasibility of exploring the early-warning signals for drought-flood state transitions based on the critical slowing down theory.
- (3)
The critical slowing down phenomena with the increases in variances and autocorrelation coefficients appear 5–10 years before the two drought-flood state transitions, indicating the feasibility of exploring the earlywarning signals for drought-flood state transitions based on the critical slowing down theory.
Through the study on the drought-flood state and related early-warning signals over the Dongting Lake basin, the reliability of the early-warning signals of the variance and autocorrelation coefficient characterizing the critical slowing down phenomenon in detecting abrupt changes is demonstrated. Besides, the introduction of the critical slowing down theory is of important practical significance and scientific value for deep understanding of drought-flood state transition and for exploring the early warning signals of its state transition based on the SPI sequence. Furthermore, the extensive application of this method is expected to provide important scientific and technological support for disaster prevention and mitigation over the Dongting Lake basin and even in the middle and lower reaches of the Yangtze River. Note that although the the results of the present manuscript show that the increasing variances and autocorrelation coefficients caused by the critical slowing down phenomenon are potential early warning signals, and more robust conclusions require more experiments and applications to confirm. The confidence probability of early warning signals, the circulation characteristics, the characteristics of external forcing changes, and the relationship between the critical slowing down phenomenon and the intensity/amplitude of abrupt changes before and after the transitions still need to be further studied.
This paper studies a method that can identify the early warning signal of Drought-Flood state transition in a long period of time in the future, which strictly belongs to the category of climate shift. The climate shift is not necessarily a hazard per se, but it will have a great impact on the frequency, intensity and duration of hazards. The early warning signal of climate shift can warn the change and remind people to be prepared for the possible consequences of this change. For example, we can study some specific disasters and determine the threshold of precipitation which can lead to disaster, such as flood and landslide [
55]; in addition, the high-risk locations of disasters can be determined in the region with reference to the disasters that have occurred in the previous more Rainy period or less rainy period and their impacts, and the probability of possible disasters in the future can be estimated in combination with the current exposure and vulnerability.
EWS involves six aspects [
27]: (1) What is happening with respect to the hazards and/vulnerabilities? (2) When are the impacts likely to occur? (3) Where are at risk? (4) Who are at risk? (5) What causes the risk? (6) How can EWS play a better role, whether it is for a specific hazard or guiding a long-term risk response process? For drought or flood disasters, the early warning signal of Drought-Flood state transition can answer the first question about hazards and the second question, as well as help to solve the sixth question. On the premise that the accuracy of climate model prediction needs to be further improved, the method in this paper can use the existing observation data to provide a new technology for early warning of climate transition. In addition, it can also analyze the influencing factors such as atmospheric circulation and sea surface temperature in time, so as to provide comparison and reference for improving the climate model.


