1. Introduction
Drought is one of the most serious natural disasters that human beings encounter [
1]. The Inner Mongolia Autonomous Region, located in the farming-pastoral ecotone, is one of the regions suffering from frequent meteorological disasters in China. In the context of global warming, the average amount of drought days in China is increasing overall, and the temperature in the Inner Mongolia Autonomous Region also continues to increase. Although it is a prosperous agricultural region, the Inner Mongolia Autonomous Region suffers from drought, which is at the top of the list of disasters there, causing significant economic losses. In 2018, the area suffering from droughts in China spanned 7.7118 × 10
6 hectares, and it reached 1.427 × 10
6 hectares in the Inner Mongolia Autonomous Region alone, accounting for 18.50% of the affected area of the whole country [
2]. Therefore, by adopting agricultural droughts as main research objects, the effective evaluation of the characteristics of agricultural droughts and correlation analysis can be conducted; this is crucial for daily life and economic development.
Previous studies have determined that droughts have a strong response to hydrological elements [
3]. Droughts are mainly caused by natural changes in the weather [
4]. Based on NOAA/NCEP’s Climate Forecast System Version 2 (CFSv2) data and Dynamic Recycling Model (DRM), Tirthankar Roy analyzed the roles of moisture transport and water cycles in two drought events (Texas (2011) and Upper Midwest (2012)) and found that precipitation and evapotranspiration were the strongest signals reflecting drought, and that water from land is conducive to alleviating this drought intensity [
5]. The precipitation change caused by atmospheric circulation will have a positive feedback to the soil moisture anomaly, thus prolonging the drought time [
6]. The interaction of soil moisture, atmospheric moisture flux, and precipitation is complex. The reduction in precipitation cycles is related to the reduction in water from upwind regions, since droughts in a region can reduce the local atmospheric moisture content [
7]. Soil moisture exerts a positive influence on precipitation in semi-arid and semi-humid areas, and a negative impact on humid areas [
8]. Therefore, it is not feasible to attribute the change of one variable to another. These studies show that the soil moisture and water cycles have important effects on the droughts in specific regions. The soil moisture is a comprehensive variable of various climate, vegetation, and soil characteristics, and plays a regulatory role in the crop water supply [
9]. The amount of the soil moisture affects the speed of the water supply through the atmospheric water cycle, and it is of great significance for studying agricultural droughts based on the soil moisture [
10].
The structure of this research is arranged as follows: The research data and methods are described in
Section 2.
Section 3.1 discusses the identification of the characteristics of agricultural droughts and the role of soil moisture in droughts. In
Section 3.2, by using a geographical detector, agricultural droughts are studied, and dominant factors and interactive factors are quantitatively identified. The drivers and explanatory power are revealed accurately. In
Section 3.3, the dependence structures of agricultural droughts with the precipitation conversion efficiency (PCE) and temperature are investigated based on a nonlinear copula function in order to find a balance between influence factors and droughts. The research results are discussed in
Section 4. The conclusions are made in
Section 5. Clarifying the characteristics and dominant factors of agricultural droughts can provide a scientific basis for combating droughts.
2. Materials and Methods
2.1. Study Region
The Inner Mongolia Autonomous Region is located in the northern part of China (97°12′~126°04′ E, 37°24′~53°23′ N), with a total area of approximately 1.18 × 10
6 km
2, which is 12.3% of the total area of the country. The region extends obliquely from the northeast to the southwest in a strip-like shape with complex terrain, and has an altitude of 89~3343 m. From the coast to the inland, with the continuous reduction in precipitation, the natural belt also changes from forest to grassland, and finally becomes desert. The mean annual temperature and mean annual precipitation are −4.5~9.8 °C and 50~450 mm, respectively, with uneven interannual distribution and obvious spatial east-west differences. The multi-year mean annual precipitation shows an upward trend in the west, a downward trend in the east, and a significant upward trend in select regions in the northeast. The precipitation decreases from the east to the west. On the basis of the zoning of four ecological regions in China [
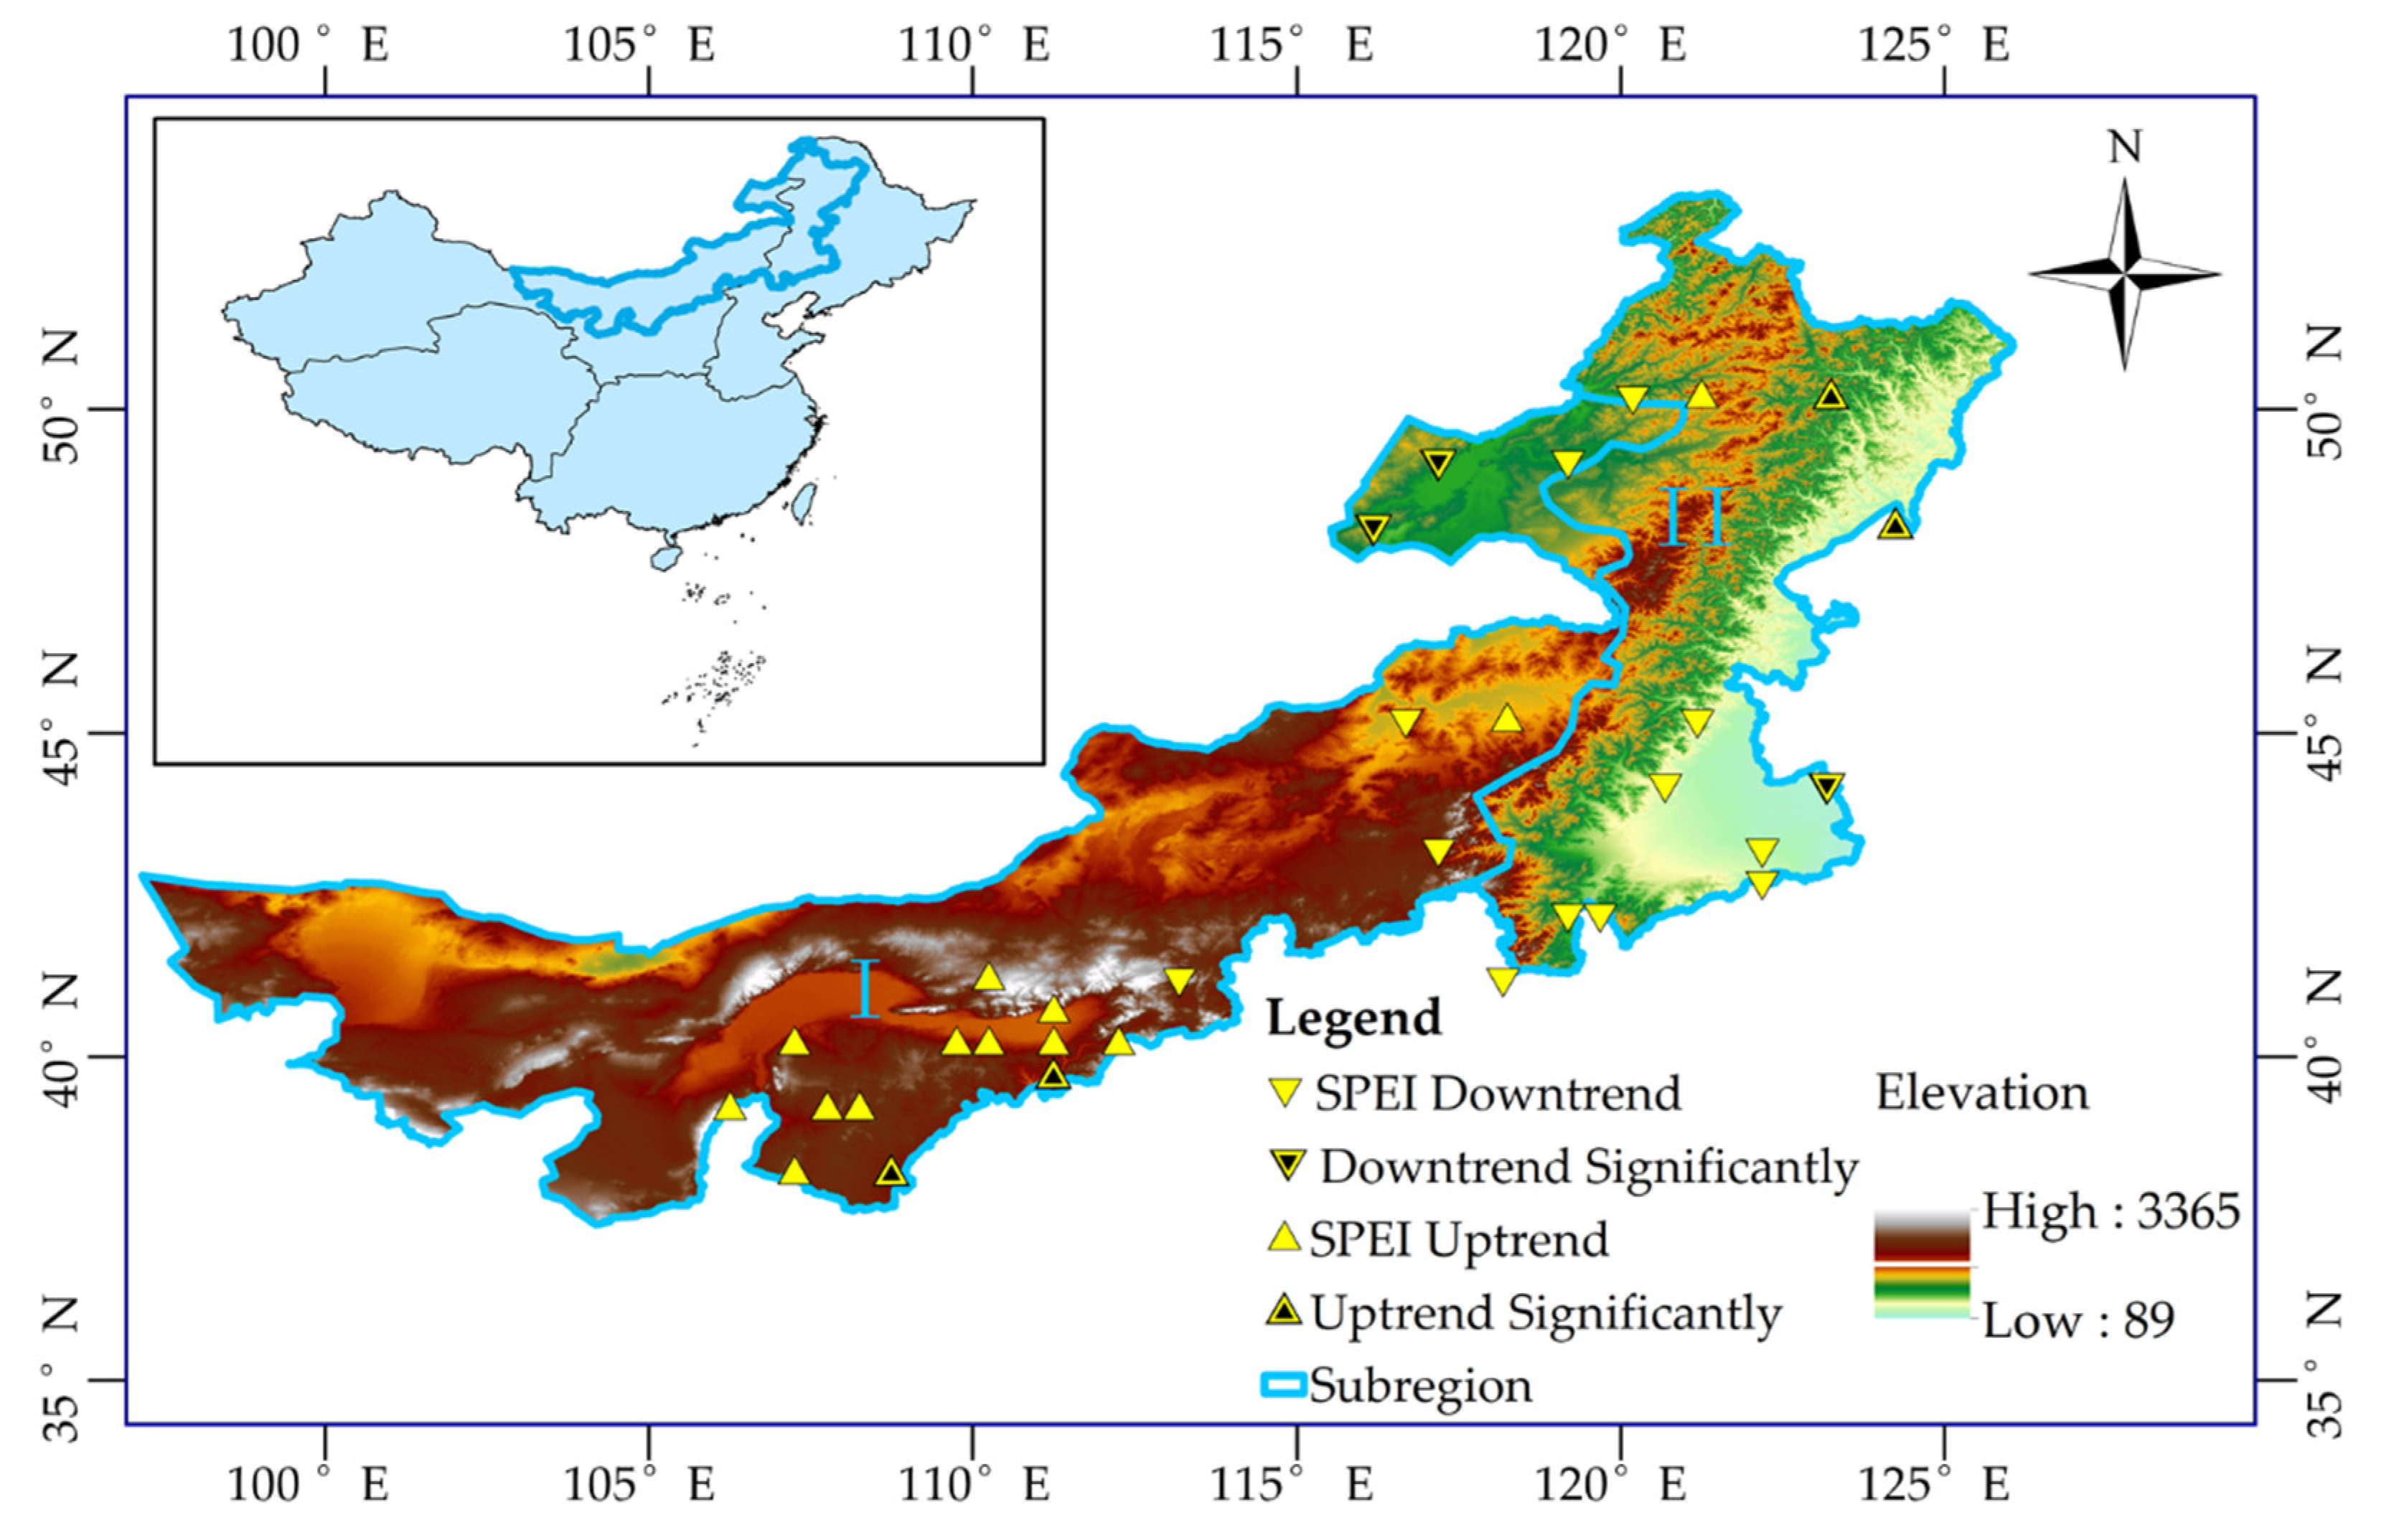
11], the Inner Mongolia Autonomous Region was divided according to its boundary. In
Figure 1, there is a depiction of Subregion I, an arid and semi-arid ecological region in the north (an ecological region of the Inner Mongolia Plateau), and Subregion II, a humid and semi-humid ecological region in the northeast (a northeast ecological region). Subregion I comprises the main arid, semi-arid, and livestock production areas in China, while Subregion II belongs to the main grain producing and primary forest distribution areas in China. The changes in the trend of the standardized precipitation evapotranspiration index (SPEI) at 32 stations in the Inner Mongolia Autonomous Region were analyzed through Man-Kendall test. Δ indicates that the test value is positive and shows an uptrend; ∇ indicates that the test value is negative and shows a downtrend. The presence of “·” in the center of the symbols represents significant uptrend or downtrend. Significant uptrend is found at four stations and significant downtrend is shown at three stations.
2.2. Data
2.2.1. Meteorological Data
The basic meteorological data in the research were obtained from the China Meteorological Data Sharing Service System (
http://data.cma.cn/, accessed on 30 August 2021), and data including monthly precipitation and temperature from 2000 to 2019 were collected from a total of 32 meteorological stations in the Inner Mongolia Autonomous Region. Spatial distribution data based on a Digital Elevation Model (DEM), Land Use and Cover Change (LUCC), Normalized Difference Vegetation Index (NDVI), Gross Domestic Product (GDP), and Population Grid China (POP) data were derived from the Resource and Environment Science and Data Center, Chinese Academy of Sciences (
http://www.resdc.cn/, accessed on 30 August 2021). The soil moisture data came from the second layer (7~28 cm) of the European Center for Medium-Range Weather Forecasts (ECMWF) fifth-generation global atmospheric reanalysis (ERA5) dataset. All data were strictly checked to ensure the accuracy.
2.2.2. Precipitation Conversion Efficiency
The data of specific humidity in the Inner Mongolia Autonomous Region at four atmosphere layers (500, 700, 850 and 1000 hPa) from 2000 to 2019 with a spatial resolution of 0.25° × 0.25° were obtained from the ERA5 dataset. The atmospheric precipitable water vapor (W) can be calculated through Formula (1).
where W and q represent the atmospheric precipitable water vapor (mm) and specific humidity (kg/kg), respectively; Ps and Pt separately indicate the upper and lower atmospheric pressures (hPa). The ability to convert the atmospheric precipitable water vapor into the actual precipitation is the PCE, which can be deemed as the conversion efficiency from water vapor to precipitation in a certain period. The PCE can be calculated according to Formula (2).
where P and W denote the actual precipitation (mm) per unit area and atmospheric precipitable water vapor (mm), respectively.
2.3. Methods
2.3.1. Geographical Detector
The geographical detector method is a statistical approach proposed by Jinfeng Wang et al. [
12] to detect spatial stratified heterogeneity and reveal the underlying driver by using explanatory power q (
http://www.geodetector.org, accessed on 30 August 2021). The core idea is that if an independent variable has an important impact on a dependent variable, they are similar in spatial distribution. Therefore, the geographical detector can be used to find the dominant spatial driver of a certain element [
13]. It can be classified as single factor detection, interactive detection, ecological detection, and risk area detection.
The single factor detection reveals the explanatory degree of an independent variable X for spatial stratified heterogeneity of the dependent variable Y. The explanatory power q of a single factor is used to represent the explanatory power of the independent X for Y.
where n
h indicates the type of the single factor, in which h represents the sample size in one or more subregions, and n denotes the total sample size in the study region; σ
2 and σ
h2 represent the dispersion variances in the whole study region and discrete variance of the classification h, respectively; L denotes the classification value of the single factor and q is 0 ≤ q ≤ 1.
Interactive detection explores the interaction between any two factors Xi. In space, there are three results; namely, their explanatory power for Y is enhanced, weakened, or mutually independent. Ecological detection aims to analyze the action mechanism between two different drivers; this will reveal the leading role of the main influence factors on the dependent variable Y. Risk area detection is used to judge whether there is a significant difference between the mean values of attributes of two subregions, checked using a t statistics test. In this study, the agricultural drought indexes were used as the dependent variables Y and the PCE, Ta, DEM, LUCC, NDVI, GDP, and POP were taken as independent variables X. Based on this, the dominant factors and interaction factors of agricultural drought indexes were quantitatively identified.
2.3.2. Copula Function
The copula function theory was proposed by Sklar in 1959 [
14], which is a multivariate joint distribution function composed of a univariate marginal distribution function and a contiguous function. The density functions of marginal distribution functions of different variables are f
X(x) and f
Y(y), so the density function of joint distribution of X and Y is f(x, y) = c(u, v) f
X(x), f
Y(y), in which C represents the copula function of two variables. The probability density function (PDF) of C is c(u, v) = ∂
2C(u, v)/∂u ∂v. The joint distribution function between different variables is F(x, y). The continuous marginal distribution functions are F
X(x) and F
Y(y), and the joint distribution function is F(x, y) = C(F
X(x), F
Y(y)).
The generally used parametric copula functions are usually classified into three types, namely elliptic (Gaussian copula and t-copula), Archimedes (Clayton copula, Gumbel copula and Frank copula), and extreme copula functions [
15]. The dependence of variables is fitted by the copula function, with no need to assume that the variables conform to some established distributions. The joint PDF between variables can be obtained to better analyze the interaction between variables. The correlation coefficients (Pearson’s
ρ, Kendall’s
τ, and Spearman’s
ρ) are used as measures for the linear dependence between random variables.
2.3.3. Identification of Characteristics of Agricultural Droughts
The indexes usually used to study agricultural droughts include the Soil Moisture Index, Crop Drought Index, Crop Water Index, and Soil Moisture Anomaly Percentage Index (SMAPI) [
16]. The soil moisture, as a basic parameter, can improve the understanding of agricultural droughts and drought monitoring. The soil moisture data in ERA5 cover the whole world and include underground data, with a high relative accuracy [
17], which is very suitable for evaluating agricultural droughts. Bergman et al. [
18] proposed the SMAPI in 1988, which can effectively solve problems in the inconsistent identification standards of agricultural droughts in different climate regions. It is calculated by dividing the difference between the actual soil moisture and the multi-year average in the same period by the multi-year average of the same period [
19]. The roots of crops mainly act in the soil layer with a thickness of 0~20 cm, where the water content usually determines the growth of crops. The calculation formula is shown as follows:
where θ and α indicate the soil moisture at the current time and average soil moisture in this period over years, respectively. The drought degrees are listed in
Table 1.
The frequency and influence range of droughts were taken as the drought indexes for the Inner Mongolia Autonomous Region. The frequency of droughts refers to the frequency of droughts exceeding a certain threshold in a period of time, that is, the ratio of the total number of months of droughts to the total number of months in computation. The frequency of different degrees of droughts is calculated according to the number of corresponding droughts in drought indexes. The frequency of mild droughts indicates the frequency of mild droughts or above, and the frequency of moderate droughts refers to the frequency of moderate and more serious droughts. The range of droughts implies the percentage of drought area in a region in the total area of the region within the specified time period. The calculation formula is expressed as follows:
where θ, m, and M indicate the range of droughts, number of stations with droughts, and total number of meteorological stations, respectively.
3. Results
3.1. Spatial-Temporal Distribution of Agricultural Droughts
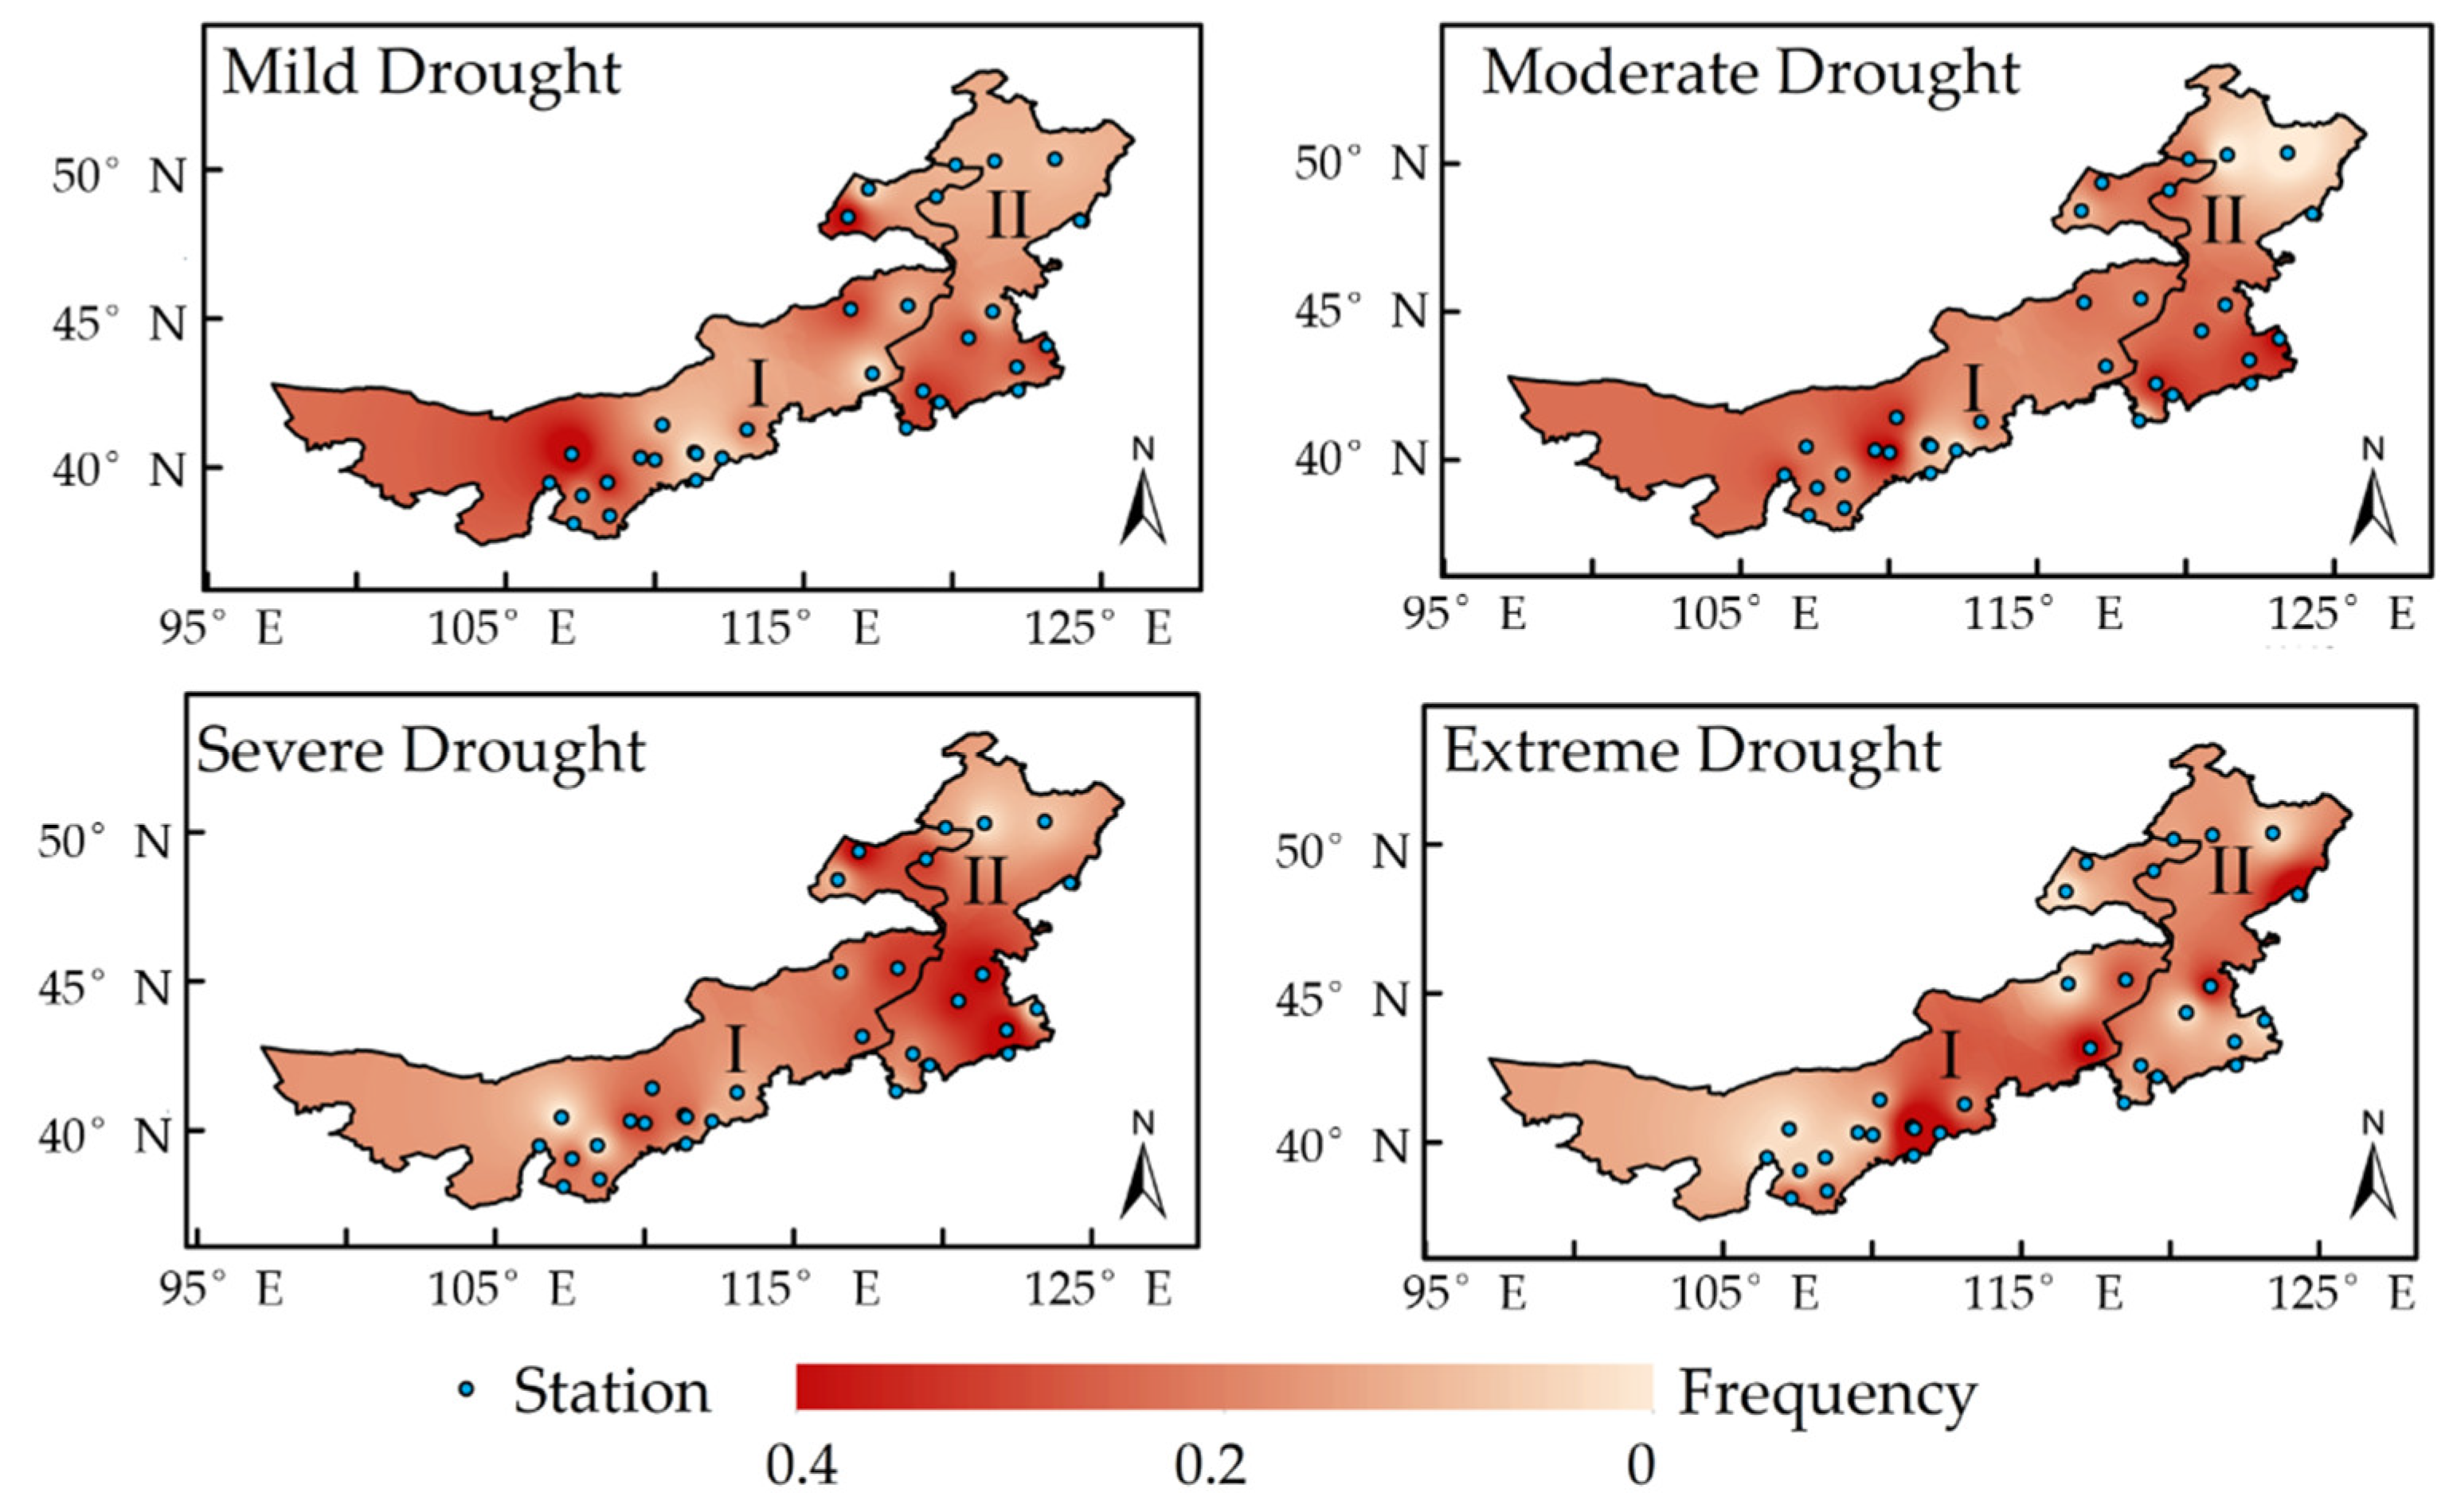
A drought is a meteorological disaster occurring most frequently and widely in the Inner Mongolia Autonomous Region. In each season, the sensitivity to water shortage in each stage of the crop growth period easily causes droughts of varying degrees. The soil moisture is the most direct and appropriate variable to reflect soil droughts. Based on the data of the soil moisture recorded in 32 meteorological stations in the Inner Mongolia Autonomous Region, the monthly SMAPI was calculated. Through analysis, it was found that the frequency of droughts (mild and above) in Subregion I in
Figure 2 ranges from 29.17% to 52.50%, with an average of 42.85%. The probability of mild droughts is high, with an average of 19.6%, while that of extreme droughts is low, with an average of 4.31%. In Subregion II, the frequency of mild and severe droughts is similar to that in Subregion I, with an average of 43.75%, while the probability of mild droughts is slightly higher than that in Subregion I, with an average of 21.01%. Due to abundant precipitation, the subregion is found to have a low probability of extreme droughts, 3.51% on average. In terms of regional distribution, Bayan Nur City and Hohhot City suffer from high- and low-frequency mild droughts, respectively. Moderate droughts occur at a high frequency in Baotou City and Tongliao City, but at a low frequency in Hulunbuir City. Furthermore, Tongliao City, Hinggan League, and Chifeng City have a high frequency of severe droughts, while the low frequency is found in the middle of Hulunbuir City and Bayan Nur City. Extreme droughts frequently occur in Hohhot City, but less frequently in Bayan Nur City and Ordos City [
20]. On the whole, droughts are mainly intensified in the central and western parts of the Inner Mongolia Autonomous Region, and the west suffers from more droughts than the east of the region.
From the perspective of land–atmosphere feedback, there is a close relationship between meteorological and agricultural droughts. Meteorological droughts are the cause of, and occur earlier than, agricultural droughts [
21]. On this basis, by comparing SPEI-1 with the standardized SMAPI of the Inner Mongolia Autonomous Region, it is found that they are similar to a great extent, reflecting the same drought change trend, which can well characterize droughts in this region. In most cases, SPEI-1 changes earlier than the standardized SMAPI [
22]. However, this study was carried out on a monthly scale, while the propagation between meteorological and agricultural droughts was not described more accurately on a daily scale.
Figure 3 demonstrates the ranges of mild and more serious droughts in different seasons in the Inner Mongolia Autonomous Region from 2000 to 2019 [
23]. In the last 20 years, the average annual range of droughts in Subregion I fluctuated in the range of 3.33%~95.00% [
24]; the range of agricultural droughts is ≥50%. The whole subregion suffered from droughts in the springs of 2000, 2012, 2013, and 2018; the summers of 2001, 2010, 2015, 2017, and 2019; autumn of 2002 and summer and autumn of 2005. A large range of droughts occurred in the whole year of 2006. Moreover, these droughts occurred in the springs and summers of 2008, 2009, and 2014. Except for autumn in 2007 and winter in 2011, drought occurred across the subregion in other seasons. In Subregion II, the average annual range of droughts changed to 2.78%~97.22%. The whole subregion suffered from droughts in the summers of 2000, 2016, and 2017, autumn and winter of 2001, the springs and winters of 2008 and 2018, and summer and winter of 2010. In addition, these droughts occurred in 2003, 2006, and 2019 (except summer), autumn of 2005 and 2011, winter of 2012, and the whole year of 2007 and 2009.
The climate tendency rates of droughts exhibit obvious spatial differences over different seasons. In Subregion I, the climate tendency rate of droughts in summer is 0.073/10 a, which is significant, followed by the spring with a climate tendency rate of 0.034/10 a, while droughts are alleviated in autumn and winter. A large scale of serious agricultural droughts occurred for the first time in June 2005. By using statistics, it was found that compared to other years, June is a high-incidence period of agricultural droughts, and mild or more serious droughts occur at a frequency of more than 50% at most stations. Therefore, it is necessary to prevent droughts in advance. In Subregion II, the climate tendency rates in different seasons have no significant change. A large range of droughts easily take place in spring and winter. It is obvious that more than 80% of the Inner Mongolia Autonomous Region suffered from spring droughts in 2006, especially in the northern and middle to north regions. There were continuous droughts in the winter and spring from September 2007 to April 2008, which is consistent with the other research results [
25,
26]. The low soil moisture in agricultural and pastoral areas has led to great losses in agriculture and animal husbandry.
3.2. Identification of a Synergistic Relationship between Ecosystem Variables and Agricultural Droughts
3.2.1. Attribution Analysis of Single Dominant Factors
In addition to the influences of meteorological variables, agricultural droughts characterized by the soil moisture are also affected by other factors, which was mentioned in previous studies [
16]. These factors include elevation, terrain, land cover type, and vegetation; vegetation roots affect the runoff, infiltration, and evapotranspiration of surface water through water absorption. Human activities can transform and regulate the local environment. To expound the mechanism of agricultural droughts, the synergistic relationship between the SMAPI and different variables was analyzed by the geographical detector. Firstly, factors with good correlations in different subregions were preliminarily evaluated through the Pearson correlation analysis. Finally, Subregion I was quantitatively identified by selecting PCE, Ta, DEM, LUCC, and NDVI. The PCE, Ta, NDVI, GDP, and POP were used for geographical detector based analysis in Subregion II. A factor detector was used to quantitatively identify dominant factors of the synergistic relationship between ecosystem variables and agricultural droughts in different seasons [
13], so as to test the spatial stratified heterogeneity of single variables.
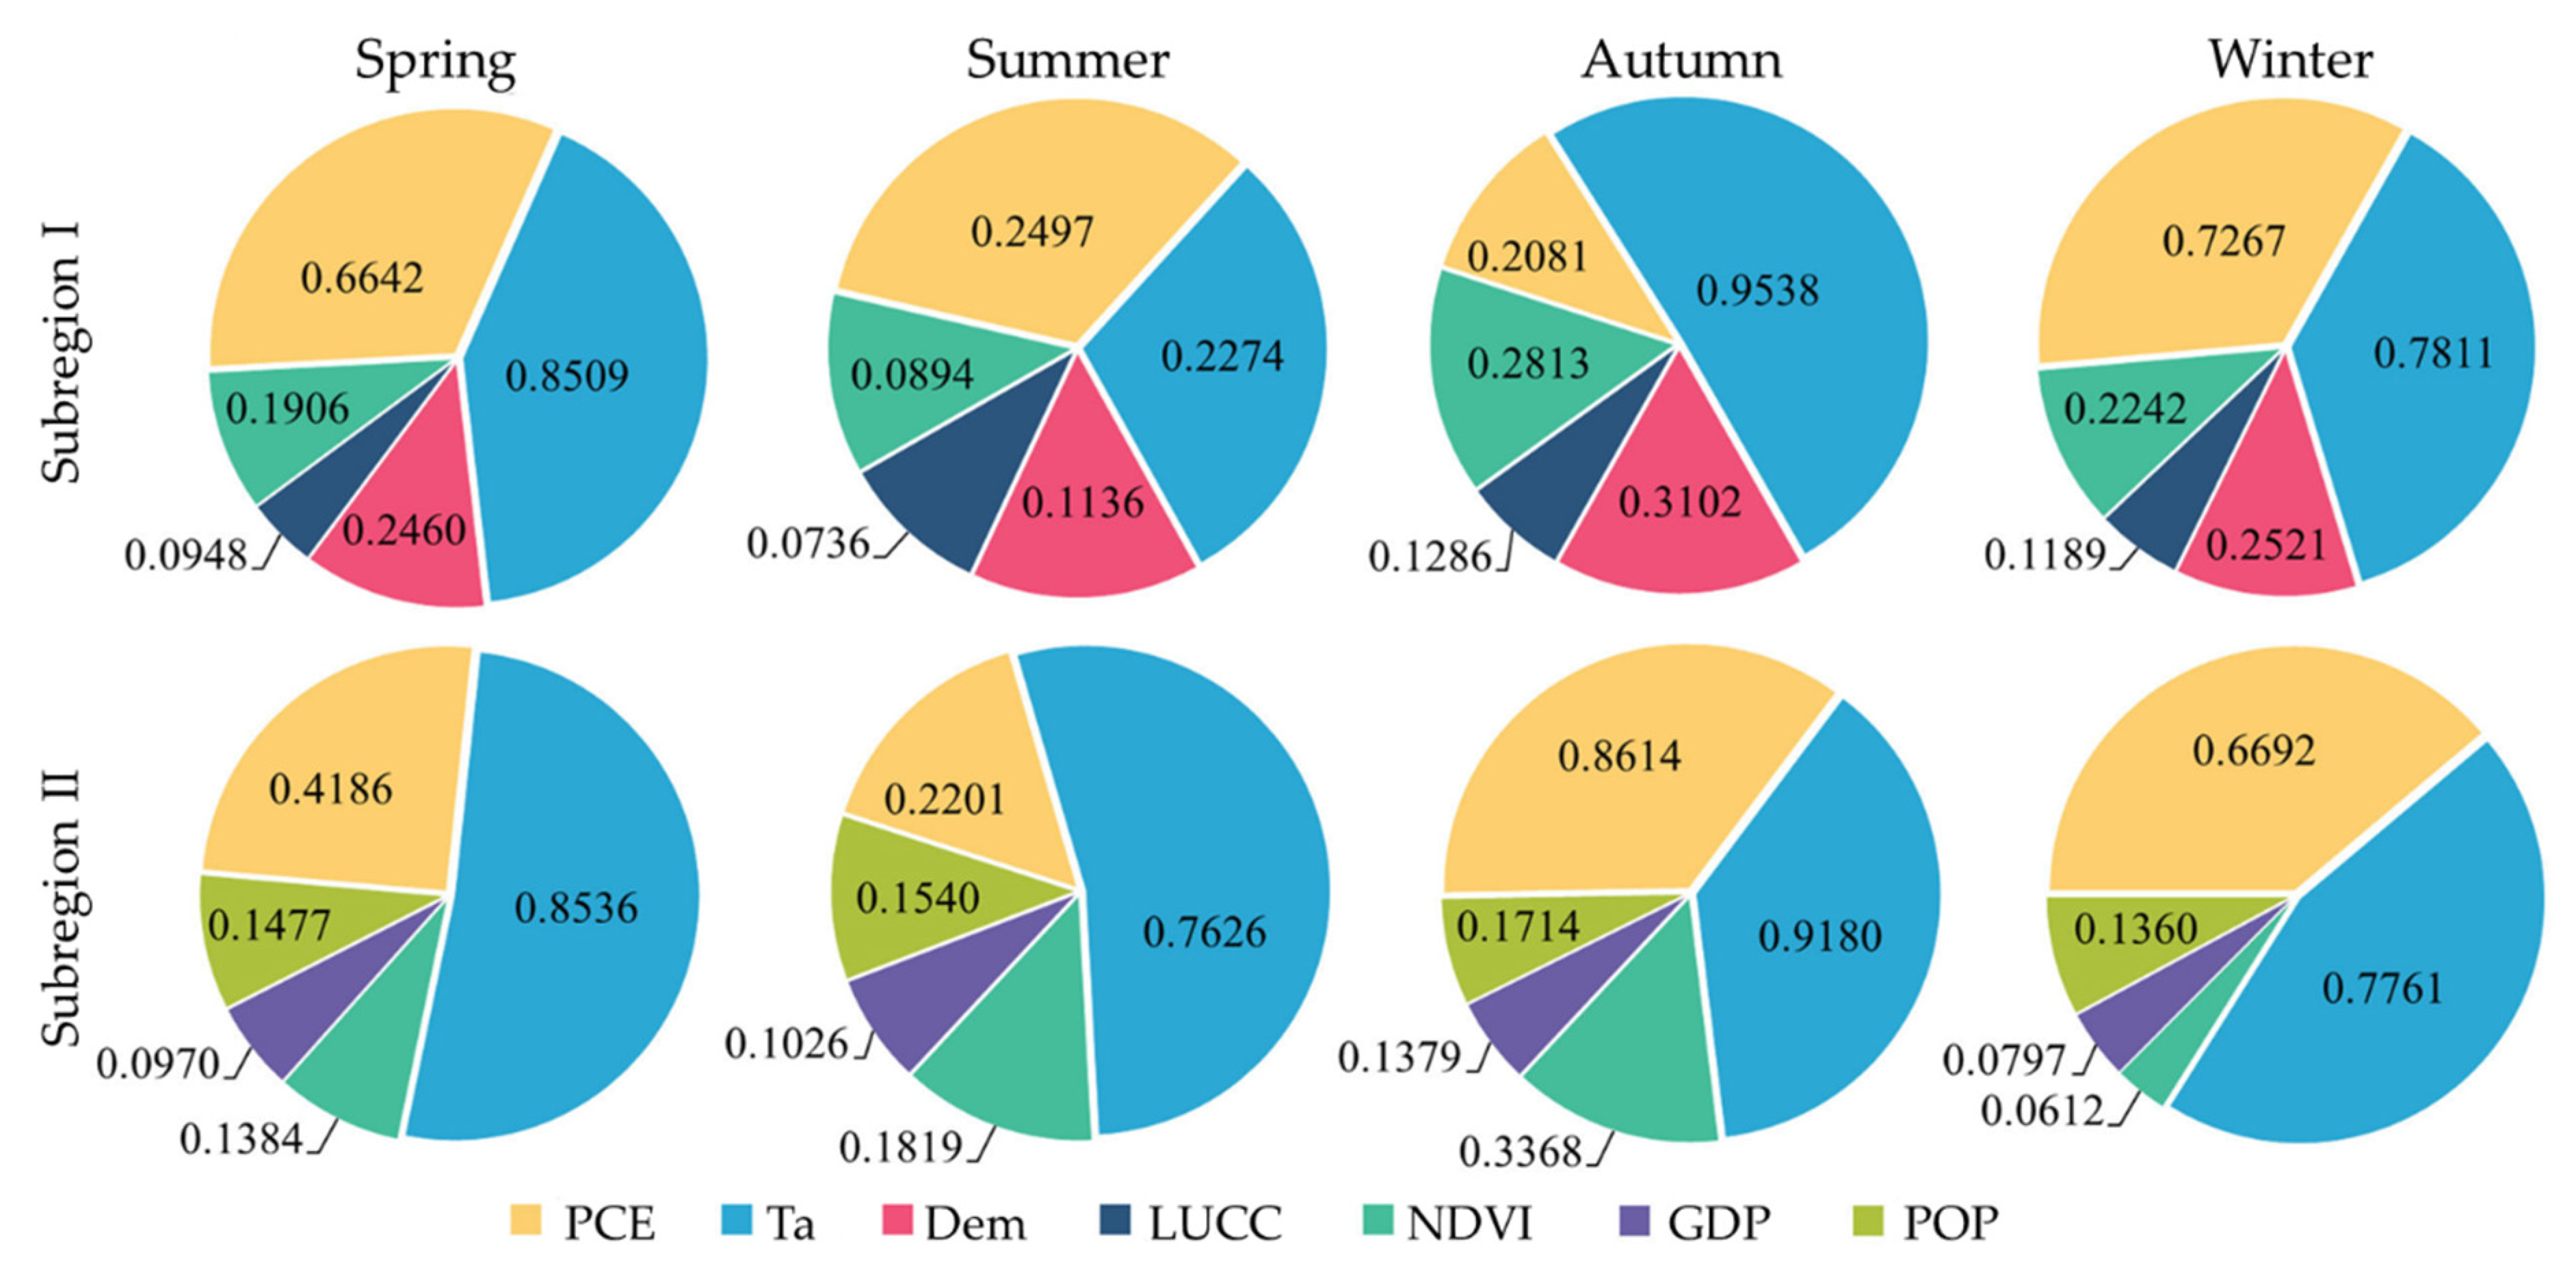
The influences of dominant factors in the synergistic relationship between different ecosystem variables and agricultural droughts on spatial heterogeneity were evaluated (
Figure 4). By doing so, it was found that the synergetic relationship between different ecosystem variables and SMAPI has different dominant factors containing explanatory powers varying over different seasons. The results demonstrate that temperature has the highest explanatory power, indicating that among these variables, temperature is the most important ecological factor of the SMAPI. The explanatory power of temperature in autumn in Subregion I is the highest at 51%, while those in spring and summer in Subregion II reach 52% and 54%, respectively. The PCE and DEM are ranked directly following temperature in terms of their explanatory powers of 32% and 12% in the spring in Subregion I, respectively. Moreover, the explanatory powers of PCE in summer and winter occupy 33% and 34%, respectively. On the whole, the other ecosystem variables PCE, DEM, NDVI, and LUCC are ranked in a descending order according to their explanatory power q in Subregion I. In each season, the explanatory power of LUCC is less than 10%, suggesting that LUCC has the weakest explanatory power for the spatial distribution of the SMAPI among these ecosystem variables. The DEM characterizes the background of climate types, an important factor affecting the SMAPI. In Subregion II, the other factors PCE, NDVI, POP, and GDP are ranked in the descending order in accordance with their explanatory power for the SMAPI. The explanatory powers of the PCE in autumn and winter in Subregion II account for 35% and 39%, respectively. The explanatory powers of POP and GDP for SMAPI are mostly below 10%, and GDP has no significant explanatory power for the spatial distribution of the SMAPI. The temperature (q = 0.9470 in autumn in Subregion I, and q = 0.9208 in autumn in Subregion II) and precipitation conversion efficiency (PCE) (q = 0.7074 in winter in Subregion I and q = 0.8750 in autumn in Subregion II) show the highest explanatory power in different subregions. The LUCC, GDP, and POP are mainly determined by human activities, which regulate the local soil moisture and affect the water cycle process. The national macro-policies and measures also have a significant role in the regulation of soil moisture.
3.2.2. Quantitative Attribution of Interaction Factors
An interaction detector can identify the interaction between different factors and evaluate whether the interaction between different factors enhances or weakens the explanatory power of the SMAPI. In different seasons, the explanatory power of multi-factor interaction is greater than that of a single factor, indicating that the interaction of different factors significantly improves the explanatory power of the SMAPI, and that there is a significant difference among drivers.
Figure 5 illustrates the first three ecosystem variables with the best interaction in different seasons in the two subregions.
In Subregion I, the superposition of the PCE and Ta has the strongest explanatory power for the spatial distribution of the SMAPI. The explanatory power of the interaction of the PCE, Ta, and DEM with other factors is dominant, showing a two-factor enhancement or nonlinear enhancement. The interactions of the PCE, Ta, and DEM are ranked as the first three in summer, while those in other seasons are the combination of the PCE and Ta, superposition of DEM and Ta, and interaction between NDVI and Ta. In Subregion II, similarly, the PCE ∩ Ta still plays a dominant role in the explanation of the spatial distribution of the SMAPI. The first three dominant interactions are the combinations of Ta with other influence factors. The LUCC has no significant interaction with other environmental factors. The interaction of different factors has no direct relationship with seasons. Overall, it was found that the combination of the PCE and Ta shows the highest explanatory power in different seasons in each subregion, and their explanatory power significantly increases with their superposition. The ecosystem variables affecting agricultural drought indexes were quantitatively analyzed by utilizing the geographical detector. Based on this, the explanatory power of various drivers for agricultural drought indexes was obtained, and the optimal explanatory variable for agricultural drought indexes was found. Moreover, the possible correlation between variables was measured. Furthermore, the characteristics of agricultural droughts and dependence structure of dominant factors were further explored, so as to make it more meaningful in mathematical statistics.
3.3. Dependence Structures of Agricultural Drought Indexes and Dominant Factors
Based on the above research, it was concluded that agricultural droughts show solid correlations with the PCE and Ta, so a copula joint function was constructed to characterize the dependence structure. By constructing copula functions for correlations of the SMAPI with the PCE and Ta, the joint probability distribution obtained can thereby describe the interaction process of the two meteorological variables, rather than unidirectional influences [
27]. Through the frequency histograms of the SMAPI, PCE, and Ta, the distribution is asymmetrical. The skewness and kurtosis of each of the three was calculated, as listed in
Table 2. The skewness and kurtosis deviate from those for the normal distribution, so it is preliminarily determined that the SMAPI, PCE, and Ta data of the Inner Mongolia Autonomous Region do not obey the normal distribution. To further verify distribution forms of the three groups of data, a Jarque-Bera test, Kolmogorov-Smirnov test, and Lilliefors test were carried out, thus confirming the assumption that the three groups of data do not accord with the normal distribution.
The marginal distribution functions were solved. Due to the randomness of the SMAPI, PCE, and Ta, the marginal distributions of the SMAPI, PCE, and Ta were estimated by utilizing a Gaussian kernel function. In accordance with kernel density functions, kernel distribution estimations of the SMAPI and PCE could be obtained in
Figure 6. From the shape of the graphs, the empirical distribution functions and kernel distribution estimations of the SMAPI, PCE, and Ta in different subregions almost coincide, indicating that they have uniform distribution in (0, 1).
According to the SMAPI and PCE data, three correlation coefficients, namely Pearson, Kendall, and Spearman coefficients, were calculated by using routine methods; the calculation results are listed in
Table 3. It can be seen from the table that the SMAPI and Ta in Subregion I have a weak negative correlation, while others show a positive correlation. By choosing from five copula functions, the copula function that could best describe the dependence between the SMAPI and PCE, and the SMAPI and Ta was found. Based on the empirical copula function, the goodness of fit of different copula functions was evaluated by using the least square Euclidean distance. The square Euclidean distance reflects the fitting of different copulas. The smaller the square Euclidean distance is, the better the fitting effects. Compared with other four copula functions, the t-copula function can better quantitatively describe joint distribution between them.
As shown in
Figure 7, the SMAPI and PCE, and the SMAPI and Ta dependencies are revealed by t-copula joint distribution function. The correlation functions of marginal variables in the PCE and Ta in the figure are represented by u, and the SMAPI is represented by v. The correlation coefficients and tail dependence of the SMAPI with the PCE and Ta were obtained. They show obvious tail dependence and symmetry, especially between the SMAPI and PCE in Subregion II. Due to different correlations between the SMAPI and different factors, the ranges of their joint PDFs are different. Therefore, the joint return periods between the SMAPI and PCE as well as the SMAPI and TA at different frequencies can be explored, and hydrological events under the joint action of the PCE and Ta factors were considered.
4. Discussion
There are great differences in precipitation during different seasons in the Inner Mongolia Autonomous Region. There is less precipitation in the spring, and the precipitation variability in the summer is more than half of that in the spring. The probability of droughts in the summer is also only half of that in the spring, and droughts in autumn are slightly more than those in the summer. The two subregions show large precipitation variability and high drought and flood frequency, so the utility of water resources is low. Due to the uneven distribution of water resources, droughts have become an important factor restricting the agricultural development of the Inner Mongolia Autonomous Region. When other climatic conditions are the same, the atmospheric moisture content affects the precipitation. The soil moisture mainly affects precipitation by changing the PCE [
28]. In terms of spatial distribution, the PCE in Subregion II is higher than that in Subregion I. The monthly PCE in Subregion I changes from 1.77% to 36.25%, while that in Subregion II varies in the range of 1.81%~57.93%. Except for in the winter, the linear tendency rates of the PCE in other seasons do not rise significantly, indicating the potential of increasing precipitation. The PCE in the winter is the lowest, and there is little difference in other seasons. The PCE is positively correlated with droughts, and its cycle is similar to agricultural droughts, about 12~15 days. Water shortage is the main cause of droughts. The demand for water in the natural ecological balance system of the Inner Mongolia Autonomous Region matches with its PCE. The regions with the lower PCE are more prone to droughts.
In the Inner Mongolia Autonomous Region, an important ecological defense in northern China, a series of key ecological projects have been constructed since the beginning of this century, so as to realize the sustainable development of the ecological environment. These projects include returning the grain plots to forestry, projects concerning pastoral areas, animal husbandry and herdsmen, natural forest resources protection, and western development strategy. The ecosystem and variables are not independent of each other; on the contrary, they show a complex interaction [
13]. Under the joint effects of human activities and the natural ecological environment, the single factor detection with the geographical detector shows that among various influence factors, the temperatures, PCEs, and elevations in different seasons are the main explanatory variables for the spatial stratified heterogeneity of agricultural droughts. The natural ecosystem is the basis for agricultural droughts. The interactive detection demonstrates that the combination of the PCE and temperature significantly enhances the explanatory power for agricultural droughts in different seasons in different subregions. Therefore, it can be concluded that the PCE and temperature affect and restrict each other. In addition, in the two subregions, the effects of temperature on soil moisture are greater than those of the PCE [
29]. Due to climate evolution and human modification, warming increases the surface temperature of land and ocean and accelerates the hydrological cycle. Similarly, the atmospheric moisture content also increases, which has a feedback effect on the PCE and increases the intensity of the water cycle. If there is no precipitation, agricultural droughts will occur.
Based on the geographical detector, it was determined that the PCE and temperature are factors with the largest explanatory power for agricultural drought indexes in the Inner Mongolia Autonomous Region. Furthermore, the t-copula PDFs of agricultural droughts with the PCE and temperature and their upper and lower tail dependence coefficients were analyzed. This more clearly defines the physical and mathematical statistical significance of the three. In terms of extremes, the three have an obvious positive dependence, and the highest temperature point matches with the maximum precipitation period in time sequences. Through actual distribution of arid regions, it is further verified that droughts are not only affected by precipitation, but also the interaction between the temperature and PCE. When the two meet certain conditions, they will have an impact on agricultural droughts. Therefore, the copula joint probability distribution between the temperature and PCE obtained in this study can provide a mathematical basis for comprehensive evaluation of droughts by two meteorological factors in the future. In the future, more detailed studies will be carried out to determine the balance between the PCE, temperature, and agricultural droughts.
5. Conclusions
This study firstly identified agricultural droughts from 2000 to 2019 in the Inner Mongolia Autonomous Region according to drought frequency and range based on the SMAPI. The dominant factors and interaction factors were quantitatively identified by the geographical detector, so as to accurately reveal drivers and their explanatory power. The joint distribution functions of agricultural droughts with the PCE and temperature were constructed with copula function, thus characterizing the dependence structure. The reasons for agricultural droughts were considered from the perspectives of local meteorological and social factors. The conclusions are made as follows: The SMAPI of the Inner Mongolia Autonomous Region changes insignificantly over four seasons. The mild and moderate droughts are dominant, and the SMAPI decreases in the west and increases in the east. In different seasons, continuous droughts in the spring and summer tend to appear in Subregion I, while droughts easily occur in the winter in Subregion II. The frequency of droughts in Subregion I is higher than that in Subregion II, which is consistent with the spatial distribution characteristics of the PCE. With the increase of the number of hydrologic cycles every year, the number of days in each cycle in Subregion I is decreasing, so the probability of droughts increases constantly. The subregion shows high precipitation variability, and droughts and floods occur frequently, resulting in a low utility of water resources.
From the perspective of spatial distribution, based on the SMAPI, the occurrence of agricultural droughts is mainly mild and severe, and the frequency of extreme droughts is high. The droughts are mainly aggravated in some central and western regions of the Inner Mongolia Autonomous Region, and the west suffers from more droughts than the east. A trend of droughts alleviated in the west while aggravated in the east is shown, and local and global droughts are prone to appear.
Of all the ecosystem variables, including the PCE, Ta, DEM, LUCC, NDVI, GDP, and POP, single factor detection shows that the temperature and PCE are the most important dominant factors of the SMAPI in Subregions I and II, especially in the spring and winter. When different environmental factors are combined, their explanatory power for agricultural droughts and different ecosystem variables is enhanced. Similarly, in the interactive detection, the explanatory powers of the combination of the PCE and temperature in autumn in Subregions I and II are 0.9735 and 0.9835, respectively. They are interactive factors with the best explanatory power for agricultural drought indexes in different seasons in the two subregions.
In terms of correlation, the t-copula function is the best. The interactions between the SMAPI and PCE in Subregion I, between the SMAPI and PCE in Subregion II, and between the SMAPI and Ta in Subregion II show obvious positive tail dependences, while the interaction between the SMAPI and Ta in Subregion I presents a negative tail dependence. Quantifying the correlations of agricultural droughts with the PCE and temperature can provide a theoretical basis for the further studying of hydrological events and related natural disasters under different frequencies and joint return periods.
Author Contributions
Writing—original draft, S.Y.; supervision, Q.Q.; investigation and methodology, W.L.; project administration, T.L. All authors have read and agreed to the published version of the manuscript.
Funding
This research was supported by the National Natural Science Foundation of China (51779156).
Institutional Review Board Statement
Not applicable.
Informed Consent Statement
Not applicable.
Data Availability Statement
All data used in this study are available upon request.
Acknowledgments
We would like to express our sincere thanks for help from the China Meteorological Administration.
Conflicts of Interest
The authors declare no conflict of interest.
References
- Peng, Y.; Long, S.; Ma, J.; Song, J.; Liu, Z. Temporal-spatial variability in correlations of drought and flood during recent 500 years in Inner Mongolia, China. Sci. Total Environ. 2018, 633, 484–491. [Google Scholar] [CrossRef]
- Shen, J. Inner Mongolia Autonomous Region Volume of China Meteorological Disaster Ceremony; China Meteorological Press: Beijing, China, 2008. (In Chinese) [Google Scholar]
- Asharaf, S.; Dobler, A.; Ahrens, B. Soil Moisture–Precipitation Feedback Processes in the Indian Summer Monsoon Season. J. Hydrometeorol. 2012, 13, 1461–1474. [Google Scholar] [CrossRef]
- Hoerling, M.; Eischeid, J.; Kumar, A.; Leung, R.; Mariotti, A.; Mo, K.; Schubert, S.; Seager, R. Causes and Predictability of the 2012 Great Plains Drought. Bull. Am. Meteorol. Soc. 2014, 95, 269–282. Available online: https://www.researchgate.net/publication/263037684_Causes_and_Predictability_of_the_2012_Great_Plains_Drought (accessed on 1 June 2021). [CrossRef] [Green Version]
- Roy, T.; Martinez, J.; Herrera-Estrada, J.E.; Zhang, Y.; Dominguez, F.; Berg, A.; Ek, M.; Wood, E.F. Role of Moisture Transport and Recycling in Characterizing Droughts: Perspectives from Two Recent U.S. Droughts and the CFSv2 System. J. Hydrometeorol. 2019, 20, 139–154. [Google Scholar] [CrossRef]
- Wu, R.; Kinter, J.L. Analysis of the Relationship of U.S. Droughts with SST and Soil Moisture: Distinguishing the Time Scale of Droughts. J. Clim. 2009, 22, 4520–4538. [Google Scholar] [CrossRef]
- Herrera-Estrada, J.E.; Martinez, J.A.; Dominguez, F.; Findell, K.L.; Wood, E.F.; Sheffield, J. Reduced Moisture Transport Linked to Drought Propagation Across North America. Geophys. Res. Lett. 2019, 46, 5243–5253. [Google Scholar] [CrossRef] [Green Version]
- Yuan, G.; Zhang, L.; Liu, Y. Impacts of soil moisture and atmospheric moisture transport on the precipitation in two typical regions of China. Atmos. Res. 2021, 247, 105151. [Google Scholar] [CrossRef]
- Kim, E.-S. Simulation of Daily Soil Moisture Content and Reconstruction of Drought Events from the Early 20thCentury in Seoul, Korea, using a Hydrological Simulation Model, BROOK. J. Ecol. Environ. 2010, 33, 47–57. Available online: http://ocean.kisti.re.kr/downfile/volume/kesk/STHHCL/2010/v33n1/STHHCL_2010_v33n1_47.pdf (accessed on 1 June 2021). [CrossRef] [Green Version]
- Zeng, D.; Yuan, X.; Roundy, J.K. Effect of Teleconnected Land–Atmosphere Coupling on Northeast China Persistent Drought in Spring–Summer of 2017. J. Clim. 2019, 32, 7403–7420. [Google Scholar] [CrossRef]
- Xie, G.D.; Zhang, C.S.; Zhang, L.B.; Su, D.; Cao, S.Y.; Leng, Y.F.; Xiao, Y. China’s County Scale Ecological Regionalization. J. Nat. Resour. 2012, 27, 154–162. (In Chinese) [Google Scholar]
- Wang, J.; Xu, C. Geodetector: Principle and prospective. Acta Geogr. Sin. 2017, 72, 116–134. [Google Scholar] [CrossRef]
- Gao, J.; Jiang, Y.; Anker, Y. Contribution analysis on spatial tradeoff/synergy of Karst soil conservation and water retention for various geomorphological types: Geographical detector application. Ecol. Indic. 2021, 125, 107470. [Google Scholar] [CrossRef]
- Sklar, A. Fonctions de Répartition àn Dimensions et Leurs Marges; Publications de l’Institutde Statistiquede l’Université de Paris: Paris, France, 1959; pp. 229–331. [Google Scholar]
- Dong, H.; Huang, S.; Fang, W.; Leng, G.; Wang, H.; Ren, K.; Zhao, J.; Ma, C. Copula-based non-stationarity detection of the precipitation-temperature dependency structure dynamics and possible driving mechanism. Atmos. Res. 2021, 249, 105280. [Google Scholar] [CrossRef]
- Luong, N.; Hiep, N.; Bui, T. Investigating the Spatio-Temporal Variation of Soil Moisture and Agricultural Drought towards Supporting Water Resources Management in the Red River Basin of Vietnam. Sustainability 2021, 13, 4926. [Google Scholar] [CrossRef]
- Zhang, R.; Li, L.; Zhang, Y.; Huang, F.; Li, J.; Liu, W.; Mao, T.; Xiong, Z.; Shangguan, W. Assessment of Agricultural Drought Using Soil Water Deficit Index Based on ERA5-Land Soil Moisture Data in Four Southern Provinces of China. Agriculture 2021, 11, 411. [Google Scholar] [CrossRef]
- Bergman, K.H.; Sabol, P.; Miskus, D. Experimental indices for monitoring global drought conditions. In Proceedings of the 13th Annual Climate Diagnostics Workshop, Cambrigdge, MA, USA, 31 October–4 November 1988; National Technical Information Service: Cambrigdge, MA, USA; U.S. Department Commerce: Springfield, VA, USA, 1988; pp. 190–199. [Google Scholar]
- Mao, Y.; Wu, Z.; He, H.; Lu, G.; Xu, H.; Lin, Q. Spatio-temporal analysis of drought in a typical plain region based on the soil moisture anomaly percentage index. Sci. Total Environ. 2017, 576, 752–765. [Google Scholar] [CrossRef] [PubMed]
- Han, Z.; Liu, X.; Hao, K.; Yu, N.; Liu, Y.; Yang, Q. Drought evolution characteristics and trend prediction in Inner Mongolia based on standardized precipitation index. J. Drain. Irrig. Mach. Eng. (JDIME) 2017, 35, 430–439. (In Chinese) [Google Scholar]
- Yao, N.; Zhao, H.; Li, Y.; Biswas, A.; Feng, H.; Liu, F.; Pulatov, B. National-Scale Variation and Propagation Characteristics of Meteorological, Agricultural, and Hydrological Droughts in China. Remote Sens. 2020, 12, 3407. [Google Scholar] [CrossRef]
- Ding, Y.; Xu, J.; Wang, X.; Cai, H.; Zhou, Z.; Sun, Y.; Shi, H. Propagation of meteorological to hydrological drought for different climate regions in China. J. Environ. Manag. 2021, 283, 111980. [Google Scholar] [CrossRef]
- An, Q.; He, H.; Nie, Q.; Cui, Y.; Gao, J.; Wei, C.; Xie, X.; You, J. Spatial and Temporal Variations of Drought in Inner Mongolia, China. Water 2020, 12, 1715. [Google Scholar] [CrossRef]
- Xuting, Z.; Xuebiao, P.; Lin, X.; Pei, W.; Ziwei, Y.; Changxiu, S. Analysis of spatio-temporal distribution of drought characteristics based on SPEI in Inner Mongolia during 1960–2015. Trans. Chin. Soc. Agric. Eng. (Trans. CSAE) 2017, 33, 190–199. Available online: http://www.tcsae.org (accessed on 1 June 2021). (In Chinese).
- Ma, Z.-C.; Sun, P.; Zhang, Q.; Hu, Y.-Q.; Jiang, W. Characterization and Evaluation of MODIS-Derived Crop Water Stress Index (CWSI) for Monitoring Drought from 2001 to 2017 over Inner Mongolia. Sustainability 2021, 13, 916. [Google Scholar] [CrossRef]
- Liu, S.; Kang, W.; Wang, T. Drought variability in Inner Mongolia of northern China during 1960–2013 based on standardized precipitation evapotranspiration index. Environ. Earth Sci. 2016, 75, 1–14. [Google Scholar] [CrossRef]
- Minghua, Y.; Rongming, W.; Yue, D. Interaction of temperature and rainfall in Anhui province based on copula function. Resour. Environ. Yangtze Basin 2017, 26, 110–117. (In Chinese) [Google Scholar]
- Wei, J.; Su, H.; Yang, Z.-L. Impact of moisture flux convergence and soil moisture on precipitation: A case study for the southern United States with implications for the globe. Clim. Dyn. 2016, 46, 467–481. [Google Scholar] [CrossRef]
- Xu, F.; Jia, Y.; Peng, H.; Niu, C.; Liu, J. Temperature and precipitation trends and their links with elevation in the Hengduan Mountain region, China. Clim. Res. 2018, 75, 163–180. [Google Scholar] [CrossRef]
| Publisher’s Note: MDPI stays neutral with regard to jurisdictional claims in published maps and institutional affiliations. |
© 2021 by the authors. Licensee MDPI, Basel, Switzerland. This article is an open access article distributed under the terms and conditions of the Creative Commons Attribution (CC BY) license (https://creativecommons.org/licenses/by/4.0/).


