1. Introduction
Past literature that focused on long-term temperature variations raised great concern about global warming and sent warnings about increased risks of encountering climate extremes and compound hazards [
1]. However, temperature trends are not necessarily rising in every single location during all seasons across the world, because of the diverse geography on the earth. Global warming only emerges when the planet-wide scale is considered [
2], implying various extents of warming trends observed in different locations around the world.
The diversity of warming trends is seen on the surface of the earth and is found from a vertical perspective. Predictions proposed in earlier research pointed out that, in the tropics, larger upper-tropospheric warming may be more robust and significant than lower-tropospheric and surface warming [
3]. Based on the general circulation models (GCMs) simulation, the Intergovernmental Panel on Climate Change Fourth Assessment Report (hereafter IPCC AR4) explicitly predicted more pronounced upper-tropospheric warming, with its maximum occurring at around 200 hPa. A similar pattern with various magnitudes under different scenarios was also reviewed in the IPCC Fifth Assessment Report (AR5), showing consistency across generations of the models [
4]. Besides the simulations, the globally zonal mean of the upper-tropospheric warming has been extensively studied in terms of its spatial and temporal variations through analyzing observational evidence and numerical experiment results [
5,
6,
7,
8]. In the study from [
9], observational verifications were conducted, such as applying satellite-borne Microwave Sounding Unit observations in order to demonstrate faster warming in the tropical troposphere than the surface. The prediction from IPCC AR4 was further proved in their more recent research [
10].
Some explanations for possible causes of the maximum warming in the tropical upper troposphere have been proposed. Warming in the tropical upper troposphere is associated with climate sensitivity due to its impact on climate feedback processes [
11,
12], such as a decline in temperature’s moist adiabatic lapse rate in the tropics as the climate warms [
13]. Although dynamic and thermodynamic arguments for the physical robustness of tropical behavior were proposed [
14,
15], uncertainty about the magnitude of warming simulated in the tropical upper troposphere remains. In fact, some studies argued that the warming might have been overestimated [
16]. In addition, simulations still encounter large inter-model spreads of uncertainty, mainly due to a lack of understanding regarding climate feedback processes [
9,
11].
The European Centre for Medium-Range Weather Forecasts Reanalysis Interim dataset (ECMWF Re-Analysis Interim, hereafter ERA-Interim) [
17] elucidated the formation of the tropical upper-tropospheric warming through applying a coupled atmosphere-surface “climate feedback-response analysis method” (CFRAM), developed by [
18,
19], which allowed for quantifying the relative contributions of each feedback process based on the reanalysis data. Their results revealed that radiative and non-radiative processes contribute to the long-term changes in the upper-tropospheric warming, with the maximum intensity found to be between 400 hPa and 250 hPa over the tropical Atlantic and western Pacific oceans. The variations of atmospheric deep convection and the change in oceanic dynamical process and heat storage mainly contribute to the long-term changes of the annual mean upper-tropospheric warming over the tropical western Pacific, with the latter playing a more important role. The non-radiative process—the deep convection—affects warming mainly through the latent heat release associated with enhanced upward motion and condensation. The oceanic dynamical process and heat storage, regarded as the radiative process, is a consequence of enhanced upward long-wave radiation from the ocean surface, due to the immense heat storage in the thermocline. The variations of both processes individually dominate contributions to warming from boreal summer to fall, and from boreal winter to early spring. Since the non-radiative process plays a more critical role, the warming is more prominent from boreal winter to early spring. In addition, a strengthening Walker circulation over the tropical Pacific in boreal summer and fall that has been occurring since the early 2000s also facilitates the deep convection to dominate.
The northmost delimitation of the tropics, the Tropic of Cancer in the Northern Hemisphere, passes through Taiwan in the western Pacific, and is also right on the edge of the analyzed domain in [
17]. The island is particularly susceptible and vulnerable to extreme weather conditions associated with global warming. Temperature increase on the island was double that of the Northern Hemisphere from 1911 to 2015 [
20,
21,
22], and, recently, the region has suffered the impacts of climate extremes more frequently. Besides the observed results, simulations under the future warming scenario also showed pessimistic projections for the three major cities in Taiwan by the end of the 21st century [
23].
The history of vertical observations of the atmosphere in Taiwan began in the Japanese era and was related to aircraft navigation and weather research during the Pacific War. As pointed out by [
24], a lack of equipment and the tremendous cost of operating vertical observations at that time restricted researchers from looking at the complete image of the atmospheric vertical structure over Taiwan. Instead, researchers took full advantage of the mountainous topography of the island to obtain the vertical profile of the atmosphere. In 1941 and 1943, the high-altitude Sun Moon Lake observatory and the highest Niitakayama observatory (now the Yushan weather station) were respectively established and joined with the existing Tainan and Alishan weather observatories to build a vertical observation network at various altitudes on western Taiwan. The purpose was to provide information on the atmospheric vertical structure for aviation. Considering that the new alpine weather station, by that time, was located at the northern peak of Yushan at 3850 m, it was certainly adequate for aviation requirements during World War II. A similar concept was replicated for an observation network in northern Taiwan, with the Taipei observatory, Zhuzihu observatory (established in 1937), and Taipei observatory Datunshan branch (established in 1935, now the Anbu weather station). Although the surface-based observation network provided scientists an opportunity to look at the vertical information of the atmosphere briefly, the altitude of the Yushan weather station—the highest one in Taiwan—is 3844 m, which only reaches approximately 620 hPa in terms of the pressure height. The limitation of the topographic altitude made the investigation at the upper layers of the atmosphere impossible. Therefore, it was necessary to adopt a different method to vertically explore the atmosphere, such as radiosondes.
After World War II in 1949, balloon radiosondes were adopted for vertical observations at the Taipei weather station. The Central Weather Bureau (hereafter CWB) Taipei weather station at Banqiao for balloon measurements (hereafter Taipei sounding station) started to operate radiosonde observations in 1972, and the CWB Hualien weather station for balloon measurements (hereafter Hualien sounding station) began radiosonde observations in 1987 [
25]. As for the sounding stations operated by the Republic of China Air Force (hereafter ROCAF), the history of radiosonde observations at the Taoyuan and Magong Airports can be traced back to 1952, and five years later, in 1957, the Donggang sounding station was established. In 1984, the ROCAF terminated radiosonde operations at the Taoyuan Airport and established the Ludao sounding station in 1985. In 1999, radiosonde operations at the Donggang sounding station ended, and the Pingtung Airport took over the tasks [
26].
At present, the CWB and the ROCAF sounding stations both routinely follow the official observation time of 0000 UTC and 1200 UTC, while a higher launching frequency of four times per day is possible in severe weather conditions. An additional radiosonde mission is launched every month during boreal winter and spring to observe the upper atmosphere ozone concentration. Besides the mentioned routine sounding stations, some stations only operate radiosonde missions on demand. The Yungkang and Itu Aba Island (Taiping Island), two unconventional sounding stations, only carry out radiosonde missions when encountering severe weather or demanding experiments [
27]. Although the radiosonde observation network in Taiwan is relatively well established in terms of spatial distribution, most of the sounding stations, except for the CWB Taipei and Hualien sounding stations, fall short of offering a complete series of data during their observation period, particularly in the early years.
The long history of the surface-based meteorological observation in Taiwan builds a solid foundation for scientists to look at long-term climate changes, such as temperature variations under current global warming conditions. Most of the discussions on interannual or decadal variations from weather stations on the plains or regional areas [
28,
29,
30] agreed with the consensus of a clear warming trend on the island over past decades, a fact which stresses the necessity of urgent attention to the long-term analysis of temperature. However, even with substantial weather stations distributing over the plains and mountains and routine radiosonde observations occurring since 1985, discussions about long-term meteorological variations at different altitudes and pressure layers are still limited. Considering that previous studies usually adopted model simulations, satellite observations, or reanalysis datasets when discussing the mentioned upper-tropospheric warming, the existing rich observational resources in Taiwan, as alternatives, offer a robust base for scientists to conduct a long-term analysis. Therefore, this study applies the surface and radiosonde observations in order to demonstrate long-term variations of temperature over Taiwan from a vertical perspective.
Several data sources are adopted, including the CWB conventional weather stations at different altitudes and the present balloon radiosonde observations. The data and equations of the statistics used for the research are presented in section two. The results and relevant discussions are illustrated in section three. Finally, section four concludes the study.
2. Data and Analysis Method
The meteorological observation network in Taiwan consists of numerous stations at various altitudes spread across the entire island. The high-density spatial distribution of these stations provides researchers an opportunity to look at more detailed and accurate meteorological information, either regionally or comprehensively. Daily surface temperatures, observed by the CWB conventional weather stations, were obtained. The characteristics of the long history and high spatial density of the observation network allow this study to construct a daily surface temperature observation dataset at different times, regions, and altitudes in Taiwan over the past century, from 1897. This solid foundation provides a significant contribution to understanding the climatological features of atmospheric information at different altitudes on the island.
Given that a lack of complete data from most of the sounding stations could impact on the examination for long-term analysis, the more complete daily radiosonde data from the CWB Taipei and Hualien sounding stations were acquired through the Data Bank for Atmospheric and Hydrologic Research in order to construct a comprehensive vertical image of the atmosphere over Taiwan. The radiosonde data from the Taipei sounding station has been digitalized since 1985, and since August 1987 for the Hualien sounding station, with both routinely launching radiosondes at 0000 UTC and 1200 UTC every day. Therefore, the studied periods for the Taipei and Hualien radiosondes in this study respectively span from 1985 to 2019 and 1988 to 2019. The radiosonde data consist of multiple analytical parameters: air pressure, geopotential height, temperature, dew point temperature, wind direction, wind speed, and relative humidity. This study takes the temperature data for the discussion about the vertical temperature analysis. In addition, the two radiosonde launchings every day are averaged, in order to create daily temporal resolutions over the analyzed years.
For estimating long-term trends over the analyzed years, this study adopts a simple linear regression for estimating a linear trend during the time series. It is a linear regression model with a single explanatory variable [
31,
32,
33] that is used to estimate the relationship between two quantitative variables. Below is the formula for a simple regression
where the
y is the dependent variable, the
β is the slope of the regression line, the
x is the independent variable, and the
α represents the
y-intercept.
In addition, monthly temperature data from the ECMWF Reanalysis v5 (hereafter ERA5) [
34] are also evaluated for comparison with the radiosonde observational results. The reanalysis dataset spans from 1950 to the present, and this study takes the segment from 1985 to 2019 to match the operation period of the Taipei sounding station. The dataset features a high horizontal resolution of 0.25° × 0.25° and multiple pressure layers ranging from 1000 hPa to 1 hPa. These features allow us to examine the vertical temperature information above the grid points within a domain of 119.0° E to 123.0° E and 21.75° N to 25.5° N, covering Taiwan and its adjacent areas.
3. Analysis and Discussions
The 23 CWB conventional weather stations (excluding the two radar stations and the six stations that are not on the main island of Taiwan) and two CWB sounding stations used in this study are currently in service for surface meteorological and radiosonde observations on the island of Taiwan every day. The relevant information for each station obtained in this study, including the station name, station number, latitude, longitude, altitude, and establishment date, is listed in
Table 1 and
Table 2. As for the station number, practically, the first five digits are usually used to describe the station for the operation purpose, and an extra digit (the sixth digit) is added to represent changes of the station location in history, which provides very useful information for long-term historical data. In this study a hyphen is added in between to distinguish these two parts.
3.1. Interannual Variations of Temperature at Various Altitudes by Surface Observations
The information above shows the capacity to analyze long-term variations based on the CWB conventional weather stations. Over 120 years of observation history, the stations gradually joined the observation network, especially after the second half of the 20th century. In order to ensure that there are enough stations for each analyzed year, the following discussion concentrates on the period after 1960, with the stations distributed over various altitudes on the island. Most of the stations in Taiwan are located at lower altitudes. For that reason, earlier research has usually concentrated on these low-altitude stations in order to adopt as many stations as possible when discussing long-term meteorological variations. However, knowledge about the variations in a broader range of height remains relatively poor. Therefore, this study fully utilizes the altitudinal advantage of Taiwan in order to investigate atmospheric characteristics from a vertical perspective.
Temperatures at each altitude are annually and seasonally averaged for each studied year to demonstrate interannual variations. Following the concept of the monsoon year [
35] to obtain clear seasonal temperature signals, six-month-long seasons are applied to distinguish the winter half (from November through next April) and the summer half (from May through October) of the year. As for vertical deployment, each station is categorized by its altitude. The result consists of three different ranges: the surface to 500 m, 501 m to 1500 m, and above 1501 m. All of them carry corresponding climate information in order to construct an atmospheric vertical image for the studied period.
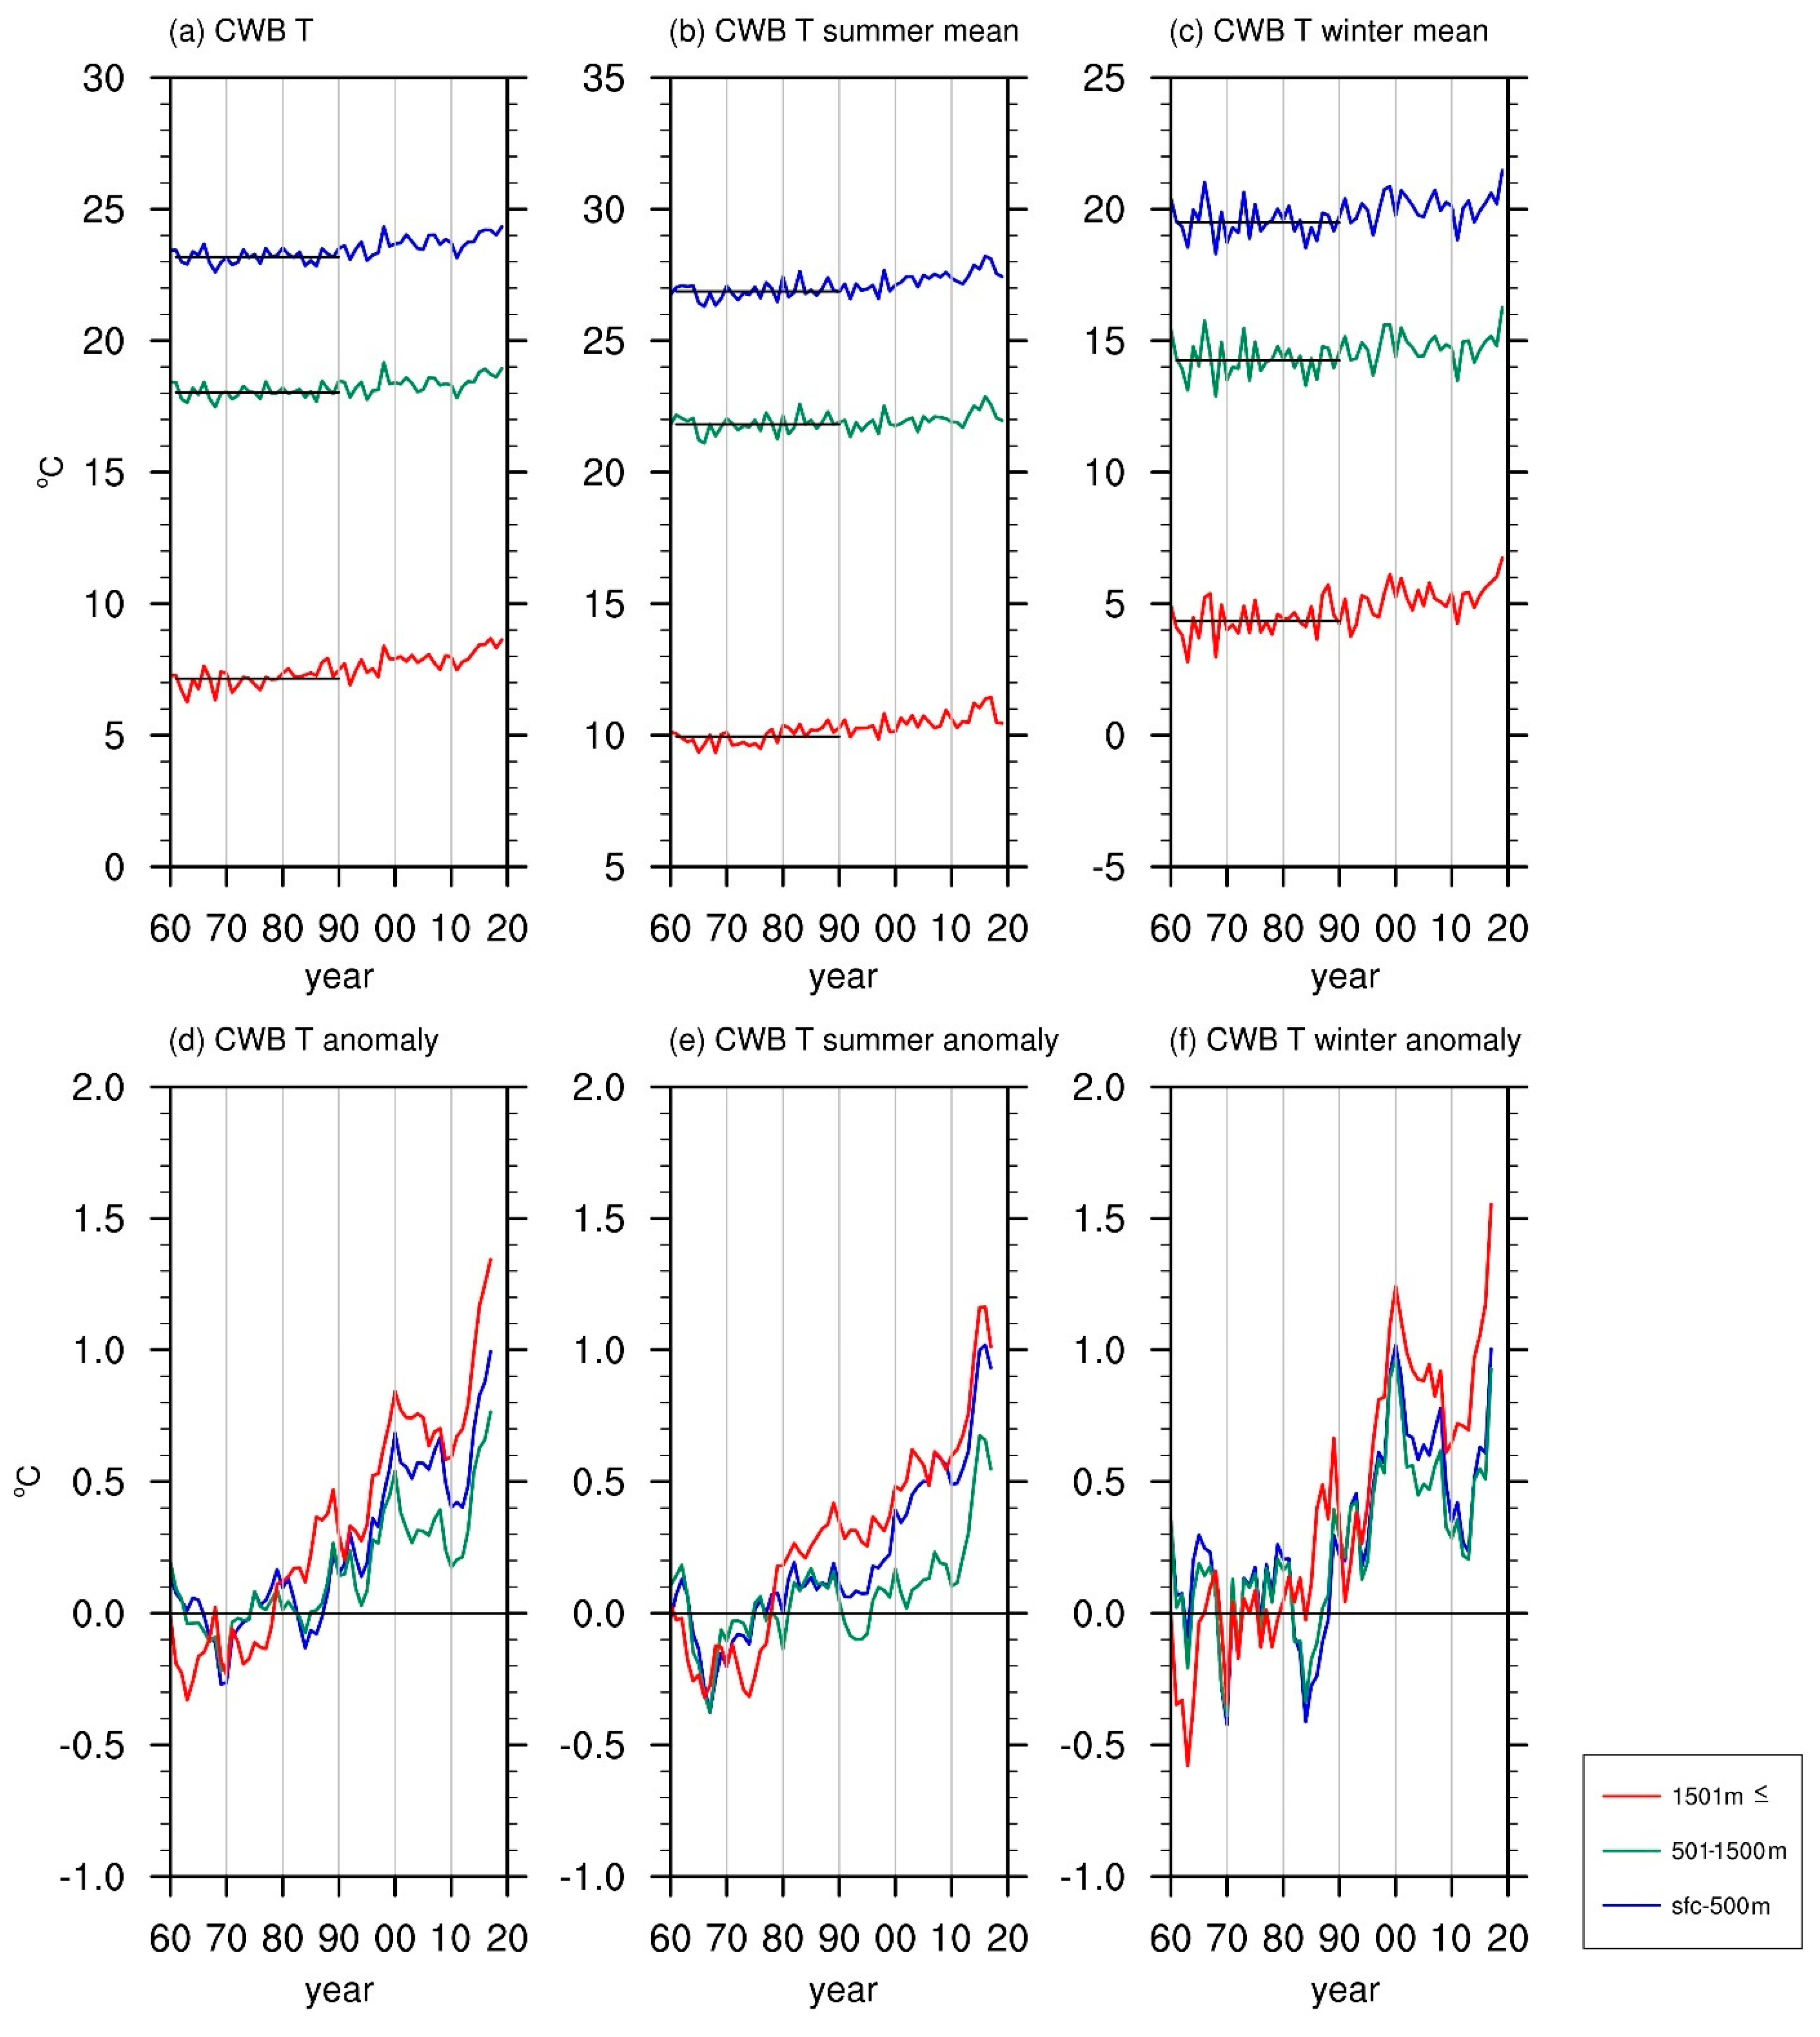
In
Figure 1, the interannual variations of the annual mean temperature, the summer mean temperature, and the winter mean temperature for each altitude group explicitly present evidence of warming trends over the studied years. In the analysis of the annual mean temperature (
Figure 1a,d), temperatures in the group of the surface to 500 m cool down a bit before the early 1970s and then mildly warm up by the late 1980s. The variations become increasingly polarizing after the late 1980s, with a slight decrease in the 2000s, a small drop in the late 2000s, and a noticeable increase in the 2010s, while the overall temperature trend still goes up. In the slightly higher group of 501 m to 1500 m, the variations roughly catch up with the result of the lower altitudes, with a relatively moderate temperature increase in the 1990s, a cooling tendency in the 2000s, and, finally, intense warming after 2010. As the altitude elevates to above 1501 m, the warming begins earlier, with an absence of the mentioned slightly cooling tendencies found at lower altitudes before 1970. The warming trend here behaves more prominently than that of lower altitudes, and temperatures consistently rise most of the time, with a cooling trend seen in the 2000s and a dramatic increase after 2010. Compared to the relatively mild warming trends from the early 1970s to the late 1980s at lower altitudes, the highest altitude group experiences a faster warming condition during the same period and through the present. In other words, a more intense temperature increase at higher altitudes is observed over the past decades. These results suggest that there is a more sensitive reaction to global warming in areas of higher terrain.
As for the seasonal mean temperature for each year, similar but smoother variations can also be seen in the analysis of the summer mean temperatures (
Figure 1b,e). In the two lowest groups, the variations behave similarly to the annual mean temperature, while the changes stay relatively stable compared with the annual mean with a more consistent warming tendency since the 1990s. The most pronounced warming, again, appears in the highest group. The non-negligible warming since the early 1970s is substantially more prominent than those at lower altitudes. Although the warming stays relatively moderate during the 1980s and the early 1990s, the overall temperature-increasing trend is apparent. The variations behave more extremely, regardless of the altitude in the analysis of the winter mean temperature (
Figure 1c,f). The results in the two lowest groups are nearly identical throughout the studied years, except for a slightly larger temperature decrease found in the group of 501 m to 1500 m in the mid-2000s. Despite a noticeable cooling seen in the 2000s, the most intense temperature increase again occurs in the group of above 1501 m.
These results show that the atmosphere at higher altitudes encounters more severe warming conditions than at lower altitudes over the studied years, which implies that temperatures at higher altitudes are possibly more sensitive to global warming. Regardless of the altitude, the intense warming during the winter half of the year contributes more to the overall warming condition over the past decades, with the most severe temperature increase occurring at higher altitudes. Apart from the considerable increase in temperature, the variations during the winter half also vary more towards extreme conditions. Although the warming during the summer half of the year is not as intense as the winter half, high-altitude regions also experience a greater degree of temperature increase. All of these results indicate that higher altitudes in Taiwan are potentially more susceptible and vulnerable to extreme weather conditions during boreal winter and spring, especially under ongoing global warming conditions.
3.2. Annual Cycle of Vertical Temperature Profile by Radiosonde Observations
The majority of the surface-based meteorological observation network is located at altitudes that are lower than 500 m, and the remaining stations disperse to higher altitudes, which considerably limits researchers ability to obtain enough and accurate atmospheric information at higher altitudes. In addition, the highest weather station in Taiwan, the Yushan weather station, only nearly reaches the middle troposphere. Thus, the limitation of the topographic altitude greatly restricts the investigation in the upper atmosphere.
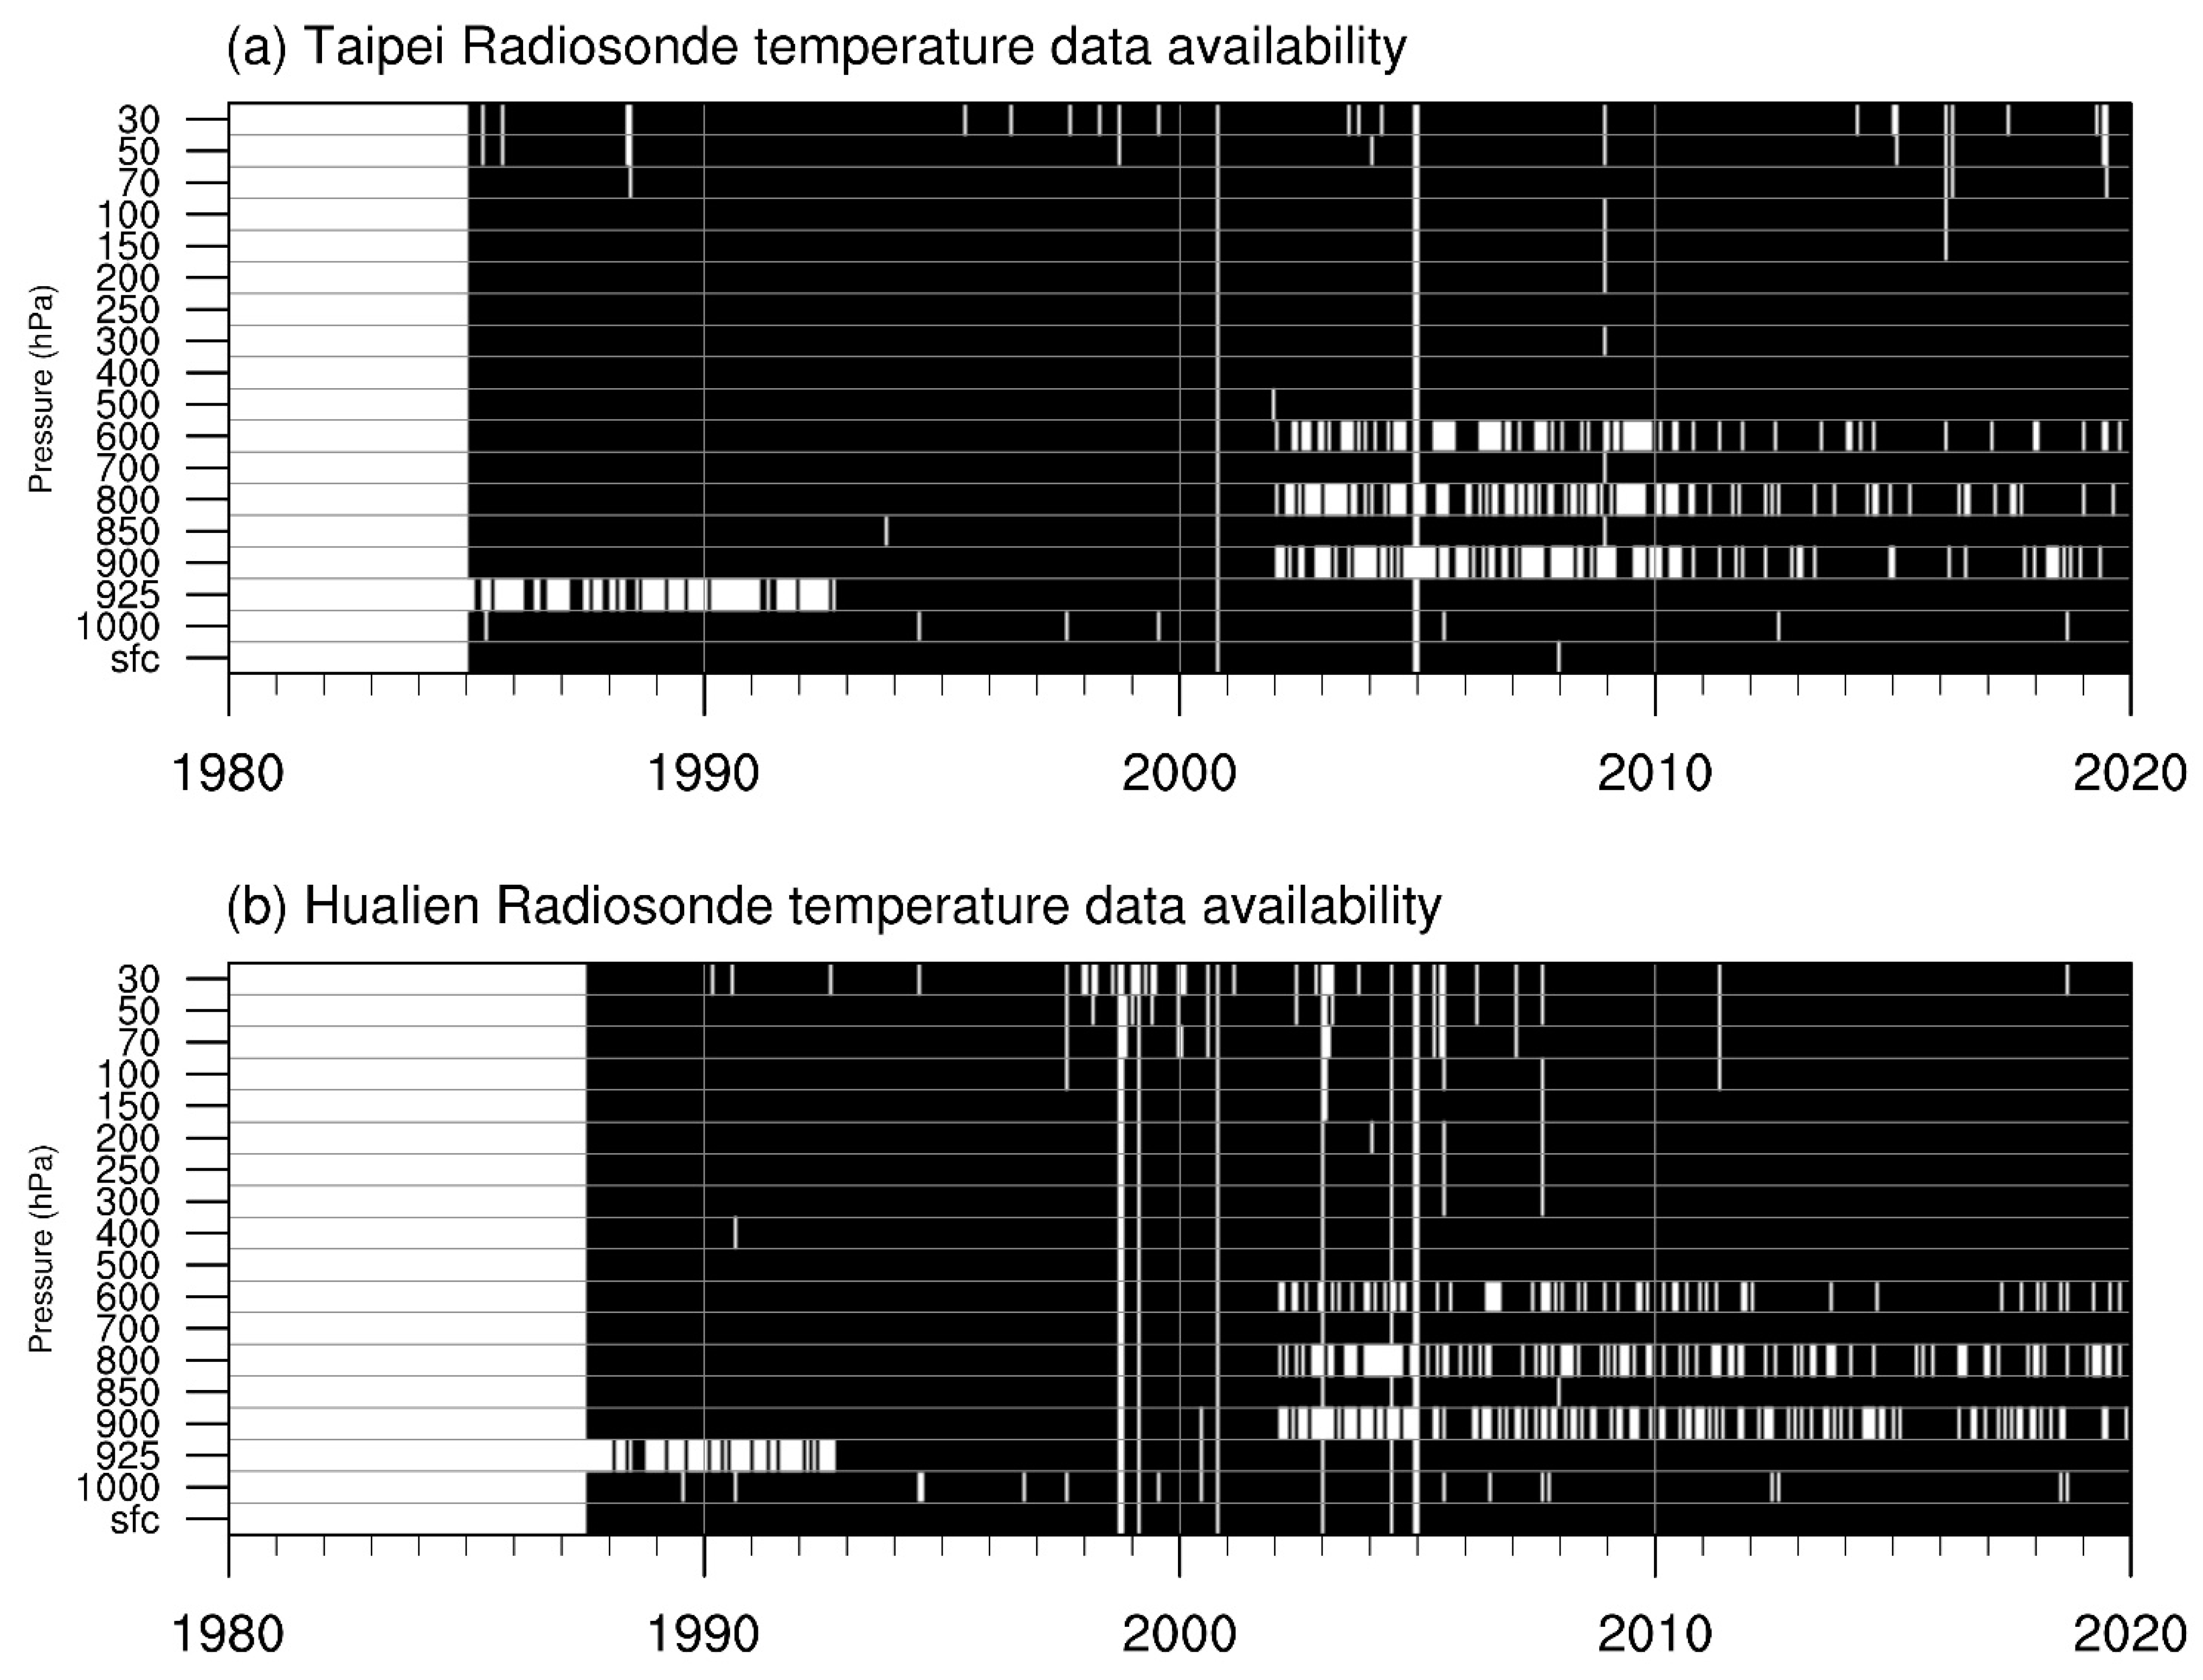
Nowadays, the most common method to fully explore the vertical profile of the upper atmosphere is to launch radiosonde balloons at a fixed place regularly. With routine atmospheric vertical observations at the CWB Taipei and Hualien sounding stations,
Figure 2a,b demonstrate data availability for every date at each pressure layer from these two sounding stations, respectively. Since data missing mainly happens before 1993 at 925 hPa and since 2003 at 900 hPa, 800 hPa, and 600 hPa, these pressure layers are eliminated in order to avoid disturbing the mean value in a certain year during these periods.
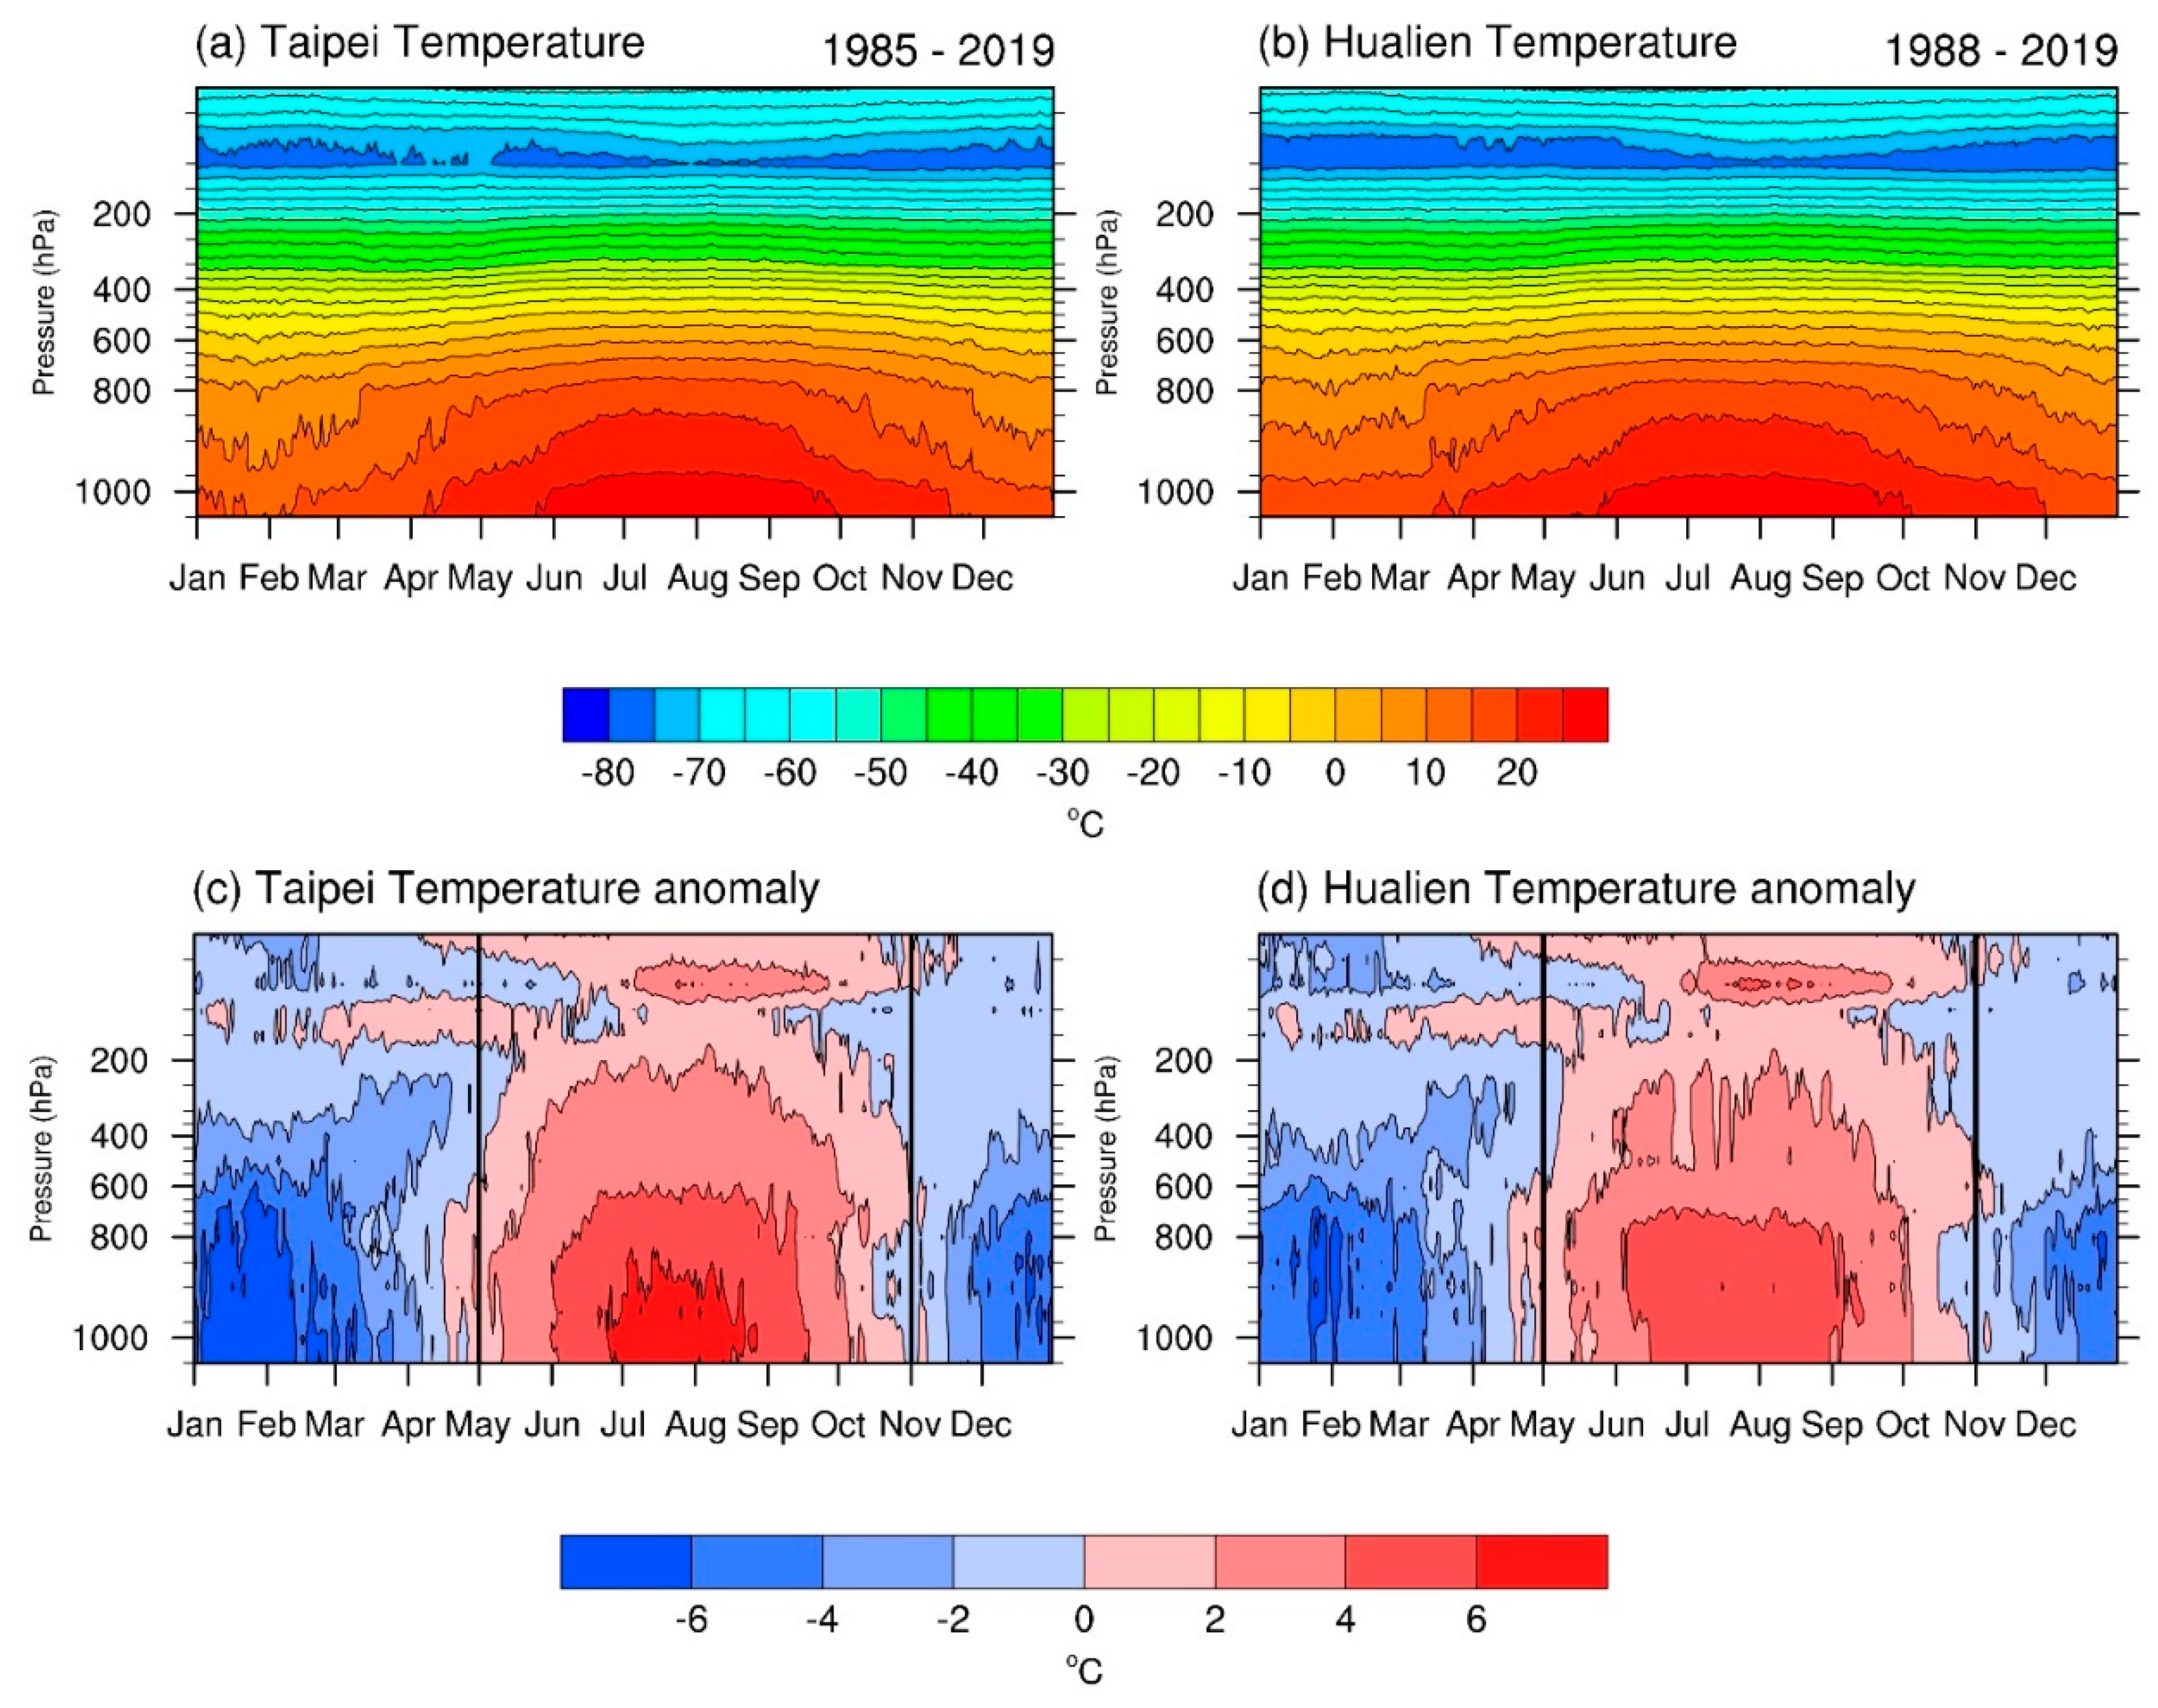
The vertical temperature profile of the atmosphere is obtained through analyzing the radiosonde data above the two stations. Climatological annual cycles of the vertical temperature profile above the Taipei and Hualien sounding stations during their respective operation periods are presented.
Figure 3a,b are the sounding results above Taipei and Hualien, respectively, and they demonstrate much comprehensive and complete vertical information compared with the analysis from the surface-based meteorological observations. Both the Taipei and Hualien sounding results show similar patterns in terms of vertical change, presenting a steady cooling of temperature with the height below the layer of about 100 hPa and a clear reverse of lapse rate above that layer, which should be regarded as the end of the troposphere, namely the tropopause. It varies with seasons, reaching the highest layer at about 17.4 km during the boreal spring and the lowest at about 16.7 km during the boreal summer above Taiwan [
36].
As for seasonal temperature variations within the troposphere, both stations have rather identical patterns above 500 hPa, and the main distinction between these two places is seen in the lower atmosphere. The Taipei sounding station is located around 115 km northwest of the Hualien sounding station. The latter lies in a warmer climate and would not be directly affected by the cold winter monsoon coming from Siberia. Hence, compared with Taipei, Hualien experiences a more extended summer and stays relatively warm in winter, especially in January and February.
The annual cycle of temperature anomaly for these two stations also clearly demonstrates seasonal variations during a year (
Figure 3c,d). The results can be roughly classified by the defined cooler winter half from November to next April and the warmer summer half from May to October. Although the sounding results above Taipei and Hualien are to be expected in terms of seasonal and vertical variations, some important information is available. As expected, the temperature above Taipei drops more significantly during the winter half than it does above Hualien; however, the opposite situation is seen during the summer half of the year, with the temperature above Taipei rising more intensively. This phenomenon indicates that the urban heat island effect is occurring during the warm seasons above the Taipei basin where the Taipei sounding station is.
3.3. Decadal Trends of Temperature at Various Pressure Layers by Radiosonde Observations
The more pronounced tropical upper-tropospheric warming in long-term changes was previously well discussed through applying model runs, satellite observations, or reanalysis datasets. Vertical observations from the two CWB sounding stations provide a different opportunity to discover the upper-atmospheric environments over Taiwan. This study mainly explores long-term variations of temperature within the troposphere, and, therefore, information above the tropopause—which is higher than around 125 hPa above Taiwan—is ignored. In
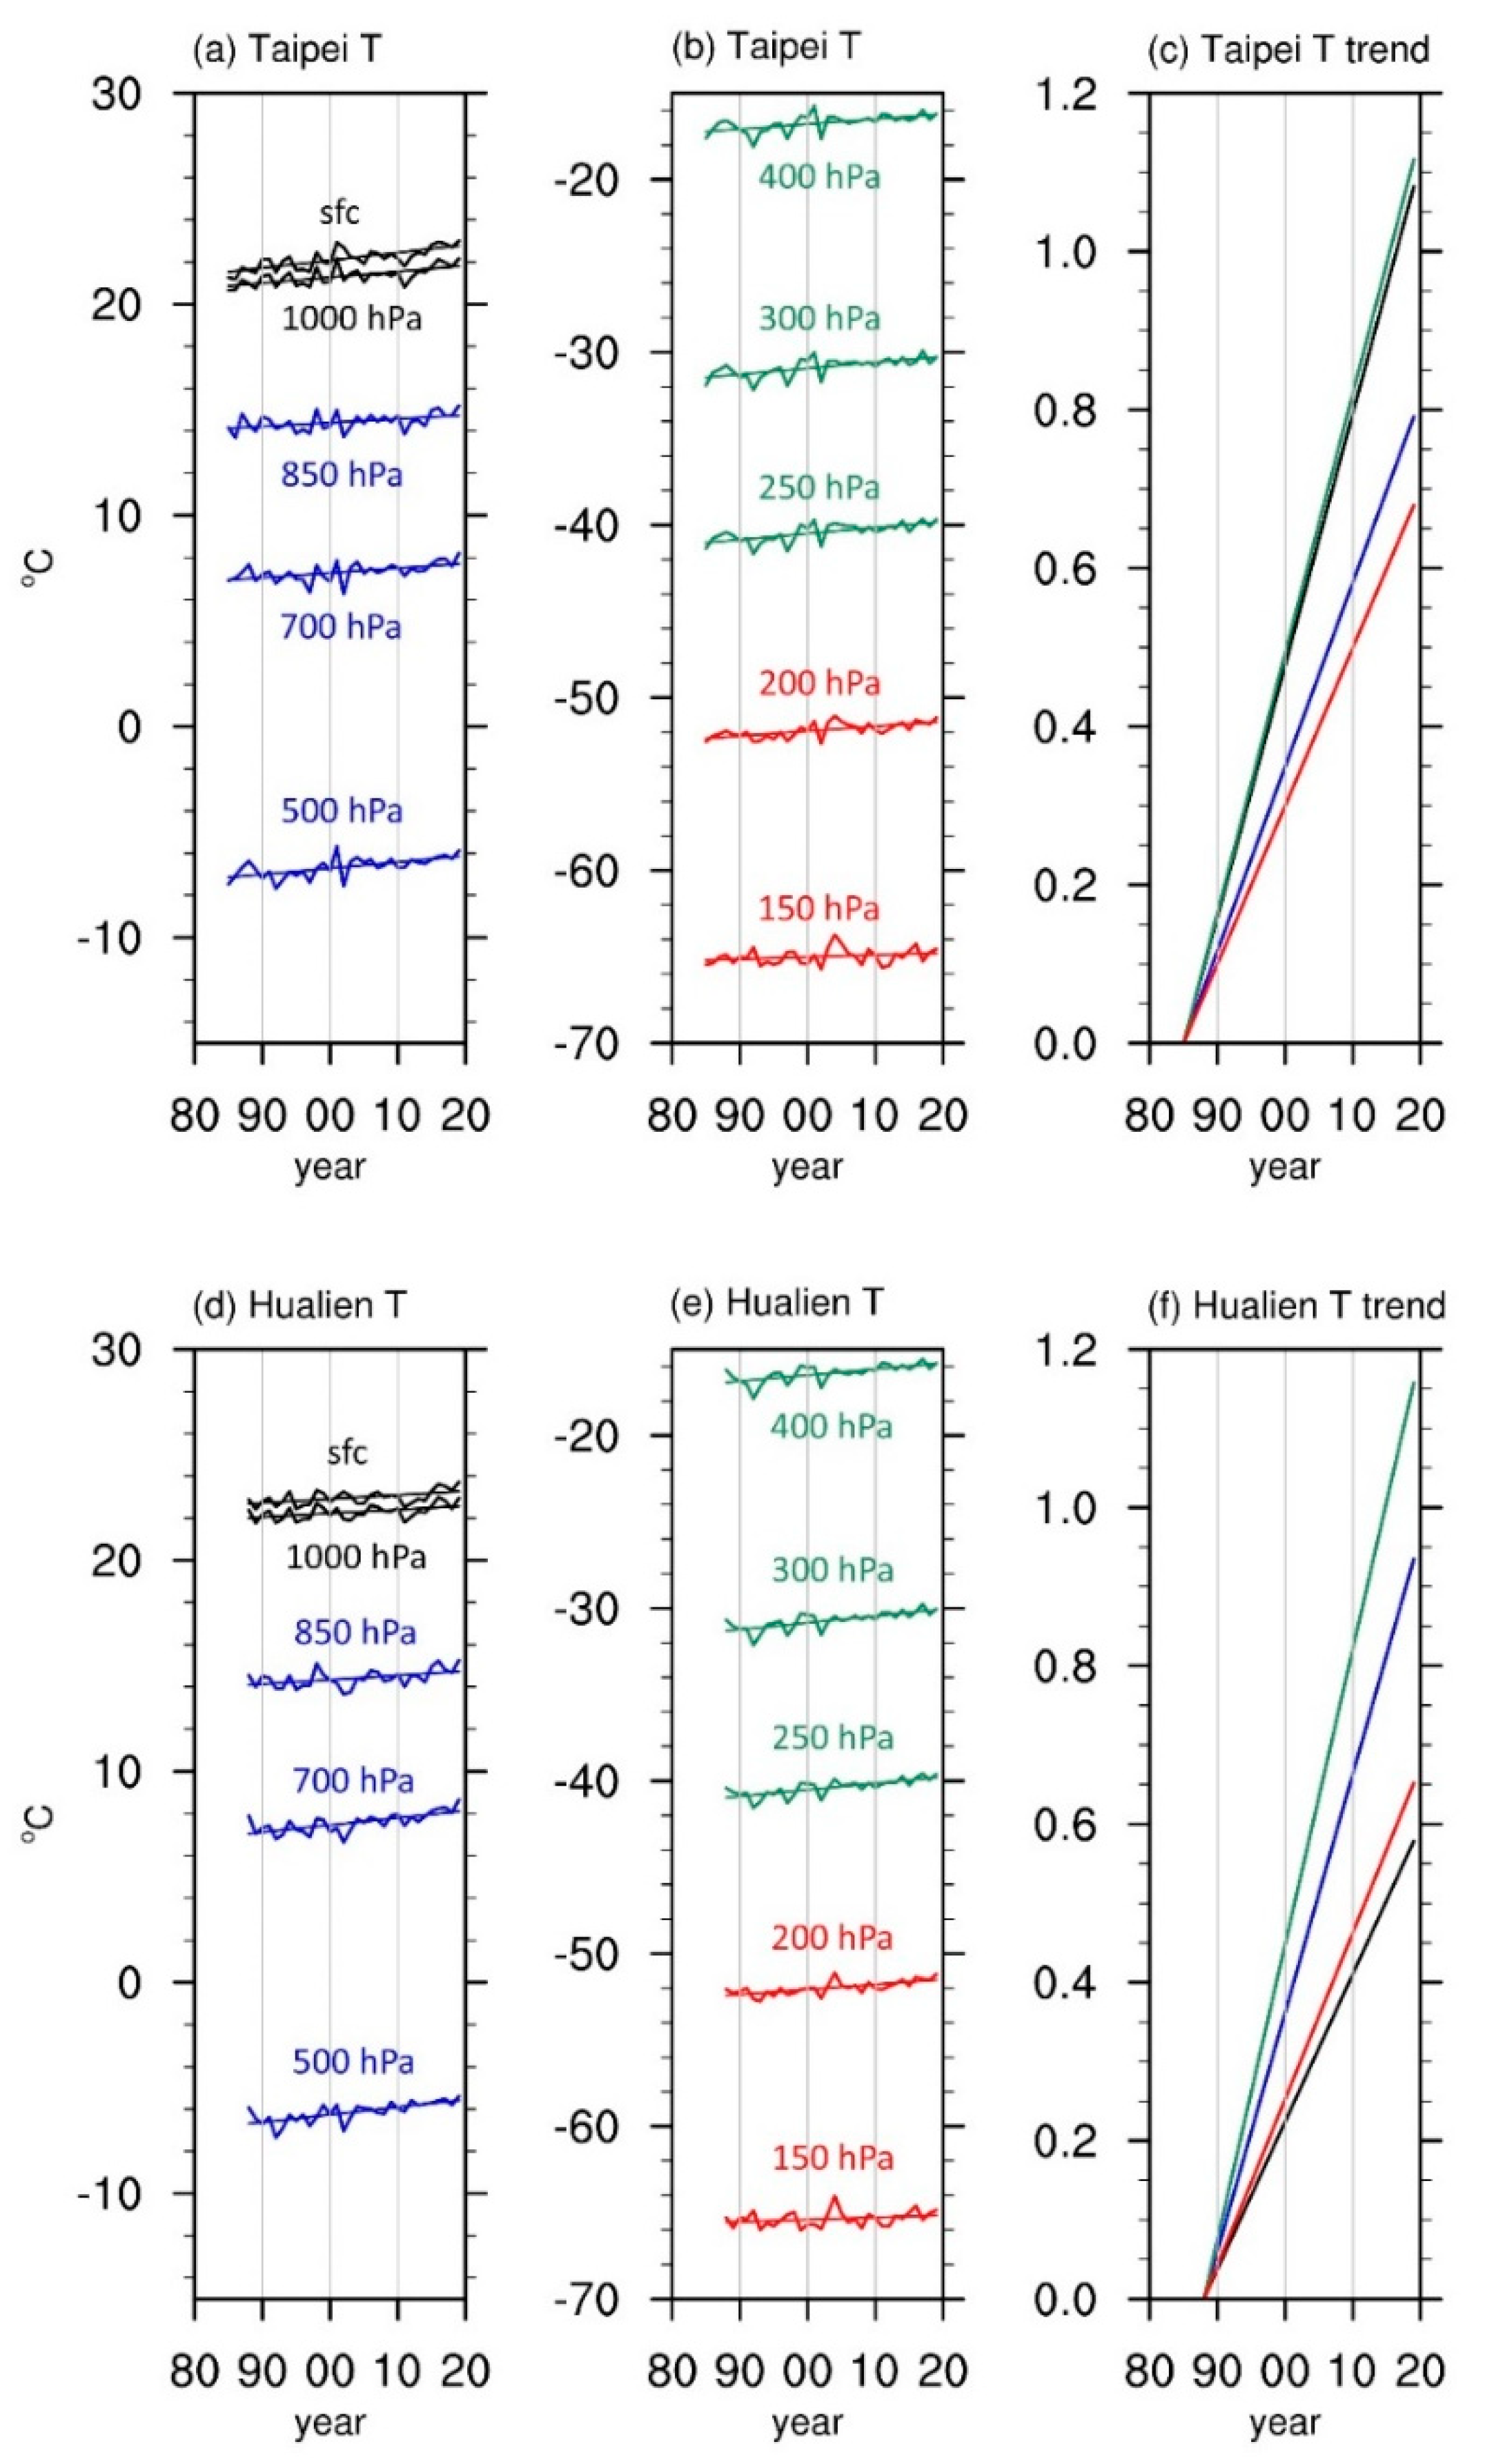
Figure 4, the analyzed pressure layers from the surface to 150 hPa are categorized into several groups for different analysis purposes: the surface to 1000 hPa (in black) for evaluating surface heating, 850 hPa to 500 hPa (in blue) for assessing middle-to-low layers warming, 400 hPa to 250 hPa (in green) for verifying the discussed upper-tropospheric warming, and 200 hPa to 150 hPa (in red) for examining temperature variations near the tropopause.
The variations of the annual mean temperature and associated temperature trend for each corresponding studied group above the Taipei and Hualien sounding stations are presented. During the analyzed years, an intense warming trend over Taipei occurs in the lowest atmosphere, with a warming rate of 0.29 °C per decade and uncertainty (standard error) ranges between 0.0053 °C and 0.0054 °C. As the elevation increases, the warming trend mitigates at mid-to-low layers of 850 hPa to 500 hPa, with a warming rate of 0.21 °C per decade and uncertainty (standard error) ranges between 0.006 °C and 0.0062 °C. The warming trend then becomes the most intense, although it is just slightly more than the lowest layers, in the upper troposphere from 400 hPa to 250 hPa, with a warming rate of 0.3 °C per decade and uncertainty (standard error) ranges between 0.0066 °C and 0.007 °C. After reaching the peak warming rate between 400 hPa to 250 hPa, the warming trend becomes the least pronounced at the highest layers near the tropopause, with a warming rate of 0.18 °C per decade and uncertainty (standard error) ranges between 0.0055 °C and 0.0074 °C.
The same analysis for Hualien shows a different story. The least warming condition occurs at the bottom layers of the atmosphere with a warming rate of 0.17 °C per decade and uncertainty (standard error) ranges between 0.0055 °C and 0.0056 °C. The warming trends become more intense as the elevation increases to the layers between 850 hPa and 500 hPa, with a warming rate of 0.27 °C per decade and uncertainty (standard error) ranges between 0.0064 °C and 0.007 °C. The maximum temperature increase is seen in the group of 400 hPa to 250 hPa, reaching a warming rate of 0.34 °C per decade and uncertainty (standard error) ranges between 0.0063 °C and 0.0072 °C. The trend becomes moderate in the highest group of 200 hPa to 150 hPa, with a warming rate of 0.19 °C per decade and uncertainty (standard error) ranges between 0.0055 °C and 0.0083 °C, just slightly more intense than the near-surface layers.
The pronounced warming trends observed in the upper troposphere over Taipei and Hualien well echo what was found by [
17], showing that their finding, which was achieved through the reanalysis dataset, can also be detected via local radiosonde observations. In general, the warming trends within the troposphere gradually intensify with the height below the layer of 250 hPa and then mitigate near the top of the troposphere; however, the result also clearly reveals an exception of fast warming at the near-surface layers in Taipei. Since the location of the Taipei sounding station lies right in the Taipei basin, where the metropolis has been quickly developing and expanding over recent decades, the urban heat island effect should greatly contribute to the worrying temperature increases near the surface. In comparison, the urban scale of Hualien is much smaller than the Taipei metropolitan area, so the effects from anthropic activities should be lighter. This indicates that Hualien may present a better reflection of actual overall atmospheric environments.
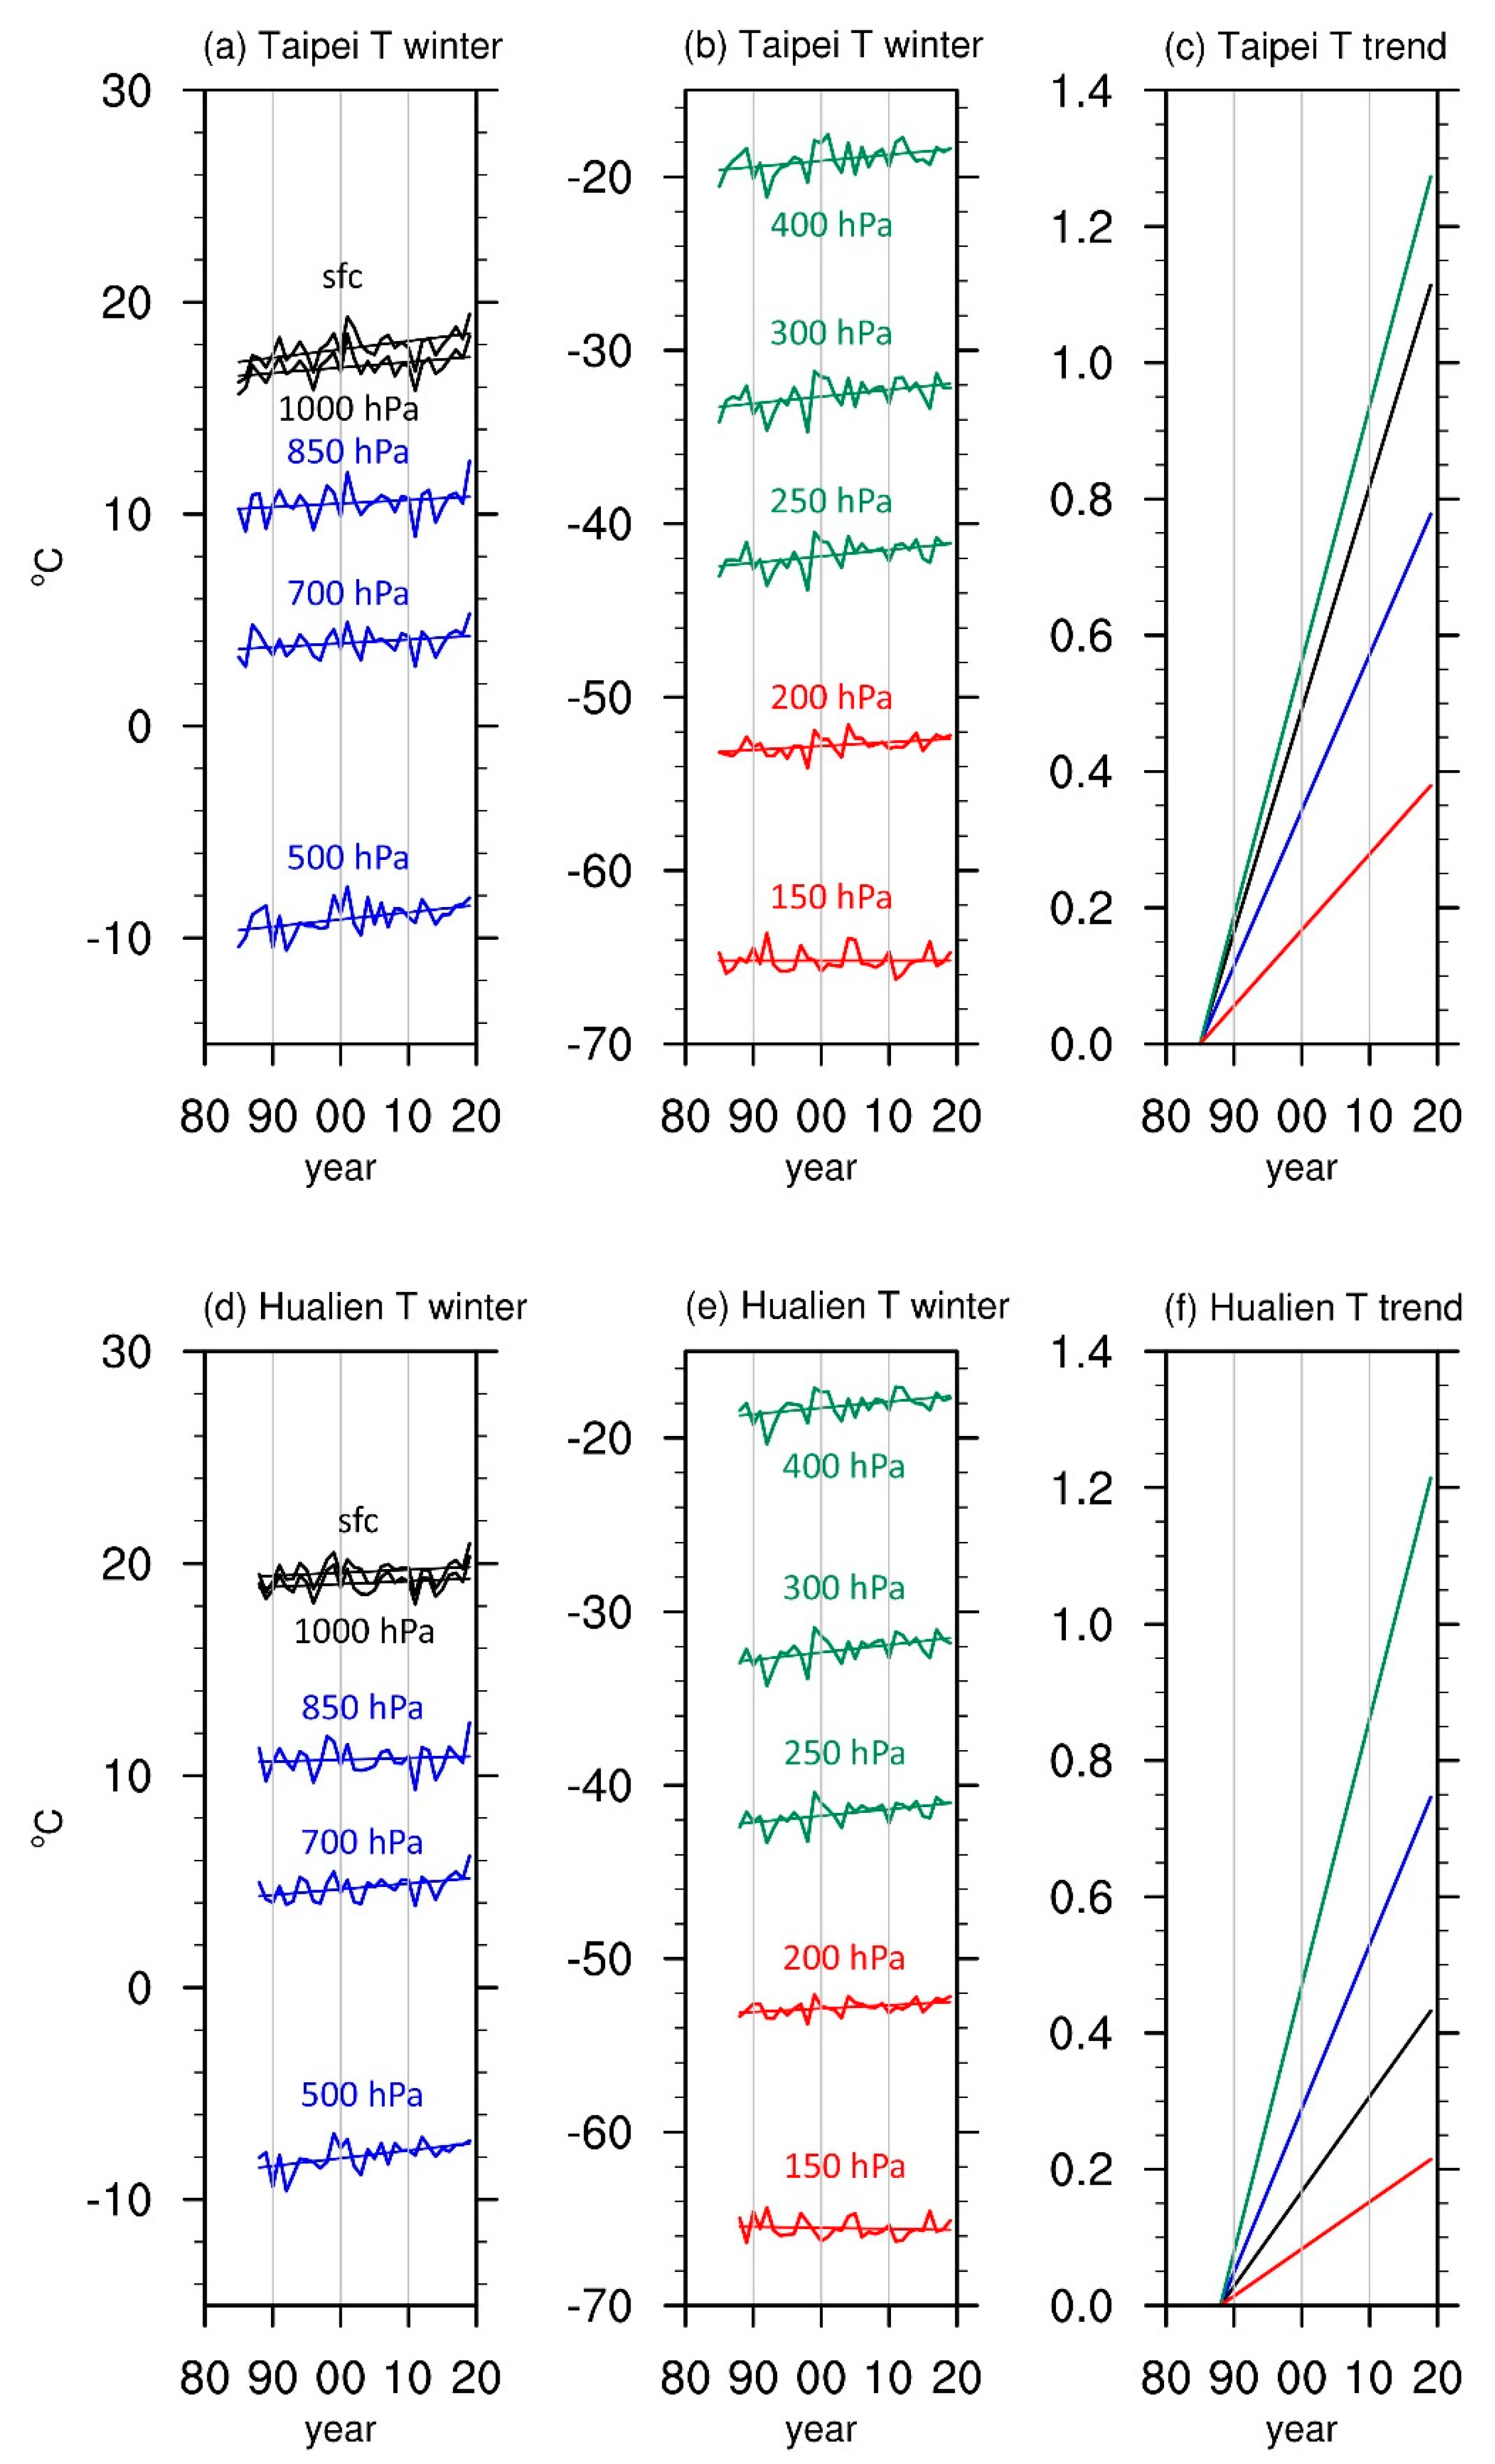
The temperature analysis from the surface weather stations suggests more intense warmings at higher altitudes, especially during the winter half of the year, as shown in
Figure 1. Hence, the examinations of the winter mean temperature from November to next April based on the radiosonde observations are presented in
Figure 5. The results reveal warming tendencies across the studied layers over Taipei and Hualien during the winter half of the year. The warming trends over Taipei show similarity to the annual mean with a notable temperature increase rate of 0.29 °C per decade and uncertainty (standard error) ranges between 0.001 °C and 0.0103 °C at the near-surface layers. As the elevation goes up to the layers between 850 hPa and 250 hPa, the temperature also increases similarly to the annual mean, with a warming rate of 0.21 °C per decade and uncertainty (standard error) ranges between 0.01 °C and 0.0121 °C. The least temperature rise occurs near the tropopause, presenting a warming rate of 0.1 °C per decade and uncertainty (standard error) ranges between 0.0079 °C and 0.0107 °C. The warming in the upper troposphere between 400 hPa and 250 hPa is the most intense, with its rate of 0.34 °C per decade and uncertainty (standard error) ranges between 0.0117 °C and 0.0134 °C, and it also shows a faster warming condition than the annual mean temperature.
The result of the winter half in Hualien also reveals a bigger temperature jump than the annual mean between 400 hPa and 250 hPa over the past decades, with a warming rate of 0.35 °C per decade and uncertainty (standard error) ranges between 0.0112 °C and 0.013 °C. It also shows much more prominent warming than the other layers, including the group of the surface and 1000 hPa, with a warming rate of 0.13 °C per decade and uncertainty (standard error) ranges between 0.0098 °C and 0.01 °C, the group of 850 hPa to 500 hPa, with a warming rate of 0.22 °C per decade and uncertainty (standard error) ranges between 0.0099 °C and 0.0129 °C, and the highest group of 200 hPa and 150 hPa, with a warming rate of 0.06 °C per decade and uncertainty (standard error) ranges between 0.0071 °C and 0.0107 °C. Thus, both the observations over Taipei and Hualien indicate more pronounced upper-tropospheric warming trends during the winter half of the year, which implies uneven heating processes for the upper atmosphere during the year. One should also note that the temperature at the near-surface layers in Taipei increases much more quickly (warming rate: 0.29 °C per decade) than in Hualien (warming rate: 0.13 °C per decade), which is similar to the result seen in the annual mean temperature analysis (
Figure 4) with a more considerable temperature difference between these two places. It indicates that Taipei suffers from the urban heat island effect more than Hualien. In addition, a more significant urban heat island effect during the winter half than across the entire year is found when the difference of the near-surface warming between these two places is examined.
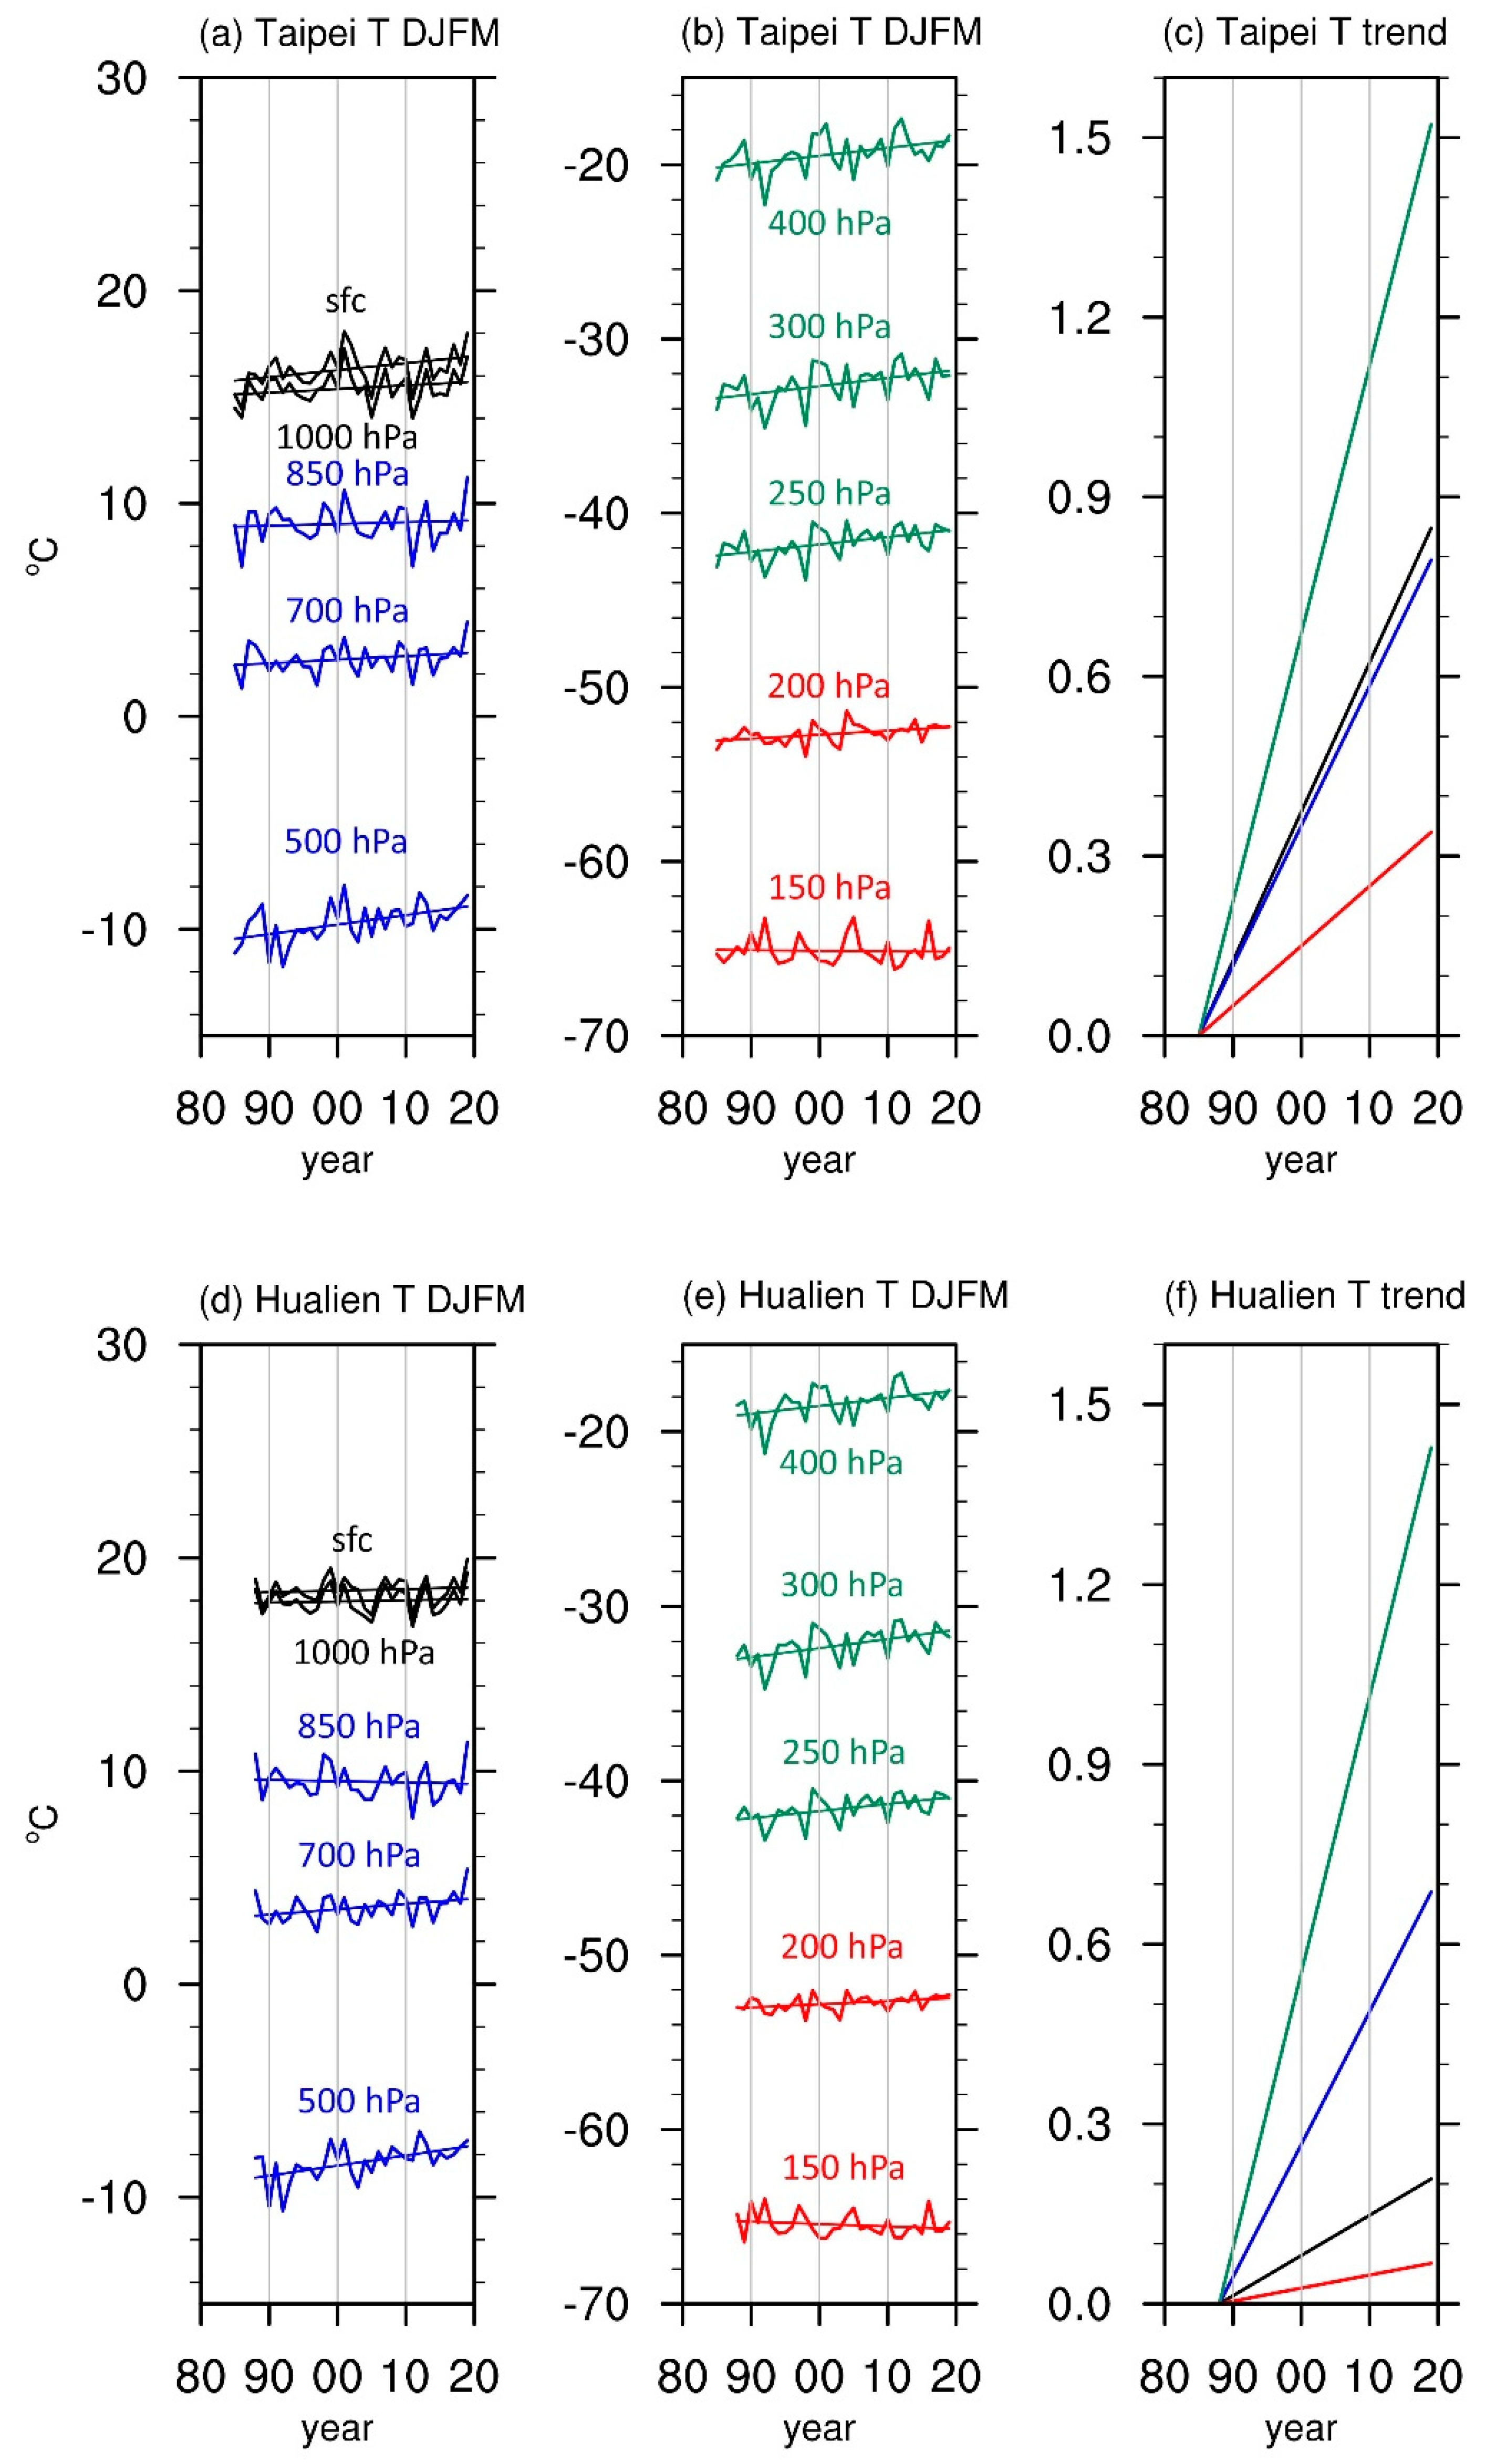
The tropical upper-tropospheric warming proved to be more prominent during the winter half, as shown in
Figure 5. A similar finding was proposed with a faster warming trend in the upper troposphere during the boreal winter and early spring than during the rest of the year [
17]. Therefore, this study follows their analyzed months from December to next March (hereafter DJFM) and further concentrates on the mean temperature over these months (
Figure 6). Generally, the warming conditions during DJFM are relatively similar to the results of the annual mean and winter mean temperatures, but some noteworthy differences emerge when each group of pressure layers is examined. Observational results from the Taipei sounding station show an intense warming rate of 0.22 °C per decade and uncertainty (standard error) ranges between 0.012 °C and 0.0127 °C at the near-surface layers, and a slightly more moderate trend in the middle troposphere with a warming rate of 0.21 °C per decade and uncertainty (standard error) ranges between 0.011 °C and 0.0147 °C. Similar to the annual mean and winter mean results, the maximum warming during DJFM occurs in the upper troposphere with a warming rate of 0.4 °C per decade and uncertainty (standard error) ranges between 0.013 °C and 0.0163 °C. The peak warming is followed by a moderate temperature increase near the tropopause, with a warming rate of 0.09 °C per decade and uncertainty (standard error) ranges between 0.0084 °C and 0.013 °C. However, the extent of the warming in the upper troposphere significantly intensified compared with the annual mean and winter mean temperatures, suggesting a major warming condition from 400 hPa to 250 hPa during the boreal winter and early spring.
The observational warming under 250 hPa over Hualien also becomes more prominent as the elevation increases. At the two lowest layers, it presents a much smaller temperature increase rate of 0.06 °C per decade and uncertainty (standard error) ranges between 0.0115 °C and 0.0118 °C than Taipei (warming rate: 0.22 °C per decade), which, again, implies that there is less of an urban heat island effect in Hualien. The warming becomes faster between 850 hPa and 500 hPa, with a warming rate of 0.2 °C per decade and uncertainty (standard error) ranges between 0.0115 °C and 0.015 °C. The maximum temperature increase is also seen in the group of 400 hPa to 250 hPa, with a warming rate of 0.41 °C per decade and uncertainty (standard error) ranges between 0.013 °C to 0.0164 °C, and then the least notable warming just below the tropopause is shown with its warming rate of 0.02 °C per decade and uncertainty (standard error) ranges between 0.0082 °C and 0.0127 °C. Similar to Taipei, the upper troposphere over Hualien during DJFM reveals a significantly more intense temperature increasing trend than the annual mean and winter mean. These indicate that the higher-layer atmospheric environments, particularly the upper troposphere above the tropical (or the adjacent) regions, are more sensitive to the current global warming background, especially during the boreal winter and early spring. In contrast, the impact of global warming seems to only be reaching 250 hPa and does not go further up.
4. Conclusions and Discussions
Since the 20th century, global warming has been a debatable topic across the scientific fields and wider society. Through investigations of long-term temperature variations, previous studies raised great concerns about global warming and increasing risks of encountering climate extremes together with associated hazards. Much of the previous literature discussed the general knowledge of global warming [
37] and the behavior change of meteorological systems under such warming [
38], while some studies described long-term changes at higher layers of the troposphere through model simulations or satellite observations. Elucidation by [
17] about long-term changes in the upper-tropospheric warming above tropical western Pacific was based on the ERA-Interim dataset and revealed maximum warming occurring between 400 hPa and 250 hPa, particularly during the boreal winter and early spring. Rather than applying model simulations, satellite-borne observations, or reanalysis datasets as the previous studies did, this study investigates local observational data in Taiwan, including long-term variations of temperature at various altitudes and pressure layers.
In order to demonstrate interannual variations, temperatures from each station at each altitude are annually and seasonally averaged for a studied year, with the defined winter half from November through next April and the summer half from May through October. In addition, all of the stations are categorized into different ranges by altitude, in order to represent the corresponding climate information. The results from the surface-based observational network indicate a more warming-sensitive atmospheric environment at higher altitudes, suggesting more pronounced warming at higher altitudes than the surface and lower altitudes. The results also imply that temperatures at higher altitudes are possibly more sensitive to global warming. Furthermore, the variations of the seasonal mean temperatures reveal the most intense temperature increase occurring during boreal winter and spring.
Given that surface-based observations cannot present a complete image in the upper-layer troposphere, radiosonde observations at the CWB Taipei and Hualien sounding stations are also adopted in order to clarify more information in terms of long-term trends at higher pressure layers within the troposphere. A similar categorizing approach for different pressure layers is applied to differentiate four analyzed groups of pressure layers. In general, the results present more intense warming trends at higher layers than those at lower layers, except for the fast near-surface warming in Taipei, which is likely due to the urban heat island effect caused by the rapid development of anthropic activities in the Taipei metropolitan area. The urban heat island effect in Taipei is also shown in the annual cycle of temperature anomaly, demonstrated by more extreme temperature variations during a year. The Taipei and Hualien radiosonde observations reveal the most prominent warming occurring between 400 hPa and 250 hPa. In addition, the pronounced upper-tropospheric warming between these two pressure layers further intensifies during the boreal winter and early spring from December to next March. These results imply that the higher-layer atmospheric environment, particularly the upper troposphere, is more susceptible to global warming. However, the steep temperature-increasing trend does not carry over between 200 hPa and 150 hPa, just below the tropopause. In other words, the upper-layer temperatures near the top of the troposphere mildly warmed up over the past decades, while the layers below encountered a significantly more severe warming condition.
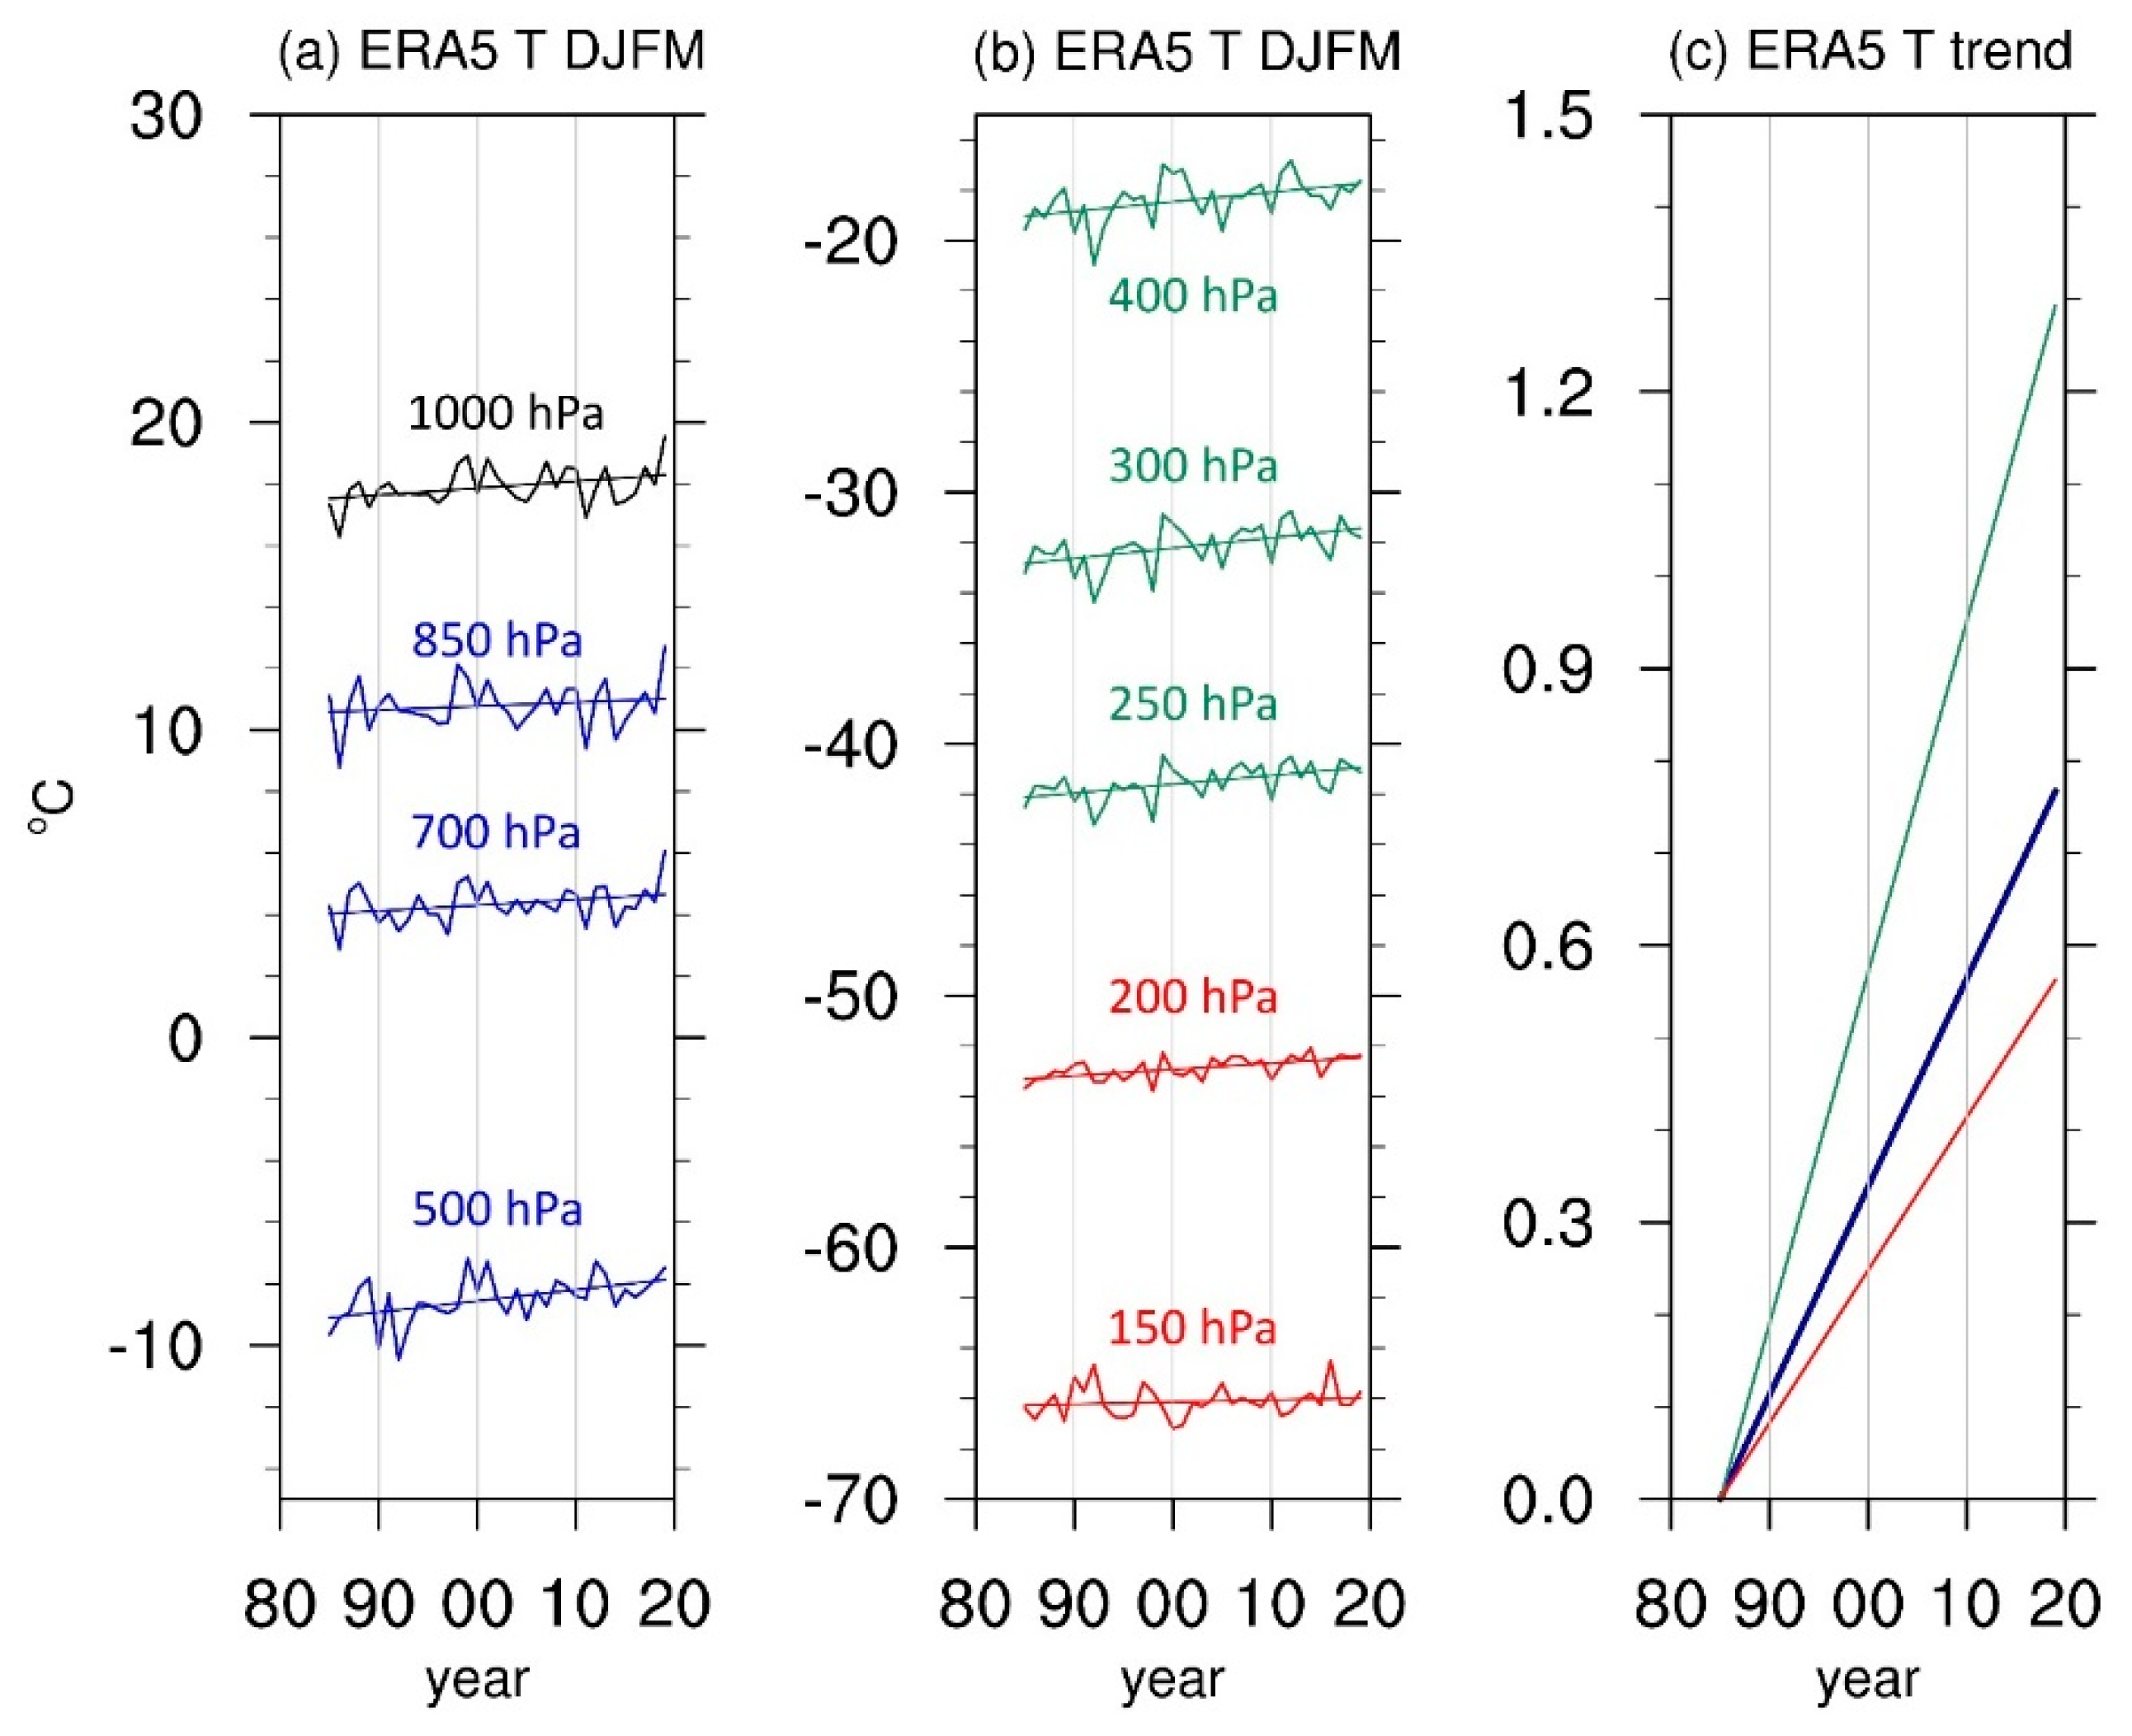
The tropical upper-tropospheric warming has been previously identified by the reanalysis data. Therefore, reanalysis temperature data from the most recent ERA5 (
Figure 7) are also examined for comparison with our radiosonde observational results in this study. The results from the reanalysis data generally perform similarly to the radiosonde observations, especially in relation to Taipei; however, the trend analysis suggests some differences from the observational results. In the reanalysis result, the upper troposphere from 400 hPa to 250 hPa still reveals a fast warming trend, with a rate of 0.34 °C per decade and uncertainty (standard error) ranges between 0.01 °C and 0.0132 °C, while the value of warming is rather underrated compared with the observational results of Taipei (warming rate: 0.4 °C per decade) and Hualien (warming rate: 0.41 °C per decade). The reanalysis result also presents the least temperature increase between 200 hPa and 150 hPa with a warming rate of 0.15 °C per decade and uncertainty (standard error) ranges between 0.006 °C and 0.0102 °C. However, compared with the observational results of Taipei and Hualien, the warming rate of the reanalysis at the highest layers is significantly overrated. The ERA5 reveals controversial warming results at the four lowest layers, from 1000 hPa to 500 hPa. The bottom layer at 1000 hPa and the higher layers above it, between 850 hPa and 500 hPa, fail to well-distinguish their warming trends from each other with nearly identical warming rates. The former increases at a rate of 0.203 °C per decade with uncertainty (standard error) of 0.0099 °C, and the latter shows a warming rate of 0.2027 °C per decade and uncertainty (standard error) ranges between 0.0099 °C and 0.0128 °C. This problem may be attributed to the limitation of spatial grid points around Taiwan while applying a regional mean, even though high spatial resolution is a main feature of the ERA5 dataset. In addition, since the warming at 1000 hPa includes other results from higher layers, the reanalysis data fail to present the notable low-layer warming found in Taipei which is a consequence of the urban heat island effect. It indicates the fact that such a local meteorological signal is likely to be neglected while the reanalysis data is being processed, further stressing the lack of detailed information for a studied small local region. This highlights the necessity and advantage of applying local observational data to acquire more accurate meteorological information within a small local region.
According to the results of [
17], the pronounced tropical upper-tropospheric warming can be contributed by two mechanisms, the non-radiative and radiative processes. The former is related to the variations of deep convection, and the latter, being the main contributor, is associated with the oceanic dynamical process and heat storage. Taiwan is located right on the Tropic of Cancer in the Northern Hemisphere in the western Pacific, which means that the causes of the warming phenomenon in the upper troposphere above the island should be within the scope of the mentioned non-radiative and radiative processes. Although the temperatures at upper layers have described prominent warming trends in this study, detailed variations year by year and the associated compound contributors potentially facilitating the changes still need an in-depth exploration. Thus, it should be a potential topic of interest and requires different data sources for more comprehensive examinations.


