Article

Copula-Based Drought Monitoring and Assessment According to Zonal and Meridional Temperature Gradients

1
State Key Laboratory of Water Resources and Hydropower Engineering Science, Wuhan University, Wuhan 430072, China
2
Department of Civil Engineering, Joongbu University, Goyang-si 10279, Korea
*
Authors to whom correspondence should be addressed.
Atmosphere 2021, 12(8), 1066; https://doi.org/10.3390/atmos12081066
Submission received: 19 July 2021 / Revised: 14 August 2021 / Accepted: 18 August 2021 / Published: 20 August 2021

Abstract

:
Drought is one of the most severe natural disasters. However, many of its characteristic variables have complex nonlinear relationships. Therefore, it is difficult to construct effective drought assessment models. In this study, we analyzed regional drought characteristics in China to identify their relationship with changes in meridional and zonal temperature gradients. Drought duration and severity were extracted according to standardized precipitation evapotranspiration index (SPEI) drought grades. Trends in drought duration and severity were detected by the Mann-Kendall test for the period of 1979–2019; they showed that both parameters had been steadily increasing during that time. Nevertheless, the increasing trend in drought severity was particularly significant for northwest and southwest China. A composite analysis confirmed the relationships between drought characteristics and temperature gradients. The northwest areas were relatively less affected by temperature gradients, as they are landlocked, remote from the ocean, and only slightly influenced by the land–ocean thermal contrast (LOC) and the meridional temperature gradient (MTG). The impacts of LOC and MTG on drought duration and severity were positive in the southwest region of China but negative in the northeast. As there was a strong correlation between drought duration and severity, we constructed a 2D copula function model of these parameters. The Gaussian, HuslerReiss, and Frank copula functions were the most appropriate distributions for the northeast, northwest, and southwest regions, respectively. As drought processes are highly complex, the present study explored the internal connections between drought duration and severity and their responses to meteorological conditions. In this manner, an accurate method of predicting future drought events was developed.

1. Introduction

Drought has devastating impacts and may be complex, variable, and highly destructive to human-environment systems. Drought occurs in nearly all global climate regions, but it differs in each region [1,2]. It has a significant effect on water resources [3], agricultural production [4], economic activity [5], and ecosystems [6,7]. There have been severe, large-scale droughts on all continents except Antarctica [8,9]. Over the past two centuries, at least 40 droughts of long duration occurred in western Canada [10]. Europe has been affected by numerous major drought events over the past 30 years, especially in 1976, 1989, 1991, and 2003 [11]. Severe, extreme droughts occurred in the late 1990s in many parts of China. Persistent, severe, multiyear droughts have frequently occurred in northern, northeastern, northwestern, and southwestern China [12]. Hence, drought events have attracted considerable research attention in recent decades [13,14]. The Fifth IPCC Assessment Report stated that the global surface temperature rose by 0.85 °C (0.65–1.06 °C) between 1880 and 2012 [15]. As global surface temperatures continue to rise, the risk of drought will increase as well [16,17,18,19,20]. Recent research has focused mainly on the causes, intensity, frequency, impact, and countermeasures of droughts. To predict recurrences, quantitative analyses of the drought index (severity and duration) have been conducted using probability models [21]. However, the accurate evaluation of drought onset, ending, and intensity remains a major issue.
The causes of drought are highly complex. Thus, it is difficult to establish and quantify drought event indicators [22]. Drought indices are quantified using precipitation, evapotranspiration, soil moisture, streamflow, and groundwater level [1]. Multiple time-scale drought indicators, such as the effective drought index (EDI) [23], the standardized precipitation index (SPI) [24], and the standardized precipitation evapotranspiration index (SPEI) [25], have been developed. Precipitation is an important factors in drought monitoring, and its distribution pattern has been altered by climate change. China is shifting towards decreasing precipitation [26]. Therefore, drought may be exacerbated in China. For these reasons, it is necessary to elucidate the dynamic changes that occur in the climate system. Several studies have implemented large-scale temperature indices to explain the climate variability resulting from the changes in radiative force associated with increasing greenhouse gas (GHG) levels [27]. The equator-to-pole meridional temperature gradient (MTG) and the land-ocean temperature contrast (LOC) could help delineate changes in temperature gradients. The former is related to the Hadley cell and the westerlies [28], while the latter is associated with eddy strength and quasi-geostrophic flow at mid/high latitudes [29]. In recent years, several researchers have indicated that relative differences between sea and land temperature contribute to atmospheric circulation and climate anomalies [30].
Unlike the effects of other natural disasters such as earthquakes, floods, and winds, the impact of drought is usually significant but also difficult to characterize; it may have varying degrees of intensity. Hence, it is difficult to identify the start and end points of drought events [31]. To date, there is no comprehensive academic definition for drought [32]. Nevertheless, drought severity and duration have attracted widespread attention. They are considered the main parameters for estimating other drought characteristics such as intensity, and are critical metrics for real-time, long-term drought management [33,34]. Accurate understanding and analysis of drought severity and duration are essential for drought monitoring and risk/hazard assessment. Prior research was simplified by assuming that drought severity and duration were random, independent variables. However, Vicente-Serrano et al. [25] empirically demonstrated that this assumption is unreasonable. In fact, several characteristic drought variables are not independent and form complex nonlinear relationships.
As there are mutual dependencies among various drought parameters, separate analyses of drought duration and severity cannot reveal the significant correlations between them. Rather than using traditional univariate frequency analysis in drought assessment, a more effective approach towards describing drought characteristics is to determine the joint distribution of drought variables. Shiau and Shen [35], Bonaccorso [36], González and Valdés [37], Salas [38], and Cancelliere and Salas [39] proposed different methods to investigate the joint distribution of drought duration and severity/intensity. The multivariate distribution, known as the copula function, connects multiple variables conforming to any marginal distribution, obtains a joint distribution function, and describes the correlations among the variables. In this manner, the limitations of the aforementioned multivariate model are overcome [40]. The copula function is versatile and has been widely used in hydrological drought analysis [41]. Shiau [42] first applied the copula function to the analysis of meteorological drought events.
China is severely affected by drought. Disaster mitigation after drought events requires manpower, materials, and financial resources, as well as systematic and coordinated management strategies. Under climate change, hydrometeorological phenomena such as drought are substantially altered. In the present study, we used the copula method to explore the correlations among internal drought characteristics, the relationship between the east–west and north–south temperature gradients in the northern hemisphere, and the occurrence of drought in China. Drought magnitude and occurrence may be predicted based on the correlations among drought characteristics and meteorological conditions. The following questions were addressed in this study: (1) What are the key drivers of long-term changes in the characteristics of drought in China? (2) What are the associations between the drought characteristics and the temperature gradients in China? and (3) What are the connections between the temperature gradient patterns and regional drought in China? The present study also proposed copula-based drought monitoring and assessment approaches that help clarify the potential impact of climate systems on the extreme drought events across China. Figure 1 shows the research framework for this study.

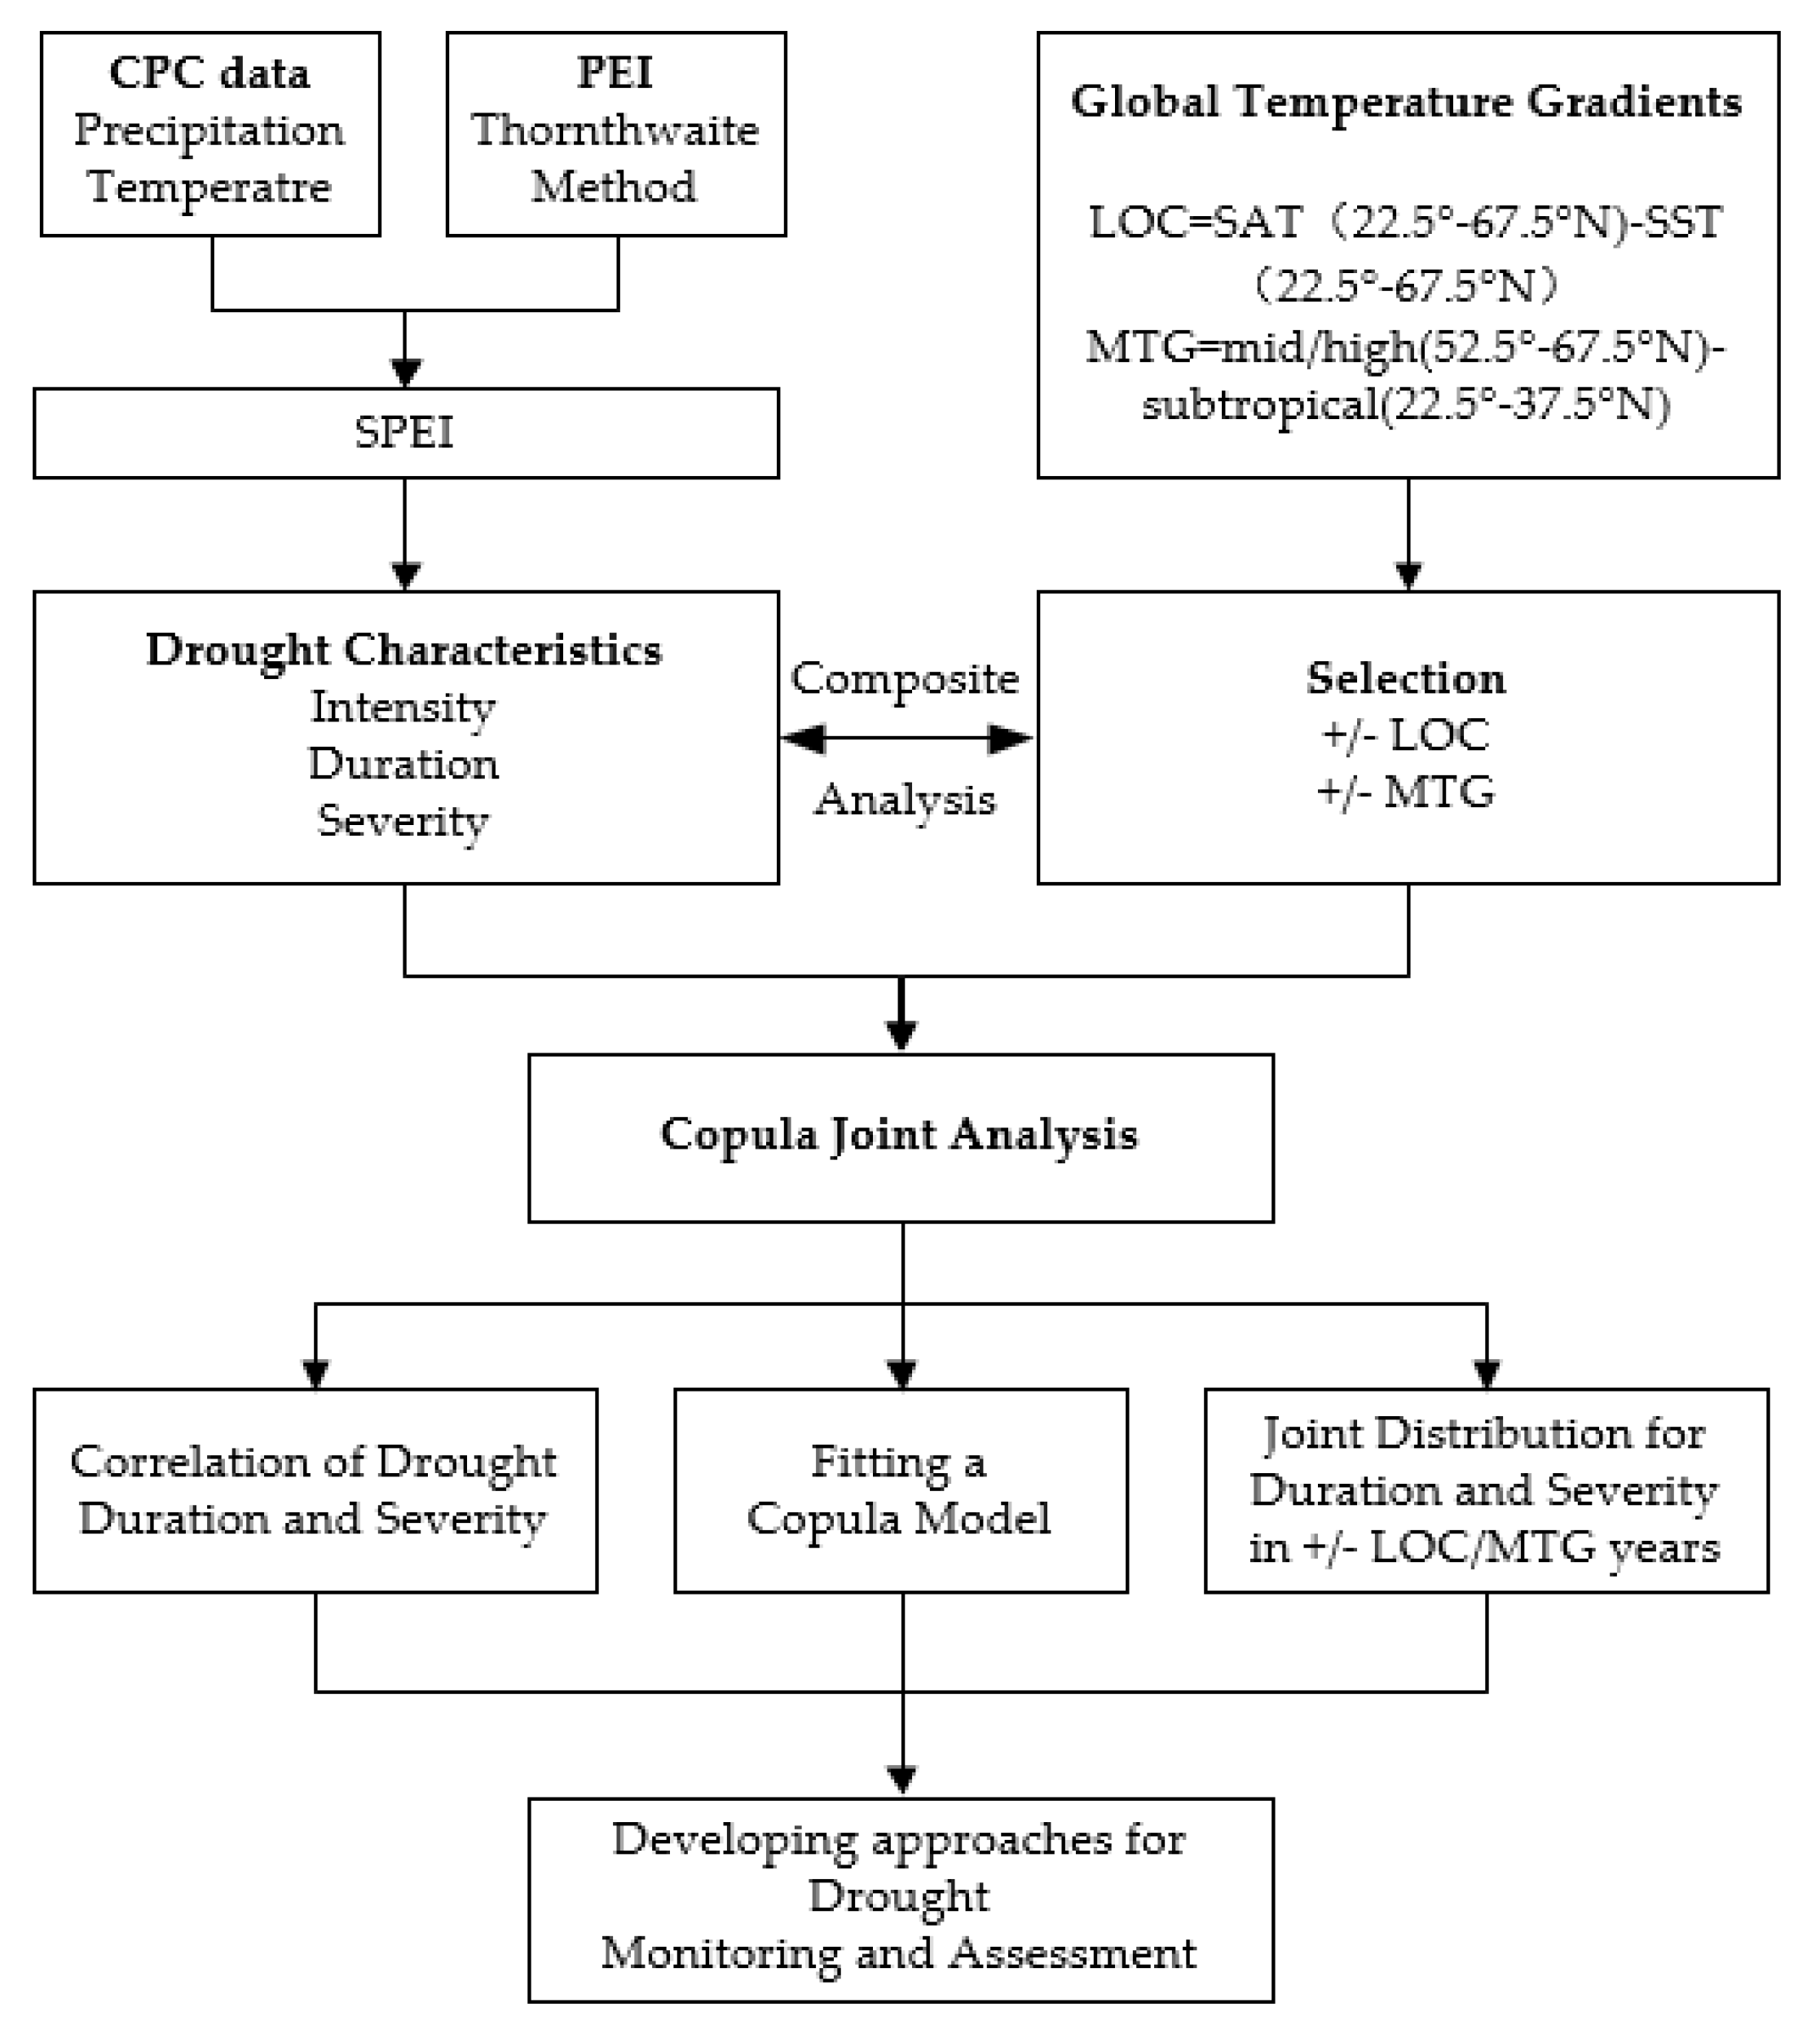
2. Materials and Methods

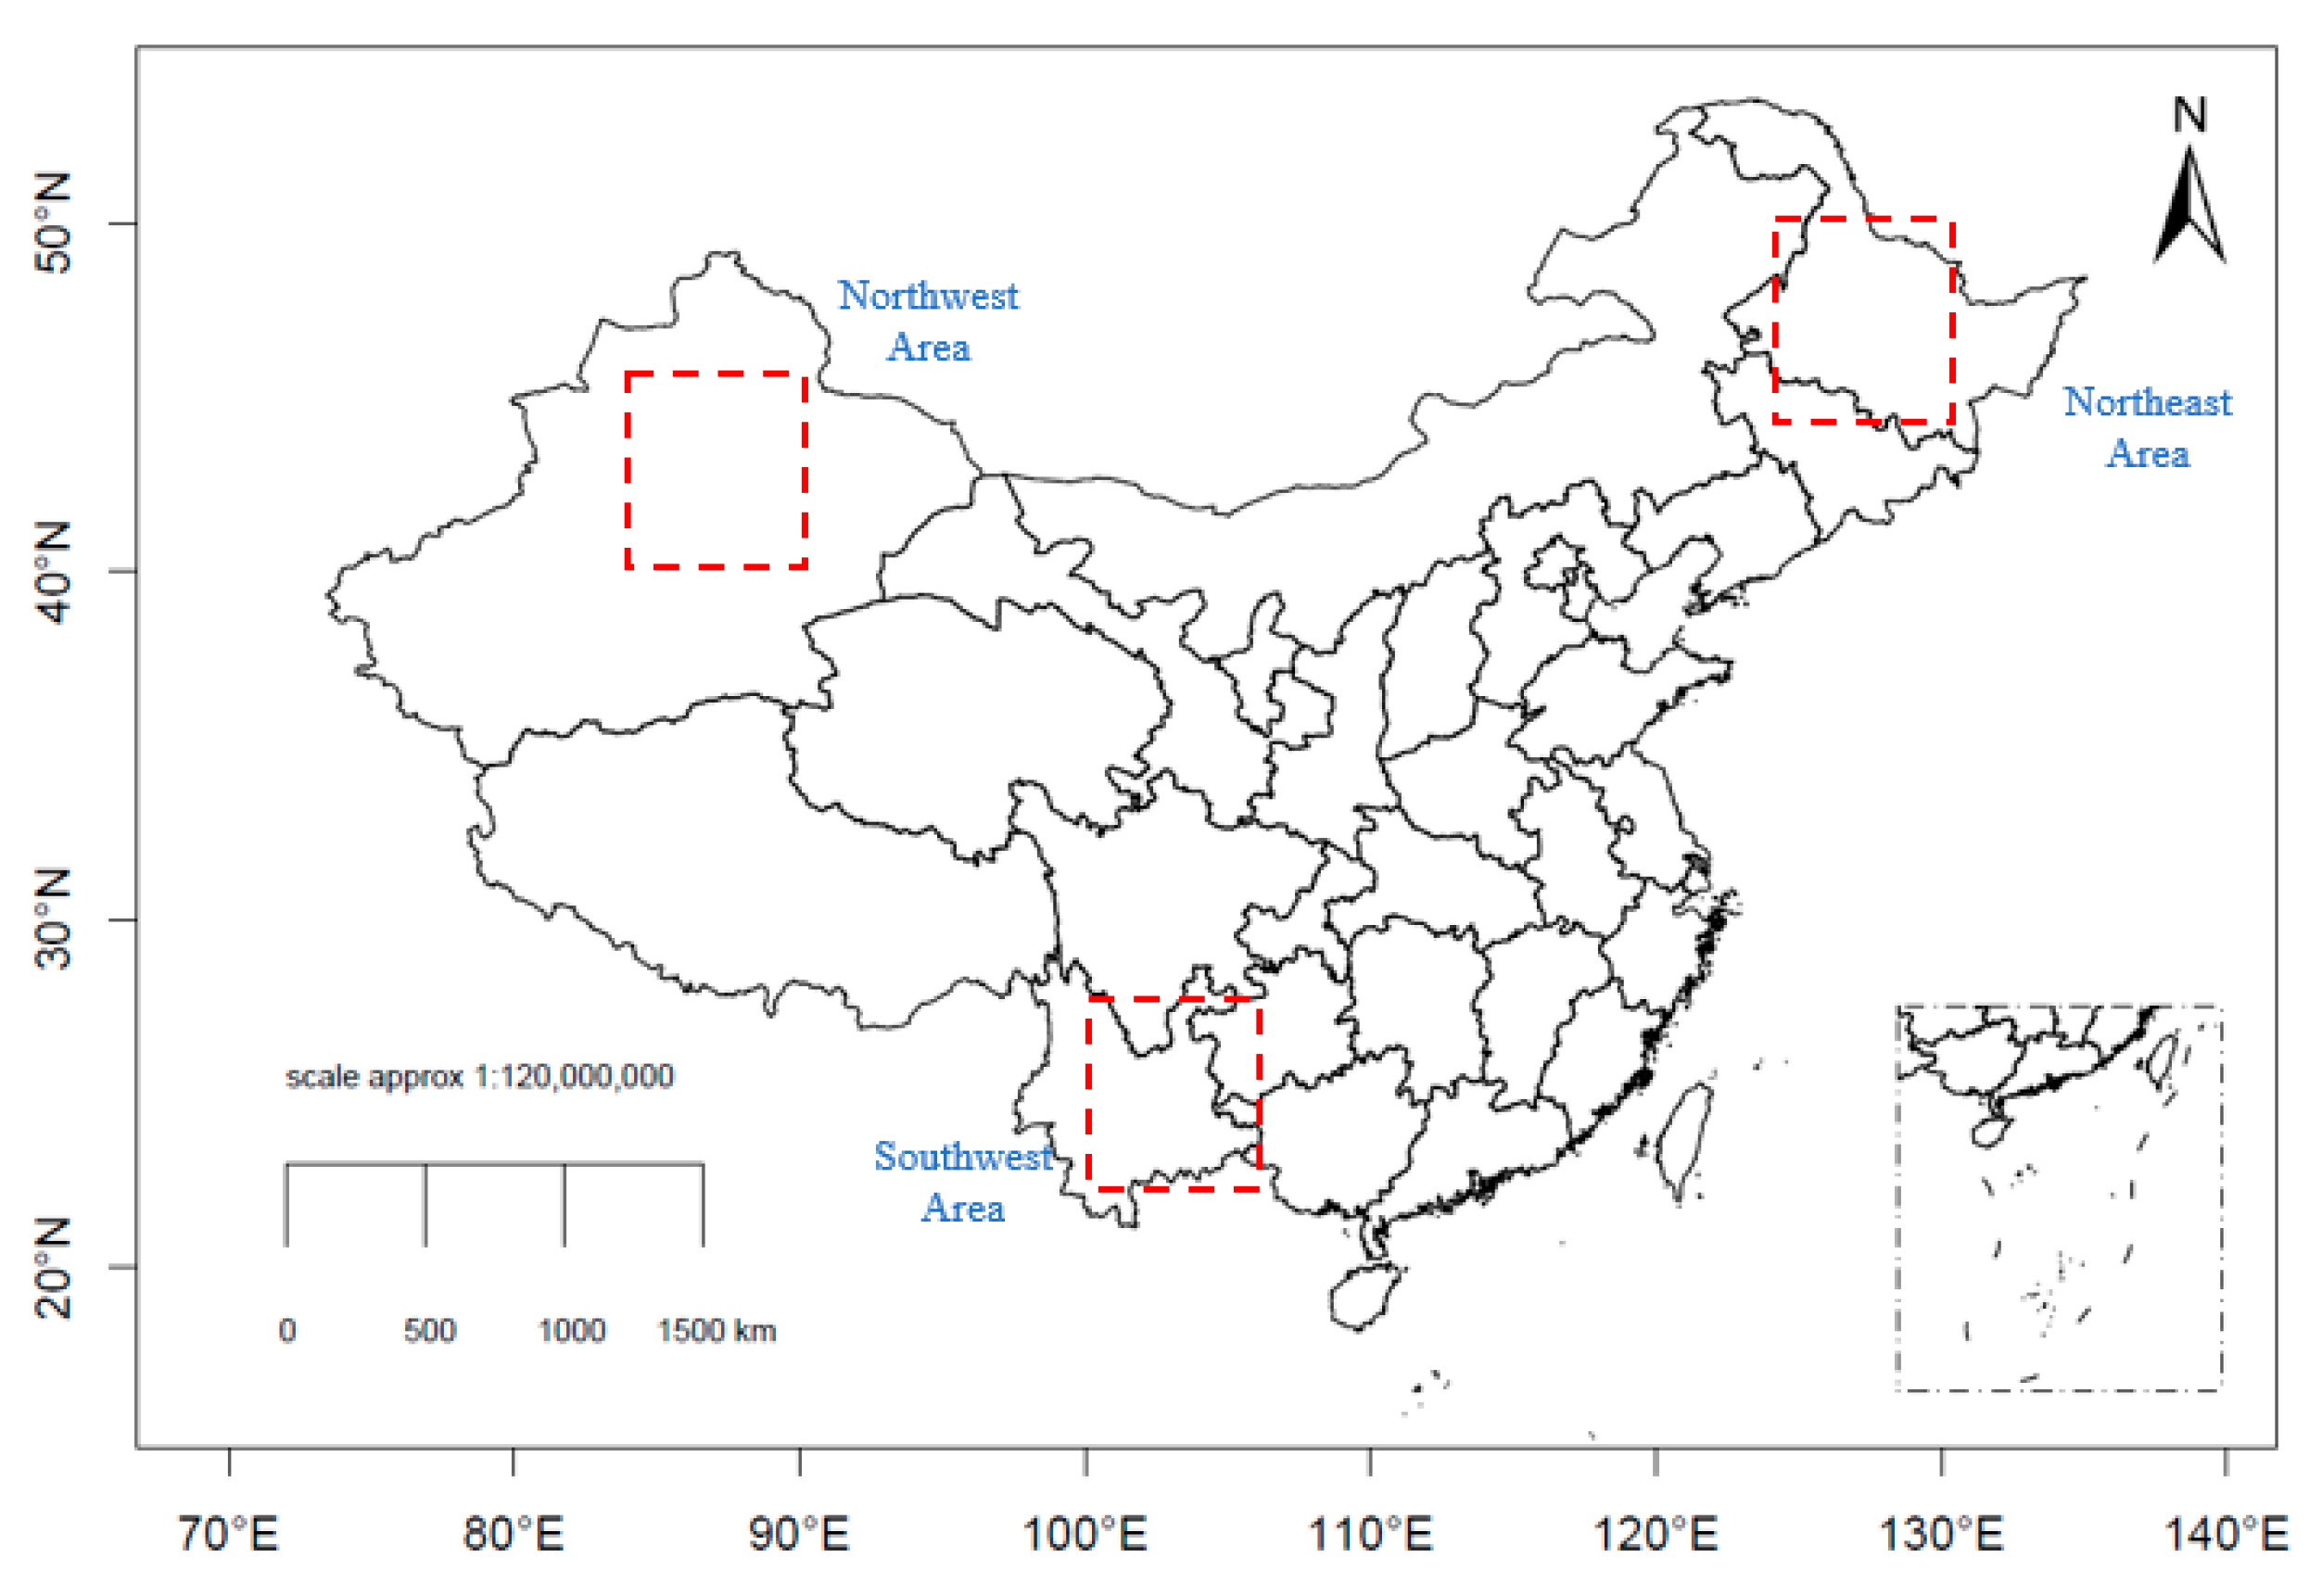
2.1. Study Area and Data

The datasets were provided by the National Oceanic and Atmospheric Administration (NOAA) (https://psl.noaa.gov/data/gridded/index.html, accessed on 17 August 2021). The monthly land surface temperatures were acquired from GHCN_CAMS Gridded 2 m Temperature (Land) dataset at 0.5° × 0.5° resolution. The monthly sea surface temperatures were obtained from the NOAA Extended Reconstructed Sea Surface Temperature (SST) V5 dataset at 2° × 2° resolution. Daily precipitation and temperature data comprised parts of the product suite generated by the climate prediction center (CPC) Unified Precipitation Project that is currently underway at NOAA CPC. All data used 0.5° latitude × 0.5° longitude as a unit. The datasets used in this study covered the period from 1979 to 2019. The composite meridional wind anomalies from the National Centers for Environmental Prediction/National Center for Atmospheric Research (NCEP/NCAR) re-analysis were provided by the NOAA.
The present study focused on the links between the east–west and north–south temperature gradients in the northern hemisphere and the regional droughts in China. As a result, the main area of research is China. Three regions in China were selected to determine the relationships between the drought characteristics and the global temperature gradients and included the northeastern (124°41′ E–130°44′ E, 44°43′ N–50°59′ N), northwestern (84°36′ E–90°44′ E, 40°57′ N–46°54′ N), and southwestern (100°08′ E–106°11′ E, 22°28′ N–28°30′ N) parts of China, respectively (Figure 2).

2.2. Standardized Precipitation Evapotranspiration Index

Drought indices such as the standardized precipitation index (SPI) and the standardized precipitation evapotranspiration index (SPEI) are commonly used to monitor meteorological drought [25,43]. SPI is used to monitor droughts based only on precipitation data, and does not consider the impact of other factors on evapotranspiration [43]. However, SPEI proposed by Vicente-Serrano evaluates drought based on both evapotranspiration and precipitation [25]. In this study, SPEI was applied to identify global temperature indices and drought characteristics in China. The SPEI drought ratings are shown in Table 1.
The SPEI calculation procedure is summarized as follows. The monthly potential evaporation (PET) is calculated according to the Thornthwait method, and the difference between monthly precipitation and potential evaporation was calculated as follows:
Di = Pi − PETi
where Pi is the precipitation and PETi is the potential evaporation.
The cumulative water gain/loss sequence in climatological significance at various time scales was calculated as follows:
D n k = i = 0 k 1 ( P n     i   PET n     i ) ,   n     k
where k is the monthly time scale and n is the month.
The established data sequence was fitted with three parameters by the log-logistic probability density function as follows:
f ( x ) = β α ( x γ α ) β     1 [ 1 + ( x γ α ) β ] 2
where α is the scale parameter, β is the shape parameters, and γ is the origin parameters. These were obtained by L-moment parameter estimation. Hence, the cumulative probability for a given time scale can be calculated as follows:
F ( x ) = [ 1 + α x γ ] 1
The results were processed by standardized normal distribution and the solution was obtained as follows:
SPEI = W   C 0   C 1 W + C 2 W 2 1 + d 1 W + d 2 W 2 + d 3 W 3
W = 2 ln ( P ) ,   P     0 . 5
where P = 1 − F(x); when P > 0.5, P becomes 1 − P. C0 = 2.515517, C1 = 0.802853, C2 = 0.010328, d1 = 1.432788, d2 = 0.189269, and d3 = 0.001308.

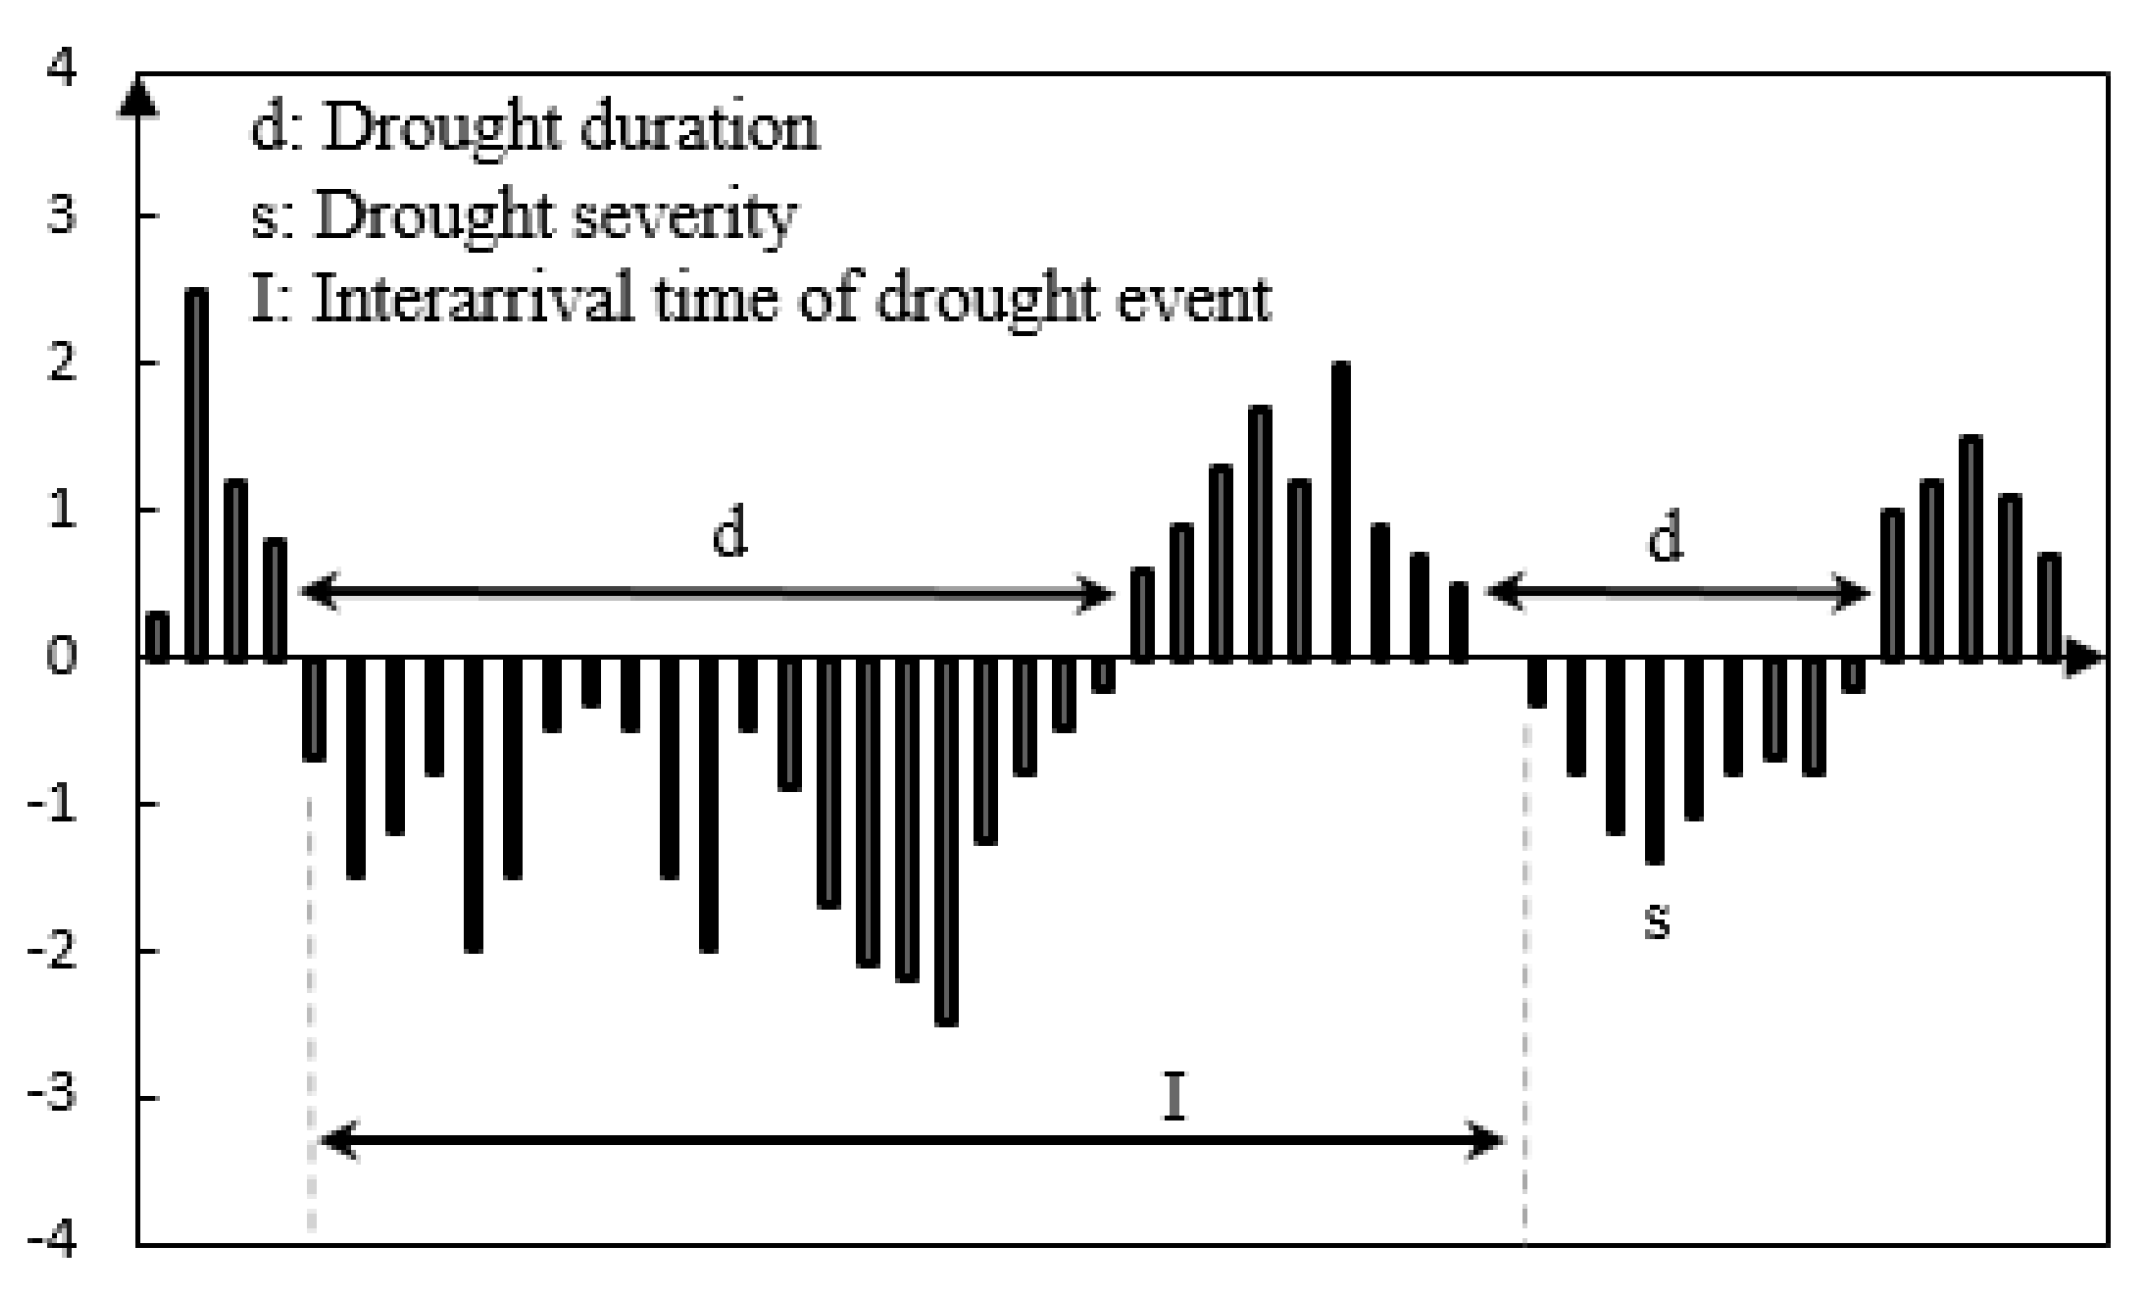
2.3. Definition of Drought Characteristics

The schematic diagram in Figure 3 defines drought. A meteorological drought event is generally defined as the period in which the meteorological variable of interest is below a certain cutoff value. This interception level may either be constant or variable. Therefore, the important indicators of drought events define drought duration and severity.
According to SPEI series, drought is identified by presuming that a drought period is continuous over time when SPEI < −0.5 [42]. Therefore, the period wherein SPEI < −0.5 is defined as the duration of moderate drought. The absolute value of the cumulative SPEI over the drought duration indicates the drought severity.

2.4. Trend Analysis

A trend analysis such as a Mann-Kendall (MK) test is usually required for intuitive determination of the tendency in time series data. The nonparametric MK statistical method is recommended by the World Meteorological Organization (WMO), and is widely used to distinguish whether a natural process is in natural fluctuation or has a definite change trend [44]. However, the MK rank correlation test is more appropriate for non-normally distributed hydrometeorological data. No specific distribution test is required for the data series, extreme values can be tested in the trend test, the series can include missing values, and the relative order of magnitude may be analyzed rather than the number itself. In this way, values below the detection range and trace values may be included in the analysis. Moreover, linear trends need not be specified in time series analysis.
The MK test is often used to detect precipitation and drought frequency under the influence of climate change. The trend detection method was previously reported [40]. The alternative hypothesis H1 is a bilateral test. For all the distributions of i, j ≤ n and i ≠ j and the distributions of Xi and Xj differ from each other. The MK correlation coefficient between two variables is known as the MK statistic S. It is calculated as follows:
S = i = 1 n 1 j = i + 1 n sgn ( X j X i )
where sgn() is a symbolic function shown in Equation (8):
sgn ( X j     X i ) = { 1   if ( X j   X i ) > 0 0   if ( X j X i ) = 0 1   if ( X j     X i ) < 0
where S is an approximately normal distribution with a mean = 0 and variance calculated as shown in Equation (9) below:
Var ( S ) = n ( n 1 ) ( 2 n 5 ) i = 1 n t i ( i 1 ) ( 2 i + 5 ) 18
where t is the range of any given node. When n > 10, ZC converges to the standard normal distribution and is calculated as shown in Equation (10) below:
Z c = { S 1 Var ( S ) S   >   0 0 S = 0 S + 1 Var ( S ) S   <   0
In the foregoing calculation, the original hypothesis H0 will be rejected when |ZC|≥ Z1–α/2. In this case, there is a significant upward or downward trend in the current time series data α confidence level. If ZC > 0, it shows an upward trend. If ZC < 0, it shows a downward trend. ±Z1−α/2 is the (1 − α/2) quantile of the standard normal distribution, and α is the test confidence level of the test. When |ZC| ≥ 1.64, 1.96, and 2.58, the α confidence values are 0.1, 0.05, and 0.01, respectively. Here, the MK test was used to analyze the drought characteristic across China, and the tendency was determined from the results of the p and z values. The trend is not significant when p > 0.05. However, the difference between the result and the zero hypothesis is evident when p < 0.05. Thus, the p-value can indicate whether the SPEI of the area has a significant change trend. The direction of trend is then determined based on the positive and negative S values.

2.5. Meridional and Zonal Temperature Gradients

The temperature difference between land and ocean is an important characterization of the land-ocean thermal contrast that significantly influences the regional climate. China is located on the Eurasian continent and faces the Pacific Ocean. Hence, the difference between the land and the ocean temperature has an enormous impact on the climate. Temperature differences may be expressed by the LOC index which is defined as the longitudinal variation in the difference between the average land surface air temperature (SAT) and the average sea surface temperature (SST). It represents the difference in temperature between the land surface and the ocean attributed to global warming [30]. The LOC index may be used to detect changes in seasonal precipitation caused by water vapor movement. Equation (11) is based on the basic principle of the LOC index, calculated in the present study:
LOC = SAT ( 22 . 5 ° 67 . 5 °   N )   SST ( 22 . 5 ° 67 . 5 °   N )
The meridional temperature gradient is caused by differences in atmospheric pressure between high and low latitudes. North–south atmospheric circulation redistributes water vapor and energy across various regions. The observed hydroclimate also varies spatiotemporally. A large proportion of the global population lives in the Asian monsoon region. Consequently, it is crucial to understand the movement of the intertropical convergence zone (ITCZ) and the north subtropical high to assess their impact on water vapor transport, energy transfer, and interregional global climate [41]. In academia, however, there is a lack of understanding of the history and laws of the ITCZ. Furthermore, the north subtropical highs and their locations have not been precisely defined. Based on the extent of the temperate zone near the tropics, the subtropical zone was defined here as 22.5–37.5° N. Equation (12) is the formula based on the basic principle of the MTG index calculated in the present study:
MTG = mid / high ( ( 52 . 5 ° 67 . 5 °   N )   subtropical ( 22 . 5 ° 37 . 5 °   N )

2.6. Copula Functions

Copula functions [45] link univariate distributions to form multivariate distributions. They separate the dependence effects from the marginal distributions and facilitate model construction and study [42]. Copula functions also maintain the uniqueness of the probability distribution function of a single variable and retain valuable information when the model is transformed [46]. They have been recently applied to complex hydrologic phenomena such as drought.
Genest and Mackay proposed the Archimedean copula function in 1986 [47]. It is expressed as follows:
C ( μ 1 , , μ n , , μ N ) = φ 1 ( φ ( μ 1 ) , , φ ( μ n ) , , φ ( μ N ) )
where φ is the generating function that fully determines the Archimedean copula function. The Archimedean copula function family includes mainly symmetrical and asymmetrical copula functions. In this study, two symmetrical functions named G-H and Frank were used. Their expressions are shown below:
C ( u , v ) = exp { [ lnu ] 1 θ } ,   θ   ϵ   [ 1 , + )
C ( u , v ) = 1 θ ln [ 1 + ( e θ v 1 ) ( e θ u 1 ) e θ 1 ] ,   θ     0
Ellipse copula functions are derived from the ellipse distribution. The elliptic copula function family consists mainly of the Gaussian copula function and t-copula functions. The Gaussian copula function is derived from the multivariate normal distribution as shown below:
C ( u 1 , , u n , , u N , ρ ) = φ ρ ( φ 1 ( u 1 ) , , φ 1 ( u n ) , , φ 1 ( u N ) )
c ( u 1 , , u n , , u N , ρ ) = | ρ | 1 2 exp { 1 2 ς T ( ρ 1 I ) ς }
where φ−1 is the inverse function of the standard normal distribution function, φρ is the standard multivariate normal distribution, ρ is the correlation coefficient matrix between variables and is a symmetric positive definite matrix. I is the identity matrix, and ς n = φ−1 (un).
The t-copula or Student’s copula is derived from the t distribution as shown below:
C(u1,···,un,···,uN,ρ) = Tρ,v(tv−1(u1),···,tv−1(un),···,tv−1(uN))
c ( u 1 , · · · , u n , · · · , u N , ρ , v ) = | ρ | 1 2   Γ ( N + v 2 ) [ Γ ( v 2 ) ] N ( 1 + 1 v ς 1 ρ 1 ς ) v + N 2 [ Γ ( N + v 2 ) ] N Γ ( v 2 ) n = 1 N ( 1 + ς n 2 v ) v + 2 2
where the Tρ,v is the t standard multivariate distribution, v is the degree of freedom, ρ is the correlation coefficient matrix between variables and is a symmetric positive definite matrix, | ρ| is the absolute value of the determinant of ρ, tv−1 is the inverse function of the one-variable t distribution function with degrees of freedom, and ς n = φ−1 (un).
Extreme value copulas mainly include the Galambos and HuslerReiss functions. Their formulae are displayed below:
C ( u , v ) = uv · exp { [ ( lnu ) θ + ( lnv ) θ ] 1 θ }   ,   θ > 0
C ( u , v ) = exp { u ˜ Φ [ 1 α + 1 2 α ln ( v ˜ u ˜ ) ] v ˜ Φ [ 1 α + 1 2 α ln ( v ˜ u ˜ ) ] }
where α ≥ 0, u ˜ = − lnu , v ˜ = − lnv , and Φ is the standard normal distribution function.

3. Results

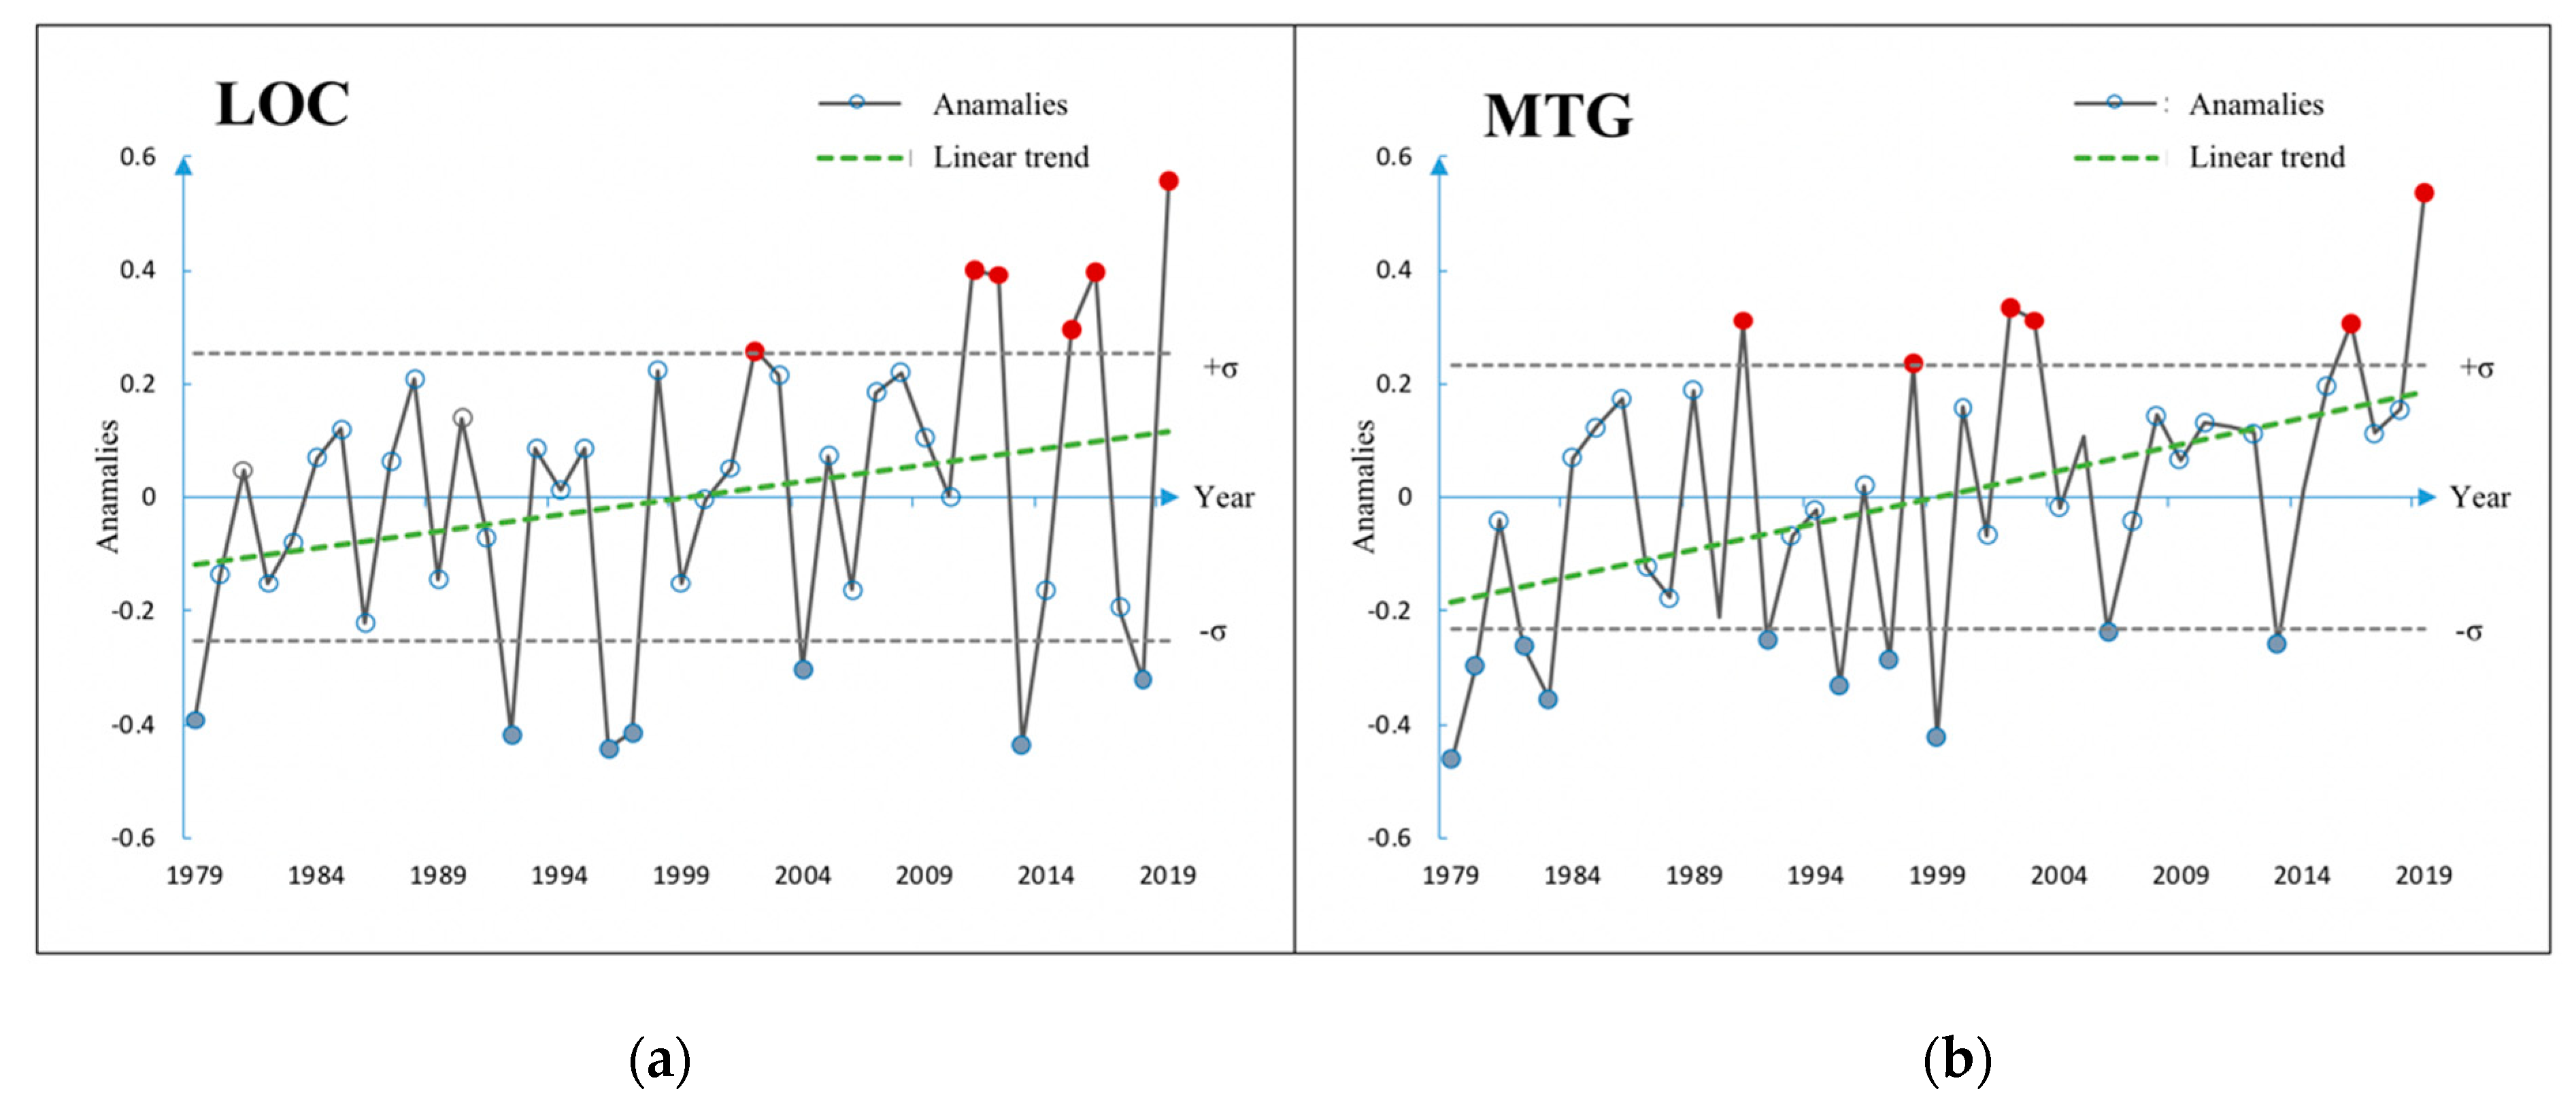
3.1. Changes in Large-Scale Temperature

In this study, the large-scale temperature indices LOC and MTG were used to analyze the dynamic changes within the climate system. Figure 4 represents the temporal trend in the two normalized temperature gradient indices in the springtime of the years 1979 to 2019.
When LOC > 0, the land temperature is higher than the sea temperature. When LOC < 0, the opposite is true. When LOC approaches zero, there is minimal difference between land and sea temperature. The MTG index reflects the temperature difference between high and low latitudes. Current research showed that the Arctic region is relatively more sensitive to GHG-induced global warming than previously expected [48]. The decrease in the temperature difference between high and low latitudes was apparent from the decline in the MTG index. In the present study, points higher than the quantile line were selected as positive years while those lower than the quantile line were selected as negative. Hence, the positive LOC years were 2002, 2011, 2012, 2015, 2016, and 2019 while the negative LOC years were 1979, 1992, 1996, 1997, 2004, 2013, and 2018. Similarly, 1991, 1998, 2002, 2003, 2016, and 2019 were selected as positive MTG years while 1979, 1980, 1982 ,1983, 1992, 1995, 1997, 1999, 2006 and 2013 were selected as negative MTG years.

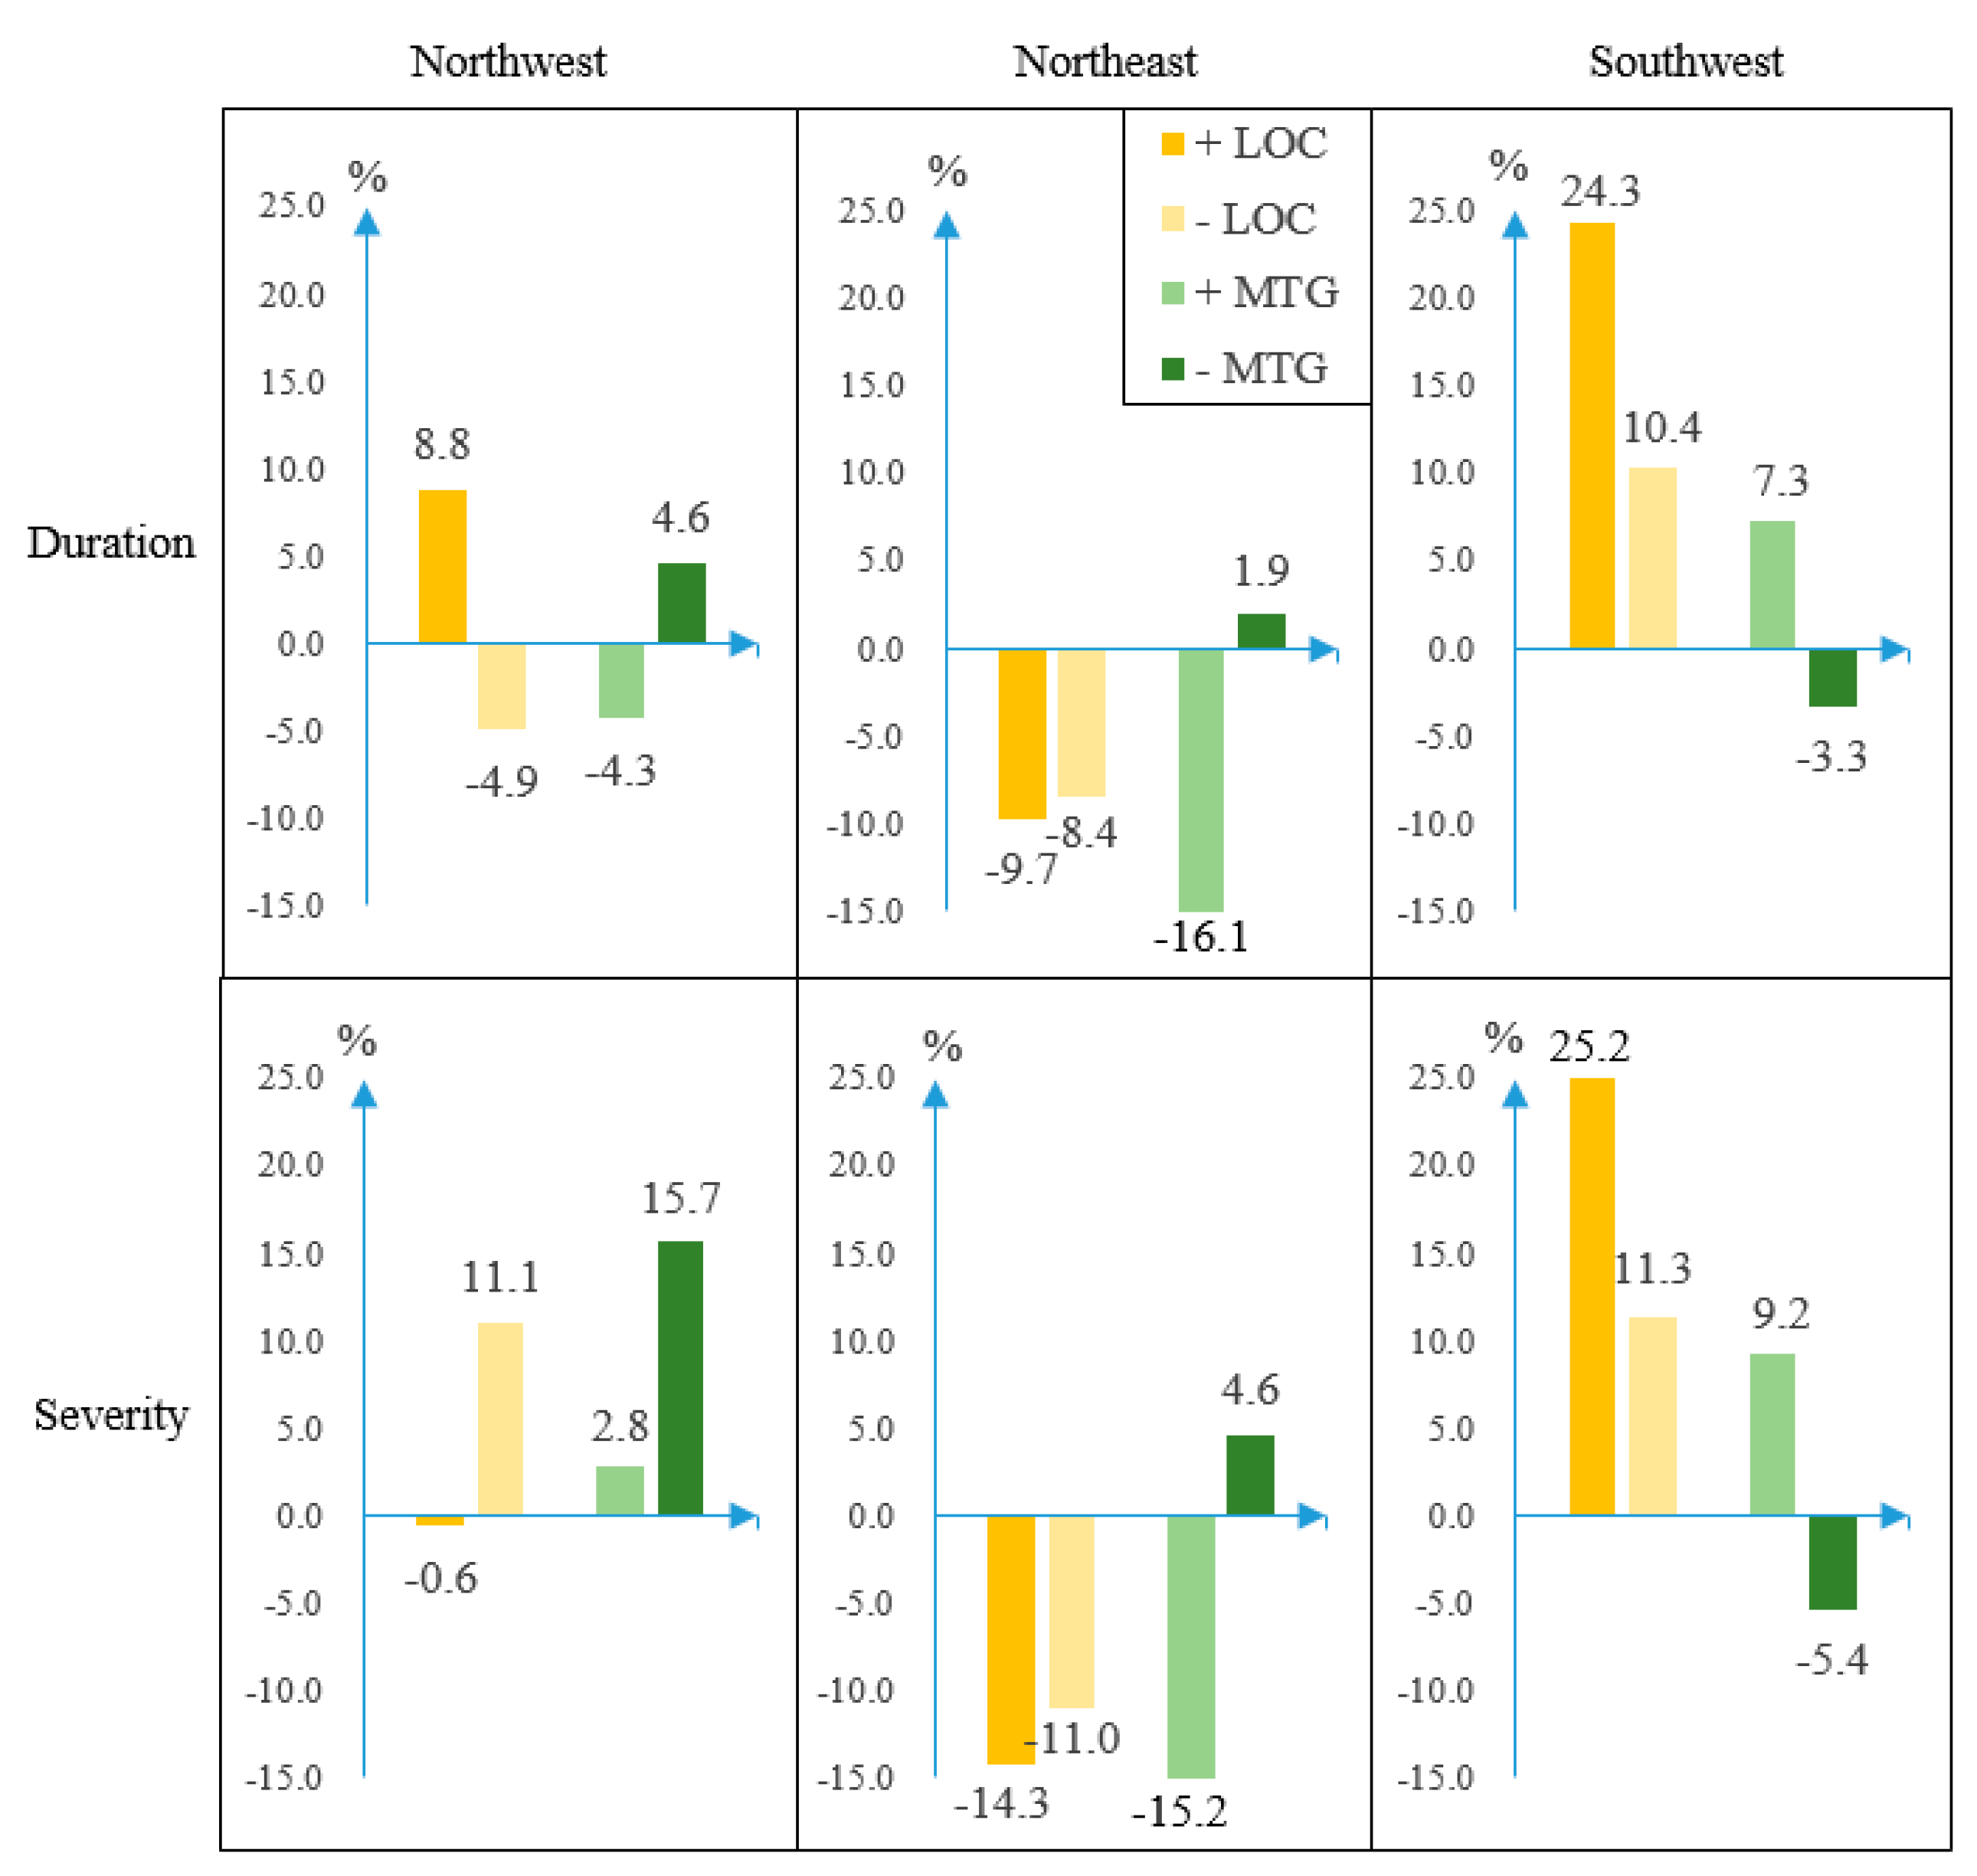
3.2. Composite Anomalies of Drought Characteristics Associated with LOC/MTG

To quantify the influences of the temperature gradients on the study area, the SPEI index was calculated and the drought duration and severity were extracted based on the drought definition. The average duration and severity observed in the period of 1979–2019, and the negative and positive LOC/MTG years in the southwestern, northwestern, and northeastern regions of China, were enumerated. We obtained the results of the composite analysis of the drought characteristics for the positive and negative LOC/MTG years. The variations in the drought characteristics of each region were associated with four indices and are displayed in Figure 5. In northeastern and southwestern China, the influences of positive/negative LOC and MTG on drought duration and severity were consistent. Compared with the average years, the positive LOC, negative LOC, and positive MTG years had significantly weaker effects on drought duration and severity in the northeast but significantly stronger effects on drought duration and severity in the southwest. In northwestern China, positive LOC increased drought duration and decreased drought severity. By contrast, negative LOC and positive MTG decreased drought duration and increased drought severity in northwestern China. In the negative MTG years, drought severity in the northwest had a maximum relative increase of 15.7%. Positive land-ocean temperature difference had the most significant impact on drought duration in the southwest. There, the average change in annual mean duration during the positive LOC years within the period of 1979–2019 increased by 24.3%. The northeast had the most significant trend in positive MTG indicators with a decrease of 16.1%. The changes in LOC and MTG in the northwest were relatively small.
The observed changes in drought severity in the northeast and southwest were consistent with the drought duration for the LOC and MTG years. However, the southwest was significantly affected by positive LOC and increased by 25.2%. In general, drought severity was more strongly affected by LOC and MTG than drought duration.

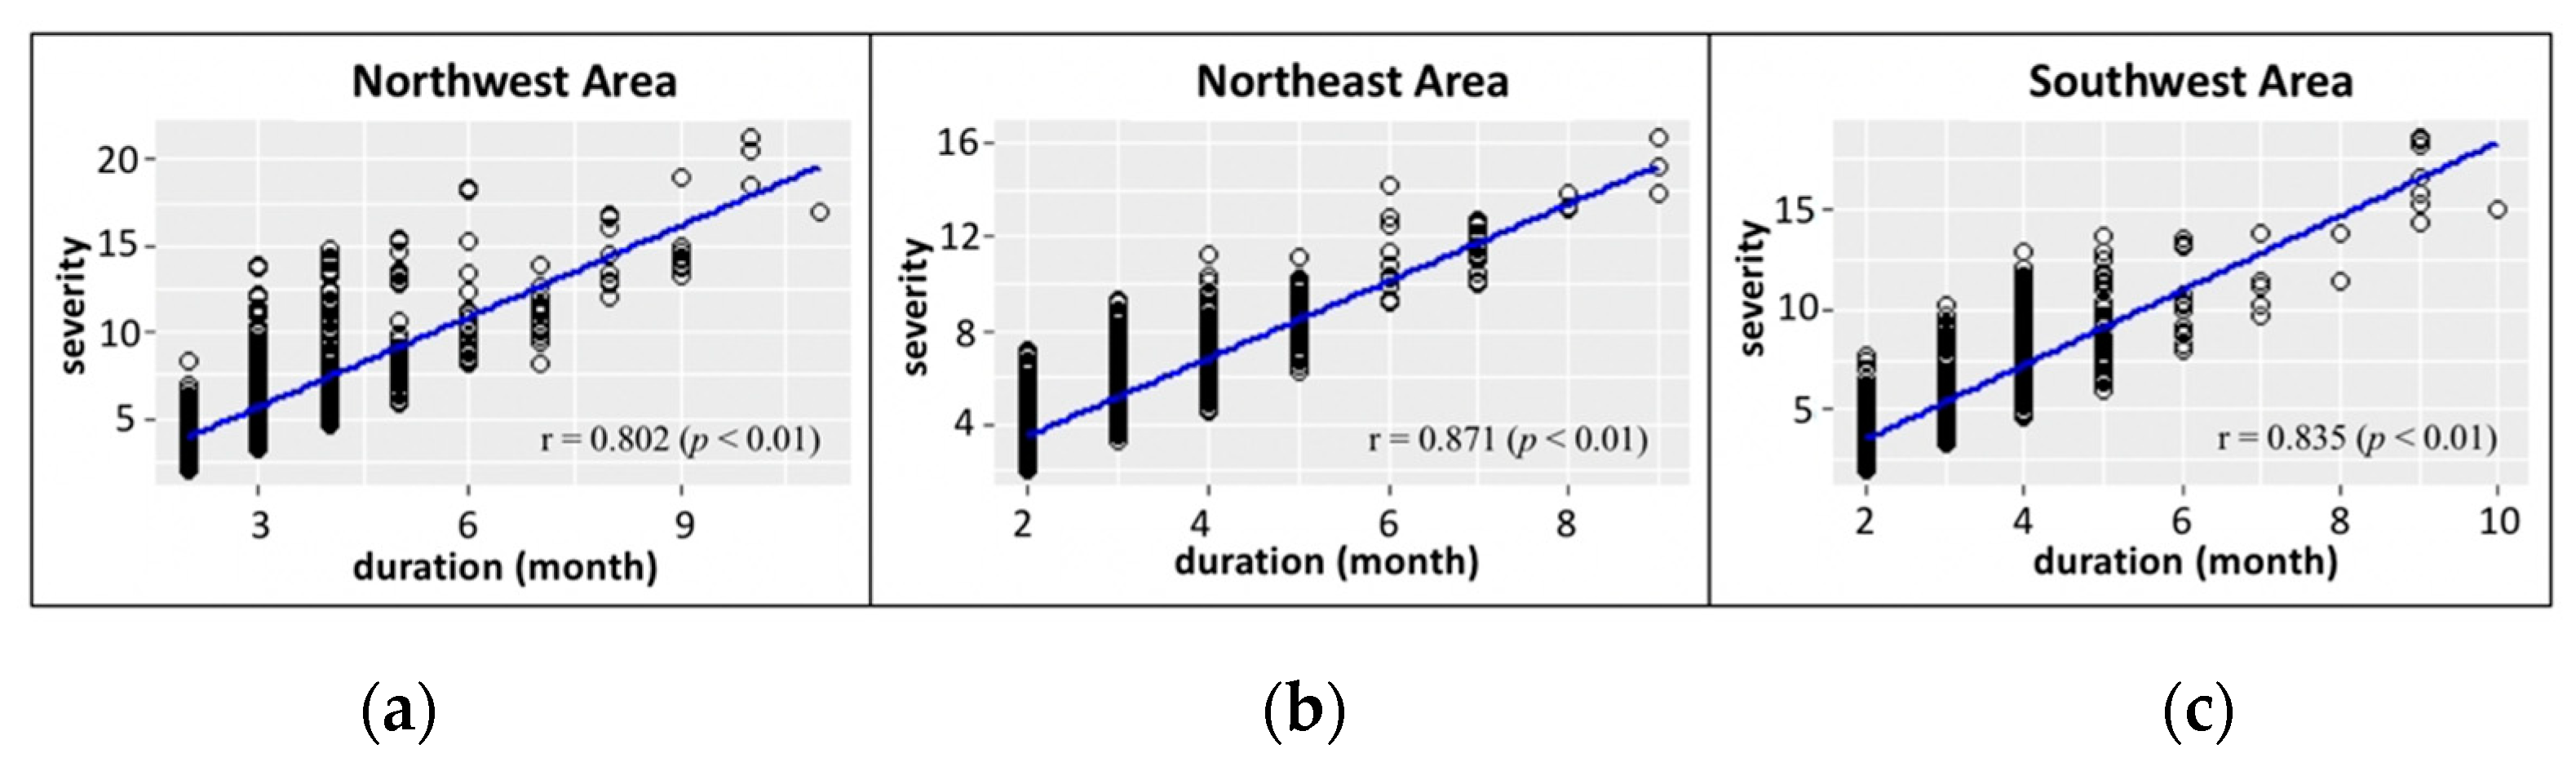
3.3. Changes in Drought Duration and Severity in China

China is severely affected by frequent drought disasters [49,50]. Since the 1990s, crop damage caused by flood and drought disasters has significantly increased. The current area affected by drought and flooding is 1.4 times the multiyear average between 1950 and 2010 [51]. Hence, drought disasters pose serious threats to food and ecological security and have become one of the critical factors limiting the sustainable development of the society and the economy of China. Several severe drought events occurred in southern and central China in 2001, in southeastern and western China in 2007, and in southwest and northern China in 2011. The main reason for these droughts was the weakening of the favorable east–west zonal wind. Consequently, insufficient water vapor is brought from the ocean. Further, the north–south meridional wind, which brings dry inland air, may also be strengthened.
In the present study, we used daily precipitation and maximum data to calculate the SPEI index over a 12-month period and extracted the drought duration and severity characteristics. We applied the M-K test to elucidate the drought duration and severity trends. The trends of drought duration and severity in China between 1979 and 2019 are displayed in Figure 6. Figure 6a shows that except for an increasing trend in drought duration in northwestern China, there were no perceptible trends in any other areas. The rising trend in drought severity in northwestern China is also depicted in Figure 6b. Figure 6 shows a correlation between drought severity and drought duration. As a rule, drought severity increases with drought duration. Compared with drought duration, drought severity has more significantly changed over the past few decades.

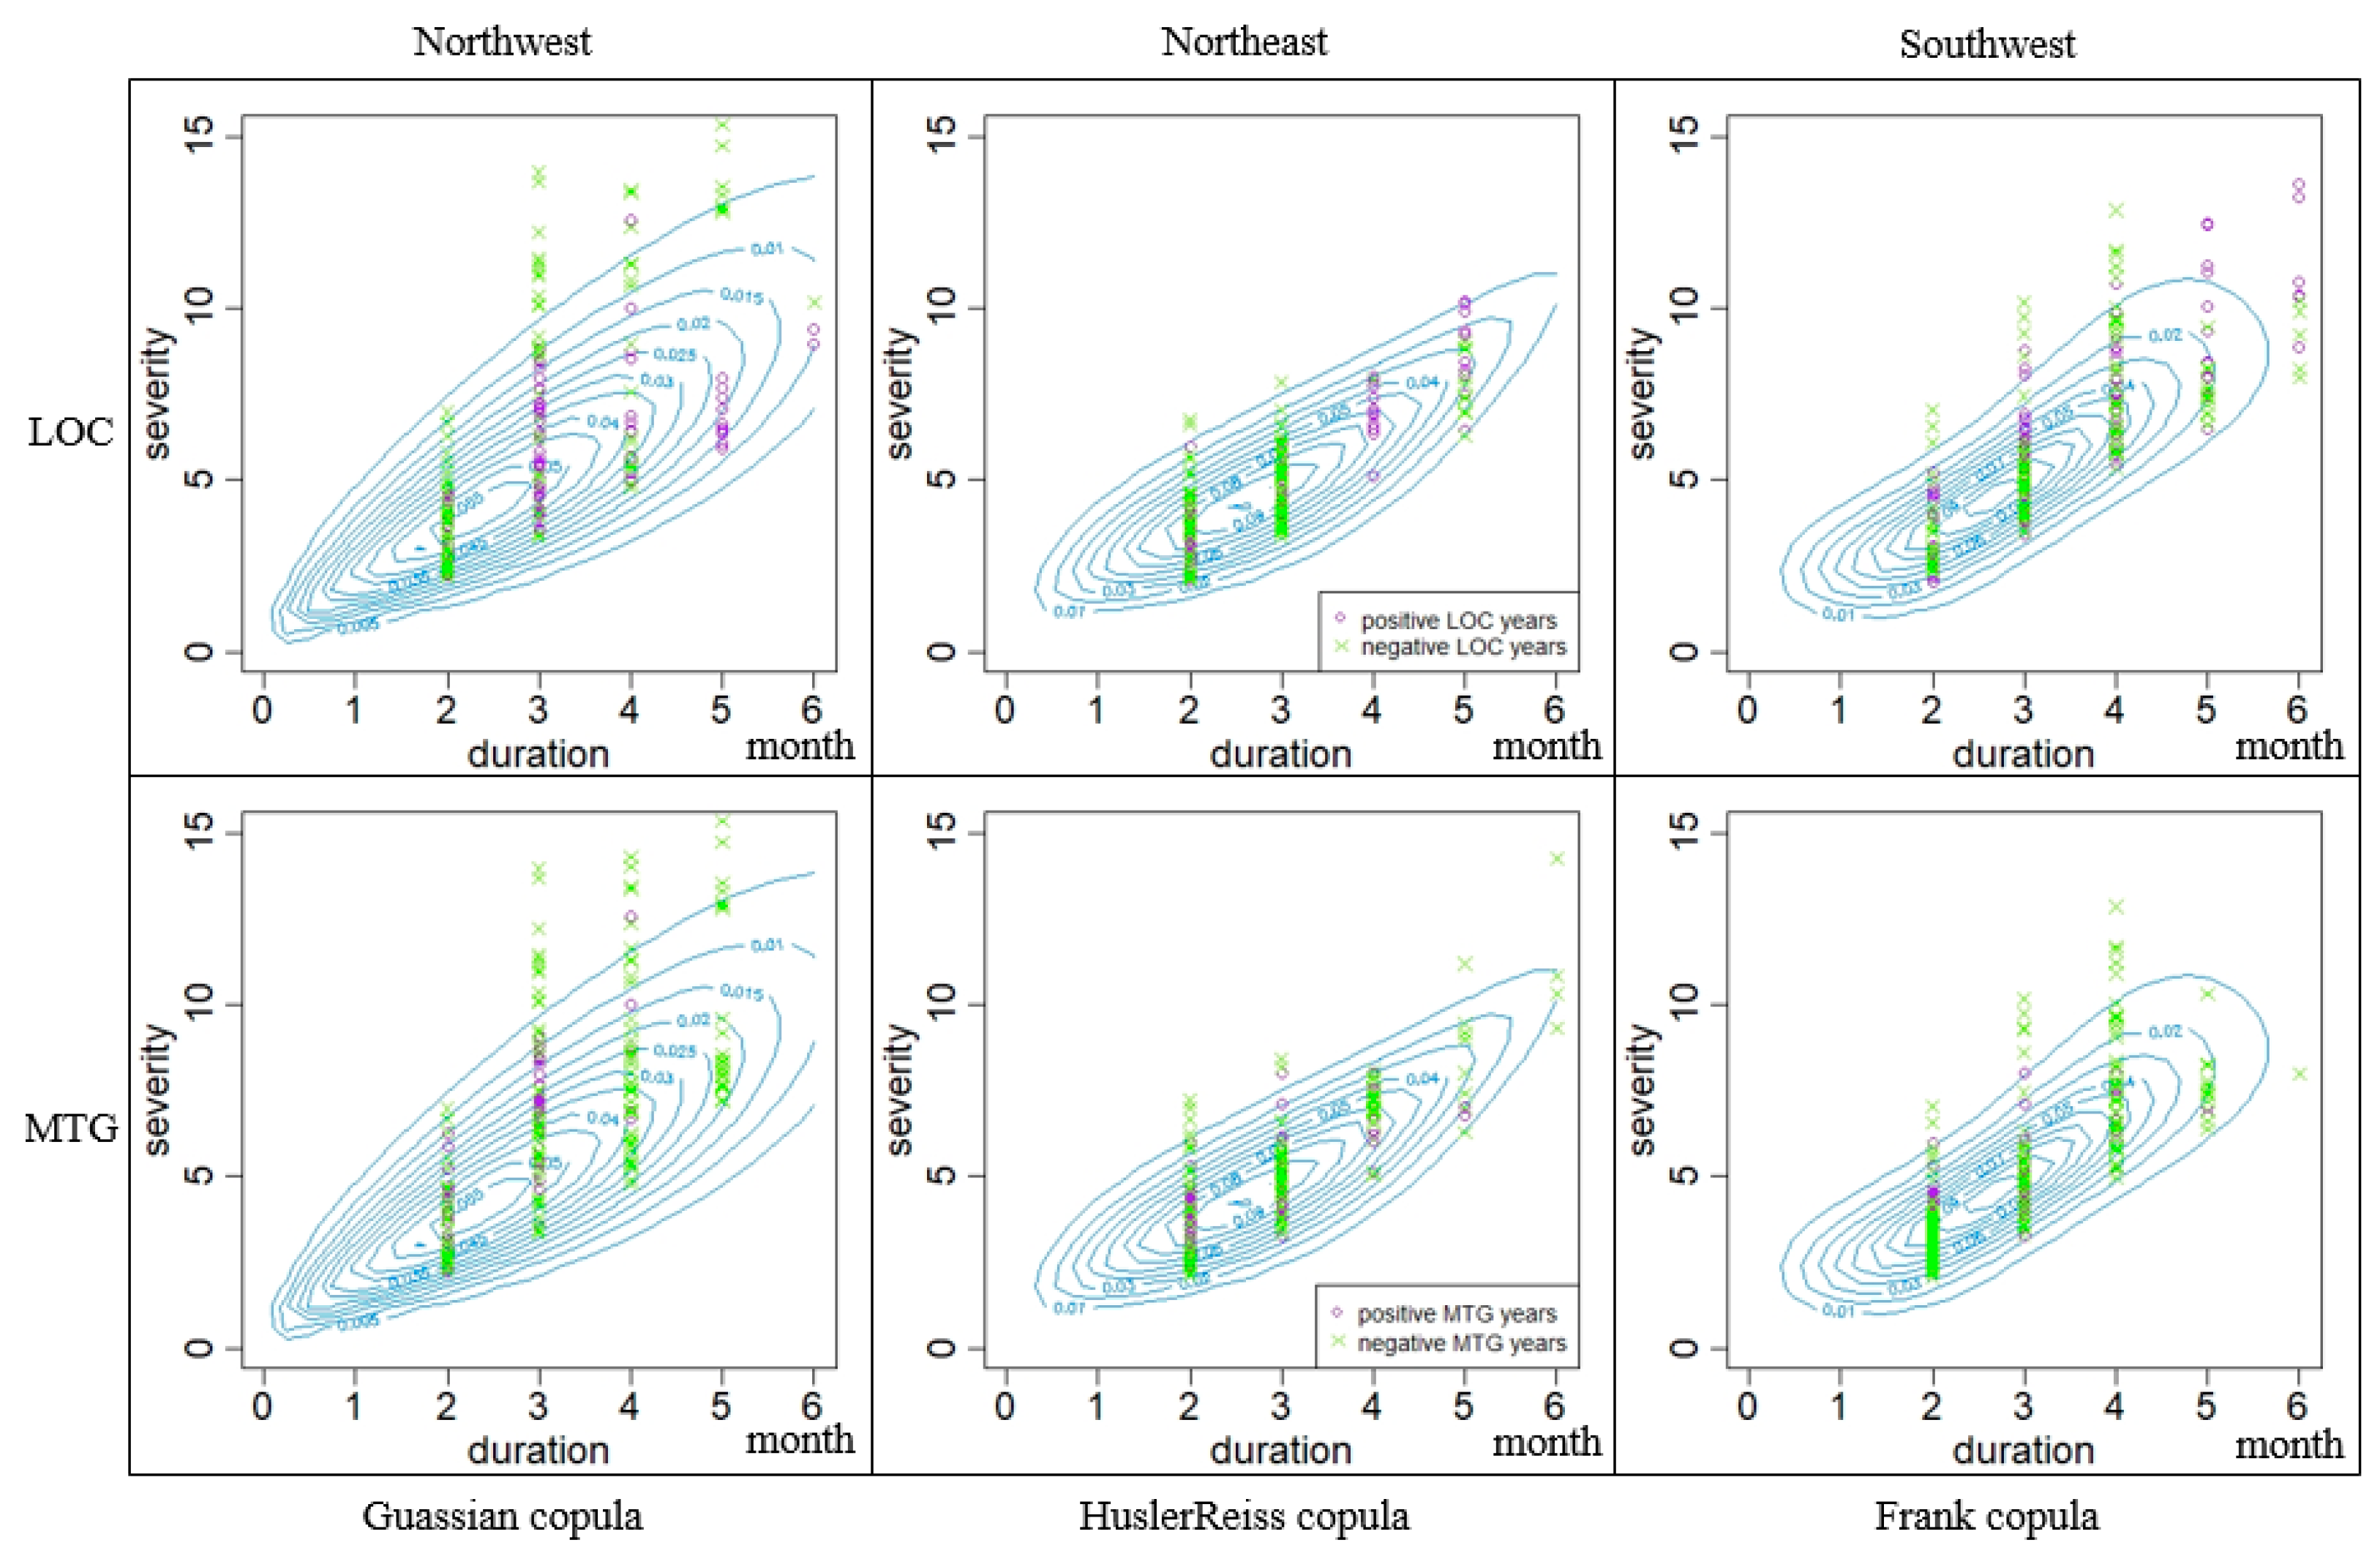
3.4. Joint Distribution of Drought Duration and Severity

The characteristic drought variables such as duration and severity are closely related. Drought duration and severity are usually positively correlated. Pearson’s correlation, Spearman’s correlation, and Kendall coefficients measure the association between drought duration and severity. The strongest relationship between drought duration and severity was identified by Pearson’s correlation coefficient. Figure 7 shows the relationship between drought duration and severity in the study area between 1979 and 2019.
The joint distribution of the drought characteristics was not clear. According to the copula function theory, we selected six copula functions to fit the joint distribution of drought duration and severity: Gaussian Copula and Student’s copula in the elliptic copula function family, GH Copula and Frank copula in the Archimedes copula function family, and Galambos copula and HuslerReiss copula in the extreme copula function family (Table 2). The best-fitting copula model was selected to represent the joint probability model of drought duration and severity.
Based on the AIC and BIC values in the table, the Frank copula function model fit best for the southwest. The HuslerReiss copula model was best suited for northeast, while the Gaussian copula was most appropriate for the northwest. Therefore, the Gaussian copula, HuslerReiss copula, and Frank copula functions were selected for the 2D copula joint distribution model of the drought characteristics in the three foregoing regions.
Figure 8 shows contour maps of the 2D joint distributions of drought duration and severity and demonstrates the strong dependence between the two drought characteristics. For example, the figure shows joint distributions for various combinations of drought duration and severity in positive (negative) LOC years and positive (negative) MTG years for northwestern, northeastern, and southwestern China.

4. Discussion and Conclusions

In this study, SPEI was used as a meteorological drought indicator. Drought duration and intensity served to define drought events based on daily CPC temperature and precipitation data between 1979 and 2019. The relationships between zonal and meridional temperature gradients (LOC/MTG) and drought characteristics (duration and severity) were also investigated. Hence, we aimed to forecast the occurrence and magnitude of drought events based upon drought characteristic correlations and their responses to meteorological conditions.
Trend analyses of drought duration and severity show that their long-term changes were positively correlated and increasing. Drought severity has changed more significantly than drought duration over the past few decades. In China, the observed increases in drought were localized in the northwestern and southwestern regions. These findings were consistent with those reported by Zeng et al. [52]. Drought events pose substantial threats to the environment and human society in those areas. As drought duration and severity have steadily increased, China may experience even more severe drought events going forward.
A composite analysis of drought characteristics temperature gradients revealed that drought severity is relatively more affected by LOC and MTG than drought duration. In northwestern China, the changes in LOC and MTG were comparatively minor. The northwestern region of China is far inland and remote from the ocean. Hence, the influences of land-ocean thermal contrast and the meridional temperature gradient are relatively small there. Nevertheless, drought severity has increased by 15.7% in this region because of negative MTG. Compared with other temperature gradients, the northwestern region is more strongly affected by negative LOC and MTG. The northeastern and southwestern regions of China are relatively closer to the ocean and are, therefore, more strongly influenced by land-ocean thermal contrast. Whereas LOC and MTG reduce drought duration and severity in the northeast, LOC and MTG enhance drought duration and severity in the southwest. This discrepancy could be explained by the relative differences in the geography of these two areas as well as other factors that remain to be determined. Positive MTG has the most negative effect on the northeastern region while positive LOC has the most positive effects on the southwestern region.
Univariate analyses do not objectively or comprehensively describe drought events. Therefore, multivariate analyses are applied for this purpose. However, traditional multivariate analyses are used mainly in scenarios where each variable has a normal marginal distribution. The copula function is recommended for the construction of a joint marginal distribution because it can effectively describe the correlations among variables and has considerable advantages over traditional multivariate analyses. The copula function plots a 2D copula distribution with drought duration and severity. The present study compared AIC values for six copula functions. It was established that the Gaussian, HuslerReiss, and Frank copula functions were suitable for the northwestern, northeastern, and southwestern areas of China, respectively. The marginal distribution function of drought characteristics facilitates calculation of the conditional probabilities of drought duration and severity in LOC/MTG years.
The foregoing analyses showed that the northwestern and southwestern regions of China may encounter more severe and frequent drought events in the future. However, the increases in drought severity will be more significant than the increases in drought duration. The copula function methods revealed strong positive correlations between drought duration and severity. As drought severity and duration intensify, China will be challenged by even more serious drought disasters that could be devastating to agriculture, the economy, and human society. Moreover, worsening climate warming may aggravate these changes. Composite analyses of drought characteristics and temperature gradients disclose the responses of the various regions of China to changing meteorological conditions. As drought processes are highly complex, their short-term impact may not be immediately apparent. For this reason, exploring the connections among drought variables and their responses to climate change might enable accurate prediction of the occurrences and magnitudes of drought events in the future.

Author Contributions

Conceptualization, Resources, Methodology, Formal analysis, Writing—original draft, A.O., D.W., Y.Z., and J.-S.K.; Conceptualization, Writing—review & editing, J.-H.L. All authors have read and agreed to the published version of the manuscript.

Funding

We appreciate the support of the State Key Laboratory of Water Resources and Hydropower Engineering Science, Wuhan University. This work was also supported by the National Research Foundation of Korea (NRF) grant funded by the Korea government (MSIT) (No.2021R1A2C1013190).

Institutional Review Board Statement

Not applicable.

Informed Consent Statement

Not applicable.

Data Availability Statement

Data set available on request to corresponding authors.

Conflicts of Interest

The authors declare no conflict of interest.

References

  1. Mishra, A.K.; Singh, V.P. A review of drought concepts. J. Hydrol. 2010, 391, 202–216. [Google Scholar] [CrossRef]
  2. Tallaksen, L.M.; Van Lanen, H.A.J. Hydrological Drought-Processes and Estimation Methods for Streamflow and Groundwater; Developments in Water Science; Elsevier Science BV: Amsterdam, The Netherlands, 2004. [Google Scholar]
  3. Arash, M.R.; Bijan, G.; Davar, K.; Zahra, G.; Samira, A.A. Integrated meteorological and hydrological drought model: A management tool for proactive water resources planning of semi-arid regions. Adv. Water Resour. 2017, 107, 336–353. [Google Scholar]
  4. Luo, D.; Ye, L.L.; Sun, D.C. Risk evaluation of agricultural drought disaster using a grey cloud clustering model in Henan province, China. Int. J. Disaster Risk Reduct. 2020, 49, 101759. [Google Scholar] [CrossRef]
  5. Muneta, Y.; Hiroaki, I.; Sawada, Y.; Suzuki, Y.S.; Toshio, K.; Asif, N.; Cheema, M.J.M. A multi-sector multi-region economic growth model of drought and the value of water: A case study in Pakistan. Int. J. Disaster Risk Reduct. 2020, 43, 101368. [Google Scholar]
  6. Crausbay, S.; Ramirez, A.R.; Carter, S.L.; Cross, M.S.; Hall, K.R.; Bathke, D.J.; Betancourt, J.L.; Colt, S.; Cravens, A.E.; Dalton, M.S.; et al. Defining Ecological Drought for the Twenty-First Century. Bull. Am. Meteorol. Soc. 2017, 98, 2543–2550. [Google Scholar] [CrossRef]
  7. Bradford, J.B.; Schlaepfer, D.R.; Lauenroth, W.K.; Palmquist, K.A. Robust ecological drought projections for drylands in the 21st century. Glob. Chang. Biol. 2020, 26, 3906–3919. [Google Scholar] [CrossRef] [PubMed]
  8. Le Comte, D. Weather highlights around the world. Weatherwise 1995, 48, 20–22. [Google Scholar] [CrossRef]
  9. Le Comte, D. Weather highlights around the world. Weatherwise 1994, 47, 23–26. [Google Scholar] [CrossRef]
  10. Phillips, D. The Climates of Canada; Environment Canada: Ottawa, ON, 1990; p. 176. [Google Scholar]
  11. Feyen, L.; Dankers, R. Impact of global warming on streamflow drought in Europe. J. Geophys. Res. Atmos. 2009, 114, D17. [Google Scholar] [CrossRef]
  12. Ayantobo, O.O.; Li, Y.; Song, S.; Yao, N. Spatial comparability of drought characteristics and related return periods in mainland China over 1961–2013. J. Hydrol. 2017, 550, 549–567. [Google Scholar] [CrossRef]
  13. Ding, Y.; Hayes, M.J.; Widhalm, M. Measuring economic impacts of drought: A review and discussion. Disaster Prev. Manag. 2011, 20, 434–446. [Google Scholar] [CrossRef] [Green Version]
  14. Li, X.Y.; Waddington, S.R.; Dixon, J.; Joshi, A.K.; De Vicente, M.C. The relative importance of drought and other water-related constraints for major food crops in South Asian farming systems. Food Secur. 2011, 3, 19–33. [Google Scholar] [CrossRef]
  15. Seneviratne, S. Changes in climate extremes and their impacts on the natural physical environment: An overview of the IPCC SREX report. In Managing the Risks of Extreme Events and Disasters to Advance Climate Change Adaptation; Cambridge University Press: Cambridge, UK; New York, NY, USA, 2012. [Google Scholar]
  16. Jefferson, M. IPCC fifth assessment synthesis report: “Climate change 2014: Longer report”. Crit. Anal. Technol. Forecast. Soc. Change 2014, 92, 362–363. [Google Scholar] [CrossRef]
  17. Stewart, I.T.; Rogers, J.; Graham, A. Water security under severe drought and climate change: Disparate impacts of the recent severe drought on environmental flows and water supplies in Central California. J. Hydrol. X 2020, 7, 100054. [Google Scholar] [CrossRef]
  18. Martínez-Valderrama, J.; Ibanez, J.; Ibanez, M.A.; Alcala, F.J.; Sanjuan, M.E.; Ruiz, A.; Del Barrio, G. Assessing the sensitivity of a Mediterranean commercial rangeland to droughts under climate change scenarios by means of a multidisciplinary integrated model. Agric. Syst. 2021, 187, 103021. [Google Scholar] [CrossRef]
  19. Noorisameleh, Z.; Khaledi, S.; Khaledi, A.; Firouzabadi, P.Z.; Gough, W.A.; Mirza, M.M.Q. Comparative evaluation of impacts of climate change and droughts on river flow vulnerability in Iran. Water Sci. Eng. 2021, 13, 265–274. [Google Scholar] [CrossRef]
  20. Rehana, J.; Naidu, G.S. Development of hydro-meteorological drought index under climate change—Semi-arid river basin of Peninsular India. J. Hydrol. 2021, 594, 125973. [Google Scholar] [CrossRef]
  21. Dai, A.G. Increasing drought under global warming in observations and models. Nat. Clim. Change 2012, 3, 52–58. [Google Scholar] [CrossRef]
  22. Dai, A.G. Drought under global warming: A review. Wiley Interdiscip. Rev. Clim. Change 2011, 2, 45–65. [Google Scholar] [CrossRef] [Green Version]
  23. Byun, H.R.; Wilhite, D.A. Objective quantification of drought severity and duration. Am. Meteorol. Soc. J. Clim. 1999, 12, 2747–2756. [Google Scholar] [CrossRef]
  24. McKee, T.B.; Doesken, N.J.; Kleist, J. The relationship of drought frequency and duration to time scales. In Proceedings of the Eighth Conference on Applied Climatology, Anaheimm, CA, USA, 17–23 January 1993. [Google Scholar]
  25. Vicente-Serrano, S.M.; Beguería, S.; López-Moreno, J.I. A Multiscalar Drought Index Sensitive to Global Warming: The Standardized Precipitation Evapotranspiration Index. J. Clim. 2010, 23, 1696–1718. [Google Scholar] [CrossRef] [Green Version]
  26. Dore, M.H.I. Climate change and changes in global precipitation patterns: What do we know? Environ. Int. 2005, 31, 1167–1181. [Google Scholar] [CrossRef] [PubMed]
  27. Zou, X.; Zhai, P.; Zhang, Q. Variations in droughts over China: 1951–2003. Geophys. Res. Lett. 2005, 32, 353–368. [Google Scholar] [CrossRef]
  28. Jeong, M.S.; Kim, J.-S.; Oh, S.M.; Moon, Y.-I. Sensitivity of summer precipitation over the Korean Peninsula to temperature gradients. Int. J. Clim. 2015, 35, 836–845. [Google Scholar] [CrossRef]
  29. Jain, S.; Lall, U.; Mann, M.E. Seasonality and Interannual Variations of Northern Hemisphere Temperature: Equator-to-Pole Gradient and Ocean–Land Contrast. J. Clim. 1999, 12, 1086–1100. [Google Scholar] [CrossRef]
  30. Xu, H. Arctic climate is more sensitive to global warming than expected. In Resources, Environment and Engineering; Xie, L.Q., Ed.; London, UK, 2014; Volume 28, pp. 232–233. [Google Scholar]
  31. Quiring, S.M.; Papakryiakou, T.N. An evaluation of agricultural drought indices for the Canadian prairies. Agric. For. Meteorol. 2003, 118, 49–62. [Google Scholar] [CrossRef]
  32. Funk, C.; Shukla, S. Drought early warning—definitions, challenges, and opportunities. In Drought Early Warning and Forecasting; Elsevier: Amsterdam, The Netherlands, 2020; pp. 23–42. [Google Scholar]
  33. Kim, T.-W.; Valdes, J.B.; Yoo, C. Nonparametric approach for bivariate drought characterization using Palmer drought index. J. Hydrol. Eng. 2006, 11, 134–143. [Google Scholar] [CrossRef]
  34. Hao, Z.; Singh, V.P. Entropy based method for bivariate drought analysis. J. Hydrol. Eng. 2013, 18, 780–786. [Google Scholar] [CrossRef]
  35. Shiau, J.T.; Shen, H.W. Recurrence analysis of hydrologic droughts of differing severity. J. Water Resour. Plan. Manag. 2001, 127, 30–40. [Google Scholar] [CrossRef]
  36. Bonaccorso, B.; Cancelliere, A.; Rossi, G. An analytical formulation of return period of drought severity. Stoch. Environ. Res. Risk Assess. 2003, 17, 157–174. [Google Scholar] [CrossRef]
  37. González, J.; Valdés, J.B. Bivariate Drought Recurrence Analysis Using Tree Ring Reconstructions. J. Hydrol. Eng. 2015, 8, 247–258. [Google Scholar] [CrossRef]
  38. Salas, J.D.; Fu, C.J.; Cancelliere, A.; Dustin, D.; Bode, D.; Pineda, A.; Vincent, E. Characterizing the Severity and Risk of Drought in the Poudre River, Colorado. J. Water Resour. Plan. Manag. 2005, 131, 383–393. [Google Scholar] [CrossRef]
  39. Cancelliere, A.; Salas, J.D. Drought Probabilities and Return Period for Annual Streamflows Series. J. Hydrol. 2010, 391, 77–89. [Google Scholar] [CrossRef]
  40. Yang, X.Q.; Xiao, J. Analysis of precipitation change trend and mutation in Hainan Island based on Mann Kendall. Flood Control. Drought Relief 2020, 30, 27–30. (In Chinese) [Google Scholar]
  41. Xu, H.; Song, Y.P.; Goldsmith, Y.; Lang, Y.C. Meridional ITCZ shifts modulate tropical/subtropical Asian monsoon rainfall. Sci. Bull. 2019, 64, 1737–1739. [Google Scholar] [CrossRef] [Green Version]
  42. Shiau, J.T. Fitting drought duration and severity with two-dimensional copulas. Water Resour. Manag. 2006, 20, 795–815. [Google Scholar] [CrossRef]
  43. Chen, H.; Sun, J. Changes in drought characteristics over China using the standardized precipitation evapotranspiration index. J. Clim. 2015, 28, 5430–5447. [Google Scholar] [CrossRef]
  44. Hamed, K.H. Exact distribution of the Mann-Kendall trend test statistic for persistent data. J. Hydrol. 2009, 365, 86–94. [Google Scholar] [CrossRef]
  45. Sklar, A. Fonctions de répartition à n dimensions et leurs marges. Publ. Inst. Statist. Univ. Paris 1959, 8, 229–231. [Google Scholar]
  46. Dong, L.Y. Application of Drought Index Based on Copula Function Model and FDA Method. Master’s Thesis, Chongqing University, Chongqing, China, 2019. [Google Scholar]
  47. Genest, C.; MacKay, J. The Joy of Copulas: Bivariate Distributions with Uniform Marginals. Am. Stat. 1986, 40, 280–283. [Google Scholar]
  48. Cherubini, U.; Luciano, E. Bivariate option pricing with copulas. Appl. Math. Finance 2002, 9, 69–85. [Google Scholar] [CrossRef]
  49. Zhao, H.Y.; Zhang, G.; Gao, G.; Lu, E. Characteristic analysis of agricultural drought disaster in China during1951–2007. J. Nat. Disasters 2010, 19, 201–206. [Google Scholar]
  50. Chen, F.; Li, L.M. Researches on spatial and temporal succession law of agricultural drought in the past 60 years in China. J. South China Normal Univ. Nat. Sci. Ed. 2011, 36, 111–114. [Google Scholar]
  51. Yao, Y.; Zheng, Y.G. The temporal and spatial characteristics of flood and drought during the recent 60 years in China. Agric. Res. Arid Areas 2017, 35, 228–232. [Google Scholar]
  52. Zeng, Z.Q.; Wu, W.X.; Li, Y.M.; Zhou, Y.; Zhang, Z.; Zhang, S.; Guo, Y.; Huang, H.; Li, Z. Spatiotemporal Variations in Drought and Wetness from 1965 to 2017 in China. Water 2020, 12, 2097. [Google Scholar] [CrossRef]
Figure 1. Study framework for copula-based drought monitoring and assessment using zonal and meridional circulations.
Atmosphere 12 01066 g001
Figure 2. Study area comprising the northeastern, northwestern, and southwestern parts of China.
Atmosphere 12 01066 g002
Figure 3. Definition of drought events used in the present study.
Atmosphere 12 01066 g003
Figure 4. Time series of global temperature gradients. (a) LOC index. (b) MTG index during the period from 1979 to 2019. Green dotted line represents the linear trend of the indices. Gray dashed line indicates the +1 σ and −1 σ. For each gradient, red dots indicate significant positive events while blue dots indicate significant negative events.
Atmosphere 12 01066 g004
Figure 5. Composite analysis of drought characteristics with temperature gradients.
Atmosphere 12 01066 g005
Figure 6. Long-term trend in drought components in China between 1979 and 2019. (a) Drought duration. (b) Drought severity.
Atmosphere 12 01066 g006
Figure 7. Relationship between drought duration and severity in the (a) southwest, (b) northeast, and (c) southwest.
Atmosphere 12 01066 g007
Figure 8. Copula distributions of drought duration and severity in positive (negative) LOC/MTG years.
Atmosphere 12 01066 g008
Table 1. Drought categories based on the SPEI index.
CategorySPEI Index
Normal(−0.5, +∞)
Slight drought(−1.0, −0.5)
Moderate drought(−1.5, −1.0)
Severe drought(−2.0, −1.5)
Extreme drought(−∞, −2.0]
Table 2. Copula model-fitting table for the study area.
AreaCategory of Copula FunctionParameter EstimatesGoodness of Fit Evaluation Standard
AICBIC
NorthwestGaussian copula0.8271−601.2871−596.9415
Student’s copula0.8271−599.1858−590.4946
GH copula2.345−546.6435−542.2979
Frank copula8.183−573.2539−568.9083
Galambos copula1.645−554.9031−550.5575
HuslerReiss copula2.252−565.7303−561.3846
NortheastGaussian copula0.8319−820.555−815.905
Student’s copula0.8337−822.6324−813.3318
GH copula2.701−907.3378−902.6875
Frank copula8.604−791.2964−786.6461
Galambos copula2.003−909.7965−905.1462
HuslerReiss copula2.635−910.1736−905.5233
SouthwestGaussian copula0.8291−775.5213−773.5139
Student’s copula0.8291−773.5139−764.3061
GH copula2.436−737.7691−733.1652
Frank copula8.816−784.6019−779.998
Galambos copula1.727−744.8849−740.2809
HuslerReiss copula2.335−757.1334−752.5294
Publisher’s Note: MDPI stays neutral with regard to jurisdictional claims in published maps and institutional affiliations.

