Article

Assessment of Air Pollution Tolerance and Particulate Matter Accumulation of 11 Woody Plant Species

1
Department of Horticultural Science, Chungbuk National University, Cheongju 28644, Korea
2
Division of Plant Resources, Korea National Arboretum, Pocheon 11186, Korea
3
Forest Bioresources Conservation Division, National Baekdudaegan Arboretum, Bonghwa 26209, Korea
4
Urban Agriculture Research Division, National Institute of Horticultural and Herbal Science, Wanju 55365, Korea
*
Authors to whom correspondence should be addressed.
These authors contributed equally to this work.
Atmosphere 2021, 12(8), 1067; https://doi.org/10.3390/atmos12081067
Submission received: 23 July 2021 / Revised: 16 August 2021 / Accepted: 17 August 2021 / Published: 20 August 2021
(This article belongs to the Section Biosphere/Hydrosphere/Land–Atmosphere Interactions)

Abstract

:
High concentration of particulate matter (PM) threatens public health and the environment. Increasing traffic in the city is one of the main factors for increased PM in the air. Urban green spaces play an important role in reducing PM. In this study, the leaf surface and in-wax PM (sPM and wPM) accumulation were compared for 11 plant species widely used for landscaping in South Korea. In addition, biochemical characteristics of leaves (ascorbic acid chlorophyll content, leaf pH, and relative water content) were analyzed to determine air pollution tolerance. Plant species suitable for air quality improvement were selected based on their air pollution tolerance index (APTI) and anticipated performance index (API). Results showed a significant difference according to the accumulation of sPM and wPM and the plant species. PM accumulation and APTI showed a positive correlation. Pinus strobus showed the highest PM accumulation and APTI values, while Cercis chinensis showed the lowest. In 11 plants, API was divided into five groups. Pinus densiflora was classified as the best group, while Cornus officinalis and Ligustrum obtusifolium were classified as not recommended.

1. Introduction

Urban development is associated with environmental consequences, especially increasing air pollution, which has public health implications and adverse effects on the ecosystem. Particulate matter (PM) is the most dangerous air pollutant with adverse health effects, including birth anomalies, reduced longevity, and lower respiratory and cardiovascular health. The main source of PM includes crustal matter, transport emissions, and biomass incineration as well as industrial activity, domestic fuel systems, and natural elements [1]. Therefore, reducing PM in the air is a major challenge for governments worldwide.
Plants can adsorb and absorb fine dust in the atmosphere and can be used as a sustainable air purifying filter. Their performance depends on several factors, such as PM concentration, environmental conditions, and leaf characteristics of plant species [2]. For example, the amount of PM accumulation by plants differs across different geographical locations and the plant species involved and tends to increase under high PM concentrations [3]. Moreover, rain can wash off a significant amount of PM from the leaf surface [4]. PM accumulates on both the adaxial and abaxial surfaces of leaves; however, the extent of PM accumulation tends to be higher on the adaxial surface and on leaves with greater roughness [5]. Additionally, the amount of PM accumulation varies according to differences in the micromorphology of leaves. Leaves with high trichomes and wettability show high PM accumulation [6]. Conversely, surface PM also affects plant growth by altering the morphological, physiological, and biochemical status of plants. For example, PM may reduce the rate of photosynthetic Fv/Fm, leading to a decrease in plant productivity and functionality [7]. However, the response of each plant species to air pollution is unique. Sensitive plants are greatly affected by air pollution, in contrast to other species that are resistant to air pollution. Sensitive and tolerant plants can be used as an indicator or a sink to reduce air pollution, respectively [8,9]. Therefore, selecting suitable plant species is very important. The air pollution tolerance index (APTI) was created by Singh et al. [10] to determine the plant response (sensitive or tolerance) to air pollution. The APTI is based on four plant biochemical parameters: relative water content (RWC), ascorbic acid level, total chlorophyll content (TChl), and leaf pH (pH). A high APTI suggests tolerance to air pollution. Conversely, a low APTI value of the plant indicates sensitivity to air pollution. Further, the anticipated performance index (API) combines the APTI value of the plant with biochemical and socioeconomic parameters (tree habit, canopy structure, type of tree, and laminar characteristics including size, texture, hardiness, and economic value) [11]. Based on the API value, plant species can be classified into several categories. A plant species with a high API value can be used to improve air quality. The amount of PM accumulation and API of the plant are important indices that can be used to select the most effective plant species with a high economic value to improve air quality or use as an environmental indicator for plantation.
Korea, a peninsular country that is surrounded by sea on three sides and stretches from north to south, has a relatively diverse tree species distribution compared to its area [12]. Besides herbaceous plants, there are a total of 669 taxa, including 399 species, 134 varieties, 57 forms, and 79 cultivars, that are commonly used for landscape planting [13].
The purpose of this study was to measure the amount of leaf surface PM (sPM), in-wax PM (wPM), and biochemical properties (ascorbic acid, TChl, pH, and RWC) of 11 plants, namely six species of evergreen (needle-leaved) and five species of deciduous (broad-leaved) plants, that are widely used for urban landscaping in Korea. After calculating the air pollution tolerance index (APTI) using biochemical properties, the correlation between APTI and PM was analyzed and classified into API grade reflecting APTI. APTI and API were used as basic data to select plants that are effective in air quality purification and have high economic value when creating urban green spaces.
We hypothesized that (1) the amount of PM accumulation is different between various plant species; (2) the amount of PM accumulation on leaf has a significant correlation with biochemical characteristic and APTI of plants; and (3) APTI and API can be used as an evaluation criteria to select plant species for landscape planting in urban area.

2. Materials and Methods

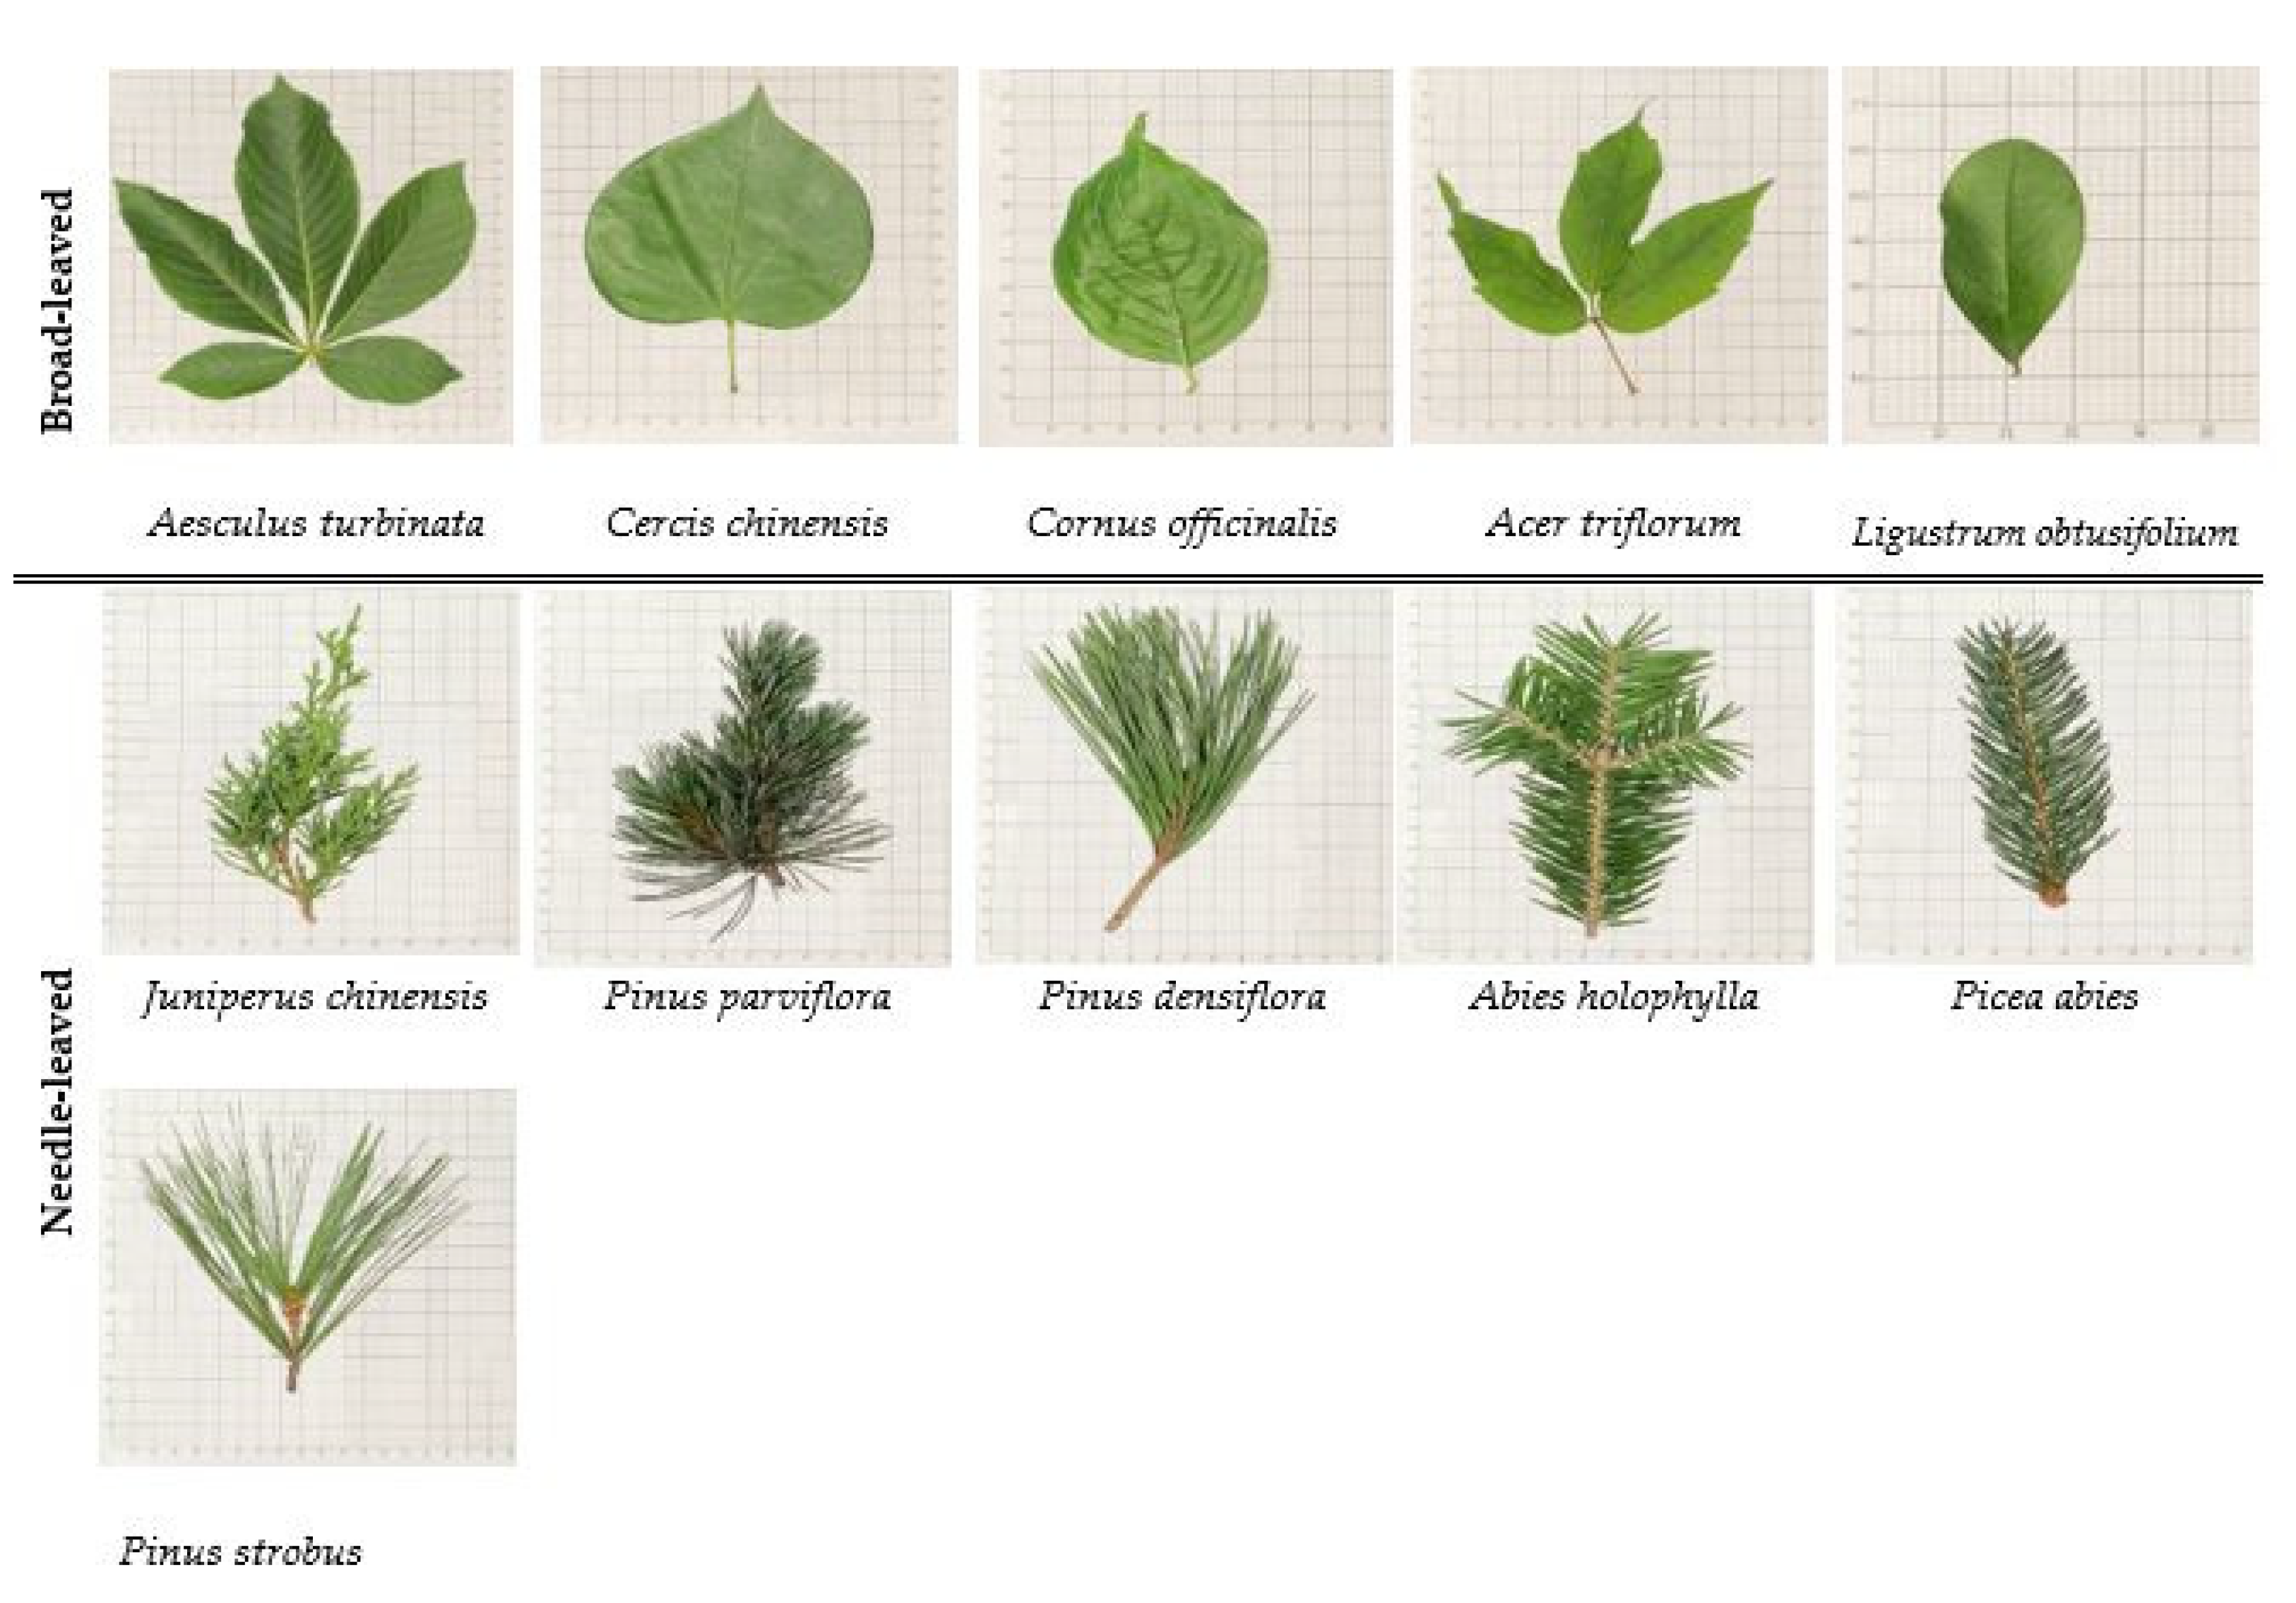
2.1. Study Site and Leaf Sampling

The research site was the Chungbuk National University (CBNU) (36.6290° N, 127.4563° E). CBNU is located in the central-west part of Cheongju city, which is the provincial capital of Chungcheongbuk-do, South Korea. CBNU is beautiful, with various buildings, wide open spaces, and various plants planted in an area of 956,101 m2.
In August 2020, the precipitation in Cheongju city was 385.8 mm, and the average temperature, wind speed, and relative humidity were 27.7 °C, 1.40 m s−1, and 79.0%, respectively [14]. In addition, SO2 was 0.003 ppm and O3, NO2, CO, PM10, and PM2.5 were 0.017 ppm, 0.013 ppm, 0.3 ppm, 25.5 µg m−3, and 14.7 µg m−3, respectively [15].
We selected 11 plants planted on the CBNU campus and sampled leaves in good condition (free from pests and diseases) (Table 1 and Figure 1). In August 2020, plant leaves with an area of approximately 300 to 400 cm2 were collected from a height of 1.0 to 1.8 m above the ground, which corresponds to the height at which most of the air is inhaled by humans, and stored in paper bags at room temperature until analysis. Leaf sampling was performed 5 times per plant species, and all samples were collected after 10 days without rain.

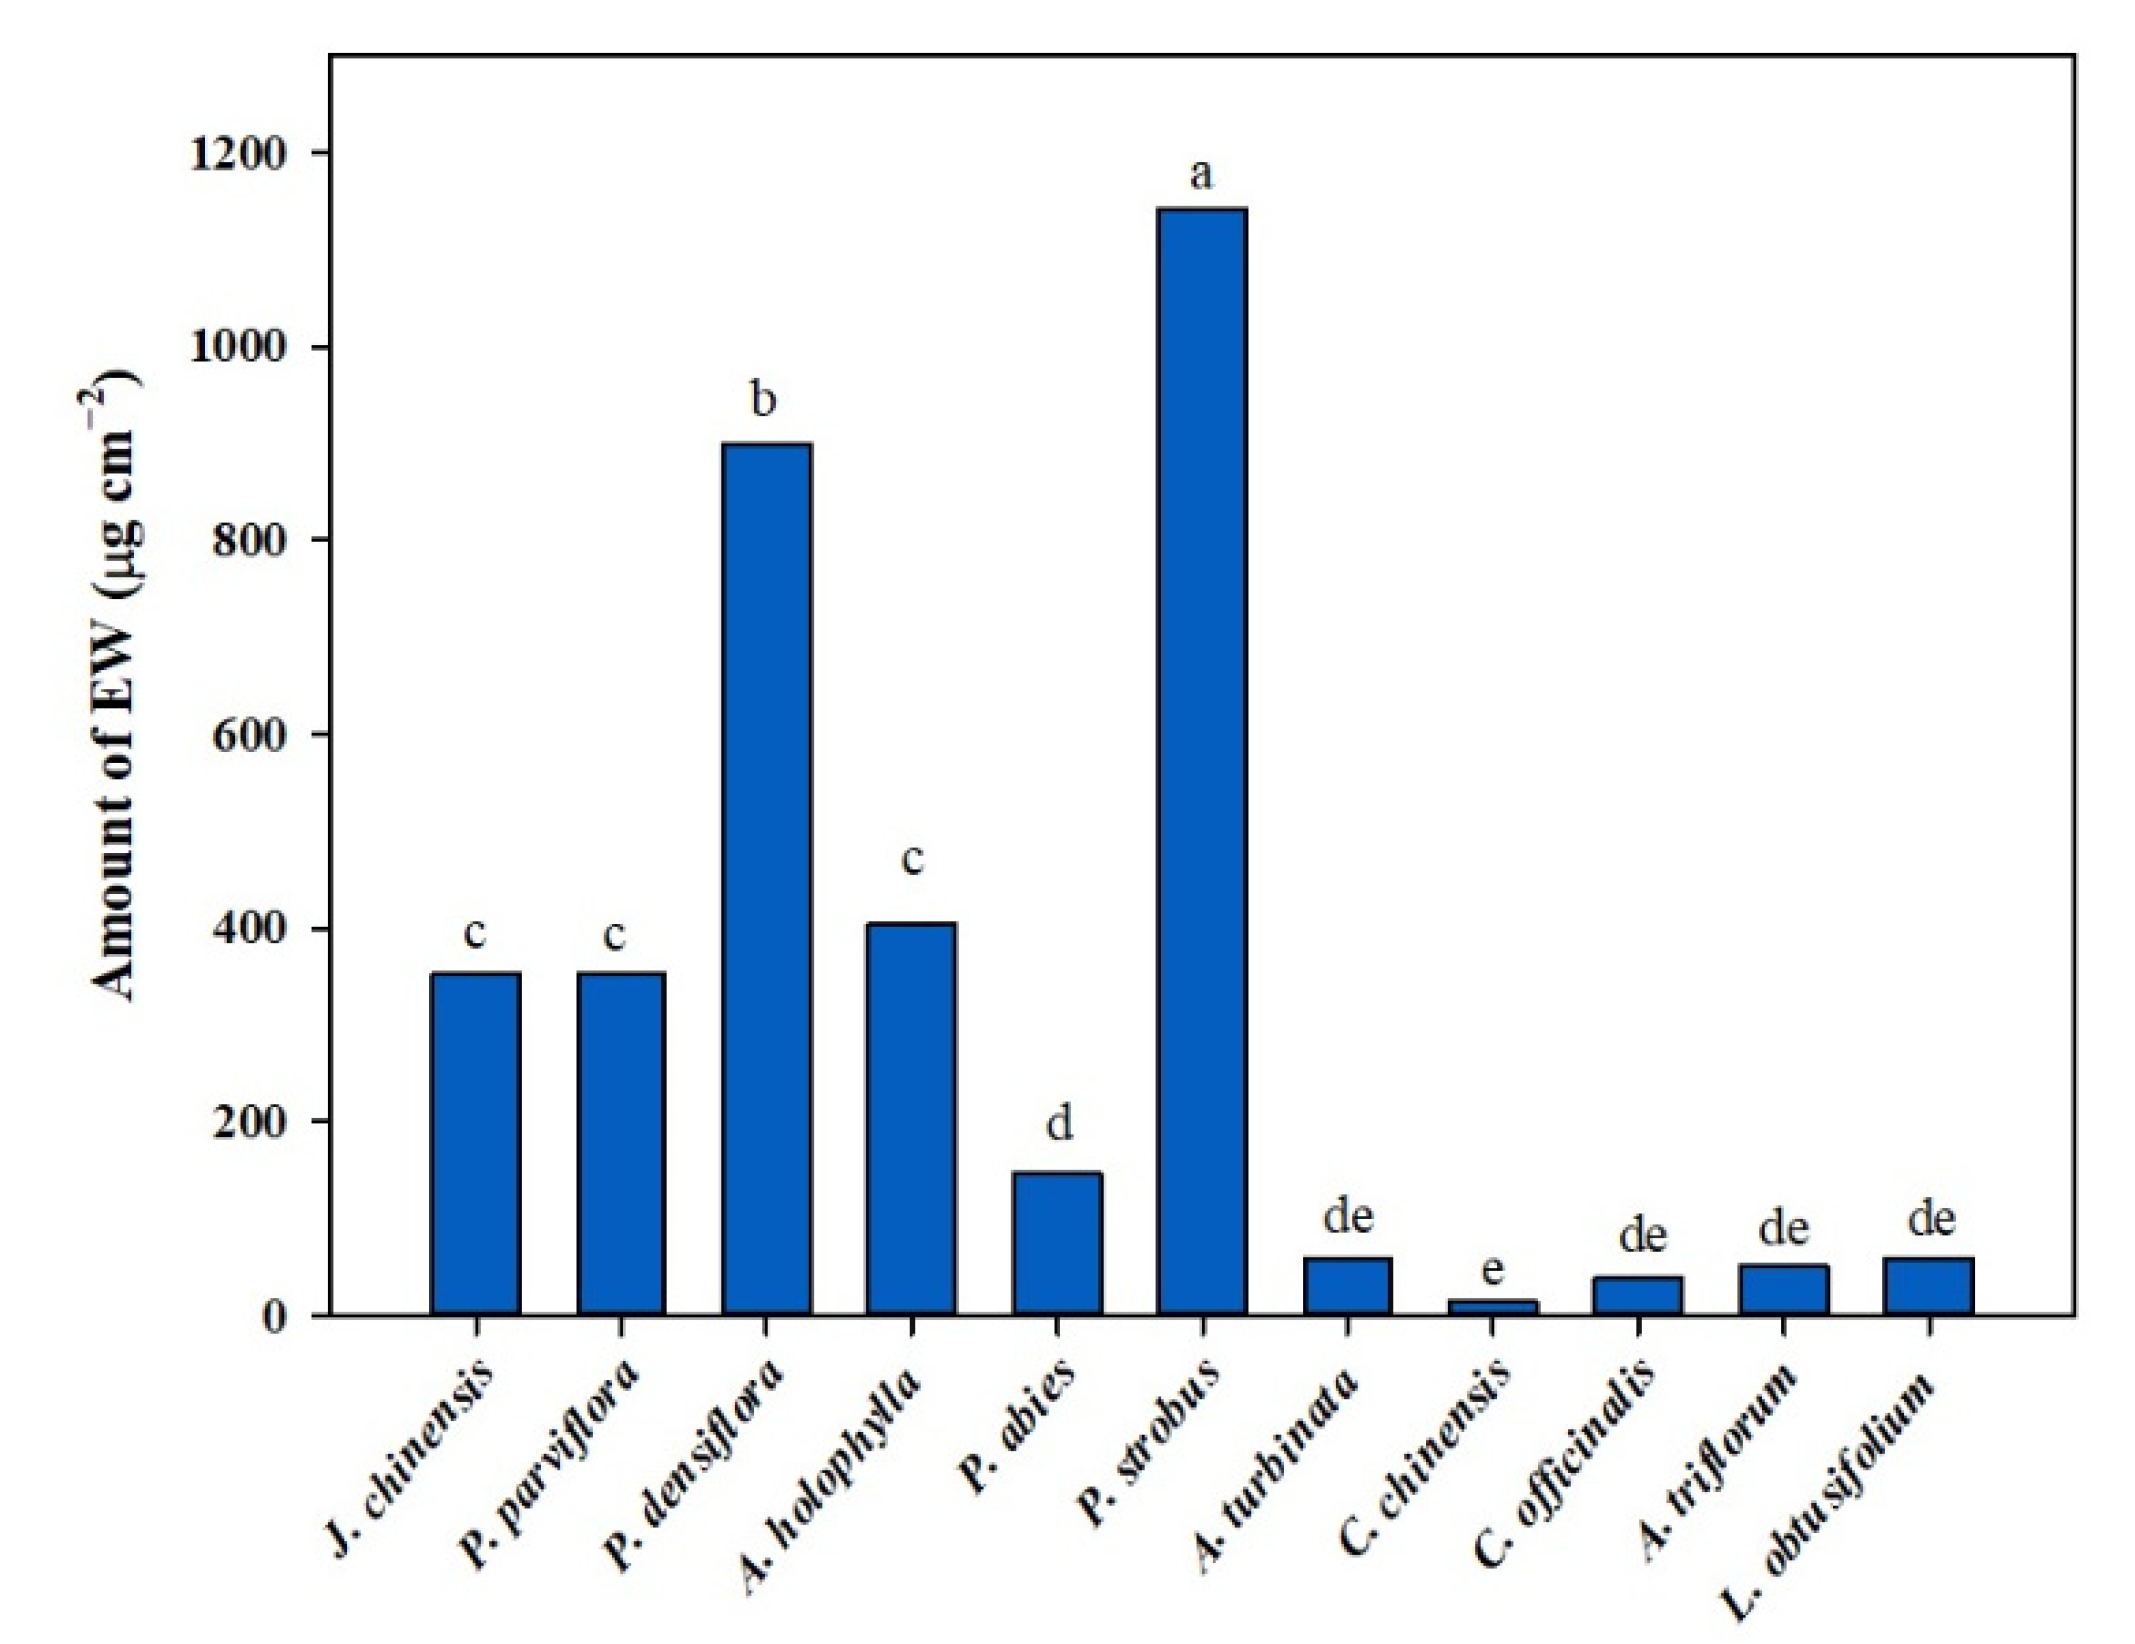
2.2. Quantity of PM Accumulation on Leaf Surface, In-Wax, and Epicuticular Wax (EW)

Based on the wash-off method described by Dzierzanowski et al. [16], we determined the amount of PM on the leaf surface and in-wax of 11 sample leaves by washing the sample with water and chloroform, respectively. The 300 cm2 leaf samples were washed with 250 mL distilled water on a glass beaker for 60 s. Using analog ultrasonic cleaners (WUC-A22H, Daihan Scientific, Wonju, Korea), all particles were removed from the leaf surface. Next, the solution was filtered through a 100 µm metal sieve to remove larger particles. In this study, we used two different filter papers, namely Type 91 and Type 42 (Whatman, UK), to filter PM from the water solution. The filter paper was placed on a general desiccator (DH.DeBG1K, Daihan Scientific, Wonju, Korea) for 48 h and weighed using a semimicro electronic balance (EX125D, Ohaus, Parsippany, NJ, USA). Based on the different weights of the two filter papers, we obtained PM of two different sizes: sPM10 and sPM2.5. To measure the amount of PM per unit area of each plant, the area of leaves used for PM extraction was measured using a leaf area measuring instrument (LI-3100C, LI-COR Biosciences, Lincoln, NE, USA). The leaf samples were washed with chloroform and filtered using the same method described above to collect wPM, i.e., wPM10 and wPM2.5. The solution was transferred to a preweighed beaker to collect EW after chloroform evaporation.

2.3. Biochemical Characteristics of Leaf

2.3.1. Leaf Extract pH (pH)

Using the method of Singh et al. [10], the pH of leaves was determined with a pH meter (HI8424, Hanna Instruments, Woonsocket, RI, USA) after homogenizing a 1 g sample of fresh leaves with 10 mL distilled water.

2.3.2. Relative Leaf Water Content (RWC)

Using the method of Li et al. [17], the RWC was determined by analyzing the fresh weight (FW), turgid weight (TW), and dry weight (DW). The weight of 1 g FW and TW that the weight after soaking in distilled water for 24 h at 4 °C were measured. Finally, DW was measured after drying the leftover sample in an oven at 80 °C. The RWC of the sample was determined using the formula below:
RWC   ( % ) = FW     DW TW     DW × 100
where FW is the fresh weight, TW is the fully turgid weight, and DW is the dry weight.

2.3.3. Chlorophyll and Carotenoid Content

Using the method of Lichtenthaler [18], the chlorophyll content of leaf samples was determined as follows:
Chl a = (11.24 × A616.6) − (2.04 × A644.8)
Chl b = (20.13 × A644.8) − (4.19 × A616.6)
Chl a + b = (7.05 × A616.6) + (18.09 × A644.8)
Carotenoids = (1000 × A470) − (1.90 × Chl a − 63.14 × Chl b)/214
where A616.6, A644.8, and A470 refer to the absorbance values of the corresponding wavelengths.

2.3.4. Ascorbic Acid

Ascorbic acid levels were determined based on the method described by Dinesh et al. [19] using the following formula:
Amount   of   ascorbic   acid   content   ( mg   100   g 1 ) = 500 × V 2 × 25 × 100 V 1 × 5 × 5
where 500 is µg of standard ascorbic acid taken for titration, V1 is the volume of dye consumed by 500 µg of standard ascorbic acid, V2 is the volume of dye consumed by 5 mL of test sample, 25 is corresponds to the total volume of the extract, 100 is the ascorbic acid content/100 g of the sample, 5 is the weight of sample taken for extraction, and 5 is the volume of the test sample taken for titration.

2.4. APTI

APTI was measured using the method described by Singh et al. [10] with the following formula:
APTI = A × ( T + P ) + R 10
where A is the ascorbic acid (mg g−1 FW: Equation (3)), T is the total chlorophyll (Chl a + b) (mg g−1 FW: Equation (2)), P is the leaf extract pH, and R is the relative water content of the leaf (%: Equation (1)).

2.5. API

To study the socioeconomic importance of plants, API classifies 8 grades of 0–7 by combining APTI, the landscape value of trees, and the economic value of wood [20].
Using the method described by Shannigrahi et al. [11], the API of the plants was calculated by determining the ratio of grades of each plant species and the maximum possible grades for any species (16 grades). Based on the biochemical and socioeconomic parameters and the value of API of the specific plant, the grades were assigned for that plant species (Table 2 and Table 3).
%   Score = Grades   obtained   by   plant   species Maximum   possible   grades   of   any   species × 100

2.6. Statistical Analysis

All the data were analyzed using SAS software, version 9.4 (SAS Institute, Cary, NC, USA) for Duncan’s multiple range test (DMRT), and p values of 0.05 were considered significant. Pearson’s correlation analysis was used to identify the relationship between the amount of PM accumulation and the plant biochemical characteristics and APTI.

3. Results and Discussion

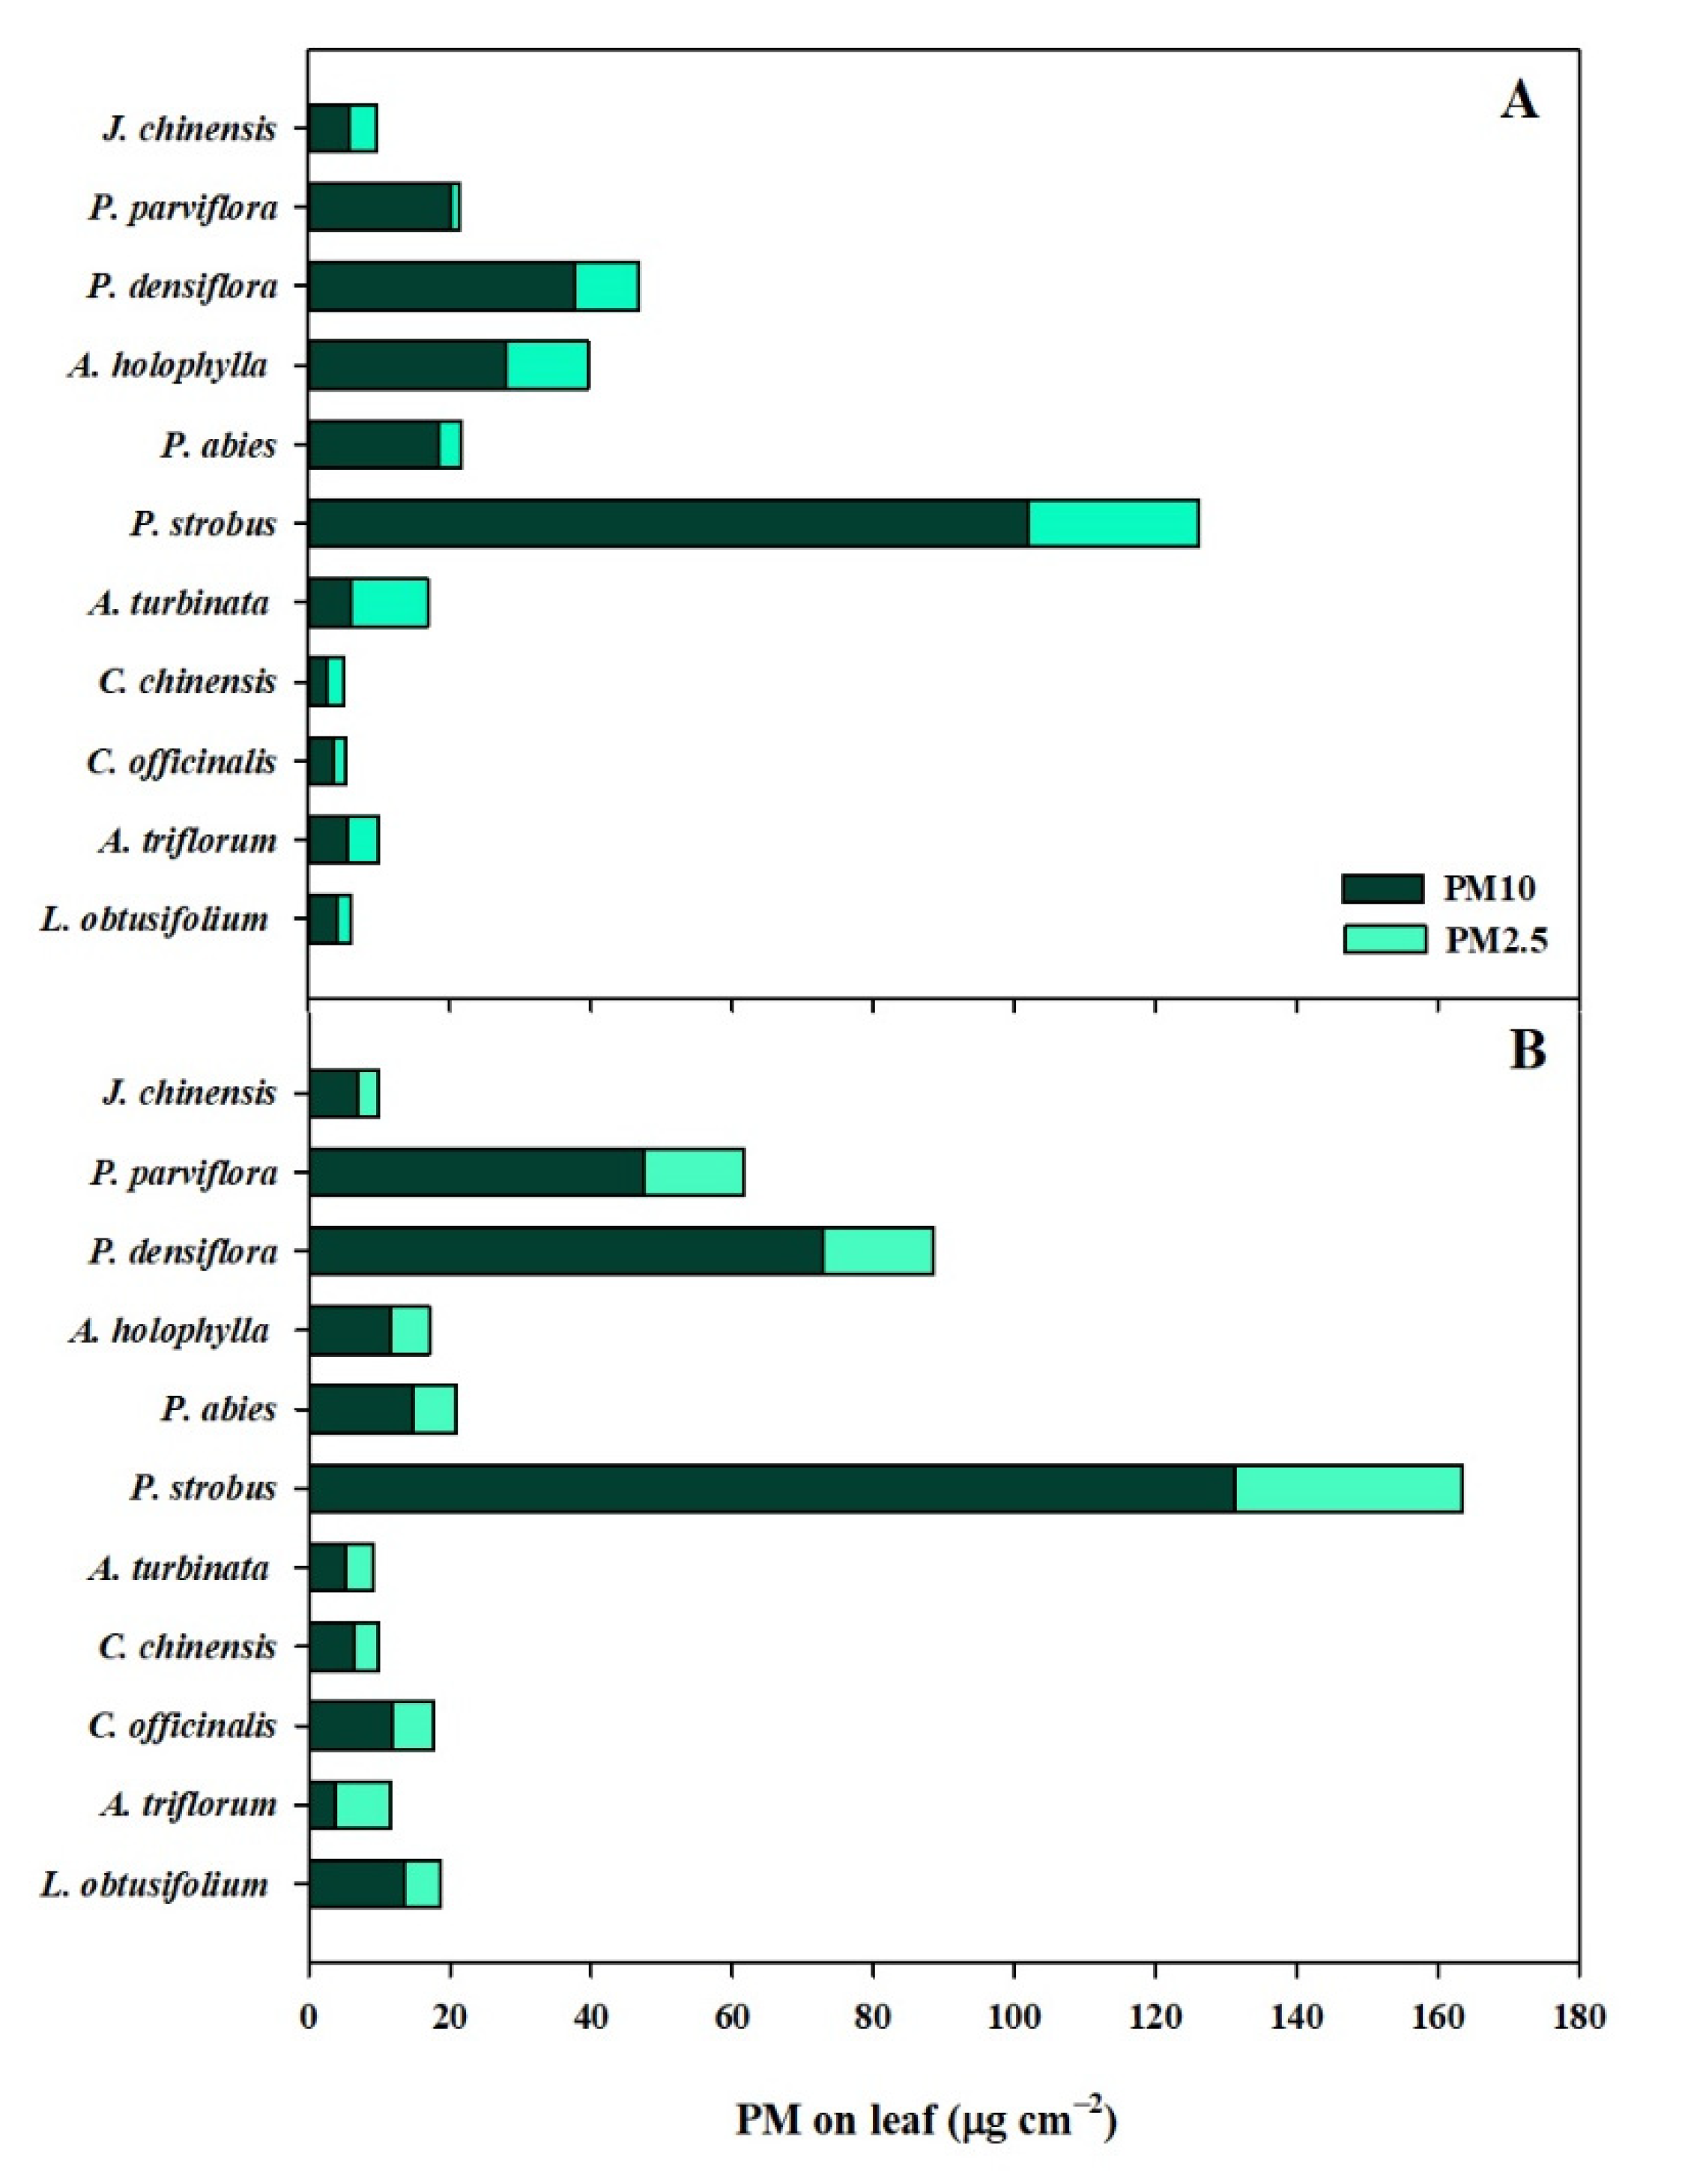
3.1. PM Accumulation on Leaf Surface and In-Wax

In this study, the amount of PM accumulation of the 11 plant species differed between the leaf surface and in-wax (Figure 2). The average level of PM accumulation on the leaf surface was higher than the amount of wPM. Comparing the average level of PM accumulation based on size, our results showed that the average level of PM10 was higher than PM2.5. The most and the least effective total PM accumulation on leaf surface was detected on P. strobus and A. turbinata, respectively. The amount of PM accumulation in P. strobus was 17-fold higher than in A. turbinata. The most effective plant species after P. strobus were P. densiflora and P. parviflora. Additionally, J. chinensis and C. chinensis showed diminished PM accumulation. The amount of PM accumulation in the two plant species was nearly as low as in A. turbinata. Among the 11 species, the intermediate group included the five species A. holophylla, P. abies, C. officinalis, A. triflorum, and L. obtusifolium with the amount of PM accumulation ranging from 11.57 to 20.89 µg. When the amount of PM10 accumulation was compared with that of PM2.5 on leaf surface, only A. triflorum carried higher levels of PM2.5 than PM10, while other plant species accumulated substantially higher PM10 than PM2.5. We also identified different amounts of PM accumulation in-wax in the 11 different plant species, and the extent of PM accumulation varied between the leaf surface and in-wax. A low level of PM accumulation was observed in J. chinensis, C. chinensis, C. officinalis, A. triflorum, and L. obtusifolium, whereas highly effective concentrations of PM were found in P. parviflora, P. densiflora, A. holophylla, P. abies, P. strobus, and A. turbinata. The highest effective PM accumulation was detected in P. strobus, followed by P. densiflora. However, the least effective PM accumulation was not in A. turbinata but rather in C. chinensis. Plants tend to accumulate PM on the leaf surface more than in-wax. Only three out of 11 plant species had total wPM higher than total sPM: A. holophylla, P. abies, and A. turbinata. Specifically, A. holophylla showed substantially effective PM accumulation in-wax. The amount of PM accumulation in-wax of A. holophylla was more than 2-fold higher than the amount of PM on the leaf surface. The results revealed elevated total PM accumulation in P. strobus, P. densiflora, and P. parviflora, while P. strobus was the plant species with the highest total PM accumulation. Conversely, C. chinensis represented the plant with the least total PM accumulation. Both PM10 and PM2.5 were accumulated in-wax of the 11 plant species. The amount of PM10 was higher than that of PM2.5 in all plant species except A. turbinata. Additionally, we found that the amount of EW of the 11 plant species varied significantly. The amount of EW tended to be higher in plants with needle-shaped leaves, i.e., P. strobus, followed by P. densiflora and A. holophylla. The plant species with the least EW was C. chinensis (Figure 3). In this study, a significant positive correlation existed between sPM and wPM and the amount of EW.
Atmospheric PM is adsorbed and absorbed in the form of sPM and wPM in leaves, which can lead to biochemical reactions due to photoinhibition and clogging of the stomata [24]. Moreover, even in plants that live in the same environment, the amounts of sPM and wPM are closely related to leaf characteristics (roughness, micromorphology, trichomes, etc.) [25]. Additionally, rough leaves with higher pubescence can accumulate PM more than other rough leaves [5]. The results of our study showed that pine species were the most efficient in PM accumulation. Previous studies have also reported that pine species, including P. strobus, P. densiflora, P. parviflora, and P. abies, store more PM than other species [2,26]. Pinus strobus showed the highest levels of PM accumulation on both the leaf surface and in-wax. It also had the highest amount of EW, suggesting that the positive correlation between the amount of EW and PM increases PM accumulation of P. strobus. Kwak et al. [27] were showed that A. turbinata has protuberances along the trichome length that is the reason for the more effective PM2.5 accumulation of this plant. However, the wash-off rate of A. turbinata has higher than other plants. So, the amount of PM accumulation on the leaf of this plant can be more reduced than other plants. This finding was similar to our study. A. turbinata showed the least PM accumulation on the leaf and higher levels of PM2.5 than PM10. The wPM2.5 accumulation in-wax of this plant was even higher than the amount of wPM10. The amount of PM accumulation in-wax of each plant species differed because of the differences in the EW structure. EW acts as a barrier to protect leaves from the impact of pollution. The amount of in-wax layer is positively associated with the amount of PM on the leaf [28], thus resulting in high amount of total wPM in P. strobus, and P. densiflora. Moreover, the amount of total sPM was higher than the amount of wPM in 8 out of the 11 species, with A. holophylla, P. abies, and A. turbinata being the exceptions. This is because the accumulation of PM on EW takes longer and has less impact on the environmental condition. However, the amount of PM on the leaf surface can be increased or decreased by rain or wind, resulting in differences in PM levels on the leaf wax layer and leaf surface [29]. In the case of J. chinensis, the plant has a large amount of EW but limited PM accumulation due to the EW structure, which has ultrahydrophobic and self-cleaning properties [30]. This factor may have primarily contributed to the less effective PM accumulation of J. chinensis than the other pine species.

3.2. Biochemical Characteristic of Leaf

In this study, we analyzed the biochemical characteristics of the 11 plants (Table 4). The results showed there were differences in all four parameters. First, the RWC content of the 11 plants differed between 65.25% and 85.05%, and the highest and the lowest RWC values were detected in P. densiflora and C. chinensis, respectively. A similar trend in pH was found, with the pH ranging between 4.15 and 5.99. The plants showing the highest and lowest pH were P. abies and P. strobus, respectively. The TChl content of the five broad-leaved species ranged from 0.19 to 0.27 mg g−1, while the TChl content of the six needle-leaved species was lower in the range of 0.10 to 0.19 mg g−1. The plants with the lowest total PM accumulation showed the highest TChl content, such as C. chinensis. P. strobus had the least TChl content among the 11 plant species but the largest amount of PM accumulation. Additionally, the ascorbic acid of 11 plant species ranged between 0.71 and 2.38 mg g−1. The plants that contained the highest and lowest levels of ascorbic acid were A. holophylla and J. chinensis, respectively. Among the 11 plant species, low ascorbic acid content was found in J. chinensis and A. turbinata. We also found that the needle-leaved species tended to carry higher levels of ascorbic acid than the broad-leaved species. Further, the PM10 and PM2.5 levels in both leaf surface and in-wax showed a positive correlation with ascorbic acid level and a negative correlation with pH, but no correlation between PM and RWC was detected. The sPM10, sPM2.5 and wPM10 levels showed a slight negative correlation with TChl; conversely, the wPM2.5 level did not correlate with the TChl content (Table 5).
Although plants play an important role in reducing air pollution, the growth and production of plants is influenced by PM accumulation on their leaves. Further, PM induces changes in the microstructural characteristics of leaves, such as stomatal index, leaf wax layer, surface texture, and trichome [31]. In addition, the PM accumulation on the leaf can influence the biochemical characteristics of plants, including pH, RWC, Tchl content, and ascorbic acid [10]. These four biochemical parameters directly influence the growth of plants, and alteration of any parameter may trigger changes in plant physiology. The pH is well known as a sensitive indicator of atmospheric pollution. The pH of plants can increase or decrease depending on the type of air pollution. Acidic pollution may reduce the pH in sensitive plants. The levels of SO2 and NO2 also impact the leaf pH [32,33]. In this study, P. strobus with a large amount of PM deposited on the leaf surface and in-wax showed a lower pH. We found that the amount of PM accumulation on both leaf surface and in-wax had a negative correlation with the plant pH. The alteration in pH may also influence stomatal sensitivity and impact the photosynthetic activity of plants. Furthermore, pH also influences the ascorbic acid levels of plants. A high pH can increase the conversion of hexose sugar to ascorbic acid and hence enhance the tolerance of plants against air pollution [22]. The RWC reflects the water status or transpiration of the plant. Plants deal with unfavorable environmental conditions (drought, air pollution, etc.), and a high RWC can prevent the loss of water to maintain physiological balance [34]. Therefore, high RWC increases plant tolerance to air pollution. In this study, the needle-leaved species were highly tolerant and showed a higher RWC than the broad-leaved species. However, we did not find any correlation between PM accumulation on the leaf surface and in-wax with RWC. TChl is directly related to plant growth and production and is substantially affected by PM accumulation on the leaves. Przybysz et al. [35] reported that PM has a negative correlation with the chlorophyll content but that the association is unique to each plant species. However, with the same environment condition, the level of decrease in chlorophyll is depended on the plant species. In this study, the average needle-leaved species also showed a higher TChl than broad-leaved species. All the PM values showed a significant correlation with TChl except for wPM2.5. Generally, the atmospheric PM reduces TChl but not at all times. The deposition of PM on the leaf surface can prevent the absorbed light from decreasing the effective photosynthetic activity of plants, and stomatal clogging can decrease photosynthesis. The impact of PM accumulation on the leaf can primarily contribute to a reduction in TChl content of needle-leaved plants [32]. Finally, ascorbic acid is a natural antioxidant in plants. Ascorbic acid reduces stress in plants. Additionally, ascorbic acid protects chloroplasts from SO2 and is necessary for many physiological mechanisms of plants. Therefore, plants with high ascorbic acid content are tolerant to atmospheric pollutants [10,36]. However, ascorbic acid depends substantially on plant pH. High pH increases the rate of hexose sugar conversion to ascorbic acid, so the change in ascorbic acid level depends on the plant pH [37]. The high pH of needle-leaved plants may increase the ascorbic acid level of these plant species, which explains the higher ascorbic acid levels of needle-leaved plants than broad-leaved plants in this study. Interestingly, P. strobus had the lowest pH, even though it had high ascorbic acid. Further, J. chinensis had a moderate pH level among the 11 species but had the lowest ascorbic acid level. We suggest that the significance of PM accumulation on the leaf surface and in-wax led to the increase and decrease in ascorbic acid levels of P. strobus and J. chinensis, respectively.

3.3. APTI

The APTI differed between 11 plant species, and the APTI value ranged from 7.11 to 9.52. Among 11 plant species, P. densiflora had the highest APTI value and C. chinensis had the lowest APTI value. In addition, the APTI of needle-leaved species was higher than that of broad-leaved plants, but the needle-leaved J. chinensis showed a low APTI than other needle-leaved plants. A. triflorum showed higher APTI value than other broad-leaved plants. We also found that sPM10, sPM2.5, and wPM10 had a significant correlation with the APTI, while wPM2.5 did not. Under the same environmental conditions, plants exhibit diverse responses against environmental stress depending on their characteristics. A few plants show tolerance, but others show sensitivity to stress. Therefore, to determine the tolerance of plants, it is very important to select an appropriate species. Plants may be tolerant, responsive, or sensitive to air pollution.
PM (sPM10, sPM2.5, and wPM10) and APTI showed a positive correlation according to the results of Pearson’s correlation analysis (Table 5). Therefore, plants with high APTI are tolerant to pollutants and thus can be used as sustainable filters to alleviate deteriorated air quality. On the other hand, plants with low APTI can be used as indicators of air pollution [10,38].

3.4. API

In general, plants with high API are recommended for urban areas or green belt development in urban areas [39]. In this study, the API of the 11 plants ranged from 0 to 4 (Table 6). P. densiflora showed the highest API value and was the only plant species that belonged to the good category. The plant species included in the moderate category were P. parviflora, A. holophylla, P. abies, P. strobus, and A. turbinata. The API value of J. chinensis and A. triflorum was 2, meaning they were in the poor category. C. chinensis was grouped under the very poor category. Furthermore, the two plant species that were not recommended were C. officinalis and L. obtusifolium. The API was determined based on the APTI and the biochemical and socioeconomic parameters of the plant. Plants with high API can be used as a bio-filter in green areas or green belt development in urban areas. Low API reveals sensitivity and poor socioeconomic features, which can be used as an indicator of high air pollution.

4. Conclusions

In this study, PM was extracted from the leaf surface and in the wax layer from leaves of trees collected from 11 species in urban green areas. Results showed there were differences according to the leaf characteristics of plants. In general, conifers had a higher PM accumulation effect than broadleaf trees, and P. strobus showed the highest PM accumulation. sPM10, sPM2.5, wPM10, and wPM2.5 showed a significant positive correlation with the amount of wax in the leaves, and sPM10, sPM2.5, and wPM10 showed a significant positive correlation with ascorbic acid, TChl, and pH among the biochemical characteristics. Because APTI is determined based on the biochemical characteristics of trees, a significant positive correlation was also found between PM (sPM10, sPM2.5, and wPM10) and APTI. Pinus strobus showed the highest value not only for PM but also APTI. For the API, which is based on APTI and various tree characteristics, P. densiflora was graded 4 (good) and P. strobus was grade 3 (moderate), while C. officinalis and L. obtusifolium were graded 0 (not recommended).
Therefore, it is concluded that selecting trees according to the API grade, which reflects the APTI, when creating urban green spaces will have a positive effect on air quality improvement.

Author Contributions

Conceptualization, N.-R.J. and B.-J.P.; methodology, S.-Y.K., J.-C.Y., N.-R.J., and B.-J.P.; validation, S.-Y.K., J.-C.Y., N.-R.J., and B.-J.P.; formal analysis, H.-T.B., U.O., and K.-J.K.; investigation, H.-T.B., U.O., and K.-J.K.; writing—original draft preparation, H.-T.B. and U.O.; writing—review and editing, K.-J.K., S.-Y.K., J.-C.Y., N.-R.J., and B.-J.P.; supervision, B.-J.P.; project administration, N.-R.J. and B.-J.P.; funding acquisition, B.-J.P. All authors have read and agreed to the published version of the manuscript.

Funding

This study was carried out with the support of R&D Program for Forest Science Technology (Project No. 2019155B10-2021-001) provided by Korea Forest Service (Korea Forestry Promotion Institute).

Institutional Review Board Statement

Not applicable.

Informed Consent Statement

Not applicable.

Data Availability Statement

Data are contained within the article.

Conflicts of Interest

The authors declare no conflict of interest.

References

  1. Mukherjee, A.; Agrawal, M. World air particulate matter: Sources, distribution and health effects. Environ. Chem. Lett. 2017, 15, 283–309. [Google Scholar] [CrossRef]
  2. Sæbø, A.; Popek, R.; Nawrot, B.; Hanslin, H.M.; Gawronska, H.; Gawronski, S.W. Plant species differences in particulate matter accumulation on leaf surfaces. Sci. Total Environ. 2012, 427, 347–354. [Google Scholar] [CrossRef]
  3. Popek, R.; Łukowski, A.; Bates, C.; Oleksyn, J. Accumulation of particulate matter, heavy metals, and polycyclic aromatic hydrocarbons on the leaves of Tilia cordata Mill. in five Polish cities with different levels of air pollution. Int. J. Phytoremedaiation. 2017, 19, 1134–1141. [Google Scholar] [CrossRef] [PubMed]
  4. Przybysz, A.; Sæbø, A.; Hanslin, H.M.; Gawroński, S.W. Accumulation of particulate matter and trace elements on vegetation as affected by pollution level, rainfall and the passage of time. Sci. Total Environ. 2014, 481, 360–369. [Google Scholar] [CrossRef]
  5. Mo, L.; Ma, Z.; Xu, Y.; Sun, F.; Lun, X.; Liu, X.; Chen, J.; Yu, X. Assessing the capacity of plant species to accumulate particulate matter in Beijing, China. PLoS ONE 2015, 10, 1–18. [Google Scholar] [CrossRef]
  6. Muhammad, S.; Wuyts, K.; Samson, R. Atmospheric net particle accumulation on 96 plant species with contrasting morphological and anatomical leaf characteristics in a common garden experiment. Atmos. Environ. 2019, 202, 328–344. [Google Scholar] [CrossRef]
  7. Popek, R.; Łukowski, A.; Grabowski, M. Influence of particulate matter accumulation on photosynthetic apparatus of Physocarpus opulifolius and Sorbaria sorbifolia. Polish J. Environ. Stud. 2018, 27, 2391–2396. [Google Scholar] [CrossRef]
  8. Kwon, K.J.; Urrintuya, O.; Kim, S.Y.; Yang, J.C.; Sung, J.W.; Park, B.J. Removal potential of particulate matter of 12 woody plant species for landscape planting. J. People Plants Environ. 2020, 23, 647–654. [Google Scholar] [CrossRef]
  9. Kwon, K.J.; Odsuren, U.; Kim, S.Y.; Yang, J.C.; Park, B.J. Comparison of the particulate matter removal capacity of 11 herbaceous landscape plants. J. People Plants Environ. 2021, 24, 267–275. [Google Scholar] [CrossRef]
  10. Singh, S.K.; Rao, D.N.; Agrawal, M.; Pandey, J.; Naryan, D. Air pollution tolerance index of plants. J. Environ. Manag. 1991, 32, 45–55. [Google Scholar] [CrossRef]
  11. Shannigrahi, A.S.; Fukushima, T.; Sharma, R.C. Anticipated air pollution tolerance of some plant species considered for green belt development in and around an industrial/urban area in India: An overview. Int. J. Environ. Stud. 2004, 61, 125–137. [Google Scholar] [CrossRef]
  12. Kong, W.S. The Biogeographic divisions of Korea and their species composition. J. Korean Geogr. Soc. 1989, 40, 43–54. [Google Scholar]
  13. Kim, Y.S.; Song, K.J.; Ahn, Y.H.; Oh, K.K.; Lee, K.J.; Lee, Y.M.; Jeong, S.J. Handbook of Korean Landscape Woody Plants, 3rd ed.; Kwangil Publishing Co.: Seoul, Korea, 2010; p. 564. [Google Scholar]
  14. Korea Meteorological Administration Weather Data Service. Available online: https://data.kma.go.kr (accessed on 3 August 2021).
  15. Chungcheonbuk-do Institute of Health and Environment. Available online: https://here.chungbuk.go.kr (accessed on 3 August 2021).
  16. Dzierzanowski, K.; Popek, R.; Gawrońska, H.; Saebø, A.; Gawroński, S.W. Deposition of particulate matter of different size fractions on leaf surfaces and in waxes of urban forest species. Int. J. Phytoremediation 2011, 13, 1037–1046. [Google Scholar] [CrossRef] [PubMed]
  17. Li, F.L.; Bao, W.K.; Wu, N. Effects of water stress on growth, dry matter allocation and water-use efficiency of a leguminous species. Sophora davidii. Agrofor. Syst. 2009, 77, 193–201. [Google Scholar] [CrossRef] [Green Version]
  18. Lichtenthaler, H.K. Chlorophylls and carotenoids: Pigments of photosynthetic biomembranes. Methods Enzymol. 1987, 148, 350–382. [Google Scholar] [CrossRef]
  19. Dinesh, B.; Yadav, B.; Reddy, R.D.; Padma, A.S.; Sukumaran, M.K. Determination of ascorbic acid content in some Indian spices. Int. J. Curr. Microbiol. App. Sci. 2015, 4, 864–868. [Google Scholar]
  20. Panda, L.R.L.; Aggarwal, R.K.; Bhardwaj, D.R. A review on air pollution tolerance index (APTI) and anticipated performance index (API). Curr. World Environ. 2018, 13, 55–65. [Google Scholar] [CrossRef] [Green Version]
  21. Kwak, M.J.; Lee, J.K.; Park, S.; Lim, Y.J.; Kim, H.; Kim, K.N.; Je, S.M.; Park, C.R.; Woo, S.Y. Evaluation of the importance of some East Asian tree species for refinement of air quality by estimating air pollution tolerance index, anticipated performance index, and air pollutant uptake. Sustainability 2020, 12, 3067. [Google Scholar] [CrossRef] [Green Version]
  22. Pandit, J.; Sharma, A.K. A Review of effects of air pollution on physical and biochemical characteristics of plants. Int. J. Chem. Stud. 2020, 8, 1684–1688. [Google Scholar] [CrossRef]
  23. Prajapati, S.K.; Tripathi, B.D. Anticipated performance index of some tree species considered for green belt development in and around an urban area: A case study of Varanasi city, India. J. Environ. Manag. 2008, 88, 1343–1349. [Google Scholar] [CrossRef]
  24. Zhang, W.; Wang, B.; Niu, X. Relationship between leaf surface characteristics and particle capturing capacities of different tree species in Beijing. Forests 2017, 8, 92. [Google Scholar] [CrossRef] [Green Version]
  25. Weerakkody, U.; Dover, J.W.; Mitchell, P.; Reiling, K. Quantification of the traffic-generated particulate matter capture by plant species in a living wall and evaluation of the important leaf characteristics. Sci. Total Environ. 2018, 635, 1012–1024. [Google Scholar] [CrossRef]
  26. Sæbø, A.; Borzan, Ž.; Ducatillion, C.; Hatzistathis, A.; Lagerström, T.; Supuka, J.; García-Valdecantos, J.L.; Rego, F.; Van Slycken, J. The selection of plant materials for street trees, park trees and urban woodland. In Urban Forests and Trees; Konijnendijk, C., Nilsson, K., Randrup, T., Schipperijn, J., Eds.; Springer: Berlin, Germany, 2005. [Google Scholar] [CrossRef]
  27. Kwak, M.J.; Lee, J.K.; Park, S.; Kim, H.; Lim, Y.J.; Lee, K.A.; Son, J.A.; Oh, C.Y.; Kim, I.; Woo, S.Y. Surface-based analysis of leaf microstructures for adsorbing and retaining capability of airborne particulate matter in ten woody species. Forests 2020, 11, 946. [Google Scholar] [CrossRef]
  28. Łukowski, A.; Popek, R.; Karolewski, P. Particulate matter on foliage of Betula pendula, Quercus robur, and Tilia cordata: Deposition and ecophysiology. Environ. Sci. Pollut. Res. 2020, 27, 10296–10307. [Google Scholar] [CrossRef] [Green Version]
  29. Lu, T.; Lin, X.; Chen, J.; Huang, D.; Li, M. Atmospheric particle retention capacity and photosynthetic responses of three common greening plant species under different pollution levels in Hangzhou. Glob. Ecol. Conserv. 2019, 20, e00783. [Google Scholar] [CrossRef]
  30. Kim, K.H.; Kabir, E.; Kabir, S. A review on the human health impact of airborne particulate matter. Environ. Int. 2015, 74, 136–143. [Google Scholar] [CrossRef] [PubMed]
  31. Niu, X.; Wang, B.; Wei, W. Response of the particulate matter capture ability to leaf age and pollution intensity. Environ. Sci. Pollut. Res. 2020, 27, 34258–34269. [Google Scholar] [CrossRef] [PubMed]
  32. Das, M.; Chatterjee, M.; Mukherjee, A. Air pollution tolerance index (APTI) used for assessing air quality to alleviate climate change: A review. Res. J. Pharm. Biol. Chem. Sci. 2018, 9, 45–54. [Google Scholar]
  33. Uka, U.N.; Belford, E.J.D.; Hogarh, J.N. Roadside air pollution in a tropical city: Physiological and biochemical response from trees. Bull. Natl. Res. Cent. 2019, 43. [Google Scholar] [CrossRef] [Green Version]
  34. Steubing, L.; Fangmeier, A.; Both, R.; Frankenfeld, M. Effects of SO2, NO2, and O3 on population development and morphological and physiological parameters of native herb layer species in a beech forest. Environ. Pollut. 1989, 58, 281–302. [Google Scholar] [CrossRef]
  35. Przybysz, A.; Popek, R.; Gawrońska, H.; Grab, K.; Łoskot, K.; Wrochna, M.; Gawroński, S.W. Efficiency of photosynthetic apparatus of plants grown in sites differing in level of particulate matter. Acta Sci. Pol. Hortorum Cultus 2014, 13, 17–30. [Google Scholar]
  36. Molnár, V.É.; Tőzsér, D.; Szabó, S.; Tóthmérész, B.; Simon, E. Use of leaves as bioindicator to assess air pollution based on composite proxy measure (APTI), dust amount and elemental concentration of metals. Plants 2020, 9, 1743. [Google Scholar] [CrossRef] [PubMed]
  37. Anake, W.U.; Eimanehi, J.E.; Omonhinmin, C.A. Evaluation of air pollution tolerance index and anticipated performance index of selected plant species. Indones. J. Chem. 2019, 19, 239–244. [Google Scholar] [CrossRef]
  38. Bharti, S.K.; Trivedi, A.; Kumar, N. Air pollution tolerance index of plants growing near an industrial site. Urban Clim. 2018, 24, 820–829. [Google Scholar] [CrossRef]
  39. Pathak, V.; Tripathi, B.D.; Mishra, V.K. Evaluation of anticipated performance index of some tree species for green belt development to mitigate traffic generated noise. Urban For. Urban Green. 2011, 10, 61–66. [Google Scholar] [CrossRef]
Figure 1. Photos of the 11 plant leaves selected for the study.
Atmosphere 12 01067 g001
Figure 2. Amount of PM accumulation of 11 different plant species. (A) Amount of wPM accumulation, (B) amount of sPM accumulation.
Atmosphere 12 01067 g002
Figure 3. Amount of EW on leaf in 11 different plant species. The lowercase alphabets in the graph are Duncan’s multiple range test. The different letters indicate significant differences (p < 0.05).
Atmosphere 12 01067 g003
Table 1. Characteristics of plants selected for this study.
SpeciesFamily NameHabitType
Juniperus chinensis L.CupressaceaeTreeEvergreen (needle-leaved)
Pinus parviflora Siebold & Zucc.PinaceaeTreeEvergreen (needle-leaved)
Pinus densiflora Siebold & Zucc.PinaceaeTreeEvergreen (needle-leaved)
Abies holophylla Maxim.PinaceaeTreeEvergreen (needle-leaved)
Picea abies (L.) H.Karst.PinaceaeTreeEvergreen (needle-leaved)
Pinus strobus L.PinaceaeTreeEvergreen (needle-leaved)
Aesculus turbinata BlumeHippocastanaceaeTreeDeciduous (broad-leaved)
Cercis chinensis BungeFabaceaeShrubDeciduous (broad-leaved)
Cornus officinalis Siebold & Zucc.CornaceaeTreeDeciduous (broad-leaved)
Acer triflorum Kom.AceraceaeTreeDeciduous (broad-leaved)
Ligustrum obtusifolium Siebold & Zucc.OleaceaeShrubDeciduous (broad-leaved)
Source: Kim et al. [13].
Table 2. Grades of plant based on APTI as well as biochemical parameters and socioeconomic importance.
Grading CharactersPattern of AssessmentGrade Allotted
ToleranceAPTI7.0–8.0+
8.1–10.0++
10.1–11.0+++
11.1–12.0+++
12.1–13.0+++++
MorphologicalPlant habitSmall
Medium+
Large++
Canopy structureSparse/irregular/globular
Spreading crown/open/semidense+
Spreading dense++
Type of plantDeciduous
Evergreen+
Laminar structureSizeSmall
Medium+
Large++
TextureSmooth
Coriaceous+
HardnessDelineate
Hardy+
Socio- economic Economic value<3 uses
3–4 uses+
5 or more uses++
Maximum grades scored by any plant = 16. Source: Shannigrahi et al. [11], Kwak et al. [21], and Aneke et al. [22].
Table 3. Rating used for API of plant species.
GradeScore (%)Assessment of Plant Speceis
0Up to 30Not recommended for plantation
131–40Very poor
241–50Poor
351–60Moderate
461–70Good
571–80Very good
681–90Excellent
791–100Best
Source: Pandit and Sharma [22] and Prajapati and Tripathi [23].
Table 4. APTI value and biochemical characteristics of 11 plant species.
Ascorbic Acid (mg g−1)Tchl (mg g−1)pHRWC (%)APTI
J. chinensis0.71 ± 0.07 e z0.10 ± 0.02 e5.11 ± 0.11 de73.48 ± 4.58 cd7.72 ± 0.47 e
P. parviflora1.70 ± 0.42 bc0.15 ± 0.03 cde4.98 ± 0.14 e79.03 ± 2.46 b8.77 ± 0.27 bc
P. densiflora1.91 ± 0.23 abc0.19 ± 0.03 a–d5.10 ± 0.08 e85.05 ± 3.54 a9.52 ± 0.31 a
A. holophylla2.38 ± 0.40 a0.14 ± 0.01 cde5.39 ± 0.04 c75.30 ± 1.99 bcd8.85 ± 0.30 b
P. abies1.43 ± 0.23 cd0.18 ± 0.02 bcde5.99 ± 0.17 a72.08 ± 1.71 de8.09 ± 0.05 de
P. strobus2.09 ± 0.20 ab0.12 ± 0.01 de4.15 ± 0.39 g72.32 ± 1.02 de8.12 ± 0.13 de
A. turbinata0.85 ± 0.06 e0.21 ± 0.04 abc5.35 ± 0.10 cd72.77 ± 1.13 de7.75 ± 0.14 e
C. chinensis1.04 ± 0.13 de0.27 ± 0.02 a5.34 ± 0.08 cd65.25 ± 1.00 f7.11 ± 0.12 f
C. officinalis1.14 ± 0.10 de0.19 ± 0.05 abcd5.69 ± 0.16 b72.79 ± 2.33 de7.95 ± 0.29 e
A. triflorum1.43 ± 0.40 cd0.24 ± 0.15 ab4.45 ± 0.12 f77.05 ± 3.21 bc8.38 ± 0.40 cd
L. obtusifolium1.47 ± 0.68 cd0.23 ± 0.02 abc5.07 ± 0.08 e69.22 ± 2.78 e7.70 ± 0.25 e
Significance**************
Tchl: total chlorophyll, pH: leaf pH, RWC: relative leaf water content, APTI: air pollution tolerance index. z Different letters in the same column indicate significant difference according to Duncan’s multiple rang test at p < 0.05. ** and *** indicate significance at p < 0.01, and p < 0.001, respectively.
Table 5. Pearson’s correlation analysis of sPM and wPM based on four biochemical characteristics and APTI of 11 plant species.
EWAscorbic AcidTchlpHRWCAPTI
sPM100.880 ***0.514 ***−0.329 *−0.538 ***0.2880.369 *
sPM2.50.844 ***0.511 ***−0.306 *−0.637 ***0.2840.355 *
wPM100.887 ***0.570 ***−0.384 *−0.548 ***0.1800.307 *
wPM2.50.681 ***0.423 **−0.272−0.469 **0.0630.164
EW: epicuticular wax, Tchl: total chlorophyll, pH: leaf pH, RWC: relative leaf water content, APTI: air pollution tolerance index. ns, *, **, and *** indicate no significance and significance at p < 0.05, p < 0.01, and p < 0.001, respectively.
Table 6. Evaluation of API values and biological and socioeconomic characteristics of 11 plant species.
APTIPlant HabitCanopy StructureType of PlantLeaf SizeTextureHardnessEconomic ValueTotal Grades% ScoreAPI ValueAssessment
J. chinensis++++++++850.02Poor
P. parviflora+++++++++956.33Moderate
P. densiflora++++++++++1062.54Good
A. holophylla+++++++++956.33Moderate
P. abies+++++++++956.33Moderate
P. strobus+++++++++956.33Moderate
A. turbinata+++++++++956.33Moderate
C. chinensis++++++637.51Very poor
C. officinalis+++318.80Not recommended
A. triflorum+++++++743.82Poor
L. obtusifolium++212.50Not recommended
Publisher’s Note: MDPI stays neutral with regard to jurisdictional claims in published maps and institutional affiliations.

