Article

Seasonal Variation of Radon Concentrations in Russian Residential High-Rise Buildings

by
Ilia Yarmoshenko
,
Georgy Malinovsky
,
Aleksey Vasilyev
and
Aleksandra Onishchenko
*
Institute of Industrial Ecology Ural Branch of the Russian Academy of Sciences, 620219 Ekaterinburg, Russia
*
Author to whom correspondence should be addressed.
Atmosphere 2021, 12(7), 930; https://doi.org/10.3390/atmos12070930
Submission received: 14 June 2021 / Revised: 6 July 2021 / Accepted: 16 July 2021 / Published: 20 July 2021
(This article belongs to the Special Issue Atmospheric Radon Measurements, Control, Mitigation and Management)

Abstract

:
Assessment of the annual radon concentration is often required in indoor radon surveys of territories and individual dwellings for comparison with reference levels, studying factors affecting radon accumulation in dwellings, assessment of exposure in epidemiological studies, etc. The indoor radon surveys were carried out in multistorey buildings in eight Russian cities using solid state nuclear track detectors with an exposure period of three months. For these surveys, the estimation of annual indoor radon concentration was required to compare radon levels in buildings of high- and low-energy-efficiency classes located in different cities. To develop approaches to seasonal normalization in high-rise buildings, long-term one-hour radon concentration series obtained applying radon-monitors in 20 flats were analyzed. The dependency of indoor radon concentration on the indoor–outdoor temperature difference was studied taking into account the known natural, technogenic and anthropogenic factors affecting radon levels. The developed model of seasonal variations in multistorey buildings includes winter, summer, and demi-season periods, which differ both in ventilation intensity and dependency of radon concentration on the temperature difference. The developed model allows to estimate annual radon concentration taking into account the actual distribution of outdoor temperatures during the exposure of the track detectors.

1. Introduction

The relevance of studying radon (222Rn) in indoor atmosphere is connected with findings on association of radon progeny inhalation with human health effects. Based on the review of uranium miners’ study, BEIR VI Committee [1] has proved that exposure to radon gas and its decay products causes lung cancer. A strong causal association between residential radon exposure and lung cancer mortality is supported by pooled analysis of case control studies performed in Europe and North America [2,3]. A combined evaluation of estimates of residential case control studies meta-analysis and geographically aggregated data on lung cancer mortality and average indoor radon concentration yielded an excess risk of lung cancer of about 14% (90% CI: 0.10–0.18) per radon concentration 100 Bq/m3 linked to an exposure period of 25–30 years [4]. The health risk assessment has demonstrated that radon is the second cause of cancer after smoking [1,5]. According to a special study of the Lancet journal, radon is ranked as the fifth environmental risk factor for human health in 2019 [6].
With regard to the ICRP [7,8] and WHO [9] recommendations, the IAEA has developed a strategy for protecting humans against indoor radon [10]. In particular, ICRP recommended to establish national indoor radon concentration reference levels in the range from 100 to 300 Bq/m3 [8]. Protection of the population in the situation of exposure to radon in buildings requires reliable information on levels of indoor radon concentration. National, regional, and single home surveys with direct measurements of indoor radon concentration provide the basis for future decisions on control over the public exposure due to radon [8,10]. Radon surveys estimate the population radon exposure, identify radon-prone areas, and assess compliance with the reference level.
As it was shown in a number of studies in various countries, indoor radon concentrations typically vary with the seasons [11,12,13,14,15,16,17,18,19,20,21,22,23]. Higher indoor radon concentration in winter than in summer in the majority of houses is the general observation of radon seasonal variation studies in various countries with temperate climate [11,15,24,25,26,27,28]. Daraktchieva et al. [29] consider such pattern of seasonal variation as a normal seasonality of indoor radon.
Seasonal variations of indoor radon concentration are mainly affected by relationship between diffusion and advection radon entry mechanisms, and dependency of ventilation rate and ventilation practice on climatic conditions. As shown by Arvela [30], in low-rise residential houses with natural ventilation, where the pressure difference-driven radon flow from soil is the dominant radon source, winter concentrations are normally higher than summer concentrations. Bossew et al. [15] consider the tendency to open windows in summer and keep them closed in winter, which leads to higher indoor accumulation of geogenic radon in winter. The normal seasonality is also observed in temperate and continental climate countries when radon diffusion from building materials is the dominant source of radon entry and the “normal” ventilation is plasticized [31,32]. Model of radon entry and accumulation in multi-flat buildings developed by Yarmoshenko et al. [33] for Russian climatic conditions predicts deviation from the normal seasonality in flats where low ventilation frequency is maintained. A wide range of magnitudes of seasonal variation between homes caused by variability of influencing factors is emphasized in many studies [18,19,20].
Seasonality of indoor radon concentration has to be considered for planning and analyzing the radon survey results. To know the annual average radon concentrations, measurements ideally should be made over a total period of twelve consecutive months. However, the measurements taken over the course of an entire year are impractical because of a long delay for the results and other reasons. Shorter exposure periods (typically three months) are widely used and included to indoor radon survey protocols in many countries [26,27,34,35,36,37]. In the case of the shorter duration of measurements some efforts have to be made to estimate the annual radon concentrations.
The most common approach for season normalization is application of seasonal correction factors estimated by results of special study. The seasonal correction factors allow estimates of the annual mean radon concentrations in homes surveyed over several months by multiplying the measured value with the appropriate empirically determined factor. In the UK, seasonal correction factors were first derived by Wrixon et al. [24] and lately updated with estimation depending on the starting month and the measurement period [19,34]. A more simplified approach consists in estimating the winter/summer ratios, which is appropriate if integrated measurements are conducted during six months [38,39,40] or one season; usually winter or the heating period is recommended for radon surveys [12,22]. Tsapalov et al. [22] proposed to assess the compliance with reference level taking to account the uncertainty of annual average radon concentration estimation depending on the measurement duration. In some studies, only a moderate variation of seasonal radon averages from the annual average was found for measurements with duration of three or more months and season normalization was not applied [37,41,42,43]. However annual average radon concentration is required for various purposes, in particular, studying the influence of geogenic and anthropogenic factors on indoor radon concentration.
Further investigation of radon seasonal variations is relevant for various combinations of radon sources and entry driving forces (diffusion and advection, soil, and building materials etc.,), climate, and living habits. In particular, there are only a few studies of the radon seasonal variations where multistorey houses (mostly below 5 storeys) were included in the consideration [15,30,38].
Multi-flat middle- and high-rise buildings are common in Russian cities and modern trends are such that more than 2/3 of the houses under construction are multistorey. From the radiation protection point of view the attention to the new high-rise houses is especially attracted due to energy-saving measures implemented in modern building construction [44]. In buildings of high-energy-efficiency classes, the conditions are provided for lower air exchange rate and higher indoor radon accumulation [45]. In previous studies in Ekaterinburg, large city in the Urals region of Russia, application of radon-monitors with obtaining long-term, up to six months, radon series demonstrated great advantages for researching indoor radon accumulation in high-rise buildings. In particular the role of building materials as a source of indoor radon at high storeys was revealed [46]. Important information on ventilation patterns was obtained as well [31,47].
In this study, the long-term radon series together with data of integrated measurements were analyzed to study the seasonal variations of radon concentration and develop approaches to seasonal normalization in multistorey buildings.

2. Materials and Methods

2.1. Available Data on Radon Temporal Variation

The following data were used as experimental material to study the temporal and seasonal variations of radon concentration in multistorey buildings:
  • Radon series with duration of more than two months, obtained in flats of multistorey buildings under normal operation (applying radon monitors);
  • Results of a survey in a sample of flats in multistorey buildings in Chelyabinsk carried out in two seasons (applying solid-state nuclear track detectors);
  • Results of a survey of flats in a multistorey building in Ekaterinburg, carried out in two seasons (applying solid-state nuclear track detectors).
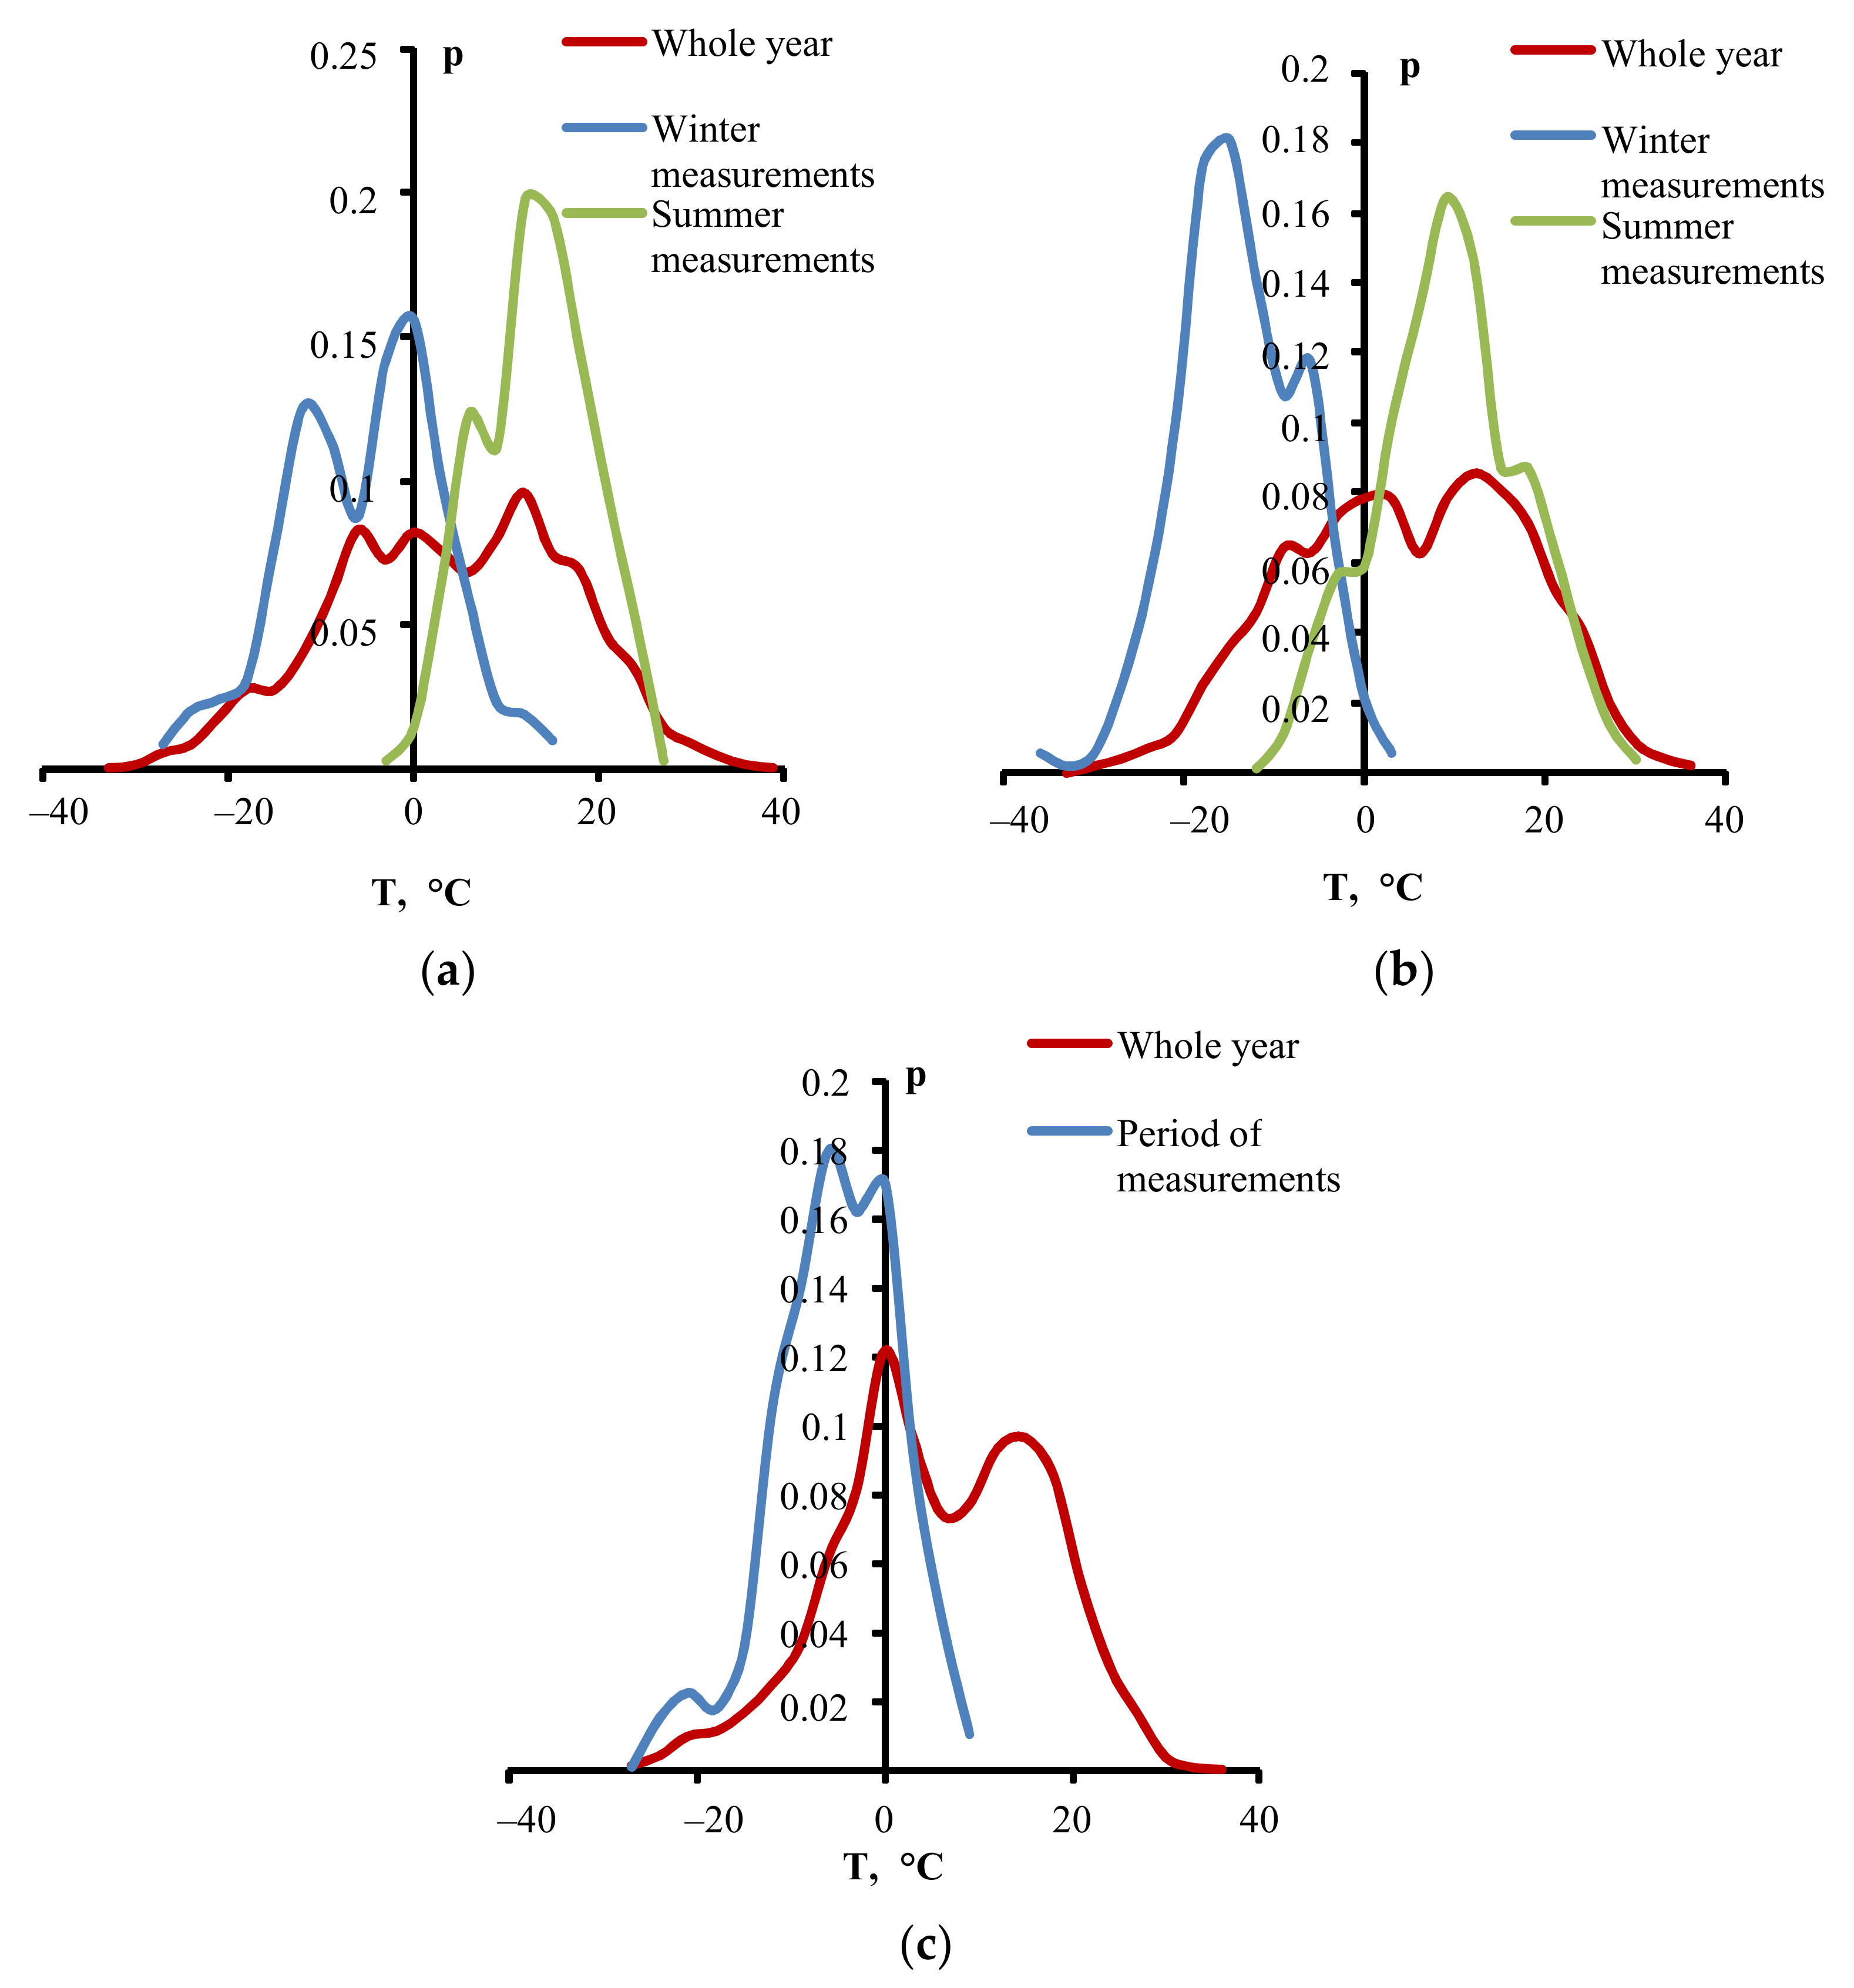
Radon series measurements were performed in flats of staff of Institute of Industrial Ecology and their relatives, and colleagues from other cities. Two-season radon measurements were conducted in the flats of some participants of the large radon survey, earlier performed in Chelyabinsk [44]. The detailed indoor radon study in the multistorey building in Ekaterinburg was previously described by Vasilyev et al. [48]; the flats, where both winter and summer three-months measurements were performed, are included in this study.
Long-term serial one-hour measurements of radon concentration were performed using four AlphaGuard PQ2000Pro radon monitors (SAPHYMO GmbH, Germany), which were calibrated regularly using a NIST calibration source (SRM 4973–16). The characteristics of the flats in which the measurements were carried out are presented in the Table 1. Most of the measurements were carried out in Ekaterinburg, while single series were obtained in St. Petersburg and Chelyabinsk. The Figure 1 shows the duration of the series using the atmospheric temperature scale during the measurement period. The series included in this analysis cover temperature ranges between highest and lowest outdoor temperatures from 20 to 50 °C. Most of these series were previously used in studies of factors influencing the radon entry and accumulation in multistorey buildings [31]. This analysis also includes series that were not previously considered in the mentioned studies due to the low radon concentration and the inability to determine the intervals of controlled and uncontrolled air exchange. Some of the measurements were intentionally carried out in flats of high-energy-efficiency buildings built over the past 10 years. High energy efficiency of a multistorey building was determined taking into account such characteristics as the type of building structure, low permeability of the building envelope, double glazing windows, balcony glazing, and others [44].
The results of serial measurements of radon concentration were used to assess the dependence of radon concentration on atmospheric temperature. For these purposes average radon concentrations were estimated in 3 °C outdoor temperatures intervals for each radon series.
Integrated measurements in Chelyabinsk were carried out in a sample of ten multistorey flat buildings in the periods of August–November 2019 and November 2020–January 2021. The houses in which the measurements were made belong to different types of building structure. The survey results are presented in Table 2. As can be seen from the table, the winter radon concentrations, on average, are more than two times higher than those obtained in the warmer period of the year. The coefficient of seasonal variation in 10 flats varied significantly from 1.44 to 3.51.
The integrated measurements in flats in the multistorey building in Ekaterinburg were carried out in 2017. Twenty three flats were examined in two seasons, which was 23% of all flats in the building. The object was built in 2012 using monolithic concrete, with a low permeability of the shell and other solutions that provide a high class of energy efficiency. The data obtained at this object were previously reported in [47,48]. In particular, there was no significant tendency to radon concentration falling off with a height for flats above ground floor [48]. The average results of radon concentration measurements in the building are presented in Table 3. On average, radon concentrations in cold and warm seasons differ more than 1.5–1.6 times. In 26% of flats, the seasonal coefficient was in the range 0.96–1.1, that can be considered as low seasonal variations. As shown in the study [47,48], the variability of indoor radon concentrations and seasonality in this sample of flats are associated with different ventilation habits of dwellers.
The results of radon concentration-integrated measurements in two seasons in Chelyabinsk and Ekaterinburg were used to verify the model dependences of radon concentration on outdoor temperature.
Application of the developed model of temperature seasonal normalization is demonstrated in the example of a radon survey in Nizhny Novgorod. The survey is a continuation of the study Yarmoshenko et al. [44] with application of the same approach to sample formation and indoor radon measurements. The characteristics of the sample of flats and the results obtained are presented in the Table 4.
Radon concentration measurements in Ekaterinburg, Chelyabinsk, and Nizhny Novgorod were carried out using solid-state nuclear track detectors RSKS type provided by Radosys [49]. To support the quality of measurements, RSKS detectors were calibrated both by the producer and within the framework of internal laboratory control of the Institute of Industrial Ecology using a system similar to that described by Mostafa et al. [50] placing RSKS detectors in a radon chamber with AlphaGuard PQ2000Pro. The detection limit for RSKS detectors for three-months exposure is defined as 5 Bq/m3.

2.2. Climate

In this study, data obtained in four cities of Russia located in different terrestrial and climatic zones were used. The main climatic characteristics are presented in the Table 5 and in Figure 2. The cities of Ekaterinburg and Chelyabinsk are located in a zone of continental climate, which is characterized by a significant difference between summer and winter temperatures. St. Petersburg is located on the shores of the Gulf of Finland of the Baltic Sea; seasonal variations of temperature and other climate parameters are more moderate in this city. Nizhny Novgorod is located in the center of the European part of Russia, which is the most populated Russian region. Therefore, Nizhny Novgorod can be considered the most typical Russian city in terms of climate.
Atmosphere temperature distributions in Ekaterinburg, Chelyabinsk, and Nizhny Novgorod are presented in Figure 3 according to the data of meteorological stations located in these cities (www.rp5.ru, accessed on 10 June 2021). The distributions of outdoor temperature are estimated for the whole year and the period of measurements performed in respective cities. The temperature distributions were used for temperature normalization of three-months indoor radon concentration measurements.

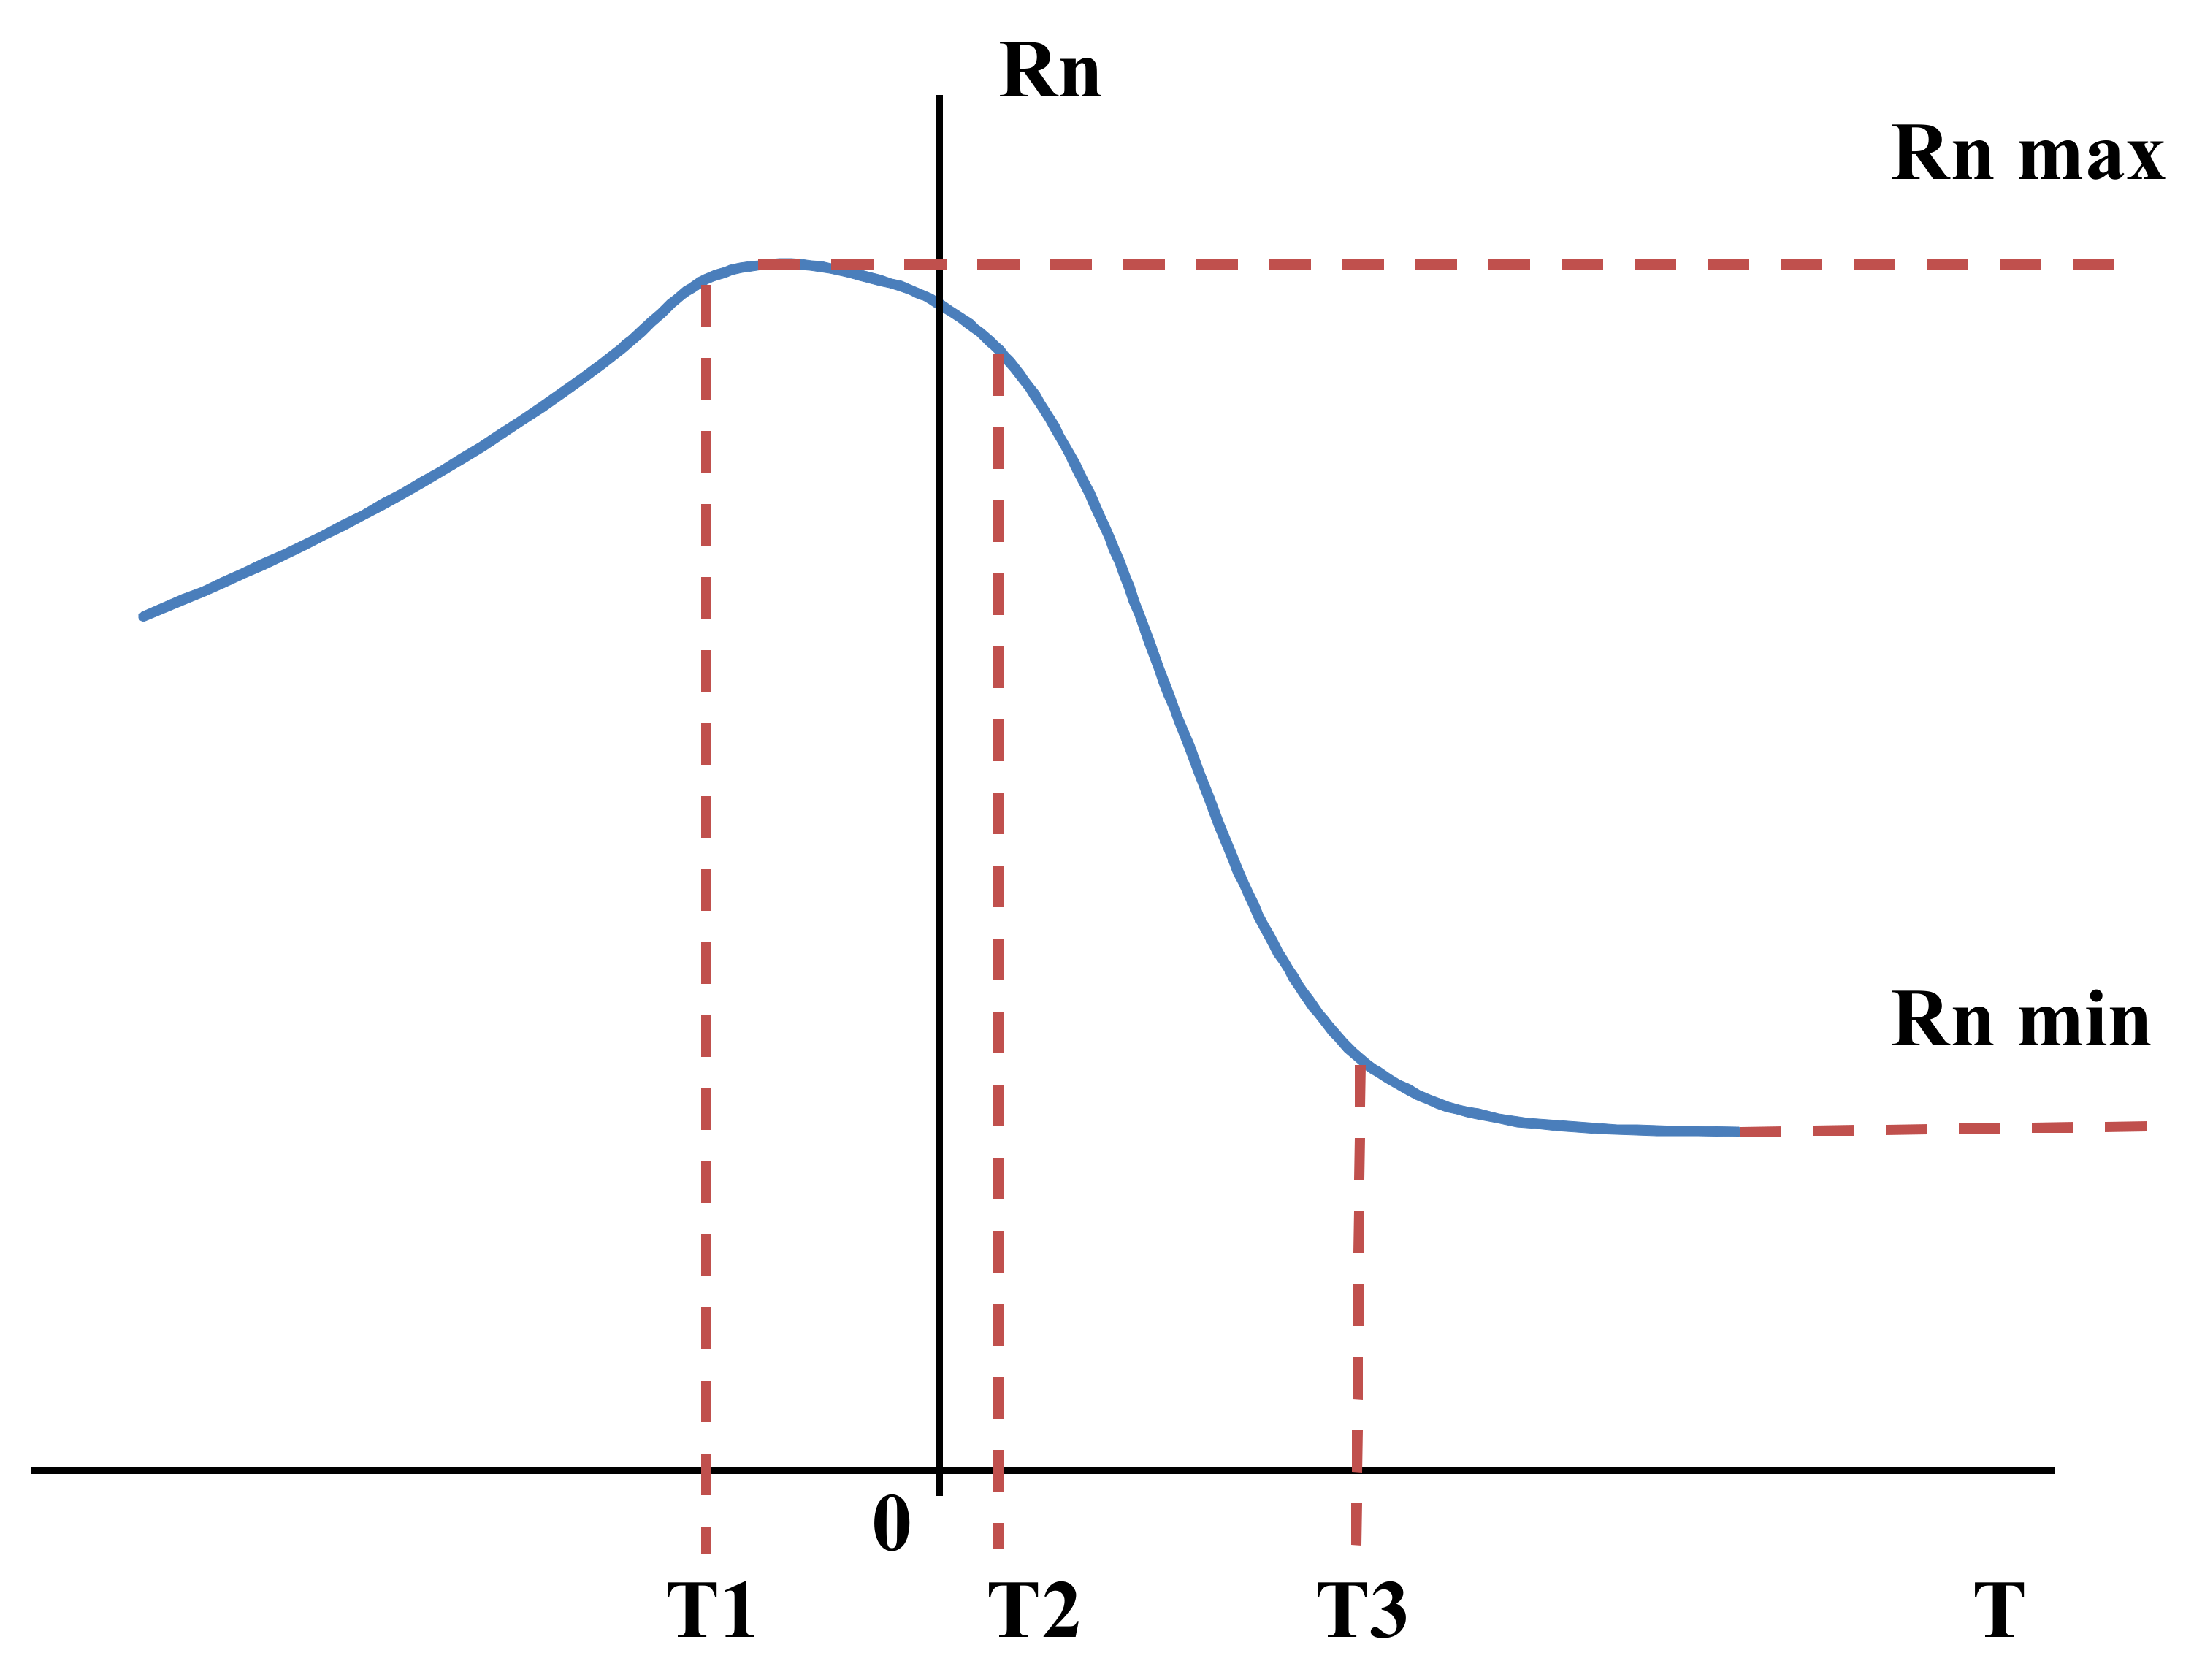
2.3. Seasonal Variation Model

When constructing a model of the dependence of radon concentration on the outdoor temperature, a basic physical model of radon entry into a flat in a multistorey building was used, whose separate parts are described in the previous studies [31,33,47]. The model is based on a theoretical concept of the mechanisms of indoor radon entry appeared in the 1980s and 1990s when the scientific community developed a general strategy on protection against indoor radon [51,52,53]. The key points of the model are as follows.
  • The main mechanism of the radon entry into flats in multistorey buildings is diffusion from building materials. The main characteristic of the building material, which determines the rate of diffusion of radon entry, is the Ra–226 concentration. The variability of this characteristic within a large country like Russia can be quite significant. At the same time, the variability of other characteristics of the building materials that determine the diffusion is less significant.
  • The main mechanism limiting the accumulation of radon is the ventilation of the building. There are two main modes of ventilation in a building: controlled and uncontrolled. In uncontrolled mode, all ventilation devices are closed and inactivated, while the air exchange rate (AER) depends on the permeability of the building envelope and the temperature difference. The controlled mode involves opening windows or turning on mechanical ventilation systems in order to achieve the AER desired by residents. The physical model describing ventilation takes into account the leakage area, temperature differences, and the frequency and duration of controlled ventilation [54,55].
  • In continental climate during cold winter, below certain negative temperatures, controlled ventilation stops. As the outdoor temperature rises, the frequency and ventilation duration gradually increases. At summer temperatures, the ventilation frequency is maximum. At the same time, the temperature difference in the summer period is close to zero, so the AER is mainly determined by the wind pressure.
  • In large multistorey buildings, there may be radon flow between the rooms of the building, caused by pressure differences. As a result, advective transport of radon from the non-living spaces with low air exchange to living rooms can be observed.
  • From the point of view of radon concentration modeling, modern buildings of a high-energy-efficiency class have a lower AER in an uncontrolled mode.
Taking into account the above theoretical considerations, a model of the dependence of radon concentration in a multistorey building on the outdoor air temperature is suggested (Figure 4). The temperature dependence of radon concentration differs for three temperature ranges. At low temperatures (T < T1), radon concentration is determined by the AER in an uncontrolled mode, which depends on the temperature difference [33,54,55]:
AER = k leak ( T ind T ) 2 / 3
where kleak is the temperature-independent leakage coefficient, Tind and T are the air temperatures indoor and outside the building, respectively.
At T = T1, the maximum radon concentration is achieved due to the lowest AER for the entire period when air exchange occurs in an uncontrolled mode only. At high temperatures T > T3, the minimum radon concentration, Rnmin, is achieved due to the maximum frequency and duration of ventilation. One of the factors determining the value of Rnmin is the radon concentration in the atmosphere.
In the intermediate temperature range (spring/autumn), there is a gradual change in the frequency and duration of ventilation in the controlled mode, which increase with outdoor temperature. To describe the behavior of radon concentration in this range, the following equation is used:
Rn T = Rn max Rn min 1 + exp 4.394 T 3 T 2 T out T 3 + T 2 2 + Rn min ,
where 4.394 is the normalizing factor at which the conditions Rn (T2) = 0.9 (Rnmax − Rnmin) + Rnmin and Rn (T3) = 0.1 (Rnmax − Rnmin) + Rnmin are met.
Taking into account the previous studies, some values were accepted for the model parameters included in Equation (1) (Table 6). To move from a descriptive model to a physical one, it is necessary to determine the relationship between Rnmin, radon in the atmosphere, and the AER. As shown in Table 6, taking into account that in the summer period the air temperature can be quite high, in this study it is assumed that AER (T3) = 1 h−1 (taking into account the air exchange is partly associated with the wind pressure).

2.4. Temperature Normalization

To carry out temperature normalization of seasonal radon concentrations, the model dependence Rn (T) and the observed temperature frequency distributions during the year P (T) and during the measurement period Pm (T) are taken into account. For simplicity, discrete values of functions Rn (Ti), P (Ti), and Pm (Ti) are accepted for temperature values Ti = −33, −30 … 0 … + 30, + 33 °C.
The radon concentration, which is expected to be obtained during the measurement period with known temperature frequency distribution, is equal to:
RnEXP = i Rn mod T i , m · P m T i ,
where Rnmod (Ti, {m}) is radon concentration at temperature Ti, calculated by the model, {m} is a set of model parameters.
The set of parameters {M} appropriate for describing the dependence of radon concentration on outdoor temperature in a certain room was obtained using the condition:
RnOBS = RnEXP,
where RnOBS is the measured radon concentration.
Additional boundary conditions, assumptions and approximations can also be taken into account to choose some of the model parameters.
After the function Rnmod (Ti, {M}) is determined, the annual average radon concentration is calculated using the equation:
Rn an = i Rn mod T i , M · P T i ,
where Rnan is the annual average radon concentration.
Seasonal correction factors can be estimated for regions with certain function P (T). For example, for the three-months integrated radon concentration measurements, 12 values can be calculated for each months of the measurement starting, by a manner similar to that implemented in the UK [19,34]. If the temperature distribution over the measurement period starting in j-th month is described by Pmj (Ti), then the expected radon concentration for a measurement period of three months RnEXPj is defined by equation:
RnEXP j = i Rn mod T i · P mj T i
and the seasonal correction factor kj is equal to the ratio:
kj = Rn an RnEXP j

3. Results

3.1. Estimating the Parameters of The Descriptive Model

The results of the fitting of the parameters of the model dependence of radon concentration on temperature according to the analysis of the radon concentration time series in flats of multistorey buildings are presented in Table 7.
For 20 series, the correlation coefficient between the observed radon concentration and the fitted model values is in the range from 0.75 to 0.99. Two series were too short in temperature range and were excluded from further analysis. The coverage of the temperature range during the monitoring measurements made it possible to determine the full set of parameters (T1, T2, T3, Rnmin, Rnmax) describing seasonal variations in 10 flats. In 14 flats, sufficiently long series were obtained to determine all the parameters except the temperature T1. In all 20 series included in further analysis, the parameters T2 and Rnmax were determined.
The analysis of the obtained time series and the fitted parameters of the model made it possible to distinguish two main patterns and several subtypes of seasonal variations. The identified patterns and subtypes are schematically shown in Figure 5. The first type of seasonal variation includes flats in which the radon concentration is higher in the cold period than in the warm one (pattern A, including subtypes A1–A3). Subtypes A1–A3 differ in either temperature T2 or Rnmin parameters. In flats assigned to subgroup A1, the radon concentration Rnmin was found corresponding to the radon entry from building materials aD, taking into account the radon concentration in the atmosphere. In subgroup A2, Rnmin exceeds the value that can be expected under diffusion entry domination. In subgroup A3, there is a significant shift in temperature T2 to higher values. Pattern B includes the cases when radon concentration in summer is higher than in winter, which, within the framework of a descriptive model, can be described by assigning a value above 5 °C (5 °C and 10 °C in our examples) to parameter T1.
The following number of flats belonged to the indicated patterns and subgroups:
Pattern A—18 flats (90%) including:
  • Subgroup A1—8 flats (40%),
  • Subgroup A2—6 flats (30%),
  • Subgroup A3—4 flats (20%).
Pattern B—2 flats (10%).
For subgroups A1 and A2, which together make up 70% of flats, the overall average is T2 = −1.1 C.
Thus, for the flats of the most common type, the following rounded temperature parameters of the seasonal variation model can be accepted: T1 = −5 °C, T2 = −1 °C, T3 = 15 °C.

3.2. Verification of the Model

To verify the obtained model of seasonal variations, independent radon survey data in two samples of flats, carried out in the summer and winter periods of the year were used. For each sample of seasonal data, the model parameters Rnmax and Rnmin were estimated, at which the average annual radon concentration, estimated based on summer and winter measurements, are equal (Table 8). The table also shows the values of the radon diffusion entry rate from building materials aD. As it can be seen in Table 8, the values of Rnmax and Rnmin obtained for the flat building in Ekaterinburg generally correspond to those observed in other buildings for which there is a series of measurements (Table 7).
For Chelyabinsk, a negative value of radon concentration was obtained, that has no objective meaning. It can be assumed that the negative value is the result of an error in the radon measurement, high sampling heterogeneity, and other reasons. Taking into account the known factors affecting the radon entry and accumulation, the minimum radon concentration is derived by the entry from building materials (aD) and the dilution with atmospheric air with a certain radon content at the AER taken equal to 1 h−1. If more justified Rnmin is accepted, then different average annual radon concentrations are estimated applying summer and winter measurements: 34 and 44 Bq/m3, respectively. The relative deviations of the values calculated in this way from that obtained in the descriptive model are 10% and 16%.
For the building in Ekaterinburg, a relatively high Rnmin value is observed. With the corresponding parameters aD, AER = 1 h−1 and radon concentration in the atmosphere of 5 Bq/m3, in order to achieve Rnmin = 108 Bq/m3, it is necessary to take an additional entry equal to about 80 Bq/ (m3 h). As shown in the study of indoor radon temporal variations in multistorey buildings [31], this entry may be associated with advective flows inside the building from service premises with low air exchange to living rooms. High advective entry due to flows between different parts of a house can be observed in buildings with low air exchange in uncontrolled mode and high Ra−226 content in building materials [46]. A high Rnmax value is an indicator of the presence of a significant advective redistribution of air with a high radon content between the parts of a building. In Chelyabinsk buildings, there are no conditions for the formation of such entry.

3.3. Example of Applying Seasonal Normalization in Nizhny Novgorod

Table 9 shows the calculation of the average annual radon concentration in a sample of buildings in Nizhny Novgorod, taking into account the results of measuring radon concentration during three months starting in November. The table shows the observed temperature distributions during the year, calculated from the archived observational data for two years from 7 April 2019 to 6 April 2021, and the distributions of temperatures during the exposure period (from 24 October 2020 to 4 February 2021). The parameters of the model of radon concentration seasonal variations for Nizhny Novgorod were selected taking into account the requirement (4) such as: Rnmin = 8.6 Bq/m3, Rnmax = 40 Bq/m3, aD = 3.6 Bq/ (m3 h). After seasonal normalization, the average annual radon concentration for a sample of flats in multistorey buildings in Nizhny Novgorod was estimated as 23 Bq/m3.
For the climatic conditions of the city of Nizhny Novgorod, seasonal correction factors were estimated using Equation (7) for calculating the average annual radon concentration based on three-months measurements using integrated methods (Figure 6). For comparison, the figure also shows the data obtained for the UK [34]. As can be seen in the figure, the range of seasonal correction factors in the Russian city is higher, which is apparently associated with greater temperature variation, including higher temperatures in summer and lower in winter. On the whole, the character of the seasonal variations obtained in Russia and Great Britain is consistent.

4. Discussion

This paper presents the model of seasonal variations of radon concentration in flats of multistorey buildings based on the results of analysis of radon concentration long-term one-hour series obtained using radon monitors. The developed model makes it possible to use an approach for assessing the average annual radon concentration based on the temperature normalization. Temperature normalization has certain advantages over other methods, as shown in [19,34], which are easily realizable with the availability of electronic weather archives.
The analysis of radon series gained clear and physically understandable dependence of radon concentration on the atmosphere temperature. When air exchange is maintained at a level corresponding to comfortable microclimate for most people, radon concentration in flats is higher in winter than in summer. This character of seasonal variations in radon concentration in multistorey buildings corresponds to the predominant radon entry from building materials. The parameters of the temperature dependence of radon concentration in general do not depend on the climatic conditions within the zones of continental climates, in which cold winters and warm summers occur. The T1 parameter determines the temperature below which the vents in dwellings either do not open at all, or open slightly for a few minutes. Under these conditions, the use of a simple model is justified, in which radon concentration is proportional to indoor outdoor temperature difference. As shown in this paper, on average, this temperature T1= −5 °C. The middle of the demi-season interval T2–T3 is approximately 7 °C, which corresponds to the end of the heating season. The average daily temperature of 8 °C is the value at which local government regulatory decision to turn off the municipal central heating system is issued in Russia. At a temperature above T3, which, according to this study, is approximately 15 °C, in flats of multistorey buildings the frequency and duration of ventilation approach maximum values. The adopted parameters of seasonal variations depend on the preferences of residents about a comfortable temperature in dwellings and the norms for regulating the heating season that are the same for the whole of Russia, therefore, the presented model of seasonal variations can be used throughout Russia.
A life style in which ventilation remains at a low level in the summer and radon concentration in the warm period may be higher than in the cold one is not typical (pattern B). Therefore, a model that takes into account the more common preferences on ventilation during a warm period (pattern A) can be accepted to describe the average seasonal variations in large randomized samples of buildings.
Less significant deviations from the typical character of the dependence of radon concentration on temperature may be associated with other features of the life style or living habits. In the available sample of flats, in which measurements of long-term series of radon concentrations were carried out, there was a relative increase of the parameter T2 in every fifth flat. This parameter shows the ambient air temperature at which the transition between winter and demi-season ventilation modes occurs. It can be assumed that at temperatures above −1 °C, residents of these flats prefer to control the indoor air temperature by adjusting a heating system. Currently, only small parts of buildings are equipped with the technical ability to regulate the temperature of the heating batteries in Russia. Therefore, in the future, with a greater prevalence of energy-saving systems in buildings, the typical value of T2 parameter in the seasonal model may increase.
The applicability of the proposed model of radon seasonal variations is shown in flats of multistorey buildings with the results of radon concentration measurements by integrated methods. The discrepancies that were obtained with the results of the survey of a sample of ten flats in Chelyabinsk are insignificant. Using the example of energy-efficient multistorey building in Ekaterinburg, it was shown that taking into account the features of the advective transport of radon inside the building, full consistency of the model and observed results can be obtained.
The developed model of seasonal variations and the corresponding approach to the temperature normalization of radon concentration measurements in flats of multistorey buildings in Russia are generally consistent with the approaches developed in other studies [12,15,19,25]. The nature of seasonal variations is common for most countries, in which the seasons are defined as warm and cold (with dedicated heating period).
The proposed approach to the seasonal normalization of radon concentrations is planned to be used in the future to analyze the results of radon study in buildings of various types in large Russian cities [44]. This study aims to determine the effect of a building’s energy efficiency on radon accumulation and compare radon levels in buildings located in different regions. Given that more than 80% of the Russian population of large urbanized region lives in multistorey buildings, this model can be applied to randomized samples surveyed in such cities.

5. Conclusions

The main conclusions of the study are as follow:
  • Indoor radon seasonal variation can be described taking into account the natural, technogenic, and anthropogenic factors affecting the radon levels.
  • The model indoor radon seasonal variation developed for the situation of radon entry from building materials in multistorey buildings associates the seasonal radon concentration to frequency and duration of controlled ventilation. For continental climate, the radon temperature dependence can be typically modeled using three temperatures which determine periods of different ventilation pattern as follow: summer ventilation pattern at outdoor temperature above 15 °C, demi-season ventilation at outdoor temperature between 15 and −1 °C, total insulation with temperature below −5 °C.
  • Estimation of the annual average indoor radon concentration using the results of the integrated radon measurements during period shorter than twelve months using the developed model is performed by comparing the frequency distributions of atmospheric temperature during the period and a whole year.
  • Developed model of indoor radon seasonal variations allows the temperature normalization to estimate average annual radon concentration obtained in the radon surveys in Russian cities in continental climate zones.

Author Contributions

Conceptualization, I.Y., G.M., A.V., A.O.; methodology, I.Y.; formal analysis, G.M.; investigation, I.Y. and G.M.; resources, A.O.; data curation, A.O.; writing—I.Y. and G.M.; writing—review and editing, I.Y., G.M., A.V., A.O.; visualization, G.M.; supervision, I.Y. All authors have read and agreed to the published version of the manuscript.

Funding

The study was supported by Russian Science Foundation (grant No. 19-19-00191).

Institutional Review Board Statement

Not applicable.

Informed Consent Statement

Not applicable.

Data Availability Statement

Not applicable.

Conflicts of Interest

The authors declare no conflict of interest.

References

  1. Committee on Health Risks of Exposure to Radon (BEIR VI). Health Effects of Exposure To Radon; Academy Press: Washington, DC, USA, 1999. [Google Scholar]
  2. Darby, S.; Hill, D.; Auvinen, A.; Barros-Dios, J.M.; Baysson, H.; Bochicchio, F.; Deo, H.; Falk, R.; Forastiere, F.; Hakama, M.; et al. Radon in Homes and Risk of Lung Cancer: Collaborative Analysis of Individual Data from 13 European Case-Control Studies. BMJ 2004, 330, 223. [Google Scholar] [CrossRef] [Green Version]
  3. Krewski, D.; Lubin, J.H.; Zielinski, J.M.; Alavanja, M.; Catalan, V.S.; Field, R.W.; Klotz, J.B.; Létourneau, E.G.; Lynch, C.F.; Lyon, J.I.; et al. Residential Radon and Risk of Lung Cancer. Epidemiology 2005, 16, 137–145. [Google Scholar] [CrossRef]
  4. Yarmoshenko, I.V.; Malinovsky, G.P. Combined Analysis of Onco-Epidemiological Studies of the Relationship between Lung Cancer and Indoor Radon Exposure. Nukleonika 2020, 65, 83–88. [Google Scholar] [CrossRef]
  5. Hunter, N.; Muirhead, C.R.; Bochicchio, F.; Haylock, R.G.E. Calculation of Lifetime Lung Cancer Risks Associated with Radon Exposure, Based on Various Models and Exposure Scenarios. J. Radiol. Prot. 2015, 35, 539–555. [Google Scholar] [CrossRef] [PubMed] [Green Version]
  6. GBD 2019 Risk Factors Collaborators. Global Burden of 87 Risk Factors in 204 Countries and Territories, 1990–2019: A Systematic Analysis for the Global Burden of Disease Study 2019. Lancet 2020, 396, 1223–1249. [Google Scholar] [CrossRef]
  7. ICRP. Lung Cancer Risk from Radon and Progeny and Statement on Radon; ICRP Publication: London, UK, 2010. [Google Scholar]
  8. ICRP. Radiological Protection against Radon Exposure; ICRP Publication: London, UK, 2014. [Google Scholar]
  9. WHO. Handbook on Indoor Radon: A Public Health Perspective; WHO Press: Geneva, Switzerland, 2009. [Google Scholar]
  10. IAEA. SSG-32. Specific Safety Guide. In Protection of the Public against Exposure Indoors due to Radon and Other Natural Sources of Radiation; IAEA: Vienna, Austria, 2015; p. 112. Available online: https://www.iaea.org/publications/10671/protection-of-the-public-against-exposure-indoors-due-to-radon-and-other-natural-sources-of-radiation (accessed on 10 June 2021).
  11. Pinel, J.; Fearn, T.; Darby, S.C.; Miles, J.C.H. Seasonal correction factors for indoor radon measurements in the United-Kingdom. Radiat. Prot. Dosim. 1995, 58, 127–132. [Google Scholar]
  12. Arvela, H. Review of Seasonal Variation in Residential Indoor Radon Concentrations. In Radioactivity in the Environment; Elsevier: Amsterdam, The Netherlands, 2005; pp. 612–617. [Google Scholar] [CrossRef]
  13. Baysson, H.; Billon, S.; Laurier, D.; Rogel, A.; Tirmarche, M. Seasonal Correction Factors for Estimating Radon Exposure in Dwellings in France. Radiat. Prot. Dosim. 2003, 104, 245–252. [Google Scholar] [CrossRef]
  14. Krewski, D.; Mallick, R.; Zielinski, J.M.; Létourneau, E.G. Modeling Seasonal Variation in Indoor Radon Concentrations. J Expo. Sci. Environ. Epidemiol. 2004, 15, 234–243. [Google Scholar] [CrossRef]
  15. Bossew, P.; Lettner, H. Investigations on Indoor Radon in Austria, Part 1: Seasonality of Indoor Radon Concentration. J. Environ. Radioact. 2007, 98, 329–345. [Google Scholar] [CrossRef] [PubMed]
  16. Denman, A.R.; Crockett, R.G.M.; Groves-Kirkby, C.J.; Phillips, P.S.; Gillmore, G.K.; Woolridge, A.C. The Value of Seasonal Correction Factors in Assessing the Health Risk from Domestic Radon—A Case Study in Northamptonshire, UK. Environ. Int. 2007, 33, 34–44. [Google Scholar] [CrossRef]
  17. Burke, Ó.; Long, S.; Murphy, P.; Organo, C.; Fenton, D.; Colgan, P.A. Estimation of Seasonal Correction Factors through Fourier Decomposition Analysis—A New Model for Indoor Radon Levels in Irish Homes. J. Radiol. Prot. 2010, 30, 433–443. [Google Scholar] [CrossRef]
  18. Kozak, K.; Mazur, J.; KozŁowska, B.; Karpińska, M.; Przylibski, T.A.; Mamont-Cieśla, K.; Grządziel, D.; Stawarz, O.; Wysocka, M.; Dorda, J.; et al. Correction Factors for Determination of Annual Average Radon Concentration in Dwellings of Poland Resulting from Seasonal Variability of Indoor Radon. Appl. Radiat. Isot. 2011, 69, 1459–1465. [Google Scholar] [CrossRef]
  19. Miles, J.C.H.; Howarth, C.B.; Hunter, N. Seasonal Variation of Radon Concentrations in UK Homes. J. Radiol. Prot. 2012, 32, 275–287. [Google Scholar] [CrossRef]
  20. Algin, E.; Asici, C.; Sogukpinar, H.; Akkurt, N. A case study on the use of seasonal correction factors for indoor radon measurements. Radiat. Prot. Dosim. 2018, 183, 423–431. [Google Scholar] [CrossRef] [PubMed]
  21. Baeza, A.; García-Paniagua, J.; Guillén, J.; Montalbán, B. Influence of Architectural Style on Indoor Radon Concentration in a Radon Prone Area: A Case Study. Sci. Total. Environ. 2018, 610, 258–266. [Google Scholar] [CrossRef] [PubMed]
  22. Tsapalov, A.; Kovler, K. Indoor Radon Regulation Using Tabulated Values of Temporal Radon Variation. J. Environ. Radioact. 2018, 183, 59–72. [Google Scholar] [CrossRef]
  23. Steck, D.J.; Sun, K.; William Field, R. Spatial and Temporal Variations of Indoor Airborne Radon Decay Product Dose Rate and Surface-Deposited Radon Decay Products in Homes. Health Phys. 2019, 116, 582–589. [Google Scholar] [CrossRef]
  24. Wrixon, A.D.; Green, B.M.R.; Lomas, P.R.; Miles, J.C.H.; Cliff, K.D.; Francis, E.; Driscoll, C.M.H.; James, A.C.; O’Riordan, M.C. Natural Radiation Exposure In Uk Dwellings; NRPB R190; HMSO: London, UK, 1988. [Google Scholar]
  25. Bochicchio, F.; Campos-Venuti, G.; Piermattei, S.; Nuccetelli, C.; Risica, S.; Tommasino, L.; Torri, G.; Magnoni, M.; Agnesod, G.; Sgorbati, G.; et al. Annual Average and Seasonal Variations of Residential Radon Concentration for All the Italian Regions. Radiat. Meas. 2005, 40, 686–694. [Google Scholar] [CrossRef]
  26. Arvela, H.; Holmgren, O.; Hänninen, P. Effect of soil moisture on seasonal variation in indoor radon concentration: Modelling and measurements in 326 Finnish houses. Radiat. Prot. Dosim. 2015, 168, 277–290. [Google Scholar] [CrossRef] [PubMed] [Green Version]
  27. Burke, Ó.; Murphy, P. Regional Variation of Seasonal Correction Factors for Indoor Radon Levels. Radiat. Meas. 2011, 46, 1168–1172. [Google Scholar] [CrossRef]
  28. Park, J.; Lee, C.; Lee, H.; Kang, D. Estimation of Seasonal Correction Factors for Indoor Radon Concentrations in Korea. Int. J. Environ. Res. Public Health 2018, 15, 2251. [Google Scholar] [CrossRef] [Green Version]
  29. Daraktchieva, Z.; Wasikiewicz, J.M.; Howarth, C.B.; Miller, C.A. Study of Baseline Radon Levels in the Context of a Shale Gas Development. Sci. Total Environ. 2021, 753, 141952. [Google Scholar] [CrossRef]
  30. Arvela, H. Seasonal-variation in radon concentration of 3000 dwellings with model comparisons. Radiat. Prot. Dosim. 1995, 59, 33–42. [Google Scholar]
  31. Yarmoshenko, I.; Zhukovsky, M.; Onishchenko, A.; Vasilyev, A.; Malinovsky, G. Factors Influencing Temporal Variations of Radon Concentration in High-Rise Buildings. J. Environ. Radioact. 2021, 232, 106575. [Google Scholar] [CrossRef]
  32. Vasilyev, A.V.; Zhukovsky, M.V. Determination of Mechanisms and Parameters Which Affect Radon Entry into a Room. J. Environ. Radioact. 2013, 124, 185–190. [Google Scholar] [CrossRef] [PubMed]
  33. Yarmoshenko, I.; Malinovsky, G.; Vasilyev, A.; Onishchenko, A. Model of Radon Entry and Accumulation in Multi-Flat Energy-Efficient Buildings. J. Environ. Chem. Eng. 2021, 9, 105444. [Google Scholar] [CrossRef]
  34. Daraktchieva, Z. New Correction Factors Based on Seasonal Variability of Outdoor Temperature for Estimating Annual Radon Concentrations in UK. Radiat. Prot. Dosim. 2016, 175, 65–74. [Google Scholar] [CrossRef] [PubMed]
  35. IAEA Analytical Quality in Nuclear Applications No. IAEA/AQ/33. In National and Regional Surveys of Radon Concentration in Dwellings: Review of Methodology and Measurement Techniques; International Atomic Energy Agency: Vienna, Austria, 2013.
  36. Appleton, J.D.; Jones, D.G.; Miles, J.C.H.; Scivyer, C. Chapter 18 Radon Gas Hazard. In Geological Society; Engineering Geology Special Publications: London, UK, 2020; Volume 29, pp. 433–456. [Google Scholar] [CrossRef]
  37. Stanley, F.K.T.; Irvine, J.L.; Jacques, W.R.; Salgia, S.R.; Innes, D.G.; Winquist, B.D.; Torr, D.; Brenner, D.R.; Goodarzi, A.A. Radon Exposure Is Rising Steadily within the Modern North American Residential Environment, and Is Increasingly Uniform across Seasons. Sci. Rep. 2019, 9, 1–17. [Google Scholar] [CrossRef] [PubMed] [Green Version]
  38. Friedmann, H. Final results of the austrian radon project. Health Phys. 2005, 89, 339–348. [Google Scholar] [CrossRef] [PubMed]
  39. Ivanova, K.; Stojanovska, Z. Modelling of the Temporal Indoor Radon Variation in Bulgaria. Radiat. Env. Biophys. 2019, 58, 337–344. [Google Scholar] [CrossRef]
  40. Žunic, Z.S.; Yarmoshenko, I.V.; Birovljev, A.; Bochicchio, F.; Quarto, M.; Obryk, B.; Paszkowski, M.; Čeliković, I.; Demajo, A.; Ujić, P.; et al. Radon Survey in the High Natural Radiation Region of Niška Banja, Serbia. J. Environ. Radioact. 2007, 92, 165–174. [Google Scholar] [CrossRef] [PubMed]
  41. Vienneau, D.; Boz, S.; Forlin, L.; Flückiger, B.; de Hoogh, K.; Berlin, C.; Bochud, M.; Bulliard, J.-L.; Zwahlen, M.; Röösli, M. Residential Radon–Comparative Analysis of Exposure Models in Switzerland. Environ. Pollut. 2021, 271, 116356. [Google Scholar] [CrossRef]
  42. Steck, D.; Capistrant, J.; Dumm, J.; Patton, E. Indoor radon exposure uncertainties caused by temporal variation. In Proceedings of the 11th International Congress of the International Radiation Protection Association, Madrid, Spain, 23–28 May 2004. [Google Scholar]
  43. Kropat, G.; Bochud, F.; Jaboyedoff, M.; Laedermann, J.-P.; Murith, C.; Palacios, M.; Baechler, S. Major Influencing Factors of Indoor Radon Concentrations in Switzerland. J. Environ. Radioact. 2014, 129, 7–22. [Google Scholar] [CrossRef] [PubMed]
  44. Yarmoshenko, I.V.; Onishchenko, A.D.; Malinovsky, G.P.; Vasilyev, A.V.; Nazarov, E.I.; Zhukovsky, M.V. Radon Concentration in Conventional and New Energy Efficient Multi-Storey Apartment Houses: Results of Survey in Four Russian Cities. Sci. Rep. 2020, 10, 1–14. [Google Scholar] [CrossRef] [PubMed]
  45. Vasilyev, A.V.; Yarmoshenko, I.V.; Zhukovsky, M.V. Low Air Exchange Rate Causes High Indoor Radon Concentration in Energy-Efficient Buildings. Radiat. Prot. Dosim. 2015, 164, 601–605. [Google Scholar] [CrossRef] [PubMed]
  46. Yarmoshenko, I.; Vasilyev, A.; Ekidin, A.; Pyshkina, M.; Malinovsky, G.; Onishchenko, A.; Zhukovsky, M. Non-Destructive Measurements of Natural Radionuclides in Building Materials for Radon Entry Rate Assessment. J. Radioanal. Nucl. Chem. 2021, 328, 727–737. [Google Scholar] [CrossRef]
  47. Yarmoshenko, I.; Onishchenko, A.; Malinovsky, G.; Vasilyev, A. Radon time series in four flats in energy efficient multi-storey building. Radiat. Prot. Dosim. 2020, 191, 228–232. [Google Scholar] [CrossRef]
  48. Vasilyev, A.; Yarmoshenko, I.; Onishchenko, A.; Hoffmann, M.; Malinovsky, G.; Marenny, A.; Karl, L. Radon measurements in big buildings: Pilot study in russia. Radiat. Prot. Dosim. 2020, 191, 214–218. [Google Scholar] [CrossRef]
  49. RADOSYS LTD. Technical Information. Available online: http://www.radosys.com/index_htm_files/RSKS_RS_Man82-130129_c.pdf (accessed on 11 June 2021).
  50. Mostafa, M.Y.A.; Vasyanovich, M.; Zhukovsky, M. A Primary Standard Source of Radon-222 Based on the HPGe Detector. Appl. Radiat. Isot. 2017, 120, 101–105. [Google Scholar] [CrossRef]
  51. Nazaroff, W.W. Radon Transport from Soil to Air. Rev. Geophys. 1992, 30, 137. [Google Scholar] [CrossRef]
  52. Porstendörfer, J. Properties and Behaviour of Radon and Thoron and Their Decay Products in the Air. J. Aerosol Sci. 1994, 25, 219–263. [Google Scholar] [CrossRef]
  53. Kohl, T.; Medici, F.; Rybach, L. Numerical Simulation of Radon Transport from Subsurface to Buildings. J. Appl. Geophys. 1994, 31, 145–152. [Google Scholar] [CrossRef]
  54. Sherman, M. A Power-Law Formulation of Laminar Flow in Short Pipes. J. Fluids Eng. 1992, 114, 601–605. [Google Scholar] [CrossRef]
  55. Sherman, M.H. Simplified Modeling for Infiltration and Radon Entry; LBL-31305; Lawrence Berkeley National Laboratory: Berkeley, CA, USA, 1998.
Figure 1. Ranges of the outdoor temperatures during the radon series measurements in flats by ID.
Atmosphere 12 00930 g001
Figure 2. Average monthly temperatures based on long-term (1981–2010) observations of studied cities (http://www.pogodaiklimat.ru/, accessed on 10 June 2021).
Atmosphere 12 00930 g002
Figure 3. Distribution of three-hour temperatures during integrated measurements during paired measurements (a) Ekaterinburg, (b) Chelyabinsk, (c) Nizhny Novgorod.
Atmosphere 12 00930 g003
Figure 4. Shape of the suggested model of the dependence of radon concentration in a multistorey building on the outdoor air temperature. (T > T3 summer period, T2 < T < T3 demi-season period, T < T2 winter period, T < T1 cessation of controlled ventilation).
Atmosphere 12 00930 g004
Figure 5. Schematic presentation of patterns and subtypes of radon concentration dependence on outdoor temperature.
Atmosphere 12 00930 g005
Figure 6. Seasonal correction factors for three-months measurements. Blue bars—Nizhny Novgorod (with indication of the value); red bars—the UK [34].
Atmosphere 12 00930 g006
Table 1. Characteristics of flats in which radon series measurements were carried out.
Flat
ID
CityFloor
/Number of
Storeys 1
Building
Materials 2
Year of Construction/
Energy
Eff. Class
Period
of
Measurements
1Ekaterinburg17/25MC2008/C27 June 2010–28 January 2011
2Ekaterinburg12/14MC2007/NA 324 November 2013–14 May 2014
3Ekaterinburg2/13MC, ACB2015/B12 December 2017–18 May 2018
4Ekaterinburg12/13MC, ACB2015/B212 December 2017–18 May 2018
5Ekaterinburg7/13MC, ACB2015/B212 December 2017–18 May 2018
6Ekaterinburg4/10Brick2007/NA7 July 2014–14 January 2015
7Ekaterinburg4/16MC2012/NA14 January–15 June 2014
8Ekaterinburg6/14Brick1989/NA12 January–31 May 2012
9Ekaterinburg3/16MC, ACB2011/B11 January–1 August 2013
10Ekaterinburg6/10MC, ACB2010/NA24 January–14 August 2012
11Ekaterinburg13/16MC2012/B21 January–24 July 2013
12Ekaterinburg3/24MC2008/C1 July–22 December 2011
13Ekaterinburg7/10MC2004/A22 June–26 December 2011
14Ekaterinburg4/16MC2003/NA28 February–28 April 2009
15Ekaterinburg1/16MC2011/C19 May–11 November 2014
16Ekaterinburg15/16MC, ACB2011/B20 May–20 November 2014
17Ekaterinburg7/9PRCP1977/NA7 March–31 May 2011
18Ekaterinburg4/13MC, ACB2015/B21 March–4 August 2017
19Chelyabinsk8/17PRCP2014/B15 May–14 November 2019
20St. Petersburg7/25MC2017/A5 September–6 December 2019
21Ekaterinburg10/25MC2009/B29 April–25 October 2020
22Ekaterinburg2/9MC, ACB2013/B27 April–12 July 2016
1 Floors are numbered applying Russian system with the ground floor being floor 1. 2 MC—monolithic concrete, ACB—aerated concrete blocks, PRCP—prefabricated reinforced concrete panels. 3 NA—not assigned.
Table 2. Results of radon survey in Chelyabinsk.
Period of
Measurements
28 November 2020–31 January 20212 August–11 November 2019
Number of flats10
Arithmetic mean, Bq/m36329
Geometric mean, Bq/m36025
GSD1.421.66
Table 3. Results of radon survey in multistorey building in Ekaterinburg.
Period of Measurements14 January–20 April 201722 April–16 July 2017
Number of flats23
Arithmetic mean, Bq/m3199137
Geometric mean, Bq/m3190121
GSD1.361.68
Table 4. Results of radon concentration measurements in Nizhny Novgorod.
Type of
Buildings
Arithmetic
Mean,
Bq/m3
Geometric
Mean,
Bq/m3
GSDN90th Percentile, Bq/m3
Monolithic concrete37351.395055
Brick32291.535449
Panel26251.405037
All types32291.4815450
Table 5. Main climatic characteristics of studied cities.
CityClimateAnnual
Average, °C
Geographical
Location
EkaterinburgTemperate continental3.0Middle Ural Mountains
ChelyabinskTemperate continental3.0South Ural Mountains
St. PetersburgHumid continental5.8Shores of the Neva Bay of the Gulf of Finland
Nizhny
Novgorod
Humid continental4.8East European Plain
Table 6. Accepted parameters or the model.
ParameterValue or Equation
Tind25 °C
AER due to wind pressure0.3 h−1
kleak (uncontrolled mode)0.01 K/h
kleak (controlled mode)0.2 K/h
AERunctr (T = T1) k leak min · ( T ind T 1 ) 2 / 3
AER (T = T3)1 h−1
Radon entry from building materials aD AER unctr · Rn max
Outdoor radon concentration 5 Bq/m3
Table 7. Parameters of the model.
Descriptive Model
Parameter
Number of
Time Series
MeanMedianRange
Rnmin, Bq/m31268758–115
Rnmax, Bq/m32215316319–295
T1 °C13−4.7−4.00−12–2
T2 °C191.30.0−7–12
T3 °C1216.3182–22
Table 8. Estimated parameters of the model.
ParameterEkaterinburgChelyabinsk
Annual average, Bq/m317238
Rnmin, Bq/m3108−2
Rnmax, Bq/m322874
aD, Bq/(m3 h)227.3
Table 9. Calculation of the average annual radon concentration in a sample of buildings in Nizhny Novgorod.
T °C 1p (T)Pm (T)RnmodRnmod × Pm (T)Rnmod × P (T)
−270.0010.00125.60.030.03
−240.0040.01626.60.400.11
−210.0100.02327.80.610.26
−180.0110.01829.10.500.31
−150.0170.03630.51.050.49
−120.0250.10732.13.290.77
−90.0360.14334.04.651.19
−60.0620.18336.26.322.16
−30.0810.16635.35.602.75
00.1220.17133.45.453.90
30.0970.09129.92.622.77
60.0750.04324.71.031.77
90.0770.00219.00.041.41
120.093014.301.30
150.097011.401.08
180.08609.900.83
210.05409.200.49
240.03008.900.26
270.01608.700.14
300.00408.700.03
330.00108.600.01
i Rn i Pm ( T i )
= 32 Bq/m3
i Rn i P ( T i )
= 22 Bq/m3
1 The middle of the interval from T−1.5 °C to T + 1.5 °C.
Publisher’s Note: MDPI stays neutral with regard to jurisdictional claims in published maps and institutional affiliations.

