Next Issue
Volume 12, August
Previous Issue
Volume 12, June


Atmosphere, Volume 12, Issue 7 (July 2021) – 131 articles

Cover Story (view full-size image): 
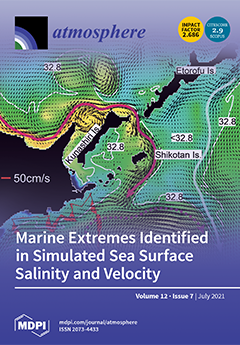
How can we understand very rare marine extremes using limited data? This study highlighted compound extreme storm–ocean eddy events that occurred in summer 2016 around the Pacific shelf off Hokkaido, Japan. By combining in situ ship monitoring and outputs from a realistic high-resolution 1/50° ocean model, this study proposed an analysis methodology to understand the extremes by actually demonstrating how coastal shelf waters responded to compound extremes. The proposed methodology will necessarily become more generalized and established as a standard method in the near future. View this paper
  • Issues are regarded as officially published after their release is announced to the table of contents alert mailing list.
  • You may sign up for e-mail alerts to receive table of contents of newly released issues.
  • PDF is the official format for papers published in both, html and pdf forms. To view the papers in pdf format, click on the "PDF Full-text" link, and use the free Adobe Reader to open them.
Order results
Result details
Section
Select all
Export citation of selected articles as:
17 pages, 2637 KiB  
Article
Seasonal Variation of Radon Concentrations in Russian Residential High-Rise Buildings
by Ilia Yarmoshenko, Georgy Malinovsky, Aleksey Vasilyev and Aleksandra Onishchenko
Atmosphere 2021, 12(7), 930; https://doi.org/10.3390/atmos12070930 - 20 Jul 2021
Cited by 10 | Viewed by 2175
Abstract
Assessment of the annual radon concentration is often required in indoor radon surveys of territories and individual dwellings for comparison with reference levels, studying factors affecting radon accumulation in dwellings, assessment of exposure in epidemiological studies, etc. The indoor radon surveys were carried [...] Read more.
Assessment of the annual radon concentration is often required in indoor radon surveys of territories and individual dwellings for comparison with reference levels, studying factors affecting radon accumulation in dwellings, assessment of exposure in epidemiological studies, etc. The indoor radon surveys were carried out in multistorey buildings in eight Russian cities using solid state nuclear track detectors with an exposure period of three months. For these surveys, the estimation of annual indoor radon concentration was required to compare radon levels in buildings of high- and low-energy-efficiency classes located in different cities. To develop approaches to seasonal normalization in high-rise buildings, long-term one-hour radon concentration series obtained applying radon-monitors in 20 flats were analyzed. The dependency of indoor radon concentration on the indoor–outdoor temperature difference was studied taking into account the known natural, technogenic and anthropogenic factors affecting radon levels. The developed model of seasonal variations in multistorey buildings includes winter, summer, and demi-season periods, which differ both in ventilation intensity and dependency of radon concentration on the temperature difference. The developed model allows to estimate annual radon concentration taking into account the actual distribution of outdoor temperatures during the exposure of the track detectors. Full article
(This article belongs to the Special Issue Atmospheric Radon Measurements, Control, Mitigation and Management)
Show Figures

Figure 1

13 pages, 1299 KiB  
Article
PM2.5-Bound Heavy Metals in Southwestern China: Characterization, Sources, and Health Risks
by Yan Han, Zhichao Wang, Jiawei Zhou, Hanxiong Che, Mi Tian, Huanbo Wang, Guangming Shi, Fumo Yang, Shumin Zhang and Yang Chen
Atmosphere 2021, 12(7), 929; https://doi.org/10.3390/atmos12070929 - 20 Jul 2021
Cited by 20 | Viewed by 3106
Abstract
The health risks of PM2.5-bound heavy metals have attracted extensive attention recently. In order to evaluate those deleterious effects on human health more accurately, and to propose proper measures to reduce health risks of air pollution, the conduction of a source-specific [...] Read more.
The health risks of PM2.5-bound heavy metals have attracted extensive attention recently. In order to evaluate those deleterious effects on human health more accurately, and to propose proper measures to reduce health risks of air pollution, the conduction of a source-specific health risk assessment is necessary. Based on daily collected PM2.5 samples at different functional sites during winter 2019 in a megacity Chongqing, China, combining source apportionment results from PMF and health risk assessment from the U.S. EPA, the source-specific health risks from PM2.5-bound heavy metals were given. Six types of PM2.5 sources have been identified, coal burning (25.5%), motor vehicles (22.8%), industrial emissions (20.5%), biomass burning (15.9%), dust (7.8%), and ship emissions (7.5%). Results showed that the total hazard quotient (HQ) was 0.32 and the total carcinogenic risks (CR) were 2.09 × 10⁻⁶ for children and 8.36 × 10⁻⁶ for adults, implying certain risks for local residents. Industrial emissions related with Cr posed both the highest carcinogenic risk and noncarcinogenic risk (contributing 25% CR and 36% HQ). Coal combustion (associated with Cr, As, and Mn) contributed 15.46% CR and 20.64% HQ, while biomass burning and motor vehicles shared 19.99% and 19.05% of the total CR, respectively. This work indicated that health risks of air pollution sources were the combined effects of the source contribution and chemical components. In order to control the health risks of PM2.5 to the local residents, the priority of targeted emission sources should be adopted for industrial emissions, biomass burning, vehicle emissions, and coal combustion sources. Full article
Show Figures

Figure 1

19 pages, 5886 KiB  
Article
VOC Characteristics and Their Source Apportionment in the Yangtze River Delta Region during the G20 Summit
by Cheng Chen, Lingrui Wang, Yanhong Qin, Yunjiang Zhang, Shanshan Zheng, Yifan Yang, Shiguang Jin and Xiaoxiao Yang
Atmosphere 2021, 12(7), 928; https://doi.org/10.3390/atmos12070928 - 20 Jul 2021
Cited by 7 | Viewed by 2024
Abstract
To evaluate the effectiveness of measures to reduce the levels of volatile organic compounds (VOCs), which are important precursors of ground-level ozone formation, the real-time monitoring data of VOCs at the urban Zhaohui supersite (ZH), the Dianshan Lake regional supersite (DSL) and the [...] Read more.
To evaluate the effectiveness of measures to reduce the levels of volatile organic compounds (VOCs), which are important precursors of ground-level ozone formation, the real-time monitoring data of VOCs at the urban Zhaohui supersite (ZH), the Dianshan Lake regional supersite (DSL) and the urban Yixing station (YX) in the Yangtze River Delta region were analyzed from 23 August to 15 September 2016 during the G20 Hangzhou Summit. The average mole ratios of VOCs at the three sites were 6.56, 21.33 and 19.62 ppb, respectively, which were lower than those (13.65, 27.72 and 21.38 ppb) after deregulation. The characteristics of the VOCs varied during the different control periods. Synoptic conditions and airmass transport played an important role in the transport and accumulation of VOCs and other pollutants, which affected the control effects. Using the positive matrix factorization (PMF) method in source apportionment, five factors were identified, namely, vehicle exhaust (19.66–31.47%), plants (5.59–17.07%), industrial emissions (13.14–33.82%), fuel vaporization (12.83–26.34%) and solvent usage (17.84–28.95%) for the ZH and YX sites. Factor 4 was identified as fuel vaporization + incomplete combustion (21.69–25.35%) at the DSL site. The Non-parametric Wind Regression (NWR) method showed that regional transport was the main factor influencing the VOC distribution. Full article
(This article belongs to the Section Air Quality)
Show Figures

Figure 1

16 pages, 3115 KiB  
Article
Effect of Temperature on Sowing Dates of Wheat under Arid and Semi-Arid Climatic Regions and Impact Quantification of Climate Change through Mechanistic Modeling with Evidence from Field
by Jamshad Hussain, Tasneem Khaliq, Muhammad Habib ur Rahman, Asmat Ullah, Ishfaq Ahmed, Amit Kumar Srivastava, Thomas Gaiser and Ashfaq Ahmad
Atmosphere 2021, 12(7), 927; https://doi.org/10.3390/atmos12070927 - 19 Jul 2021
Cited by 10 | Viewed by 3796
Abstract
Rising temperature from climate change is the most threatening factor worldwide for crop production. Sustainable wheat production is a challenge due to climate change and variability, which is ultimately a serious threat to food security in Pakistan. A series of field experiments were [...] Read more.
Rising temperature from climate change is the most threatening factor worldwide for crop production. Sustainable wheat production is a challenge due to climate change and variability, which is ultimately a serious threat to food security in Pakistan. A series of field experiments were conducted during seasons 2013–2014 and 2014–2015 in the semi-arid (Faisalabad) and arid (Layyah) regions of Punjab-Pakistan. Three spring wheat genotypes were evaluated under eleven sowing dates from 16 October to 16 March, with an interval of 14–16 days in the two regions. Data for the model calibration and evaluation were collected from field experiments following the standard procedures and protocols. The grain yield under future climate scenarios was simulated by using a well-calibrated CERES-wheat model included in DSSAT v4.7. Future (2051–2100) and baseline (1980–2015) climatic data were simulated using 29 global circulation models (GCMs) under representative concentration pathway (RCP) 8.5. These GCMs were distributed among five quadrants of climatic conditions (Hot/Wet, Hot/Dry, Cool/Dry, Cool/Wet, and Middle) by a stretched distribution approach based on temperature and rainfall change. A maximum of ten GCMs predicted the chances of Middle climatic conditions during the second half of the century (2051–2100). The average temperature during the wheat season in a semi-arid region and arid region would increase by 3.52 °C and 3.84 °C, respectively, under Middle climatic conditions using the RCP 8.5 scenario during the second half-century. The simulated grain yield was reduced by 23.5% in the semi-arid region and 35.45% in the arid region under Middle climatic conditions (scenario). Mean seasonal temperature (MST) of sowing dates ranged from 16 to 27.3 °C, while the mean temperature from the heading to maturity (MTHM) stage was varying between 12.9 to 30.4 °C. Coefficients of determination (R2) between wheat morphology parameters and temperature were highly significant, with a range of 0.84–0.96. Impacts of temperature on wheat sown on 15 March were found to be as severe as to exterminate the crop before heading. The spikes and spikelets were not formed under a mean seasonal temperature higher than 25.5 °C. In a nutshell, elevated temperature (3–4 °C) till the end-century can reduce grain yield by about 30% in semi-arid and arid regions of Pakistan. These findings are crucial for growers and especially for policymakers to decide on sustainable wheat production for food security in the region. Full article
(This article belongs to the Special Issue Climate Change and Its Impact on Crops)
Show Figures

Figure 1

12 pages, 2866 KiB  
Article
Characterization of Ambient Particulate Matters in an Industry-Intensive Area in Central Taiwan
by Hsing-Wang Li, Kang-Shin Chen, Chia-Hsiang Lai, Ting-Yu Chen, Yi-Ching Lin, Yung-Chang Lin, Chia-Hung Chen, Yen-Ping Peng and Ming-Hsun Lin
Atmosphere 2021, 12(7), 926; https://doi.org/10.3390/atmos12070926 - 18 Jul 2021
Cited by 3 | Viewed by 2164
Abstract
Atmospheric particulate matters (PMs) were measured in an industry-intensive region in central Taiwan in order to investigate the characteristics and possible sources of PMs. The samplings were simultaneously conducted using a 10- and 3-stage Micro Orifice Uniform Deposit Impactor (MOUDI) from 2017 to [...] Read more.
Atmospheric particulate matters (PMs) were measured in an industry-intensive region in central Taiwan in order to investigate the characteristics and possible sources of PMs. The samplings were simultaneously conducted using a 10- and 3-stage Micro Orifice Uniform Deposit Impactor (MOUDI) from 2017 to 2018. In this study, the characteristics of PMs in this region were evaluated by measuring the mass concentration of PMs and analyzing water-soluble ions and metallic elements, as well as dioxins. Additionally, principal component analysis (PCA) was used to identify the potential sources of PMs. The results showed that the mean concentration of coarse (>1.8 μm), fine (0.1–1.8 μm), and ultrafine (<0.1 μm) particles were 13.60, 14.38, and 3.44 μg/m3, respectively. In the industry-intensive region, the size distribution of ambient particles showed a bi-modal distribution with a high concentration of coarse particles in the spring and summer, while fine particles were dominant in the autumn and winter. The most abundant water-soluble ions of PMs were NO3, Cl, and SO42−, while the majority of metallic elements were Na, Fe, Ca, Al, and Mg in different particle sizes. The results of Pearson’s correlation analysis for metals indicated that the particles in the collected air samples were related to the iron and steelmaking industries, coal burning, vehicle exhausts, and high-tech industries. The dioxin concentration ranged from 0.0006 to 0.0017 pg I-TEQ/Nm3. Principal component analysis (PCA) revealed that the contribution to PMs was associated with sea salt, secondary pollutants, and industrial process. Full article
(This article belongs to the Section Air Quality)
Show Figures

Figure 1

20 pages, 3708 KiB  
Article
An Empirical Atmospheric Density Calibration Model Based on Long Short-Term Memory Neural Network
by Yan Zhang, Jinjiang Yu, Junyu Chen and Jizhang Sang
Atmosphere 2021, 12(7), 925; https://doi.org/10.3390/atmos12070925 - 17 Jul 2021
Cited by 4 | Viewed by 2351
Abstract
The accuracy of the atmospheric mass density is one of the most important factors affecting the orbital precision of spacecraft at low Earth orbits (LEO). Although there are a number of empirical density models available to use in the orbit determination and prediction [...] Read more.
The accuracy of the atmospheric mass density is one of the most important factors affecting the orbital precision of spacecraft at low Earth orbits (LEO). Although there are a number of empirical density models available to use in the orbit determination and prediction of LEO spacecraft, all of them suffer from errors of various degrees. A practical way to reduce the error of a particular model is to calibrate the model using precise density data or tracking data. In this paper, a long short-term memory (LSTM) neural network is proposed to calibrate the NRLMSISE-00 density model, in which the densities derived from spaceborne accelerometer data are the main input. The resulted LSTM-NRL model, calibrated using the accelerometer data from Challenging Minisatellite Payload (CHAMP) satellite, is extensively experimented to evaluate the calibration performance. With data in one month to train the LSTM-NRL model, the model is shown to effectively reduce the root mean square error of the model densities outside the training window by more than 40% in various time spans and space weather environment. The LSTM-NRL model is also shown to have remarkable transferring performance when it is applied along the GRACE satellite orbits. Full article
Show Figures

Figure 1

18 pages, 5840 KiB  
Article
Application of Rough and Fuzzy Set Theory for Prediction of Stochastic Wind Speed Data Using Long Short-Term Memory
by Moslem Imani, Hoda Fakour, Wen-Hau Lan, Huan-Chin Kao, Chi Ming Lee, Yu-Shen Hsiao and Chung-Yen Kuo
Atmosphere 2021, 12(7), 924; https://doi.org/10.3390/atmos12070924 - 17 Jul 2021
Cited by 12 | Viewed by 2482
Abstract
Despite the great significance of precisely forecasting the wind speed for development of the new and clean energy technology and stable grid operators, the stochasticity of wind speed makes the prediction a complex and challenging task. For improving the security and economic performance [...] Read more.
Despite the great significance of precisely forecasting the wind speed for development of the new and clean energy technology and stable grid operators, the stochasticity of wind speed makes the prediction a complex and challenging task. For improving the security and economic performance of power grids, accurate short-term wind power forecasting is crucial. In this paper, a deep learning model (Long Short-term Memory (LSTM)) has been proposed for wind speed prediction. Knowing that wind speed time series is nonlinear stochastic, the mutual information (MI) approach was used to find the best subset from the data by maximizing the joint MI between subset and target output. To enhance the accuracy and reduce input characteristics and data uncertainties, rough set and interval type-2 fuzzy set theory are combined in the proposed deep learning model. Wind speed data from an international airport station in the southern coast of Iran Bandar-Abbas City was used as the original input dataset for the optimized deep learning model. Based on the statistical results, the rough set LSTM (RST-LSTM) model showed better prediction accuracy than fuzzy and original LSTM, as well as traditional neural networks, with the lowest error for training and testing datasets in different time horizons. The suggested model can support the optimization of the control approach and the smooth procedure of power system. The results confirm the superior capabilities of deep learning techniques for wind speed forecasting, which could also inspire new applications in meteorology assessment. Full article
(This article belongs to the Special Issue Statistical Methods in Weather Forecasting)
Show Figures

Figure 1

14 pages, 2855 KiB  
Article
Study on Diesel Low-Nitrogen or Nitrogen-Free Combustion Performance in Constant Volume Combustion Vessels and Contributory
by Qinming Tan, Yihuai Hu and Zhiwen Tan
Atmosphere 2021, 12(7), 923; https://doi.org/10.3390/atmos12070923 - 17 Jul 2021
Cited by 5 | Viewed by 1932
Abstract
This paper studies the combustion performance of diesel in constant volume combustion vessels under different conditions of mixed low-nitrogen (O2 and N2) or non-nitrogen (O2 and CO2) in varying proportions. The high-speed camera is used to shoot [...] Read more.
This paper studies the combustion performance of diesel in constant volume combustion vessels under different conditions of mixed low-nitrogen (O2 and N2) or non-nitrogen (O2 and CO2) in varying proportions. The high-speed camera is used to shoot the combustion flame in the constant volume combustion vessel. The process and morphology of the combustion flame are amplified in both time and space to study and analyze the effects of different compositions and concentrations in gases on the combustion performance of diesel and conduct a study on the contributory factors in the performance of diesel with no nitrogen. According to the study, in the condition of low nitrogen, the O2 concentration is more than 60%, the ignition delay period is shortened, the combustion flame is bright and slender, it spreads quickly, and the blue flame appears when the O2 concentration reaches 70%; While for nitrogen-free combustion, only when the O2 concentration reaches 30% is the combustion close to the air condition; when the O2 concentration reaches 40%, the combustion condition is optimized obviously and the combustion flame is relatively slender compared to the air working condition. Similarly, with the increase of the O2 concentration, the ignition delay period of nitrogen-free diesel is shortened, the duration is extended, and the combustion performance is optimized. In addition, when the O2 concentration reaches 50%, with the decrease of the initial temperature, the ignition delay period is prolonged, and the duration is shortened obviously. When the temperature is lower than 700 K, there is no ignition. The increase of the diesel injection pressure is beneficial to optimize the ignition performance of diesel non-nitrogen combustion and shorten its ignition delay period and combustion duration. Related research has important guiding significance to optimize nitrogen-free combustion technology, which produces no NOx of the diesel engine. Full article
(This article belongs to the Special Issue Ocean Environment Modelling and Air Emissions from Shipping)
Show Figures

Figure 1

14 pages, 3611 KiB  
Article
The Impact of Large-Scale Social Restriction Phases on the Air Quality Index in Jakarta
by Bens Pardamean, Reza Rahutomo, Tjeng Wawan Cenggoro, Arif Budiarto and Anzaludin Samsinga Perbangsa
Atmosphere 2021, 12(7), 922; https://doi.org/10.3390/atmos12070922 - 17 Jul 2021
Cited by 11 | Viewed by 3733
Abstract
We reported the result of our study on the impact of Large-Scale Social Restriction (LSSR) phases due to the COVID-19 outbreak on the air quality in Jakarta. Specifically, this study covered the change of Air Quality Index (AQI) based on five pollutants, PM [...] Read more.
We reported the result of our study on the impact of Large-Scale Social Restriction (LSSR) phases due to the COVID-19 outbreak on the air quality in Jakarta. Specifically, this study covered the change of Air Quality Index (AQI) based on five pollutants, PM10, SO2, CO, O3, and NO2, contained in Jakarta’s air before and during LSSR. The AQI data were provided by the Ministry of Environment and Forestry, Indonesia, from January 2019 to December 2020 at five different locations in Jakarta, with missing data for March and September 2020 due to unknown reasons. These data were grouped into the period before the LSSR from January 2019 to February 2020 and the period during LSSR from April 2020 to December 2020. In order to measure the change in the air quality of Jakarta before and during LSSR, we ran a chi-squared test to the AQI for each location and LSSR phase as well as paired one-sided t-test for the seasonal trend. The result of this study showed that, in general, LSSR improved the air quality of Jakarta. The improvement was mainly contributed by reduced transportation activities that were induced by LSSR. Further analysis on the seasonal pollutants trend showed a variation of AQI improvement in each phase due to their unique characteristics. Full article
(This article belongs to the Special Issue Coronavirus Pandemic Shutdown Effects on Urban Air Quality)
Show Figures

Figure 1

31 pages, 28741 KiB  
Article
Sensitivity of Simulations of Extreme Mediterranean Storms to the Specification of Sea Surface Temperature: Comparison of Cases of a Tropical-Like Cyclone and Explosive Cyclogenesis
by Omer Hagay and Steve Brenner
Atmosphere 2021, 12(7), 921; https://doi.org/10.3390/atmos12070921 - 17 Jul 2021
Cited by 2 | Viewed by 2817
Abstract
Local air-sea interaction over the Mediterranean may amplify the effects of climate change. This study investigates the sensitivity of simulations of two different high impact weather events to changes in the specification of sea surface temperature (SST) using a regional atmospheric model. First [...] Read more.
Local air-sea interaction over the Mediterranean may amplify the effects of climate change. This study investigates the sensitivity of simulations of two different high impact weather events to changes in the specification of sea surface temperature (SST) using a regional atmospheric model. First we assess the impact of specifying SST from two reanalysis data sets with differing spatial resolution. The simulated tropical-like cyclone (TLC) is slightly stronger in the case of the lower resolution SST which is warmer over the formation region, most notably in the maximum rainfall which is ~7% higher. The differences in the two explosive cyclone simulations are negligible, most likely due to intensification occurring mainly over land. We then test the sensitivity of the storms to a range of SST anomalies. The TLC showed a clear trend of increasing storm intensity as SST rises. These results suggest that SST plays a direct role in determining the intensity of the storm. For the explosive cyclone there is no clear trend in dynamical intensity except for the highest warming anomalies. However, the rainfall increases with the magnitude of the SST anomaly. Our results suggest that extreme weather events over the Mediterranean will become more extreme if SST increases as the climate warms, assuming that upper air conditions do not change. Full article
(This article belongs to the Section Meteorology)
Show Figures

Figure 1

15 pages, 7238 KiB  
Article
High-Speed Visualization of Very Large High-Resolution Simulations for Air Hazard Transport and Dispersion
by Olivier Oldrini, Sylvie Perdriel, Patrick Armand and Christophe Duchenne
Atmosphere 2021, 12(7), 920; https://doi.org/10.3390/atmos12070920 - 17 Jul 2021
Cited by 2 | Viewed by 1808
Abstract
In the case of an atmospheric release of a noxious substance, modeling remains an essential tool to assess and forecast the impact of the release. The impact of such situations on populated, and hence built-up, areas is of the uttermost importance. However, modeling [...] Read more.
In the case of an atmospheric release of a noxious substance, modeling remains an essential tool to assess and forecast the impact of the release. The impact of such situations on populated, and hence built-up, areas is of the uttermost importance. However, modeling on such areas requires specific high-resolution approaches, which are complex to set up in emergency situations. Various approaches have been tried and evaluated: The EMERGENCIES and EMED project demonstrated an effective strategy using intensive parallel computing. Large amounts of data were produced that proved initially to be difficult to visualize, especially in a crisis management framework. A dedicated processing has been set up to allow for rapid and effective visualization of the modeling results. This processing relies on a multi-level tiled approach initiated in web cartography. The processing is using a parallel approach whose performances were evaluated using the large amounts of data produced in the EMERGENCIES and EMED projects. The processing proved to be very effective and compatible with the requirements of emergency situations. Full article
Show Figures

Figure 1

11 pages, 624 KiB  
Article
Association between Polycyclic Aromatic Hydrocarbon Exposure and Diarrhea in Adults
by Chia-Che Wu, Wen-Hui Fang, Chung-Ching Wang, Ching-Huang Lai and Wei-Liang Chen
Atmosphere 2021, 12(7), 919; https://doi.org/10.3390/atmos12070919 - 17 Jul 2021
Cited by 5 | Viewed by 2315
Abstract
Objective: Polycyclic aromatic hydrocarbons (PAHs) are not only natural but also anthropogenic contaminants that exist in many places in the environment. Human beings often accidentally ingest PAHs via smoking. Furthermore, smoking may increase the risk of bowel disorder, including diarrhea and other gastrointestinal [...] Read more.
Objective: Polycyclic aromatic hydrocarbons (PAHs) are not only natural but also anthropogenic contaminants that exist in many places in the environment. Human beings often accidentally ingest PAHs via smoking. Furthermore, smoking may increase the risk of bowel disorder, including diarrhea and other gastrointestinal problems. Therefore, PAH exposure is hypothesized to be related to diarrhea risk. This study discusses the association between diarrhea and PAH exposure in the United States adult population. Method: 10,537 participants from the National Health and Nutrition Examination Survey (NHANES 2001–2006) were involved in this cross-sectional analysis. Bowel disorders were assessed via examination of stool frequency and stool type. The concentrations of urinary PAH metabolites were used to evaluate PAH exposure. The association between bowel habits and PAH exposure was assessed using a multivariate logistic regression model with covariate assessment of gender, age, race, liver function, kidney function, and common chronic health diseases. Results: All PAH metabolites except 1-hydroxynaphthalene, 1-hydroxypyrene, and 9-hydroxyfluorene were substantially correlated with an increased risk of diarrhea (p < 0.05) after modification of relevant covariables. This study also revealed significant association in the group of females (p < 0.05). Furthermore, all PAH metabolites except 1-hydroxynaphthalene, 2-hydroxyphenanthrene, 1-hydroxypyrene, and 9-hydroxyfluorene show significantly positive association in the non-obesity group (BMI < 30, p < 0.05). Conclusions: PAH exposure is highly associated with risk of bowel disorders among the adult population in the United States, especially in female and non-obesity populations. More research is necessary to shed light on the pathophysiological mechanisms associated to PAH exposure and diarrhea. Full article
(This article belongs to the Special Issue Outdoor Air Pollution and Human Health)
Show Figures

Graphical abstract

47 pages, 7666 KiB  
Review
Laser Beam Atmospheric Propagation Modelling for Aerospace LIDAR Applications
by Thomas Fahey, Maidul Islam, Alessandro Gardi and Roberto Sabatini
Atmosphere 2021, 12(7), 918; https://doi.org/10.3390/atmos12070918 - 17 Jul 2021
Cited by 23 | Viewed by 14705
Abstract
Atmospheric effects have a significant impact on the performance of airborne and space laser systems. Traditional models used to predict propagation effects rely heavily on simplified assumptions of the atmospheric properties and their interactions with laser systems. In the engineering domain, these models [...] Read more.
Atmospheric effects have a significant impact on the performance of airborne and space laser systems. Traditional models used to predict propagation effects rely heavily on simplified assumptions of the atmospheric properties and their interactions with laser systems. In the engineering domain, these models need to be continually improved in order to develop tools that can predict laser beam propagation with high accuracy and for a wide range of practical applications such as LIDAR (light detection and ranging), free-space optical communications, remote sensing, etc. The underlying causes of laser beam attenuation in the atmosphere are examined in this paper, with a focus on the dominant linear effects: absorption, scattering, turbulence, and non-linear thermal effects such as blooming, kinetic cooling, and bleaching. These phenomena are quantitatively analyzed, highlighting the implications of the various assumptions made in current modeling approaches. Absorption and scattering, as the dominant causes of attenuation, are generally well captured in existing models and tools, but the impacts of non-linear phenomena are typically not well described as they tend to be application specific. Atmospheric radiative transfer codes, such as MODTRAN, ARTS, etc., and the associated spectral databases, such as HITRAN, are the existing tools that implement state-of-the-art models to quantify the total propagative effects on laser systems. These tools are widely used to analyze system performance, both for design and test/evaluation purposes. However, present day atmospheric radiative transfer codes make several assumptions that reduce accuracy in favor of faster processing. In this paper, the atmospheric radiative transfer models are reviewed highlighting the associated methodologies, assumptions, and limitations. Empirical models are found to offer a robust analysis of atmospheric propagation, which is particularly well-suited for design, development, test and evaluation (DDT&E) purposes. As such, empirical, semi-empirical, and ensemble methodologies are recommended to complement and augment the existing atmospheric radiative transfer codes. There is scope to evolve the numerical codes and empirical approaches to better suit aerospace applications, where fast analysis is required over a range of slant paths, incidence angles, altitudes, and atmospheric conditions, which are not exhaustively captured in current performance assessment methods. Full article
Show Figures

Figure 1

14 pages, 10579 KiB  
Article
Urban Heat Islands and Vulnerable Populations in a Mid-Size Coastal City in an Arid Environment
by Carolina Quintana-Talvac, Oscar Corvacho-Ganahin, Pamela Smith, Pablo Sarricolea, Manuel Prieto and Oliver Meseguer-Ruiz
Atmosphere 2021, 12(7), 917; https://doi.org/10.3390/atmos12070917 - 17 Jul 2021
Cited by 5 | Viewed by 2681
Abstract
Arica is a coastal city located in northern Chile, in the Atacama Desert. The behavior of surface temperatures in the city between 1985 and 2019 was studied using Landsat satellite images, leading to the identification of surface urban heat islands (SUHI), surface urban [...] Read more.
Arica is a coastal city located in northern Chile, in the Atacama Desert. The behavior of surface temperatures in the city between 1985 and 2019 was studied using Landsat satellite images, leading to the identification of surface urban heat islands (SUHI), surface urban cold islands (SUCI), and average temperature zones. The higher intensities of the SUHI reach values of almost 45 °C and the SUCI lower values are below 13 °C. From the socioeconomic characterisation of the population based on indicators retrieved from the 2012 and 2017 population censuses, we identified that during the study period there was a lower presence of SUHI, but these were linked to spaces of lower socioeconomic level and, for the most part, would form new urban spaces within the city. On the other hand, SUCI had a greater spatial presence in the study area and in the urban morphology, being found mostly in areas of high socioeconomic level and in consolidated spaces with few possibilities of generating new constructions. Full article
(This article belongs to the Section Biometeorology)
Show Figures

Figure 1

21 pages, 4442 KiB  
Article
Temporal Analysis of Urban-Suburban PET, mPET and UTCI Indices in Belgrade (Serbia)
by Milica Pecelj, Andreas Matzarakis, Mirjam Vujadinović, Milan Radovanović, Nemanja Vagić, Dijana Đurić and Milena Cvetkovic
Atmosphere 2021, 12(7), 916; https://doi.org/10.3390/atmos12070916 - 16 Jul 2021
Cited by 26 | Viewed by 3614
Abstract
The analysis of the bioclimatic conditions is becoming increasingly relevant in climate interpretations for human needs, particularly in spatial planning, tourism, public health, sports events, bio-prognosis, etc. In this context, our study presents general temporal bioclimatic conditions in Belgrade, defined based on the [...] Read more.
The analysis of the bioclimatic conditions is becoming increasingly relevant in climate interpretations for human needs, particularly in spatial planning, tourism, public health, sports events, bio-prognosis, etc. In this context, our study presents general temporal bioclimatic conditions in Belgrade, defined based on the PET, mPET and UTCI heat budget indices. Monthly, seasonal and annual indices were analyzed for urban and suburban weather stations based on 43 annual sets of meteorological data obtained by hourly observations at 7 h and 14 h CET. This study aims to present the distribution of PET, mPET and UTCI indices to show the pattern of each index in a mild climate location and to examine annual and seasonal differences of each index in the Belgrade urban center and suburban part of the city. The study results indicate higher biothermal stress in the urban area compared to the suburban zone and that the indices are congruent during the summer. At the same time, during the winter, they are more difficult to compare due to their peculiarities becoming more noticeable. The results obtained of all mean monthly and mean annual values of all three indices clearly indicate the difference that follows the definition of the urban heat island (UHI), particularly those from morning observation and winter season. The UTCI index shows the most significant monthly, seasonal and annual difference between urban and suburban areas for both observations. The annual difference of ΔUTCI7h amounts to 1.5 °C is the same as the annual difference of minimum temperatures (Δtmin). In contrast, the annual differences of ΔPET7h ΔmPET7h are °smaller (0.8 °C and 0.7 °C) and closer to the annual differences of maximum temperatures Δtmax amounted of 0.6 °C. Full article
(This article belongs to the Section Biometeorology)
Show Figures

Figure 1

16 pages, 6134 KiB  
Article
Chemical Composition of Gas and Particle Phase Products of Toluene Photooxidation Reaction under High OH Exposure Condition
by Yik-Sze Lau, Man-Nin Chan, Hon-Yin Poon, Yan Tan, Shun-Cheng Lee, Jianjun Li and Kin-Fai Ho
Atmosphere 2021, 12(7), 915; https://doi.org/10.3390/atmos12070915 - 15 Jul 2021
Cited by 8 | Viewed by 2945
Abstract
In the current study, the photooxidation reaction of toluene (C7H8) was investigated in a Potential Aerosol Mass Oxidation Flow Reactor (PAM OFR). The hydroxyl radical (OH) exposure of toluene in the PAM OFR ranged from 0.4 to 1.4 × [...] Read more.
In the current study, the photooxidation reaction of toluene (C7H8) was investigated in a Potential Aerosol Mass Oxidation Flow Reactor (PAM OFR). The hydroxyl radical (OH) exposure of toluene in the PAM OFR ranged from 0.4 to 1.4 × 10¹² molec cm−3 s, which is equivalent to 3 to 12 days of atmospheric oxidation. A proton transfer reaction-mass spectrometer (PTR-MS) and a scanning mobility particle sizer (SMPS) were used to study the gas-phase products formed and particle number changes of the oxidation reaction in PAM OFR. The secondary organic aerosol (SOA) formed in the PAM OFR was also collected for off-line chemical analysis. Key gas-phase reaction products of toluene, including glyoxal, methyl glyoxal, unsaturated carbonyl compounds, and benzaldehyde, were identified by the PTR-MS. Second generation products, including acetic acid, formaldehyde, formic acid, and acetaldehyde, were also detected. By comparing the mass spectrums obtained under different OH exposures and relative humidity (RH), changes in the two parameters have minimal effects on the composition of gas-phase products formed, expect for the spectrum obtained at OH exposure of 0.4 × 1012 cm−3 s and RH = 17%, which is slightly different from other spectrums. SMPS results showed that particle mass concentration increases with increasing OH exposure, while particle number concentration first increases and then decreases with increasing OH exposure. This result probably suggests the formation of oligomers at high OH exposure conditions. Off-line chemical analysis of the SOA sample was dominated by C4 diacids, including malic acid, citramalic acid, and tartaric acid. The well-known toluene SOA marker 2,3-Dihydroxy-4-oxopentanoic acid, as well as 2,3-dihydroxyglutaric acid, which has not been identified in previous toluene photooxidation experiments, were also detected in the SOA sample. Our results showed good agreements with the results of previous smog chamber studies of toluene photooxidation reaction, and they suggested that using PAM OFR for studies of oxidation reaction of different VOCs can be atmospherically relevant. Full article
Show Figures

Figure 1

24 pages, 18706 KiB  
Article
A 7-Year Climatology of Warm-Sector Heavy Rainfall over South China during the Pre-Summer Months
by Tao Chen and Da-Lin Zhang
Atmosphere 2021, 12(7), 914; https://doi.org/10.3390/atmos12070914 - 15 Jul 2021
Cited by 1 | Viewed by 2363
Abstract
In view of the limited predictability of heavy rainfall (HR) events and the limited understanding of the physical mechanisms governing the initiation and organization of the associated mesoscale convective systems (MCSs), a composite analysis of 58 HR events over the warm sector (i.e., [...] Read more.
In view of the limited predictability of heavy rainfall (HR) events and the limited understanding of the physical mechanisms governing the initiation and organization of the associated mesoscale convective systems (MCSs), a composite analysis of 58 HR events over the warm sector (i.e., far ahead of the surface cold front), referred to as WSHR events, over South China during the months of April to June 2008~2014 is performed in terms of precipitation, large-scale circulations, pre-storm environmental conditions, and MCS types. Results show that the large-scale circulations of the WSHR events can be categorized into pre-frontal, southwesterly warm and moist ascending airflow, and low-level vortex types, with higher frequency occurrences of the former two types. Their pre-storm environments are characterized by a deep moist layer with >50 mm column-integrated precipitable water, high convective available potential energy with the equivalent potential temperature of ≥340 K at 850 hPa, weak vertical wind shear below 400 hPa, and a low-level jet near 925 hPa with weak warm advection, based on atmospheric parameter composite. Three classes of the corresponding MCSs, exhibiting peak convective activity in the afternoon and the early morning hours, can be identified as linear-shaped, a leading convective line adjoined with trailing stratiform rainfall, and comma-shaped, respectively. It is found that many linear-shaped MCSs in coastal regions are triggered by local topography, enhanced by sea breezes, whereas the latter two classes of MCSs experience isentropic lifting in the southwesterly warm and moist flows. They all develop in large-scale environments with favorable quasi-geostrophic forcing, albeit weak. Conceptual models are finally developed to facilitate our understanding and prediction of the WSHR events over South China. Full article
Show Figures

Figure 1

20 pages, 3742 KiB  
Article
Effects of Climatic and Soil Data on Soil Drought Monitoring Based on Different Modelling Schemes
by Jan Řehoř, Rudolf Brázdil, Miroslav Trnka, Milan Fischer, Jan Balek, Petr Štěpánek, Pavel Zahradníček, Daniela Semerádová and Monika Bláhová
Atmosphere 2021, 12(7), 913; https://doi.org/10.3390/atmos12070913 - 15 Jul 2021
Cited by 5 | Viewed by 2281
Abstract
Satisfactory requirements for the spatial resolution of climate and the influences of soil data in defining the starting points, endings, and the intensities of droughts have become matters of discussion in recent years. The overall inclusiveness of the modelling tools applied is also [...] Read more.
Satisfactory requirements for the spatial resolution of climate and the influences of soil data in defining the starting points, endings, and the intensities of droughts have become matters of discussion in recent years. The overall inclusiveness of the modelling tools applied is also frequently discussed. In this light, five model setups (MSs) of the daily SoilClim water balance model were developed and tested for the Czech Republic (CR) in the 1961–2020 period. These included two versions of the SoilClim model, two sets of soil data, and two sets of climatic data at different spatial resolutions. MS1–MS4 were based on local, spatially-interpolated data from meteorological stations (500 × 500 m resolution), while MS5 was developed for global drought monitoring, based on the coarser ERA5-Land reanalysis (0.1° × 0.1°). During the 1961–2020 period, all the MSs indicated strong, statistically significant increases in the occurrence of 10th-percentile soil drought in the April–June season; however, trends remained largely non-significant for the remainder of the year. Variations among MS1–MS4 demonstrate that the range of soil property input data affects results to a lesser extent than different modelling schemes. The major simplification of the model grid in MS5 still led to an acceptable conformity of results, while the non-conformities disclosed may be explained by differences between meteorological inputs. Comparison with the Palmer Drought Severity Index (PDSI) confirmed that the SoilClim model depicts the variability of soil drought occurrence in greater detail, while PDSI tends to highlight the most severe events. The discussion arising out of the study centers around model uncertainties and the expression of soil drought episodes in different MSs. Full article
(This article belongs to the Section Biosphere/Hydrosphere/Land–Atmosphere Interactions)
Show Figures

Figure 1

22 pages, 7450 KiB  
Article
Deposition of Smoke Particles in Human Airways with Realistic Waveform
by Akshoy Ranjan Paul, Firoz Khan, Anuj Jain and Suvash Chandra Saha
Atmosphere 2021, 12(7), 912; https://doi.org/10.3390/atmos12070912 - 15 Jul 2021
Cited by 11 | Viewed by 3654
Abstract
Exposure to toxic particles from smoke generated either from bush fire, stable burning, or direct smoking is very harmful to our health. The tiny particles easily penetrate deep into the lungs after exposure and damage the airways. Tobacco smoking causes the direct emission [...] Read more.
Exposure to toxic particles from smoke generated either from bush fire, stable burning, or direct smoking is very harmful to our health. The tiny particles easily penetrate deep into the lungs after exposure and damage the airways. Tobacco smoking causes the direct emission of 2.6 million tons of CO2 and 5.2 million tons of methane annually into the atmosphere. Nevertheless, it is one of the significant contributors to various respiratory diseases leading to lung cancer. These particles’ deposition in the human airway is computed in the present article for refining our understanding of the adverse health effects due to smoke particle inhalation, especially cigarette smoke. Until recently, little work has been reported to account for the transient flow pattern of cigarette smoking. Consideration of transient flow may change the deposition pattern of the particle. A high-resolution CT scan image of the respiratory tract model consisting of the oral cavity, throat, trachea, and first to sixth generations of the lungs helps predict cigarette smoke particle (CSP) deposition. With the same scan, a realistic geometric model of the human airways of an adult subject is used to simulate the transport of air and particle. The CSP deposition is determined at different locations from the oral cavity to the sixth generation of the bronchi. In addition, an unsteady breathing curve indicative of realistic smoking behavior is utilized to represent the breathing conditions accurately. The discrete phase model (DPM) technique is used to determine smoke particle deposition in the human airways. It is found that the deposition increases with the size of the smoke particle. Particles tend to deposit in the oral cavity around the bifurcation junction of the airways. The deposition fraction of CSP with the realistic waveform of smoking is found to be smaller compared to that during the stable flow condition. It is also observed that the fine particles (0.1–1.0 micron) escape to lower generations, leading to higher deposition of fine particles in the deeper airways. The outcome of the study is helpful for understanding smoke-related pulmonary complications. Full article
(This article belongs to the Special Issue Heat Wave, Bush Fire and Air-Quality: Impacts on Respiratory Health)
Show Figures

Figure 1

16 pages, 315 KiB  
Article
Chemical Composition of PM2.5 in Wood Fire and LPG Cookstove Homes of Nepali Brick Workers
by James D. Johnston, John D. Beard, Emma J. Montague, Seshananda Sanjel, James H. Lu, Haley McBride, Frank X. Weber and Ryan T. Chartier
Atmosphere 2021, 12(7), 911; https://doi.org/10.3390/atmos12070911 - 15 Jul 2021
Cited by 5 | Viewed by 2290
Abstract
Household air pollution is a major cause of morbidity and mortality worldwide, largely due to particles ≤ 2.5 µm (PM2.5). The toxicity of PM2.5, however, depends on its physical properties and chemical composition. In this cross-sectional study, we compared [...] Read more.
Household air pollution is a major cause of morbidity and mortality worldwide, largely due to particles ≤ 2.5 µm (PM2.5). The toxicity of PM2.5, however, depends on its physical properties and chemical composition. In this cross-sectional study, we compared the chemical composition of PM2.5 in brick workers’ homes (n = 16) based on use of wood cooking fire or liquefied petroleum gas (LPG) cookstoves. We collected samples using RTI International particulate matter (PM) exposure monitors (MicroPEMs). We analyzed filters for 33 elements using energy-dispersive X-ray fluorescence and, for black (BC) and brown carbon (BrC), integrating sphere optical transmittance. Wood fire homes had significantly higher concentrations of BC (349 µg/m3) than LPG homes (6.27 µg/m3, p < 0.0001) or outdoor air (5.36 µg/m3, p = 0.002). Indoor chlorine in wood fire homes averaged 5.86 µg/m3, which was approximately 34 times the average level in LPG homes (0.17 µg/m3, p = 0.0006). Similarly, potassium in wood fire homes (4.17 µg/m3) was approximately four times the level in LPG homes (0.98 µg/m3, p = 0.001). In all locations, we found aluminum, calcium, copper, iron, silicon, and titanium in concentrations exceeding those shown to cause respiratory effects in other studies. Our findings suggest the need for multi-faceted interventions to improve air quality for brick workers in Nepal. Full article
(This article belongs to the Special Issue Assessing Atmospheric Pollution and Its Impacts on the Human Health)
3 pages, 160 KiB  
Correction
Correction: Terunuma et al. A Cohort Study on Respiratory Symptoms and Diseases Caused by Toner-Handling Work: Longitudinal Analyses from 2003 to 2013. Atmosphere 2019, 10, 647
by Niina Terunuma, Kazunori Ikegami, Hiroko Kitamura, Hajime Ando, Shizuka Kurosaki, Masashi Masuda, Takeshi Kochi, Nobuaki Yanagi, Akira Ogami and Toshiaki Higashi
Atmosphere 2021, 12(7), 910; https://doi.org/10.3390/atmos12070910 - 15 Jul 2021
Viewed by 1565
Abstract
There were errors in the original article [1] [...] Full article
(This article belongs to the Section Air Quality and Human Health)
16 pages, 3806 KiB  
Article
High Resolution Chemical Stratigraphies of Atmospheric Depositions from a 4 m Depth Snow Pit at Dome C (East Antarctica)
by Laura Caiazzo, Silvia Becagli, Stefano Bertinetti, Marco Grotti, Silvia Nava, Mirko Severi and Rita Traversi
Atmosphere 2021, 12(7), 909; https://doi.org/10.3390/atmos12070909 - 14 Jul 2021
Cited by 3 | Viewed by 6520
Abstract
In this work, we present chemical stratigraphies of two sampling lines collected within a 4 m depth snow pit dug in Dome C during the Antarctic summer Campaign 2017/2018, 12 years after the last reported snow pit. The first sampling line was analyzed [...] Read more.
In this work, we present chemical stratigraphies of two sampling lines collected within a 4 m depth snow pit dug in Dome C during the Antarctic summer Campaign 2017/2018, 12 years after the last reported snow pit. The first sampling line was analyzed for nine anionic and cationic species using Ion Chromatography (IC); the second sampling line was analyzed for seven major elements in an innovative way with Inductively Coupled Plasma Optical Emission Spectroscopy (ICP-OES) after sample pre-concentration, allowing the study of deposition processes of new markers especially related to crustal source. This coupled analysis, besides confirming previous studies, allowed us to investigate the depositions of the last decades at Dome C, enriching the number of the detected chemical markers, and yielding these two techniques complementary for the study of different markers in this kind of matrix. As a result of the dating, the snow layers analyzed covered the last 50 years of snow depositions. The assessment of the accumulation rate, estimated about 9 cm yr−1, was accomplished only for the period 1992–2016, as the eruption of 1992 constituted the only tie-point found in nssSO42− depth profile. Na, the reliable sea salt marker, together with Mg and Sr, mainly arose from marine sources, whereas Ca, Al and Fe originated from crustal inputs. Post-depositional processes occurred on Cl as well as on NO3 and methanesulfonic acid (MSA); compared to the latter, Cl had a more gradual decrease, reporting a threshold at 2.5 m for the post-depositional process completion. For NO3 and MSA, instead, the threshold was shallower, at about 1 m depth, with a loss of 87% for NO3 and of 50% for MSA. Full article
(This article belongs to the Special Issue Air Pollution in the Polar Regions: Levels, Sources and Trends)
Show Figures

Figure 1

26 pages, 41867 KiB  
Article
A New Approach for the Analysis of Deep Convective Events: Thunderstorm Intensity Index
by Damjan Jelić, Maja Telišman Prtenjak, Barbara Malečić, Andreina Belušić Vozila, Otília Anna Megyeri and Tanja Renko
Atmosphere 2021, 12(7), 908; https://doi.org/10.3390/atmos12070908 - 14 Jul 2021
Cited by 7 | Viewed by 2773
Abstract
In this study, an investigation of a new thunderstorm intensity index (TSII) derived from lightning data is performed, along with its relationship to rain, wind, hail and waterspouts as well as instability indices (CAPE, LI, KI, and DLS). The study area is located [...] Read more.
In this study, an investigation of a new thunderstorm intensity index (TSII) derived from lightning data is performed, along with its relationship to rain, wind, hail and waterspouts as well as instability indices (CAPE, LI, KI, and DLS). The study area is located in the northeastern Adriatic and includes various terrain types in a relatively small area (coastal, flatlands, hills and valleys, and mountain regions). The investigated period covers 11 years (2008–2018). The mathematical algorithm standing behind the TSII is based on the well-established methodology of lightning jump, allowing us to recognize areas where intensification in thunderstorms occurred. Our results suggest that these areas (with a positive TSII) experience significantly higher rain intensities and have higher total amounts of precipitation compared with areas where thunderstorms did not generate a TSII. Moreover, 76% of thunderstorm hail cases were associated with the presence of a TSII within a 15 km distance. The maximum reported wind speed also has higher values on a day with a TSII. Out of 27 waterspout events associated with lightning, 77% were related to a TSII. Due to the good spatial (3 km × 3 km) and high temporal (2 min) resolution of lightning data, the TSII can recognize even a local and short-lived intense system that is often misread by radars and satellites due to their inferior temporal resolution. The TSII is designed to be used as a climatological and diagnostic variable that could serve in lieu of more established data sources (e.g., station measurements and observations, radar imagery, etc.) if they are unavailable. Full article
Show Figures

Figure 1

23 pages, 3703 KiB  
Article
Evaluation of Tourism-Climate Conditions in the Region of Kłodzko Land (Poland)
by Bartłomiej Miszuk
Atmosphere 2021, 12(7), 907; https://doi.org/10.3390/atmos12070907 - 14 Jul 2021
Cited by 4 | Viewed by 1846
Abstract
Kłodzko Land is one of the most important regions of Poland in terms of tourism and health issues. Numerous tourism attractions and health resorts make the region attractive for both tourist and bathers. The goal of this paper was to evaluate the impact [...] Read more.
Kłodzko Land is one of the most important regions of Poland in terms of tourism and health issues. Numerous tourism attractions and health resorts make the region attractive for both tourist and bathers. The goal of this paper was to evaluate the impact of weather conditions on tourism-related conditions and their changes in the multiannual period. In the analysis, the indices of heat days, the UTCI (Universal Thermal Climate Index) and CTIS (Climate Tourism Information Scheme) tools were used. The research on heat days and the UTCI indicated a significant increase in the heat-stress frequency over the last decades. Simultaneously, the number of weather types related to cold stress has considerably decreased. Such trends were noticed in the entire region, in all the considered hypsometric zones. The rising tendency was also observed for strong and very strong heat stress (UTCI > 32 °C), which negatively affects health problems. The analysis showed that the most extreme thermal and biothermal conditions, in terms of heat stress, occur under southern and eastern anticyclonic circulation. The CTIS analysis showed that favorable weather conditions for most of tourism activities are noticed in the warm half-year. The usefulness of weather conditions for tourism can vary depending on atmospheric circulation. Full article
(This article belongs to the Special Issue Tourism and Extreme Weather and Climate Events)
Show Figures

Figure 1

24 pages, 2245 KiB  
Article
The ICON Single-Column Mode
by Ivan Bašták Ďurán, Martin Köhler, Astrid Eichhorn-Müller, Vera Maurer, Juerg Schmidli, Annika Schomburg, Daniel Klocke, Tobias Göcke, Sophia Schäfer, Linda Schlemmer and Noviana Dewani
Atmosphere 2021, 12(7), 906; https://doi.org/10.3390/atmos12070906 - 14 Jul 2021
Cited by 3 | Viewed by 2849
Abstract
The single-column mode (SCM) of the ICON (ICOsahedral Nonhydrostatic) modeling framework is presented. The primary purpose of the ICON SCM is to use it as a tool for research, model evaluation and development. Thanks to the simplified geometry of the ICON SCM, various [...] Read more.
The single-column mode (SCM) of the ICON (ICOsahedral Nonhydrostatic) modeling framework is presented. The primary purpose of the ICON SCM is to use it as a tool for research, model evaluation and development. Thanks to the simplified geometry of the ICON SCM, various aspects of the ICON model, in particular the model physics, can be studied in a well-controlled environment. Additionally, the ICON SCM has a reduced computational cost and a low data storage demand. The ICON SCM can be utilized for idealized cases—several well-established cases are already included—or for semi-realistic cases based on analyses or model forecasts. As the case setup is defined by a single NetCDF file, new cases can be prepared easily by the modification of this file. We demonstrate the usage of the ICON SCM for different idealized cases such as shallow convection, stratocumulus clouds, and radiative transfer. Additionally, the ICON SCM is tested for a semi-realistic case together with an equivalent three-dimensional setup and the large eddy simulation mode of ICON. Such consistent comparisons across the hierarchy of ICON configurations are very helpful for model development. The ICON SCM will be implemented into the operational ICON model and will serve as an additional tool for advancing the development of the ICON model. Full article
(This article belongs to the Section Meteorology)
Show Figures

Figure 1

21 pages, 1760 KiB  
Article
Climate Variability, Dengue Vector Abundance and Dengue Fever Cases in Dhaka, Bangladesh: A Time-Series Study
by Sabrina Islam, C. Emdad Haque, Shakhawat Hossain and John Hanesiak
Atmosphere 2021, 12(7), 905; https://doi.org/10.3390/atmos12070905 - 14 Jul 2021
Cited by 8 | Viewed by 5007
Abstract
Numerous studies on climate change and variability have revealed that these phenomena have noticeable influence on the epidemiology of dengue fever, and such relationships are complex due to the role of the vector—the Aedes mosquitoes. By undertaking a step-by-step approach, the present study [...] Read more.
Numerous studies on climate change and variability have revealed that these phenomena have noticeable influence on the epidemiology of dengue fever, and such relationships are complex due to the role of the vector—the Aedes mosquitoes. By undertaking a step-by-step approach, the present study examined the effects of climatic factors on vector abundance and subsequent effects on dengue cases of Dhaka city, Bangladesh. Here, we first analyzed the time-series of Stegomyia indices for Aedes mosquitoes in relation to temperature, rainfall and relative humidity for 2002–2013, and then in relation to reported dengue cases in Dhaka. These data were analyzed at three sequential stages using the generalized linear model (GLM) and generalized additive model (GAM). Results revealed strong evidence that an increase in Aedes abundance is associated with the rise in temperature, relative humidity, and rainfall during the monsoon months, that turns into subsequent increases in dengue incidence. Further we found that (i) the mean rainfall and the lag mean rainfall were significantly related to Container Index, and (ii) the Breteau Index was significantly related to the mean relative humidity and mean rainfall. The relationships of dengue cases with Stegomyia indices and with the mean relative humidity, and the lag mean rainfall were highly significant. In examining longitudinal (2001–2013) data, we found significant evidence of time lag between mean rainfall and dengue cases. Full article
Show Figures

Figure 1

19 pages, 5305 KiB  
Article
Urban-Induced Changes on Local Circulation in Complex Terrain: Central Mexico Basin
by Lourdes P. Aquino-Martínez, Arturo I. Quintanar, Carlos A. Ochoa-Moya, Erika Danaé López-Espinoza, David K. Adams and Aron Jazcilevich-Diamant
Atmosphere 2021, 12(7), 904; https://doi.org/10.3390/atmos12070904 - 14 Jul 2021
Cited by 2 | Viewed by 2861
Abstract
Land use land cover (LULC) significantly impacts local circulation in the Mexico Basin, particularly wind field circulations such as gap winds, convergence lines, and thermally induced upslope/downslope wind. A case study with a high-pressure system over the Mexico Basin isolates the influence of [...] Read more.
Land use land cover (LULC) significantly impacts local circulation in the Mexico Basin, particularly wind field circulations such as gap winds, convergence lines, and thermally induced upslope/downslope wind. A case study with a high-pressure system over the Mexico Basin isolates the influence of large-scale synoptic forcing. Numerical simulations reveal a wind system composed of meridional circulation and a zonal component. Thermal pressure gradients between the Mexico basin and its colder surroundings create near-surface convergence lines as part of the meridional circulation. Experiments show that the intensity and organization of meridional circulations and downslope winds increase when LULC changes from natural and cultivated land to urban. Zonal circulation exhibits a typical circulation pattern with the upslope flow and descending motion in the middle of the basin. Large values of moist static energy are near the surface where air parcels pick up energy from the surface either as fluxes of enthalpy or latent heat. Surface heat fluxes and stored energy in the ground are drivers of local circulation, which is more evident in zonal circulation patterns. Full article
(This article belongs to the Special Issue Coastal and Urban Meteorology)
Show Figures

Figure 1

11 pages, 225 KiB  
Article
Compilation and Evaluation of Ambient Respirable Crystalline Silica Air Quality Data near Sand Quarries and Processing Facilities
by John Richards and Todd Brozell
Atmosphere 2021, 12(7), 903; https://doi.org/10.3390/atmos12070903 - 13 Jul 2021
Cited by 2 | Viewed by 2596
Abstract
Ambient respirable crystalline silica air quality is of concern to many communities near mineral processing facilities and to regulatory agencies serving these communities. Accurate air quality data are needed to compare measured respirable crystalline silica concentrations at the fencelines of mineral processing facilities [...] Read more.
Ambient respirable crystalline silica air quality is of concern to many communities near mineral processing facilities and to regulatory agencies serving these communities. Accurate air quality data are needed to compare measured respirable crystalline silica concentrations at the fencelines of mineral processing facilities with the published health effect guideline published by the California Office of Health Hazard Assessment (OEHHA). This article is a compilation and evaluation of air quality studies around a diverse set of nineteen sand producing facilities. The respirable crystalline silica air quality data compiled by Air Control Techniques, P.C. and most of the data compiled by other researchers cited in this article have been measured using EPA Reference Method samplers adjusted for respirable crystalline silica sampling and NIOSH Method 7500 X-ray diffraction analyses. The authors conclude that (1) the ambient concentrations in the diverse set of mineral processing facilities were consistently lower than the 3.0 microgram per cubic meter chronic reference exposure level (REL) adopted by OEHHA, (2) upwind-to-downwind fenceline concentration differences were small, and (3) the fenceline t concentrations were often at background concentration levels. The authors recommend additional sampling studies to better characterize background concentrations of ambient respirable crystalline silica. Full article
(This article belongs to the Collection Measurement of Exposure to Air Pollution)
24 pages, 12261 KiB  
Article
Evaluating the Forecast Skill of a Hydrometeorological Modelling System in Greece
by George Varlas, Anastasios Papadopoulos, George Papaioannou and Elias Dimitriou
Atmosphere 2021, 12(7), 902; https://doi.org/10.3390/atmos12070902 - 13 Jul 2021
Cited by 10 | Viewed by 2641
Abstract
A hydrometeorological forecasting system has been operating at the Institute of Marine Biological Resources and Inland Waters (IMBRIW) of the Hellenic Centre for Marine Research (HCMR) since September 2015. The system consists of the Advanced Weather Research and Forecasting (WRF-ARW) model, the WRF-Hydro [...] Read more.
A hydrometeorological forecasting system has been operating at the Institute of Marine Biological Resources and Inland Waters (IMBRIW) of the Hellenic Centre for Marine Research (HCMR) since September 2015. The system consists of the Advanced Weather Research and Forecasting (WRF-ARW) model, the WRF-Hydro hydrological model, and the HEC-RAS hydraulic–hydrodynamic model. The system provides daily 120 h weather forecasts focusing on Greece (4 km horizontal resolution) and hydrological forecasts for the Spercheios and Evrotas rivers in Greece (100 m horizontal resolution), also providing flash flood inundation forecasts when needed (5 m horizontal resolution). The main aim of this study is to evaluate precipitation forecasts produced in a 4-year period (September 2015–August 2019) using measurements from meteorological stations across Greece. Water level forecasts for the Evrotas and Spercheios rivers were also evaluated using measurements from hydrological stations operated by the IMBRIW. Moreover, the forecast skill of the chained meteorological–hydrological–hydraulic operation of the system was investigated during a catastrophic flash flood in the Evrotas river. The results indicated that the system provided skillful precipitation and water level forecasts. The best evaluation results were yielded during rainy periods. They also demonstrated that timely flash flood forecasting products could benefit flood warning and emergency responses due to their efficiency and increased lead time. Full article
Show Figures

Figure 1

18 pages, 4435 KiB  
Article
Nitrogen Oxides (NOx) in the Arctic Troposphere at Ny-Ålesund (Svalbard Islands): Effects of Anthropogenic Pollution Sources
by Antonietta Ianniello, Roberto Salzano, Rosamaria Salvatori, Giulio Esposito, Francesca Spataro, Mauro Montagnoli, Rosanna Mabilia and Antonello Pasini
Atmosphere 2021, 12(7), 901; https://doi.org/10.3390/atmos12070901 - 13 Jul 2021
Cited by 2 | Viewed by 2815
Abstract
Atmospheric measurements of nitrogen oxides (NOx = NO + NO2), ozone (O3) and other constituents were carried out during three field campaigns (29 March–30 April 2010, 1–26 April 2011, 18 May–8 October 2015) at Ny-Ålesund. The study focused [...] Read more.
Atmospheric measurements of nitrogen oxides (NOx = NO + NO2), ozone (O3) and other constituents were carried out during three field campaigns (29 March–30 April 2010, 1–26 April 2011, 18 May–8 October 2015) at Ny-Ålesund. The study focused on the variability of important O3 precursors, such as NOx, in the Arctic troposphere, and on the impact from anthropogenic sources on their measured concentrations: higher NO and NO2 levels were mostly associated with the lowest wind speeds and northern directions, indicating local pollution. Long-range transported sources from Russia and Europe were also identified with an occurrence of high NOx levels. Several ozone depletion events were observed and associated to winds blowing from the north-west direction (Arctic Ocean). Most of these events were connected to the lower NO and NO2 concentrations. Measurements of halogen and low molecular weight carbonyl compounds in 2010 and 2011, respectively, showed variable effects during the ozone depletion events. Other data, such as high time-resolved radon progeny measurements, were used in 2015 to identify source tracking and transport of air masses, local effects and atmospheric stability dynamics that could influence the NOx concentrations at Ny-Ålesund. Full article
(This article belongs to the Special Issue Air Pollution in the Polar Regions: Levels, Sources and Trends)
Show Figures

Figure 1

Previous Issue
Next Issue
Back to TopTop