
Secondary Organic Aerosols in PM2.5 in Bengbu, a Typical City in Central China: Concentration, Seasonal Variation and Sources


Abstract
:1. Introduction
2. Experimental Section
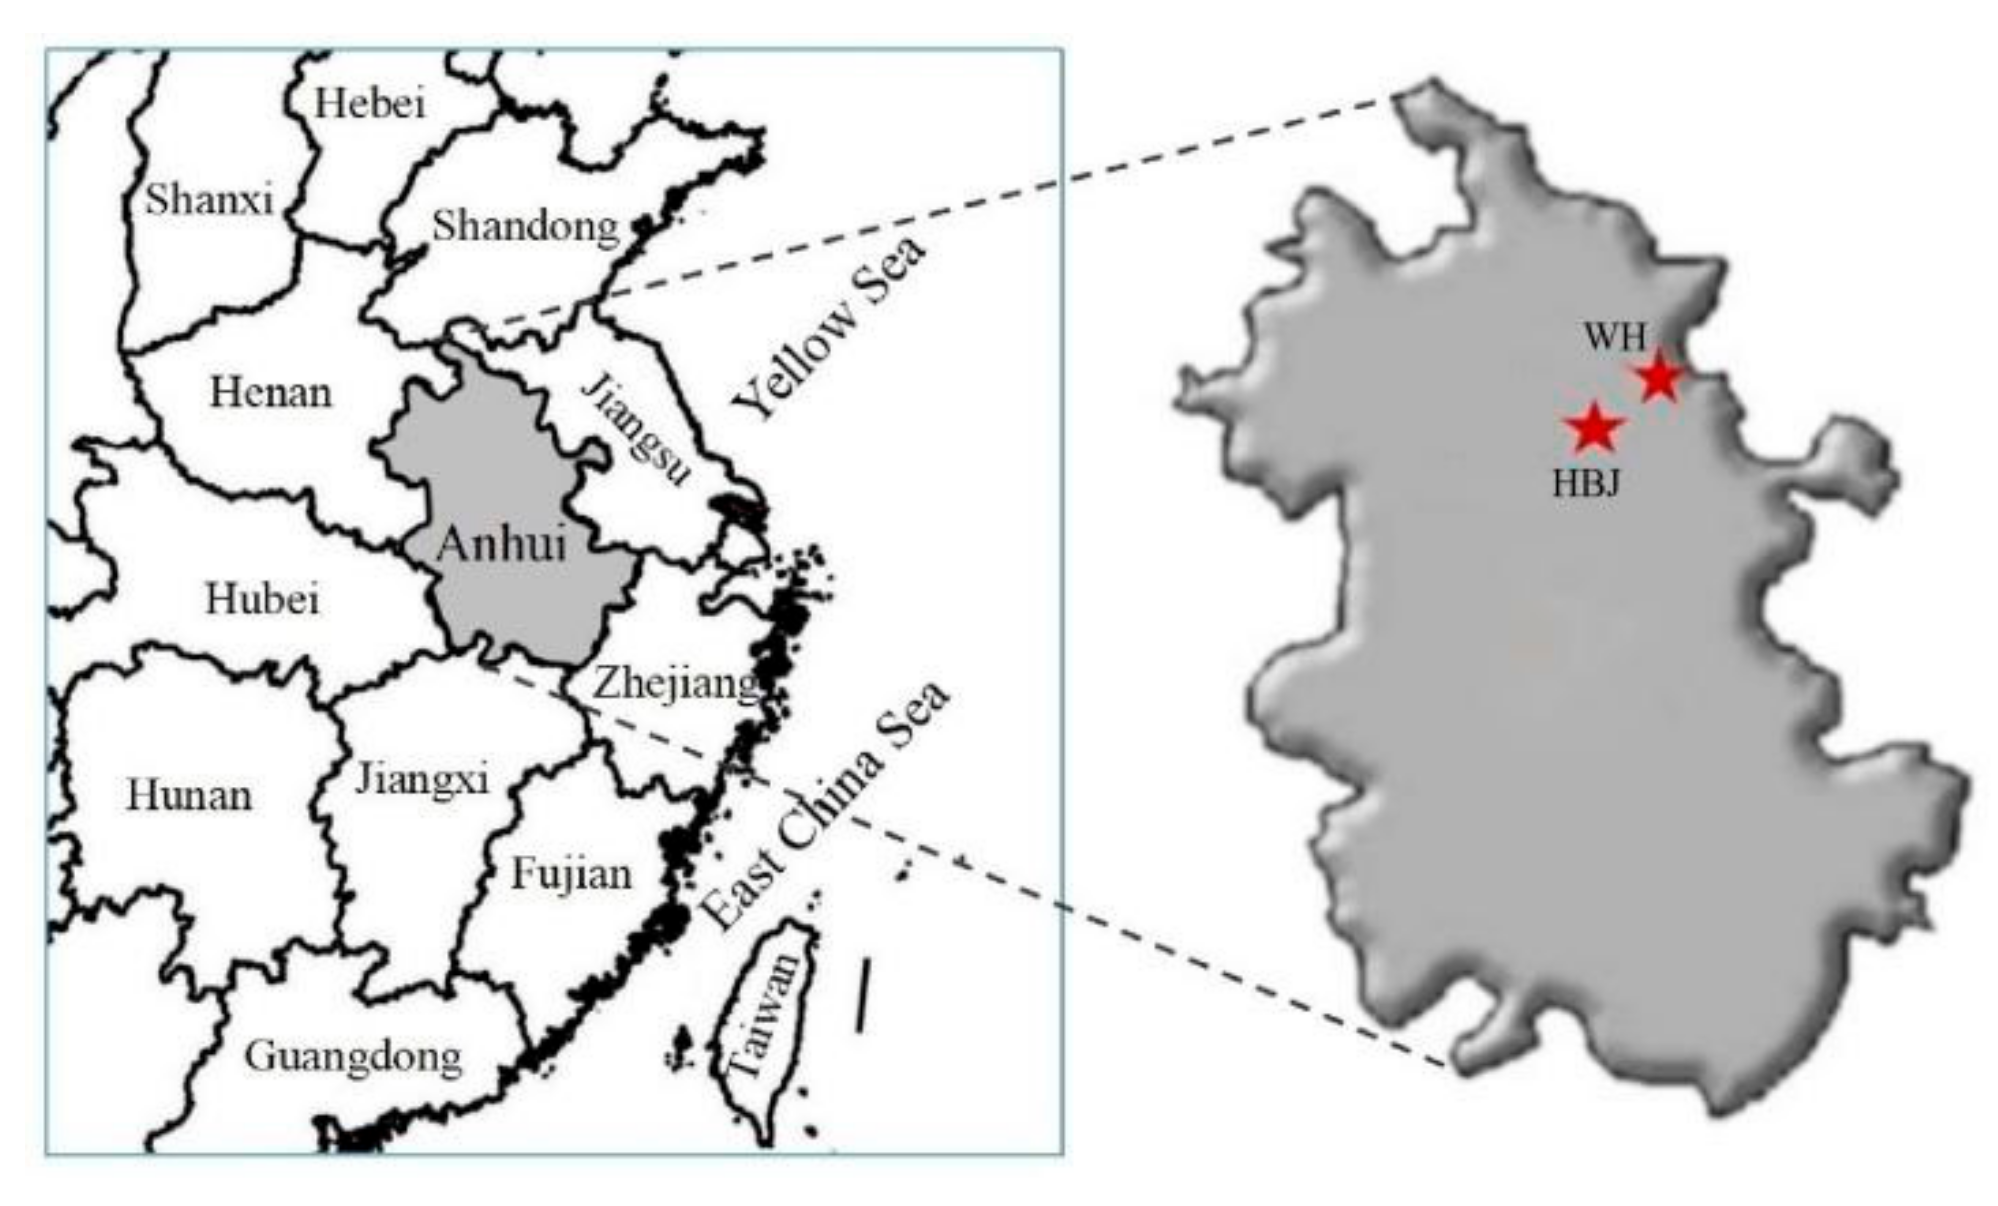
2.1. Sampling
2.2. Chemical Analysis
2.3. Quality Assurance/Quality Control
3. Results and Discussion
3.1. Characteristics of Carbonaceous Components
3.1.1. OC and EC
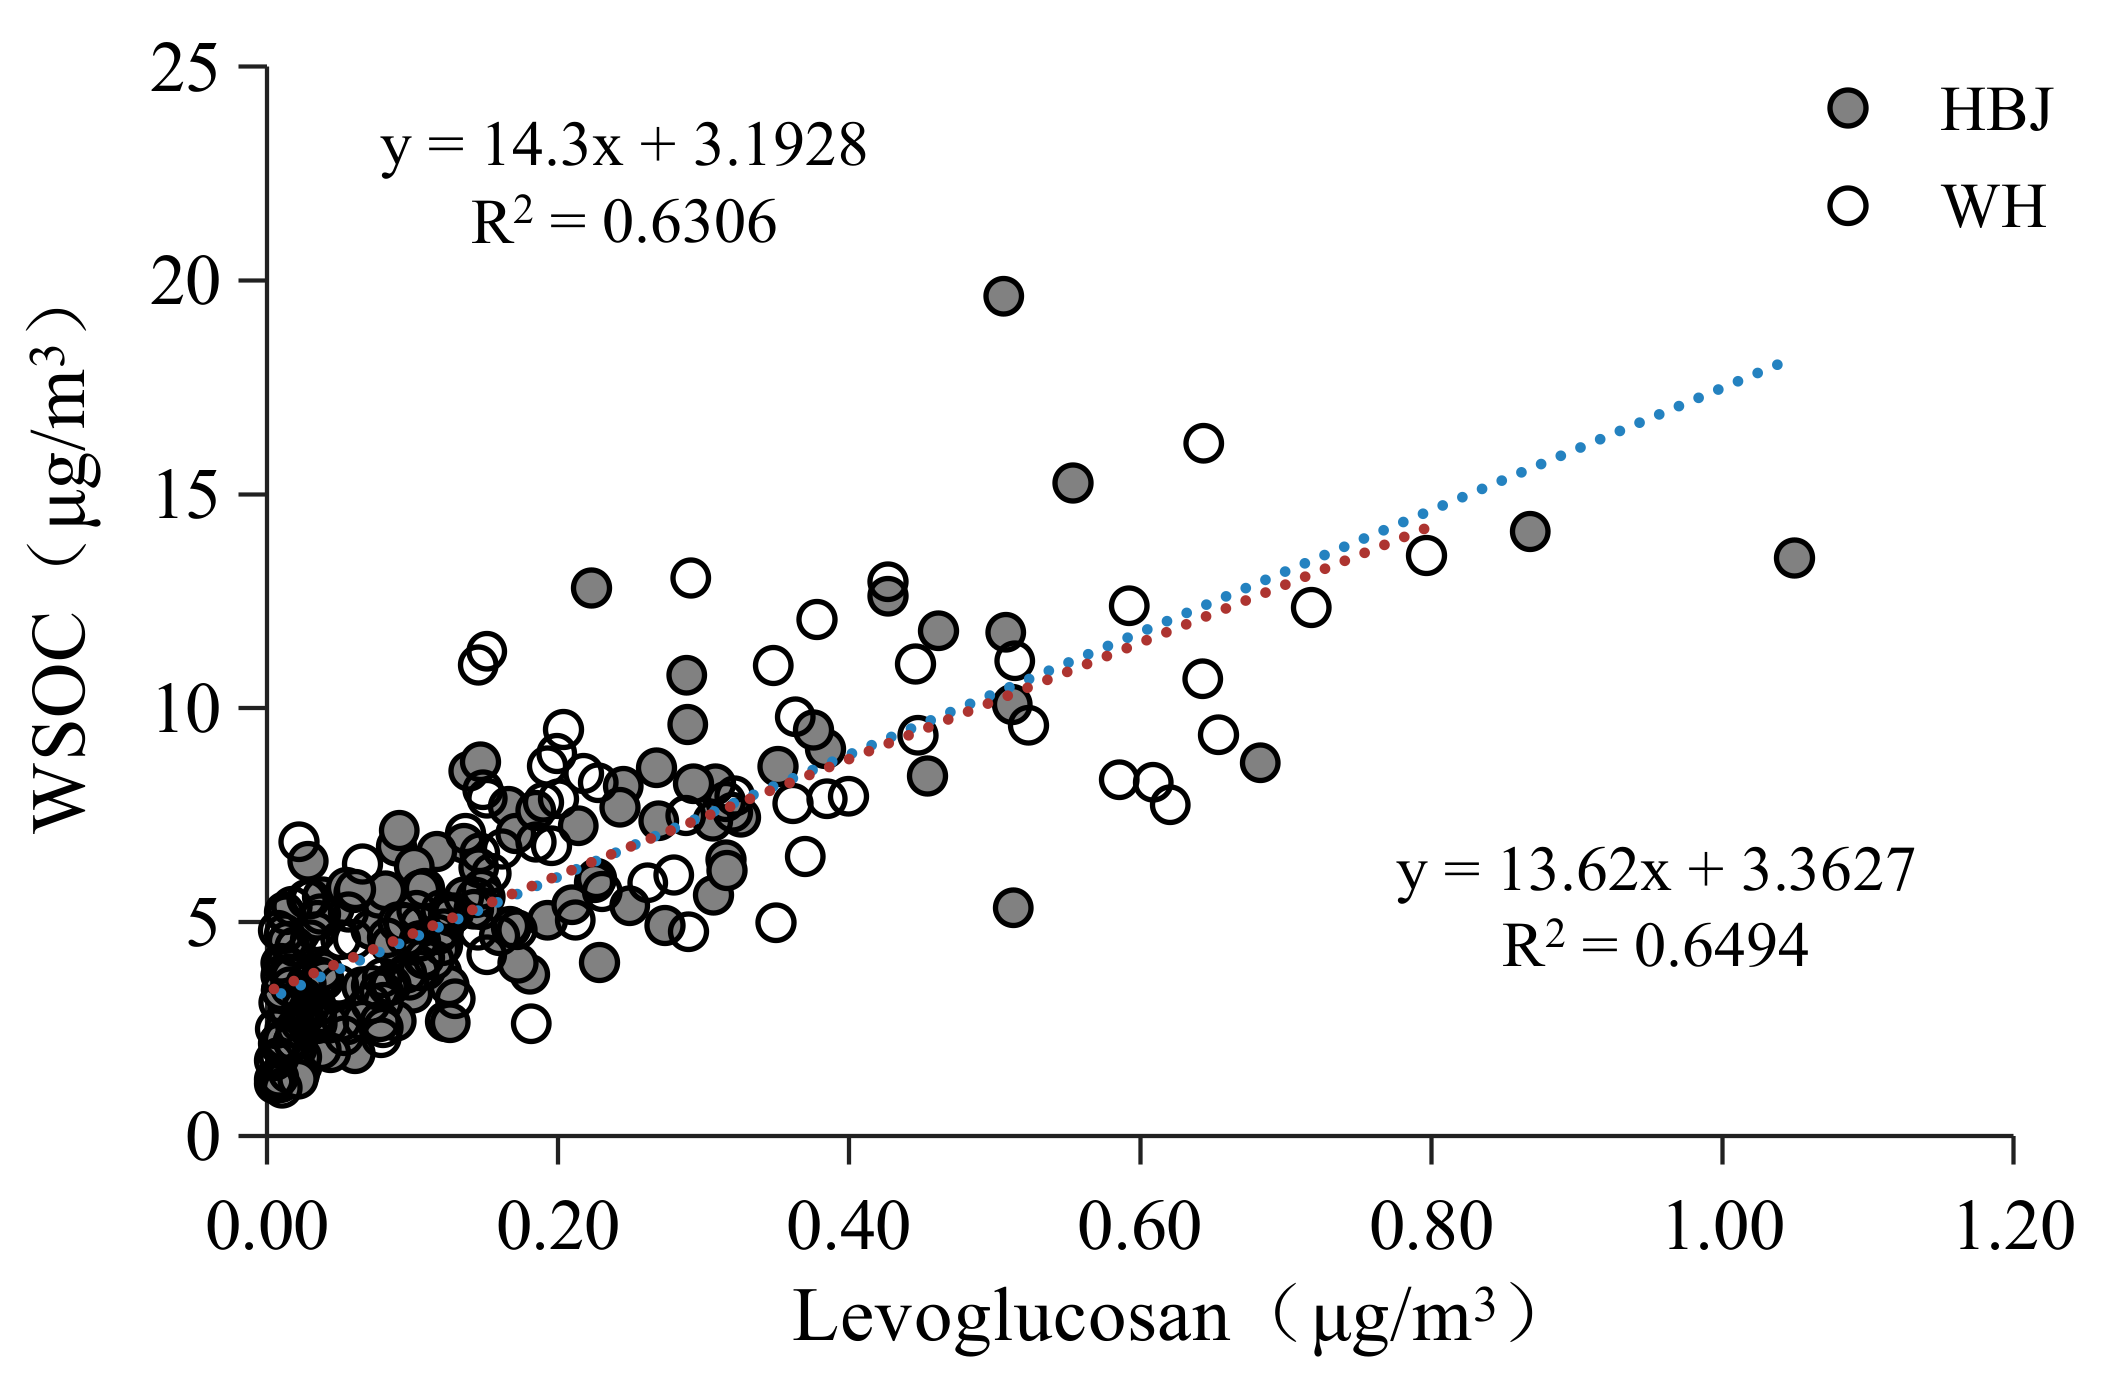
3.1.2. WSOC
3.2. Concentration and Composition of SOA Tracers
3.2.1. Isoprene SOA Tracers
3.2.2. Monoterpene SOA Tracers
3.2.3. β-caryophyllene SOA Tracers
3.2.4. Toluene SOA Tracers
3.3. Estimation of the Concentration and Contribution of SOC
3.3.1. Estimation of SOC Based on the OC/EC Ratio
3.3.2. Estimation of SOC Based on WSOC Concentration
3.3.3. Estimation of SOC with the Tracer Yield Method
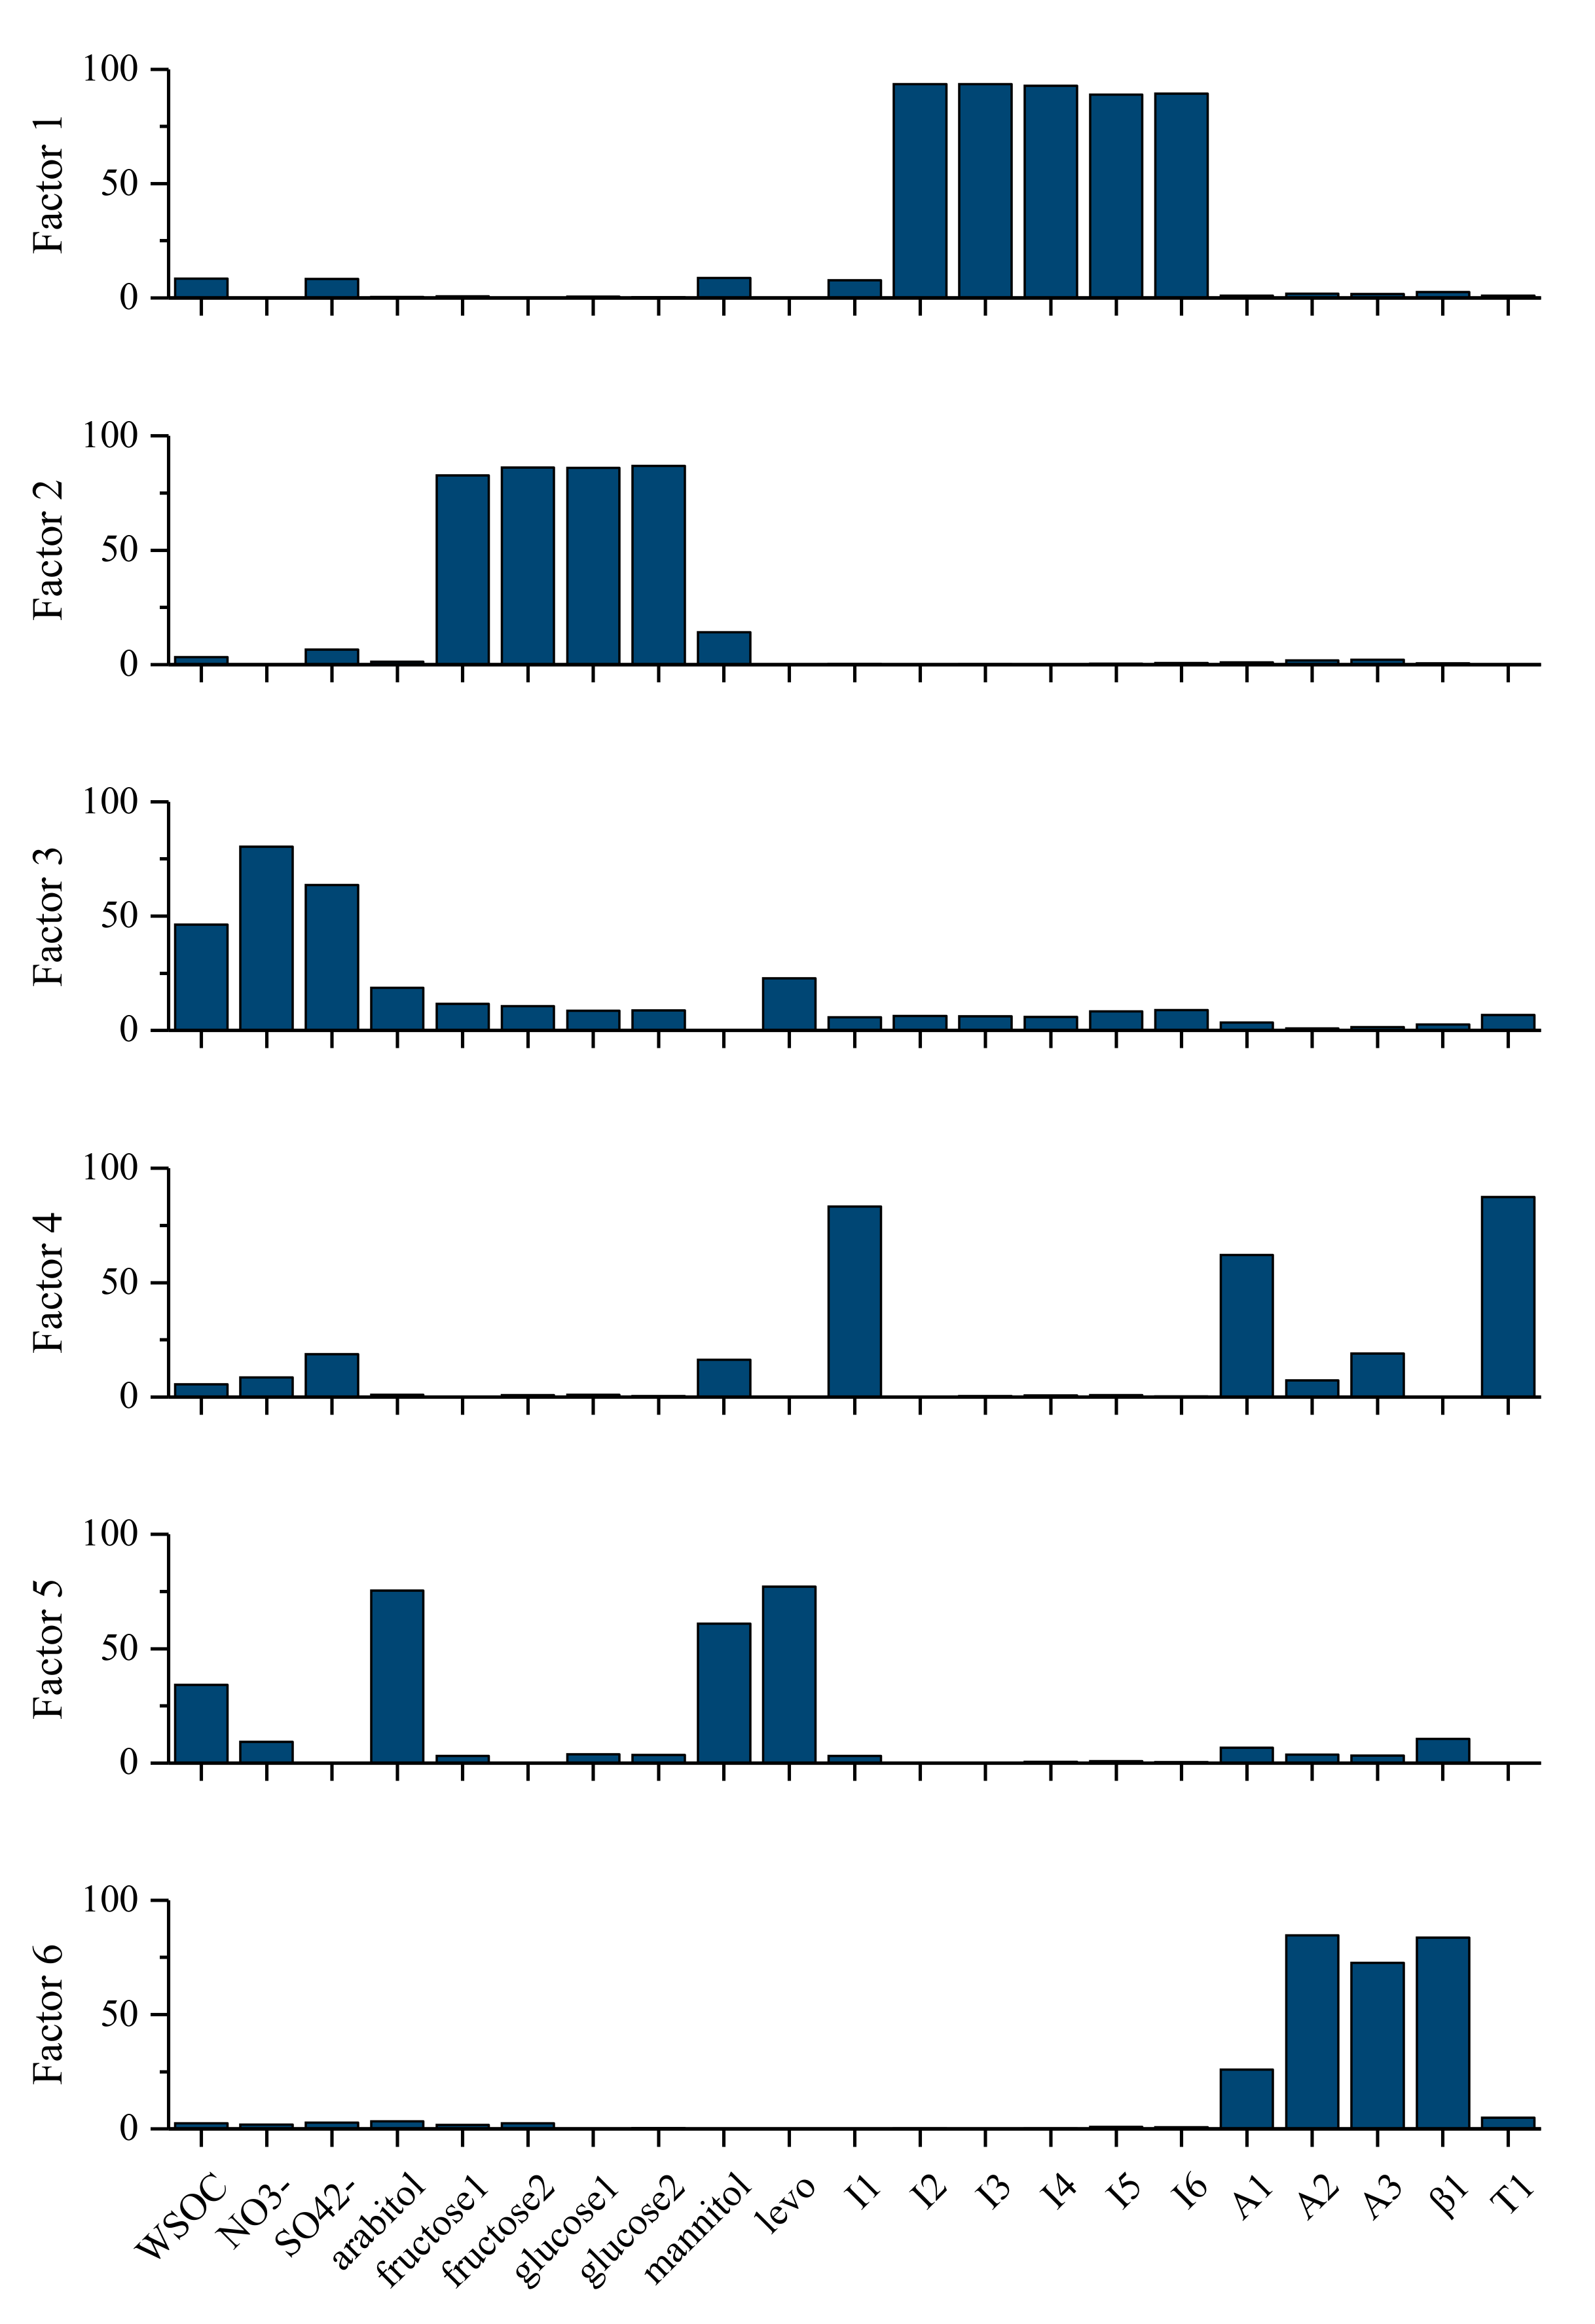
3.3.4. Estimation of SOC with PMF
3.3.5. Comparison of Different Methods
4. Conclusions
Author Contributions
Funding
Institutional Review Board Statement
Informed Consent Statement
Data Availability Statement
Conflicts of Interest
References
- Claeys, M.; Graham, B.; Vas, G.; Wang, W.; Vermeylen, R.; Pashynska, V.; Cafmeyer, J.; Guyon, P.; Andreae, M.O.; Artaxo, P.; et al. Formation of secondary organic aerosols through photooxidation of isoprene. Science 2004, 303, 1173–1176. [Google Scholar] [CrossRef] [PubMed] [Green Version]
- Jang, M.S.; Czoschke, N.M.; Lee, S.; Kamens, R.M. Heterogeneous atmospheric aerosol production by acid-catalyzed particle-phase reactions. Science 2002, 298, 814–817. [Google Scholar] [CrossRef] [PubMed]
- Jimenez, J.L.; Canagaratna, M.R.; Donahue, N.M.; Prevot, A.S.H.; Zhang, Q.; Kroll, J.H.; DeCarlo, P.F.; Allan, J.D.; Coe, H.; Ng, N.L.; et al. Evolution of organic aerosols in the atmosphere. Science 2009, 326, 1525–1529. [Google Scholar] [CrossRef] [PubMed]
- Griffin, R.J.; Cocker, D.R.; Seinfeld, J.H.; Dabdub, D. Estimate of global atmospheric organic aerosol from oxidation of biogenic hydrocarbons. Geophys. Res. Lett. 1999, 26, 2721–2724. [Google Scholar] [CrossRef] [Green Version]
- Guenther, A.; Karl, T.; Harley, P.; Wiedinmyer, C.; Palmer, P.I.; Geron, C. Estimates of global terrestrial isoprene emissions using MEGAN (Model of Emissions of Gases and Aerosols from Nature). Atmos. Chem. Phys. 2006, 6, 3181–3210. [Google Scholar] [CrossRef] [Green Version]
- Duhl, T.R.; Helmig, D.; Guenther, A. Sesquiterpene emissions from vegetation: A review. Biogeosciences 2008, 5, 761–777. [Google Scholar] [CrossRef] [Green Version]
- Surratt, J.D.; Murphy, S.M.; Kroll, J.H.; Ng, N.L.; Hildebrandt, L.; Sorooshian, A.; Szmigielski, R.; Vermeylen, R.; Maenhaut, W.; Claeys, M.; et al. Chemical composition of secondary organic aerosol formed from the photooxidation of isoprene. J. Phys. Chem. A 2006, 110, 9665–9690. [Google Scholar] [CrossRef] [Green Version]
- Zhu, C.M.; Kawamura, K.; Fu, P.Q. Seasonal variations of biogenic secondary organic aerosol tracers in Cape Hedo, Okinawa. Atmos. Environ. 2016, 130, 113–119. [Google Scholar] [CrossRef]
- Kleindienst, T.E.; Jaoui, M.; Lewandowski, M.; Offenberg, J.H.; Lewis, C.W.; Bhave, P.V.; Edney, E.O. Estimates of the contributions of biogenic and anthropogenic hydrocarbons to secondary organic aerosol at a southeastern US location. Atmos. Environ. 2007, 41, 8288–8300. [Google Scholar] [CrossRef]
- Jaoui, M.; Lewandowski, M.; Kleindienst, T.E.; Offenberg, J.H.; Edney, E.O. beta-caryophyllinic acid: An atmospheric tracer for beta-caryophyllene secondary organic aerosol. Geophys. Res. Lett. 2007, 34, L05816. [Google Scholar] [CrossRef]
- Ding, X.; Wang, X.M.; Xie, Z.Q.; Zhang, Z.; Sun, L.G. Impacts of Siberian biomass burning on organic aerosols over the North Pacific Ocean and the Arctic: Primary and secondary organic tracers. Environ. Sci. Technol. 2013, 47, 3149–3157. [Google Scholar] [CrossRef]
- Lewandowski, M.; Piletic, I.R.; Kleindienst, T.E.; Offenberg, J.H.; Beaver, M.R.; Jaoui, M.; Docherty, K.S.; Edney, E.O. Secondary organic aerosol characterisation at field sites across the United States during the spring-summer period. Int. J. Environ. Anal. Chem. 2013, 93, 1084–1103. [Google Scholar] [CrossRef]
- Jaoui, M.; Kleindienst, T.E.; Lewandowski, M.; Offenberg, J.H.; Edney, E.O. Identification and quantification of aerosol polar oxygenated compounds bearing carboxylic or hydroxyl groups. 2. Organic tracer compounds from monoterpenes. Environ. Sci. Technol. 2005, 39, 5661–5673. [Google Scholar] [CrossRef]
- Farina, S.C.; Adams, P.J.; Pandis, S.N. Modeling global secondary organic aerosol formation and processing with the volatility basis set: Implications for anthropogenic secondary organic aerosol. J. Geophys. Res.-Atmos. 2010, 115, D09202. [Google Scholar] [CrossRef] [Green Version]
- Ding, X.; Wang, X.M.; Gao, B.; Fu, X.X.; He, Q.F.; Zhao, X.Y.; Yu, J.Z.; Zheng, M. Tracer-based estimation of secondary organic carbon in the Pearl River Delta, south China. J. Geophys. Res.-Atmos. 2012, 117, D05313. [Google Scholar] [CrossRef]
- Von Schneidemesser, E.; Zhou, J.B.; Stone, E.A.; Schauer, J.J.; Shpund, J.; Brenner, S.; Qasrawi, R.; Abdeen, Z.; Sarnat, J.A. Spatial variability of carbonaceous aerosol concentrations in East and West Jerusalem. Environ. Sci. Technol. 2010, 44, 1911–1917. [Google Scholar] [CrossRef]
- El-Sayed, M.M.H.; Ortiz-Montalvo, D.L.; Hennigan, C.J. The effects of isoprene and NOx on secondary organic aerosols formed through reversible and irreversible uptake to aerosol water. Atmos. Chem. Phys. 2018, 18, 1171–1184. [Google Scholar] [CrossRef] [Green Version]
- Xu, L.; Guo, H.Y.; Boyd, C.M.; Klein, M.; Bougiatioti, A.; Cerully, K.M.; Hite, J.R.; Isaacman-VanWertz, G.; Kreisberg, N.M.; Knote, C.; et al. Effects of anthropogenic emissions on aerosol formation from isoprene and monoterpenes in the southeastern United States. Proc. Natl. Acad. Sci. USA 2015, 112, 37–42. [Google Scholar] [CrossRef] [PubMed] [Green Version]
- Zhao, D.F.; Schmitt, S.H.; Wang, M.J.; Acir, I.H.; Tillmann, R.; Tan, Z.F.; Novelli, A.; Fuchs, H.; Pullinen, I.; Wegener, R.; et al. Effects of NOx and SO2 on the secondary organic aerosol formation from photooxidation of alpha-pinene and limonene. Atmos. Chem. Phys. 2018, 18, 1611–1628. [Google Scholar] [CrossRef] [Green Version]
- Froyd, K.D.; Murphy, S.M.; Murphy, D.M.; de Gouw, J.A.; Eddingsaas, N.C.; Wennberg, P.O. Contribution of isoprene-derived organosulfates to free tropospheric aerosol mass. Proc. Natl. Acad. Sci. USA 2010, 107, 21360–21365. [Google Scholar] [CrossRef] [PubMed] [Green Version]
- Zhang, Y.J.; Tang, L.L.; Sun, Y.L.; Favez, O.; Canonaco, F.; Albinet, A.; Couvidat, F.; Liu, D.T.; Jayne, J.T.; Wang, Z.; et al. Limited formation of isoprene epoxydiols-derived secondary organic aerosol under NOx-rich environments in Eastern China. Geophys. Res. Lett. 2017, 44, 2035–2043. [Google Scholar] [CrossRef] [Green Version]
- Ding, X.; He, Q.F.; Shen, R.Q.; Yu, Q.Q.; Wang, X.M. Spatial distributions of secondary organic aerosols from isoprene, monoterpenes, beta-caryophyllene, and aromatics over China during summer. J. Geophys. Res.-Atmos. 2014, 119, 11877–11891. [Google Scholar] [CrossRef]
- Ding, X.A.; Wang, X.M.; Zheng, M. The influence of temperature and aerosol acidity on biogenic secondary organic aerosol tracers: Observations at a rural site in the central Pearl River Delta region, South China. Atmos. Environ. 2011, 45, 1303–1311. [Google Scholar] [CrossRef]
- Feng, J.L.; Li, M.; Zhang, P.; Gong, S.Y.; Zhong, M.A.; Wu, M.H.; Zheng, M.; Chen, C.H.; Wang, H.L.; Lou, S.R. Investigation of the sources and seasonal variations of secondary organic aerosols in PM2.5 in Shanghai with organic tracers. Atmos. Environ. 2013, 79, 614–622. [Google Scholar] [CrossRef]
- Hu, D.; Bian, Q.; Li, T.W.Y.; Lau, A.K.H.; Yu, J.Z. Contributions of isoprene, monoterpenes, beta-caryophyllene, and toluene to secondary organic aerosols in Hong Kong during the summer of 2006. J. Geophys. Res.-Atmos. 2008, 113, D22206. [Google Scholar] [CrossRef]
- Tang, R.Z.; Wu, Z.P.; Li, X.; Wang, Y.J.; Shang, D.J.; Xiao, Y.; Li, M.R.; Zeng, L.M.; Wu, Z.J.; Hallquist, M.; et al. Primary and secondary organic aerosols in summer 2016 in Beijing. Atmos. Chem. Phys. 2018, 18, 4055–4068. [Google Scholar] [CrossRef] [Green Version]
- Li, R.; Li, Q.; Xu, J.; Li, L.; Ge, C.J.; Huang, L.; Sun, D.H.; Liu, Z.Y.; Zhang, K.; Zhou, G.Z.; et al. Regional air pollution process in winter over the Yangtze River Delta and its influence on typical northern cities. Huan Jing Ke Xue 2020, 41, 1520–1534. [Google Scholar] [PubMed]
- Feng, J.L.; Hu, M.; Chan, C.K.; Lau, P.S.; Fang, M.; He, L.Y.; Tang, X.Y. A comparative study of the organic matter in PM2.5 from three Chinese megacities in three different climatic zones. Atmos. Environ. 2006, 40, 3983–3994. [Google Scholar] [CrossRef]
- Mayol-Bracero, O.L.; Guyon, P.; Graham, B.; Roberts, G.; Andreae, M.O.; Decesari, S.; Facchini, M.C.; Fuzzi, S.; Artaxo, P. Water-soluble organic compounds in biomass burning aerosols over Amazonia—2. Apportionment of the chemical composition and importance of the polyacidic fraction. J. Geophys. Res.-Atmos. 2002, 107, 8091. [Google Scholar] [CrossRef]
- Ding, X.; Zheng, M.; Yu, L.P.; Zhang, X.L.; Weber, R.J.; Yan, B.; Russell, A.G.; Edgerton, E.S.; Wang, X.M. Spatial and seasonal trends in biogenic secondary organic aerosol tracers and water-soluble organic carbon in the southeastern United States. Environ. Sci. Technol. 2008, 42, 5171–5176. [Google Scholar] [CrossRef]
- Zhang, Y.X.; Shao, M.; Zhang, Y.H.; Zeng, L.M.; He, L.Y.; Zhu, B.; Wei, Y.J.; Zhu, X.L. Source profiles of particulate organic matters emitted from cereal straw burnings. J. Environ. Sci.-China 2007, 19, 167–175. [Google Scholar] [CrossRef]
- Lin, Y.H.; Knipping, E.M.; Edgerton, E.S.; Shaw, S.L.; Surratt, J.D. Investigating the influences of SO2 and NH3 levels on isoprene-derived secondary organic aerosol formation using conditional sampling approaches. Atmos. Chem. Phys. 2013, 13, 8457–8470. [Google Scholar] [CrossRef] [Green Version]
- Surratt, J.D.; Chan, A.W.H.; Eddingsaas, N.C.; Chan, M.N.; Loza, C.L.; Kwan, A.J.; Hersey, S.P.; Flagan, R.C.; Wennberg, P.O.; Seinfeld, J.H. Reactive intermediates revealed in secondary organic aerosol formation from isoprene. Proc. Natl. Acad. Sci. USA 2010, 107, 6640–6645. [Google Scholar] [CrossRef] [PubMed] [Green Version]
- D’Ambro, E.L.; Schobesberger, S.; Gaston, C.J.; Lopez-Hilfiker, F.D.; Lee, B.; Liu, J.; Zelenyuk, A.; Bell, D.; Cappa, C.D.; Helgestad, T.; et al. Chamber-based insights into the factors controlling epoxydiol (IEPOX) secondary organic aerosol (SOA) yield, composition, and volatility. Atmos. Chem. Phys. 2019, 19, 11253–11265. [Google Scholar] [CrossRef] [Green Version]
- Zhang, H.; Surratt, J.D.; Lin, Y.H.; Bapat, J.; Kamens, R.M. Effect of relative humidity on SOA formation from isoprene/NO photooxidation: Enhancement of 2-methylglyceric acid and its corresponding oligoesters under dry conditions. Atmos. Chem. Phys. 2011, 11, 6411–6424. [Google Scholar] [CrossRef] [Green Version]
- Fu, P.Q.; Kawamura, K.; Kanaya, Y.; Wang, Z.F. Contributions of biogenic volatile organic compounds to the formation of secondary organic aerosols over Mt Tai, Central East China. Atmos. Environ. 2010, 44, 4817–4826. [Google Scholar] [CrossRef] [Green Version]
- Hong, Z.Y.; Zhang, H.; Zhang, Y.R.; Xu, L.L.; Liu, T.T.; Xiao, H.; Hong, Y.W.; Chen, J.S.; Li, M.R.; Deng, J.J.; et al. Secondary organic aerosol of PM2.5 in a mountainous forest area in southeastern China: Molecular compositions and tracers implication. Sci. Total. Environ. 2019, 653, 496–503. [Google Scholar] [CrossRef]
- Pesonen, M.; Suomela, S.; Kuuliala, O.; Henriks-Eckerman, M.-L.; Aalto-Korte, K. Occupational contact dermatitis caused by d-limonene. Contact Dermat. 2014, 71, 273–279. [Google Scholar] [CrossRef]
- Kleindienst, T.E.; Conver, T.S.; McIver, C.D.; Edney, E.O. Determination of secondary organic aerosol products from the photooxidation of toluene and their implications in ambient PM2.5. J. Atmos. Chem. 2004, 47, 79–100. [Google Scholar] [CrossRef]
- Turpin, B.J.; Huntzicker, J.J. Identification of secondary organic aerosol episodes and quantitation of primary and secondary organic aerosol concentrations during SCAQS. Atmos. Environ. 1995, 29, 3527–3544. [Google Scholar] [CrossRef]
- Weber, R.J.; Sullivan, A.P.; Peltier, R.E.; Russell, A.; Yan, B.; Zheng, M.; de Gouw, J.; Warneke, C.; Brock, C.; Holloway, J.S.; et al. A study of secondary organic aerosol formation in the anthropogenic-influenced southeastern United States. J. Geophys. Res.-Atmos. 2007, 112, D13302. [Google Scholar] [CrossRef]
- Ding, X.; Zheng, M.; Edgerton, E.S.; Jansen, J.J.; Wang, X.M. Contemporary or fossil origin: Split of estimated secondary organic carbon in the southeastern United States. Environ. Sci. Technol. 2008, 42, 9122–9128. [Google Scholar] [CrossRef] [PubMed]
- Xiao, R.; Takegawa, N.; Zheng, M.; Kondo, Y.; Miyazaki, Y.; Miyakawa, T.; Hu, M.; Shao, M.; Zeng, L.; Gong, Y.; et al. Characterization and source apportionment of submicron aerosol with aerosol mass spectrometer during the PRIDE-PRD 2006 campaign. Atmos. Chem. Phys. 2011, 11, 6911–6929. [Google Scholar] [CrossRef] [Green Version]
- Castro, L.M.; Pio, C.A.; Harrison, R.M.; Smith, D.J.T. Carbonaceous aerosol in urban and rural European atmospheres: Estimation of secondary organic carbon concentrations. Atmos. Environ. 1999, 33, 2771–2781. [Google Scholar] [CrossRef]
- Szidat, S.; Jenk, T.M.; Synal, H.A.; Kalberer, M.; Wacker, L.; Hajdas, I.; Kasper-Giebl, A.; Baltensperger, U. Contributions of fossil fuel, biomass-burning, and biogenic emissions to carbonaceous aerosols in Zurich as traced by C-14. J. Geophys. Res.-Atmos. 2006, 111, D07206. [Google Scholar] [CrossRef] [Green Version]
- Kondo, Y.; Miyazaki, Y.; Takegawa, N.; Miyakawa, T.; Weber, R.J.; Jimenez, J.L.; Zhang, Q.; Worsnop, D.R. Oxygenated and water-soluble organic aerosols in Tokyo. J. Geophys. Res.-Atmos. 2007, 112, D01203. [Google Scholar] [CrossRef]
- Simoneit, B.; Elias, V.O.; Kobayashi, M.; Kawamura, K.; Rushdi, A.I.; Medeiros, P.M.; Rogge, W.F.; Didyk, B.M. Sugars-dominant water-soluble organic compounds in soils and characterization as tracers in atmospheric particulate matter. Environ. Sci. Technol. 2004, 38, 5939–5949. [Google Scholar] [CrossRef]


| HBJ | WH | |||||||
|---|---|---|---|---|---|---|---|---|
| Spring | Summer | Autumn | Winter | Spring | Summer | Autumn | Winter | |
| OC (μg·m−3) | 8.09 ± 4.06 | 5.30 ± 1.61 | 9.05 ± 4.00 | 14.74 ± 7.20 | 8.63 ± 4.25 | 5.36 ± 1.98 | 8.97 ± 3.85 | 16.02 ± 6.55 |
| EC (μg·m−3) | 1.40 ± 0.76 | 0.87 ± 0.20 | 1.82 ± 0.98 | 2.70 ± 1.52 | 1.24 ± 0.64 | 0.68 ± 0.17 | 1.69 ± 0.89 | 2.46 ± 1.22 |
| WSOC (μg·m−3) | 4.43 ± 2.17 | 3.17 ± 1.22 | 6.08 ± 2.15 | 8.08 ± 4.08 | 4.74 ± 2.30 | 3.46 ± 1.41 | 6.47 ± 2.46 | 8.14 ± 3.63 |
| OC/EC | 5.78 ± 1.20 | 6.10 ± 1.19 | 4.98 ± 0.71 | 5.46 ± 1.62 | 6.96 ± 1.47 | 7.87 ± 1.33 | 5.30 ± 0.75 | 6.51 ± 1.98 |
| WSOC/OC | 0.55 ± 0.09 | 0.60 ± 0.07 | 0.67 ± 0.12 | 0.55 ± 0.08 | 0.55 ± 0.08 | 0.65 ± 0.06 | 0.72 ± 0.09 | 0.51 ± 0.08 |
| Levoglucosan (ng·m−3) | 95.11 ± 81.28 | 16.72 ± 4.06 | 158.02 ± 86.82 | 328.69 ± 214.40 | 148.35 ± 195.32 | 18.09 ± 11.42 | 218.29 ± 120.79 | 298.72 ± 223.85 |
| T (°C) | 16.0 ± 3.7 | 28.4 ± 2.8 | 17.2 ± 3.4 | 2.7 ± 2.0 | 15.4 ± 3.1 | 27.9 ± 2.4 | 17.2 ± 3.3 | 2.2 ± 2.1 |
| RH (%) | 71.8 ± 14.2 | 75.4 ± 5.7 | 71.6 ± 9.7 | 80.7 ± 14.6 | 80.1 ± 12.0 | 80.0 ± 6.6 | 72.8 ± 10.2 | 80.2 ± 14.0 |
| SOA Tracers | HBJ | WH | ||||||
|---|---|---|---|---|---|---|---|---|
| (ng·m−3) | Spring | Summer | Autumn | Winter | Spring | Summer | Autumn | Winter |
| 2-Methylglyceric acid (I1) | 2.94 ± 1.92 | 6.00 ± 3.14 | 2.01 ± 1.61 | 1.68 ± 1.03 | 1.56 ± 1.34 | 5.79 ± 5.80 | 2.85 ± 2.37 | 2.15 ± 1.88 |
| cis-2-Methyl-1,3,4-trihydroxy-1-butene (I2) | 0.08 ± 0.20 | 4.63 ± 4.63 | 0.21 ± 0.29 | 0.06 ± 0.04 | 0.07 ± 0.16 | 4.67 ± 5.02 | 0.33 ± 0.46 | 0.07 ± 0.05 |
| Methyl-2,3,4-trihydroxy-1-butene (I3) | 0.09 ± 0.20 | 5.15 ± 5.40 | 0.20 ± 0.30 | 0.05 ± 0.03 | 0.09 ± 0.21 | 5.63 ± 5.82 | 0.99 ± 0.81 | 0.07 ± 0.04 |
| trans-2-Methyl-1,3,4-trihydroxy-1-butene (I4) | 0.15 ± 0.30 | 9.76 ± 7.91 | 0.59 ± 0.87 | 0.13 ± 0.09 | 0.13 ± 0.28 | 8.54 ± 9.27 | 0.90 ± 1.15 | 0.20 ± 0.20 |
| 2-Methylthreitol (I5) | 0.41 ± 0.45 | 5.77 ± 2.89 | 0.68 ± 0.68 | 0.24 ± 0.11 | 0.39 ± 0.44 | 7.80 ± 5.89 | 1.15 ± 1.14 | 0.26 ± 0.13 |
| 2-Methylerythritol (I6) | 1.11 ± 1.24 | 15.92 ± 8.05 | 1.59 ± 1.62 | 0.61 ± 0.25 | 1.04 ± 1.10 | 24.56 ± 21.34 | 2.78 ± 2.76 | 0.64 ± 0.27 |
| 2-Methyltetrols | 1.52 ± 1.69 | 21.69 ± 10.81 | 2.27 ± 2.29 | 0.85 ± 0.35 | 1.43 ± 1.53 | 32.36 ± 27.14 | 3.93 ± 3.89 | 0.90 ± 0.39 |
| C5-alkene triols | 0.32 ± 0.70 | 19.54 ± 17.62 | 1.00 ± 1.47 | 0.24 ± 0.15 | 0.29 ± 0.64 | 18.84 ± 19.64 | 2.22 ± 1.98 | 0.34 ± 0.23 |
| Sum of isoprene SOA tracer | 4.79 ± 3.22 | 47.22 ± 28.34 | 5.28 ± 4.93 | 2.77 ± 1.33 | 3.28 ± 3.10 | 56.98 ± 43.01 | 9.01 ± 7.68 | 3.38 ± 2.27 |
| 3-Hydroxyglutaric acid (A1) | 0.28 ± 0.19 | 0.68 ± 0.51 | 0.41 ± 0.27 | 0.36 ± 0.24 | 0.23 ± 0.21 | 0.40 ± 0.42 | 0.64 ± 0.51 | 0.49 ± 0.47 |
| 3-Hydroxy-4,4-dimethylglutaric acid (A2) | 0.83 ± 0.82 | 1.05 ± 1.83 | 1.39 ± 1.43 | 0.27 ± 0.40 | 0.51 ± 0.79 | 0.72 ± 1.04 | 1.91 ± 2.50 | 0.58 ± 1.09 |
| 3-Methyl-1,2,3-butyl-tricarboxylic acid (A3) | 0.34 ± 0.39 | 0.87 ± 1.05 | 0.57 ± 0.40 | 0.07 ± 0.08 | 0.22 ± 0.37 | 0.49 ± 0.79 | 0.66 ± 0.57 | 0.10 ± 0.16 |
| Sum of monoterpene SOA tracer | 1.45 ± 1.32 | 2.60 ± 3.17 | 2.37 ± 1.96 | 0.70 ± 0.62 | 0.96 ± 1.29 | 1.62 ± 1.85 | 3.20 ± 3.31 | 1.17 ± 1.62 |
| β-Caryophyllinic acid (β1) | 0.26 ± 0.23 | 0.05 ± 0.09 | 0.41 ± 0.34 | 0.06 ± 0.07 | 0.16 ± 0.23 | 0.02 ± 0.03 | 0.50 ± 0.46 | 0.26 ± 0.39 |
| 2,3-Dihydroxy-4-oxopentanoic acid (T1) | 0.57 ± 0.49 | 2.44 ± 1.75 | 0.72 ± 0.56 | 0.58 ± 0.51 | 0.39 ± 0.47 | 1.64 ± 1.58 | 1.14 ± 1.14 | 1.07 ± 1.34 |
| Spring | Summer | Autumn | Winter | |
|---|---|---|---|---|
| SOCEC-based | ||||
| HBJ | 2.91 ± 1.55 (36%) | 2.09 ± 1.16 (39%) | 2.32 ± 1.33 (26%) | 4.75 ± 3.15 (32%) |
| WH | 4.04 ± 2.06 (47%) | 2.84 ± 1.45 (53%) | 2.71 ± 1.18 (30%) | 6.92 ± 4.23 (43%) |
| SOCWSOC-based | ||||
| HBJ | 3.48 ± 1.64 (43%) | 3.00 ± 1.22 (57%) | 4.50 ± 1.83 (50%) | 4.79 ± 2.86 (33%) |
| WH | 3.26 ± 1.32 (38%) | 3.28 ± 1.36 (61%) | 4.29 ± 1.95 (48%) | 5.15 ± 2.28 (32%) |
| Spring | Summer | Autumn | Winter | |
|---|---|---|---|---|
| HBJ | ||||
| SOCIsoprene | 0.03 ± 0.02 (26%) | 0.30 ± 0.18 (49%) | 0.03 ± 0.03 (22%) | 0.02 ± 0.009 (18%) |
| SOCα-pinene | 0.01 ± 0.006 (5%) | 0.01 ± 0.01 (2%) | 0.01 ± 0.008 (7%) | 0.003 ± 0.003 (3%) |
| SOCβ-caryophyllene | 0.01 ± 0.01 (9%) | 0.002 ± 0.004 (0%) | 0.02 ± 0.01 (12%) | 0.003 ± 0.003 (3%) |
| SOCToluene | 0.07 ± 0.06 (60%) | 0.31 ± 0.22 (49%) | 0.09 ± 0.07 (59%) | 0.07 ± 0.06 (76%) |
| Sum | 0.12 ± 0.08 | 0.62 ± 0.36 | 0.15 ± 0.11 | 0.10 ± 0.07 |
| WH | ||||
| SOCIsoprene | 0.02 ± 0.02 (26%) | 0.37 ± 0.28 (63%) | 0.06 ± 0.05 (25%) | 0.02 ± 0.01 (13%) |
| SOCα-pinene | 0.004 ± 0.006 (5%) | 0.01 ± 0.008 (1%) | 0.01 ± 0.01 (6%) | 0.005 ± 0.007 (3%) |
| SOCβ-caryophyllene | 0.07 ± 0.01 (8%) | 0.001 ± 0.001 (0%) | 0.02 ± 0.02 (9%) | 0.01 ± 0.02 (6%) |
| SOCToluene | 0.05 ± 0.06 (60%) | 0.21 ± 0.20 (36%) | 0.14 ± 0.14 (60%) | 0.13 ± 0.17 (78%) |
| Sum | 0.08 ± 0.08 | 0.58 ± 0.39 | 0.24 ± 0.21 | 0.17 ± 0.20 |
| Spring | Summer | Autumn | Winter | |
|---|---|---|---|---|
| HBJ | 3.07 ± 1.31 (67%, 36%) | 2.72 ± 1.16 (91%, 51%) | 2.40 ± 1.00 (47%, 27%) | 4.24 ± 1.73 (55%, 29%) |
| WH | 3.40 ± 1.85 (70%, 38%) | 3.30 ± 1.82 (95%, 62%) | 2.87 ± 1.36 (46%, 33%) | 4.76 ± 2.45 (63%, 29%) |
| SOCIsoprene | SOCTerpenes | SOCToluene | SOCNS | BB | Soil | |
|---|---|---|---|---|---|---|
| Spring | 0 | 3 | 3 | 62 | 21 | 11 |
| Summer | 49 | 1 | 17 | 26 | 6 | 1 |
| Autumn | 3 | 5 | 5 | 33 | 52 | 2 |
| Winter | 0 | 1 | 2 | 56 | 40 | 1 |
Publisher’s Note: MDPI stays neutral with regard to jurisdictional claims in published maps and institutional affiliations. |
© 2021 by the authors. Licensee MDPI, Basel, Switzerland. This article is an open access article distributed under the terms and conditions of the Creative Commons Attribution (CC BY) license (https://creativecommons.org/licenses/by/4.0/).
Share and Cite
Zhang, S.; Tang, H.; Li, Q.; Li, L.; Ge, C.; Li, L.; Feng, J. Secondary Organic Aerosols in PM2.5 in Bengbu, a Typical City in Central China: Concentration, Seasonal Variation and Sources. Atmosphere 2021, 12, 854. https://doi.org/10.3390/atmos12070854
Zhang S, Tang H, Li Q, Li L, Ge C, Li L, Feng J. Secondary Organic Aerosols in PM2.5 in Bengbu, a Typical City in Central China: Concentration, Seasonal Variation and Sources. Atmosphere. 2021; 12(7):854. https://doi.org/10.3390/atmos12070854
Chicago/Turabian StyleZhang, Shiwei, Hao Tang, Qing Li, Liang Li, Chaojun Ge, Li Li, and Jialiang Feng. 2021. "Secondary Organic Aerosols in PM2.5 in Bengbu, a Typical City in Central China: Concentration, Seasonal Variation and Sources" Atmosphere 12, no. 7: 854. https://doi.org/10.3390/atmos12070854