Article

Characteristics of Aerosol and Effect of Aerosol-Radiation-Feedback in Handan, an Industrialized and Polluted City in China in Haze Episodes

1
School of Energy & Environment, Zhongyuan University of Technology, Zhengzhou 450007, China
2
Key Laboratory of Beijing on Regional Air Pollution Control, Beijing University of Technology, Beijing 100124, China
*
Author to whom correspondence should be addressed.
Atmosphere 2021, 12(6), 670; https://doi.org/10.3390/atmos12060670
Submission received: 18 March 2021 / Revised: 14 May 2021 / Accepted: 17 May 2021 / Published: 24 May 2021
(This article belongs to the Special Issue Aerosol Pollution in Asia)

Abstract

:
In order to investigate the chemical characteristics of aerosol pollution including PM1 and PM2.5 in Handan, the offline sampling campaign was conducted and the concentrations of total water-soluble inorganic ions (TWSI), carbonaceous components (OC and EC) were analyzed. The average concentrations were 88.5 μg/m3 for PM1 and 122 μg/m3 for PM2.5, and the corresponding ratios of PM1 versus PM2.5 on non-pollution, mild-moderate pollution and heavy pollution were 0.67, 0.70 and 0.77, respectively. TWSI and OC accounted for 43.2% and 15.4% in PM1, 41.8% and 16.0% in PM2.5. Secondary components in PM2.5 and PM1 increased with heavy pollution, SNA (SO42−, NO3 and NH4+) was enriched in PM1 but SOC (Secondary Organic Carbon) was more enriched in PM1–2.5. Furthermore, for evaluating the effect of aerosol feedback the WRF-Chem model was applied to identify the aerosol-radiation interaction of aerosol feedback influence on the PM2.5 concentration and various meteorological factors in Handan. The results indicated that the aerosol radiative effects will result in an average 32.62%(36.18 W/m2) decrease in downward short wave flux at ground surface (SWDOWN), an average 17.52% (39.15 m) and 0.16% (0.44 K) decrease in planetary boundary layer height(PBLH) and surface temperature (T2). The wind speed at 10 m (WS) and relative humidity (RH) will be increased by about 4.16%(0.11 m/s) and 1.89% (0.78%), respectively.

1. Introduction

Handan, a typical heavy industrial city located North China, is rich in iron ore and coal resources and its heavy industry as iron and steel, coking, power were highly developed. In 2017, Handan produced 36 million tons of crude steel and 12 million tons of coke, accounting for 45% of its GDP. However, affected by Stable weather conditions with high humidity and low wind speed combined with anthropogenic emissions [1], this city has been restricted by severe air quality problems especially particulate matter. Handan has the highest PM2.5 concentration in 74 key cities in China, which reached 86 μg/m3 in 2017, the average daily concentration is even as high as 316 μg/m3. Investigating characteristic of particulate matter pollution in Handan has great significance for revealing the causes of air pollution in developing countries and proposing emission reduction schemes. Some scholars have begun to discuss the topic of PM2.5 in Handan. Investigations based on model simulations [2] and studies on the spatial-temporal change and chemical characteristics of PM2.5 are conducted [3,4,5,6].
Due to the smaller particle size, larger specific surface area and higher number concentration, PM1 has greater impacts than PM2.5 on visibility and radiative climate forcing, further harmfully affect human health [7,8,9,10]. Furthermore, high concentration of aerosols has always strong feedback effect on meteorological factors in turn, by its feedback [11]. Many studies have shown that aerosol pollution is mainly influenced by weather constituents and anthropogenic activities [12,13,14]. Influenced by radiation feedback, meteorological conditions are increasingly steady, suppressing pollutants diffusion and then aggravate heavy pollution. However, our knowledge of PM1 pollution and its effect on meteorological factors in Handan region remains poor. Therefore, it is fundamental to obtain the PM1 and PM2.5 chemical components evolution characteristics including water soluble inorganic ions and carbonaceous components, and illustrate how aerosol feedback affect meteorological elements, in the heavy polluted city, Handan.
In this study, the PM2.5 and PM1 samples were collected in Handan from 15 October 2017 to 15 November 2017 and from 29 December 2017 to 26 January 2018. The observed PM2.5 and meteorological data were systematically analyzed. We also applied the Weather Research and Forecasting model coupled to Chemistry (WRF-Chem) model over the northern China to exhibit more exact data on aerosol feedbacks [15]. The impacts of aerosol feedbacks on meteorology including solar radiation (SWDOWN), temperature (T2), wind speed (WS), relative humidity (RH) and planetary boundary layer height (PBLH), as well as the concentration of PM2.5 were assessed via the scenario simulations.
The objectives of this paper are as follows: (1) to determine the characteristics of chemical compositions, such as water-soluble ions and carbonaceous components in PM1 and PM2.5; (2) to elucidate the impact of aerosol feedback mechanism on the PM2.5 concentration and various meteorological factors, such as T2, WS, PBLH and RH.

2. Material and Methodology

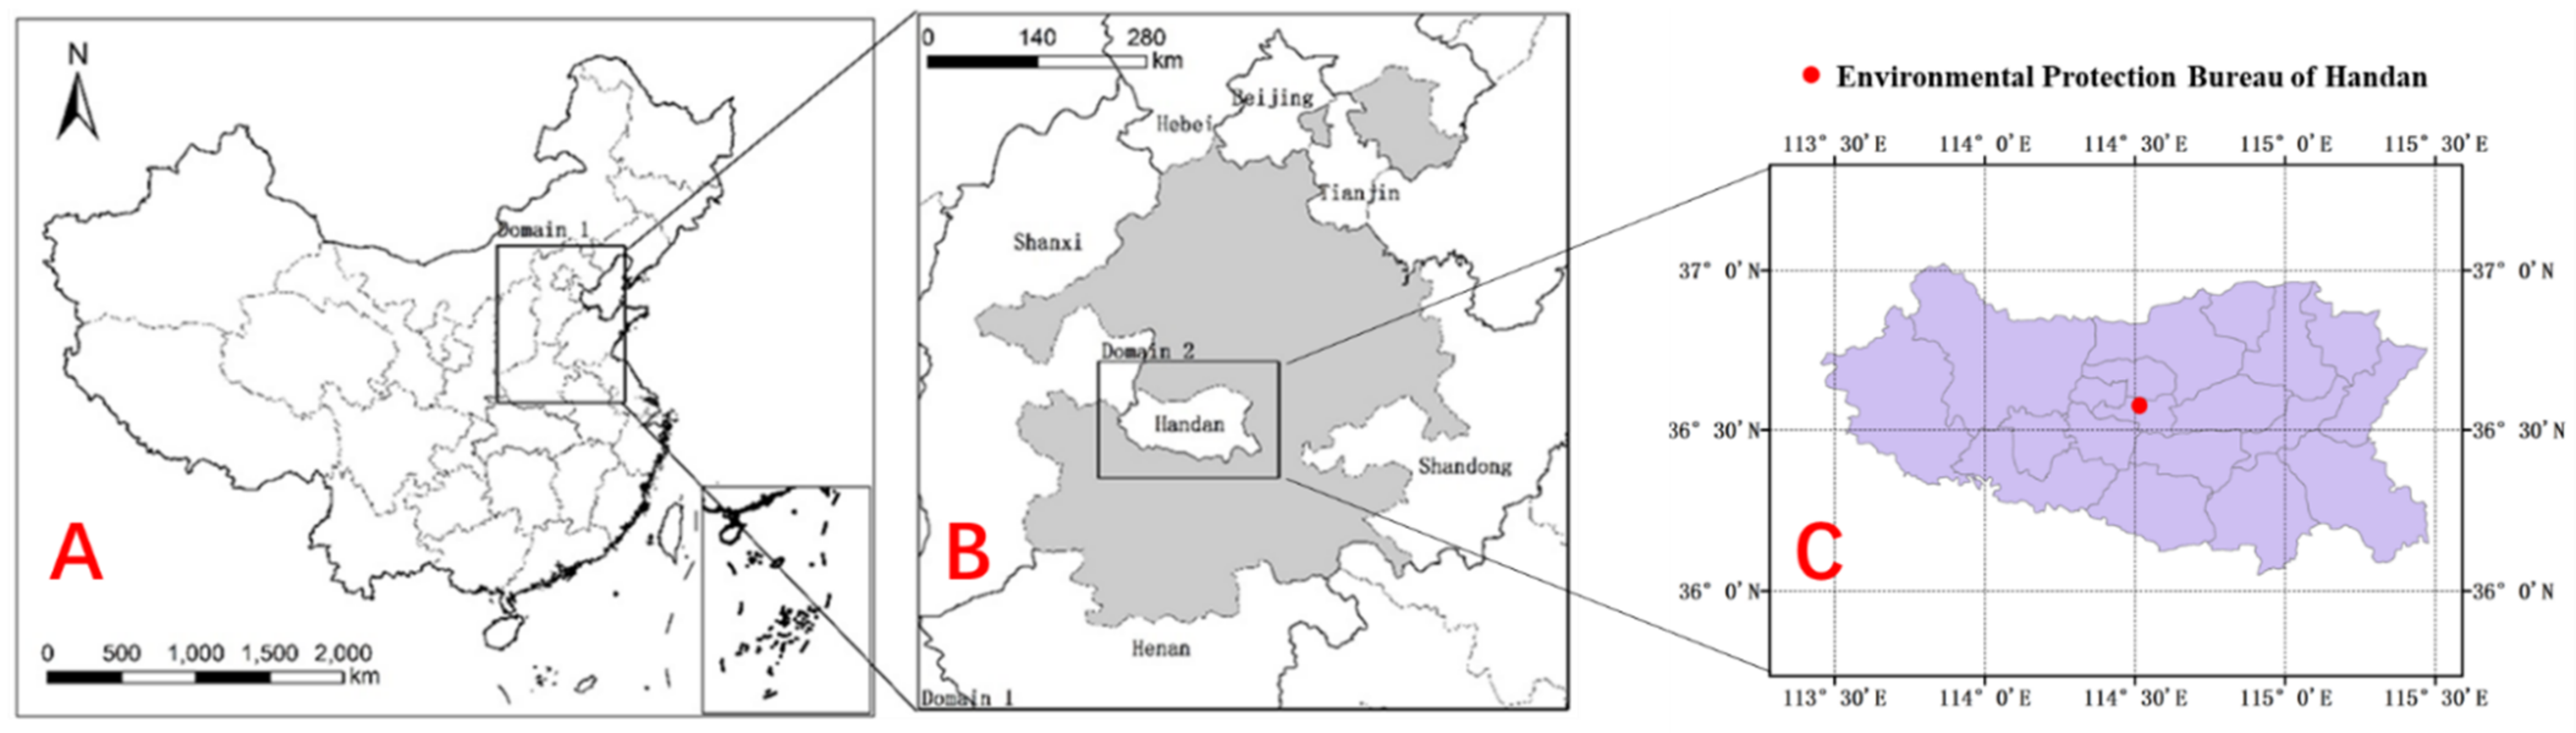
2.1. Sampling and Chemical Analysis

PM2.5 and PM1 was sampled during the adjacent periods, from 15 October 2017 to 15 November 2017 and from 29 December 2017 to 26 January 2018. A total of 61 daily samples were collected by a medium volume sampler (URG-3000ABC, USA) with a flow rate of 16.7 L/min. For the investigation of PM mass and inorganic particles the Teflon filters (47 mm, Whatman, UK) were utilized, while for the examination of carbonaceous species the quartz filters (47 mm, Whatman, UK) were used [16,17,18]. All filters were stored at <4 °C before investigation. The samples were collected on the rooftop (35 m above ground) of a building in Environmental Protection Bureau of Handan (36°61′ N, 115°51′ E), as shown in Figure 1c, surrounded with residential and traffic sources, but without remarkable industrial enterprise. Representing pollution characteristics of morning peak, the sampling time was from 10:00 a.m. to 9:00 a.m. of the next day. When special situation (rainy day and equipment failure) arose, we would adjust sampling time temporarily.
For analyzing PM mass concentrations, we used a microbalance (Sartorius-Denver TB-215 D, accuracy, 0.01 mg) to weigh Teflon filters before and after each sampling under 48 h stable condition(T = 20 ± 5 °C and RH = 40 ± 2%) (Yang et al., 2017). Half of each Teflon filter sample was extracted ultrasonically and the concentrations of eleven water-soluble ions (Na+, K+,Ca2+, Mg2+, NH4+, F, Cl, NO2, NO3, SO42−) were analyzed by Ion Chromatography (861 Advanced Compact IC, Metrohm) (Jia et al., 2018; Wang et al., 2017; Wang et al., 2018). Element carbon (EC) and organic carbon (OC) content was analyzed by thermal-optical reflectance carbon analysis method using DRI2001A (Chow et al., 2004). More detailed descriptions of the operation method was described in the Supplementary File and previous works (Wen et al., 2018).

2.2. Meteorological Data

Meteorological parameters including wind speed, wind direction, ground temperature, relative humidity, visibility and precipitation amount were obtained from the “China meteorological Information Centre” website (http://data.cma.cn, accessed on 12 May 2020). Data obtained from this website were supplied by Handan weather station which is located in Congtai Park (36°62′ N, 115°49′ E). All of the meteorological data were arranged according to the PM2.5 sampling time (10:00 a.m. to 9:00 a.m. of the next day).

2.3. Model Design and Verification

The WRF-Chem version 3.5.1 was applied for analyzing the aerosol-radiation feedback effect on the meteorological factors. In this study, a two-level nested computational domains were established with a spatial resolution of 9 km × 9 km for the large domain and a spatial resolution of 3 km × 3 km for the inner domain, which are denoted as Domain 1 and Domain 2, respectively (as shown in Figure 1a,b). The simulation period is consistent with the sampling time. Domain 1 covered “2 + 26” cities in Beijing-Tianjin-Hebei region and surrounding areas. Domain 2 covered Handan city and its surrounding cities including Anyang, Xingtai, Liaocheng, Yangquan and Puyang.
The emission inventory was calculated dependent on raw emissions data, emission coefficients and activity categories. More detailed depictions of the complete emission inventory which were utilized in this study could be found in previous works published by the researchers in the Key Laboratory of Beijing on Regional Air Pollution Control [19,20,21] and the raw emissions data in emission inventory were updated to 2017.
In this study, we employed National Center for Environmental Prediction (NCEP) Final Analysis (FNL) reanalysis data sets as the meteorological initial (IC) and boundary conditions (BC). The Carbon-Bond Mechanism version Z (CBMZ) [22] coupled with Model for Simulating Aerosol Interactions and Chemistry (MOSAIC) using 4 sectional aerosol bins were chosen as the gas-phase chemical mechanism and aerosol parameterization scheme [23]. We used Fast-J photolysis scheme to calculate photolysis rates. Furthermore, some physics options are selected in the simulation, such as Lin microphysics [21], the Goddard short wave scheme [24], RRTM long wave scheme [25], Noah land surface model, the Yonsei University (YSU) planetary boundary layer scheme [26] and the Grell-Devenyi cumulus parameterization.
To represent the actual PM pollution process, we designed Scenario BASE which includes aerosol-radiation feedback (aerosol-meteorology direct feedbacks on air quality was turned on, aer_ra_feedback = 1 in the WRF-Chem model) and various control measures were executed. To assess the effect, we also designed the Scenario NF without aerosol-radiation feedback (aer_ra_feedback = 0 in the WRF-Chem model). The results of Scenario NF simulation were compared with the results of Scenario BASE demonstrating the effectiveness of aerosol radiative feedback.
For evaluating the performance of the WRF-chem in simulating both PM2.5 concentrations and meteorological variables, the time series of the observed and predicted results was obtained and presented in Supplementary Information (Figure S1).

3. Results and Discussion

3.1. Characteristics of PM1 and PM2.5

The average concentrations of PM2.5 and PM1 for the entire sampling period were 122.0 μg/m3 and 88.5 μg/m3, respectively. PM2.5 mass concentration far exceeds the Chinese National Ambient Air Quality Standards (CNAAQS) (GB3095-2012) Grade II (35 μg/m3 for the annual average of PM2.5), for approximately 3.5 times. A number of measures have been recently taken to reduce pollution from anthropogenic sources, consequently, PM2.5 concentration of Handan demonstrates a decreasing trend with annual average concentrations for the urban area moving from 139 μg/m3 in 2013 to 86 μg/m3 in 2017.
To investigate general distinction of PM1 and PM2.5 in clean and polluted days PM1 and PM2.5 daily mass concentration was tested. According to the PM2.5 concentration we defined haze episodes as non-pollution (0 < PM2.5 ≤ 75 μg/m3), mild-moderate pollution (75 μg/m3 < PM2.5 ≤150 μg/m3) and heavy pollution (150 μg/m3 < PM2.5), as shown in Table 1. PM1 on Non-pollution (NP), Mild-moderate pollution (MP) and heavy pollution (HP) were 34.8, 80.1 and 165.6 μg/m3, respectively, while those of PM2.5 were 51.6, 114 and 216 μg/m3. The relating proportions of PM1/PM2.5 on NP, MP and HP were 0.67, 0.70 and 0.77, respectively. The results suggested that PM1 contributed the most of PM2.5, as the pollution got worse, the proportion of PM1 to PM2.5 increased. Compared with other research which elaborated the proportions of PM1/PM2.5 in China northern Cities, the ratios of Handan are close to Beijing (0.75), Shijiazhuang (0.74), Tangshan (0.72) and Qingdao (0.76) that located in the northern China. while Compared with some metropolis in southern China, the ratios of Handan are lower than at Jinsha (0.90), Guilin (0.90), Dongtan (0.90), Changde (0.91), Chengdu (0.91), Nanning (0.91) [27,28]. In order to better illustrate the differences under different pollution levels, we characterized the ratio of the concentration in pollution periods over that on NP as the enrichment factor (EF). EFs of PM1 on MP and HP were 2.19 and 3.75, respectively, which of PM2.5 were 2.21 and 4.18. As a result of the EF of PM2.5 was higher than PM1, especially on HP, we assumed that the growth of PM1–2.5 was bigger than for PM1. This phenomenon was predictable with the outcomes amid serious air pollution in Beijing [29], which showed that PM1.1–2.1 increased faster than PM1.1. In this research, the peak mass concentration of particles shifted from 0.43–0.65 μm on clean days to 0.65–1.1 μm on lightly polluted days and to 1.1–2.1 μm on heavily polluted days.

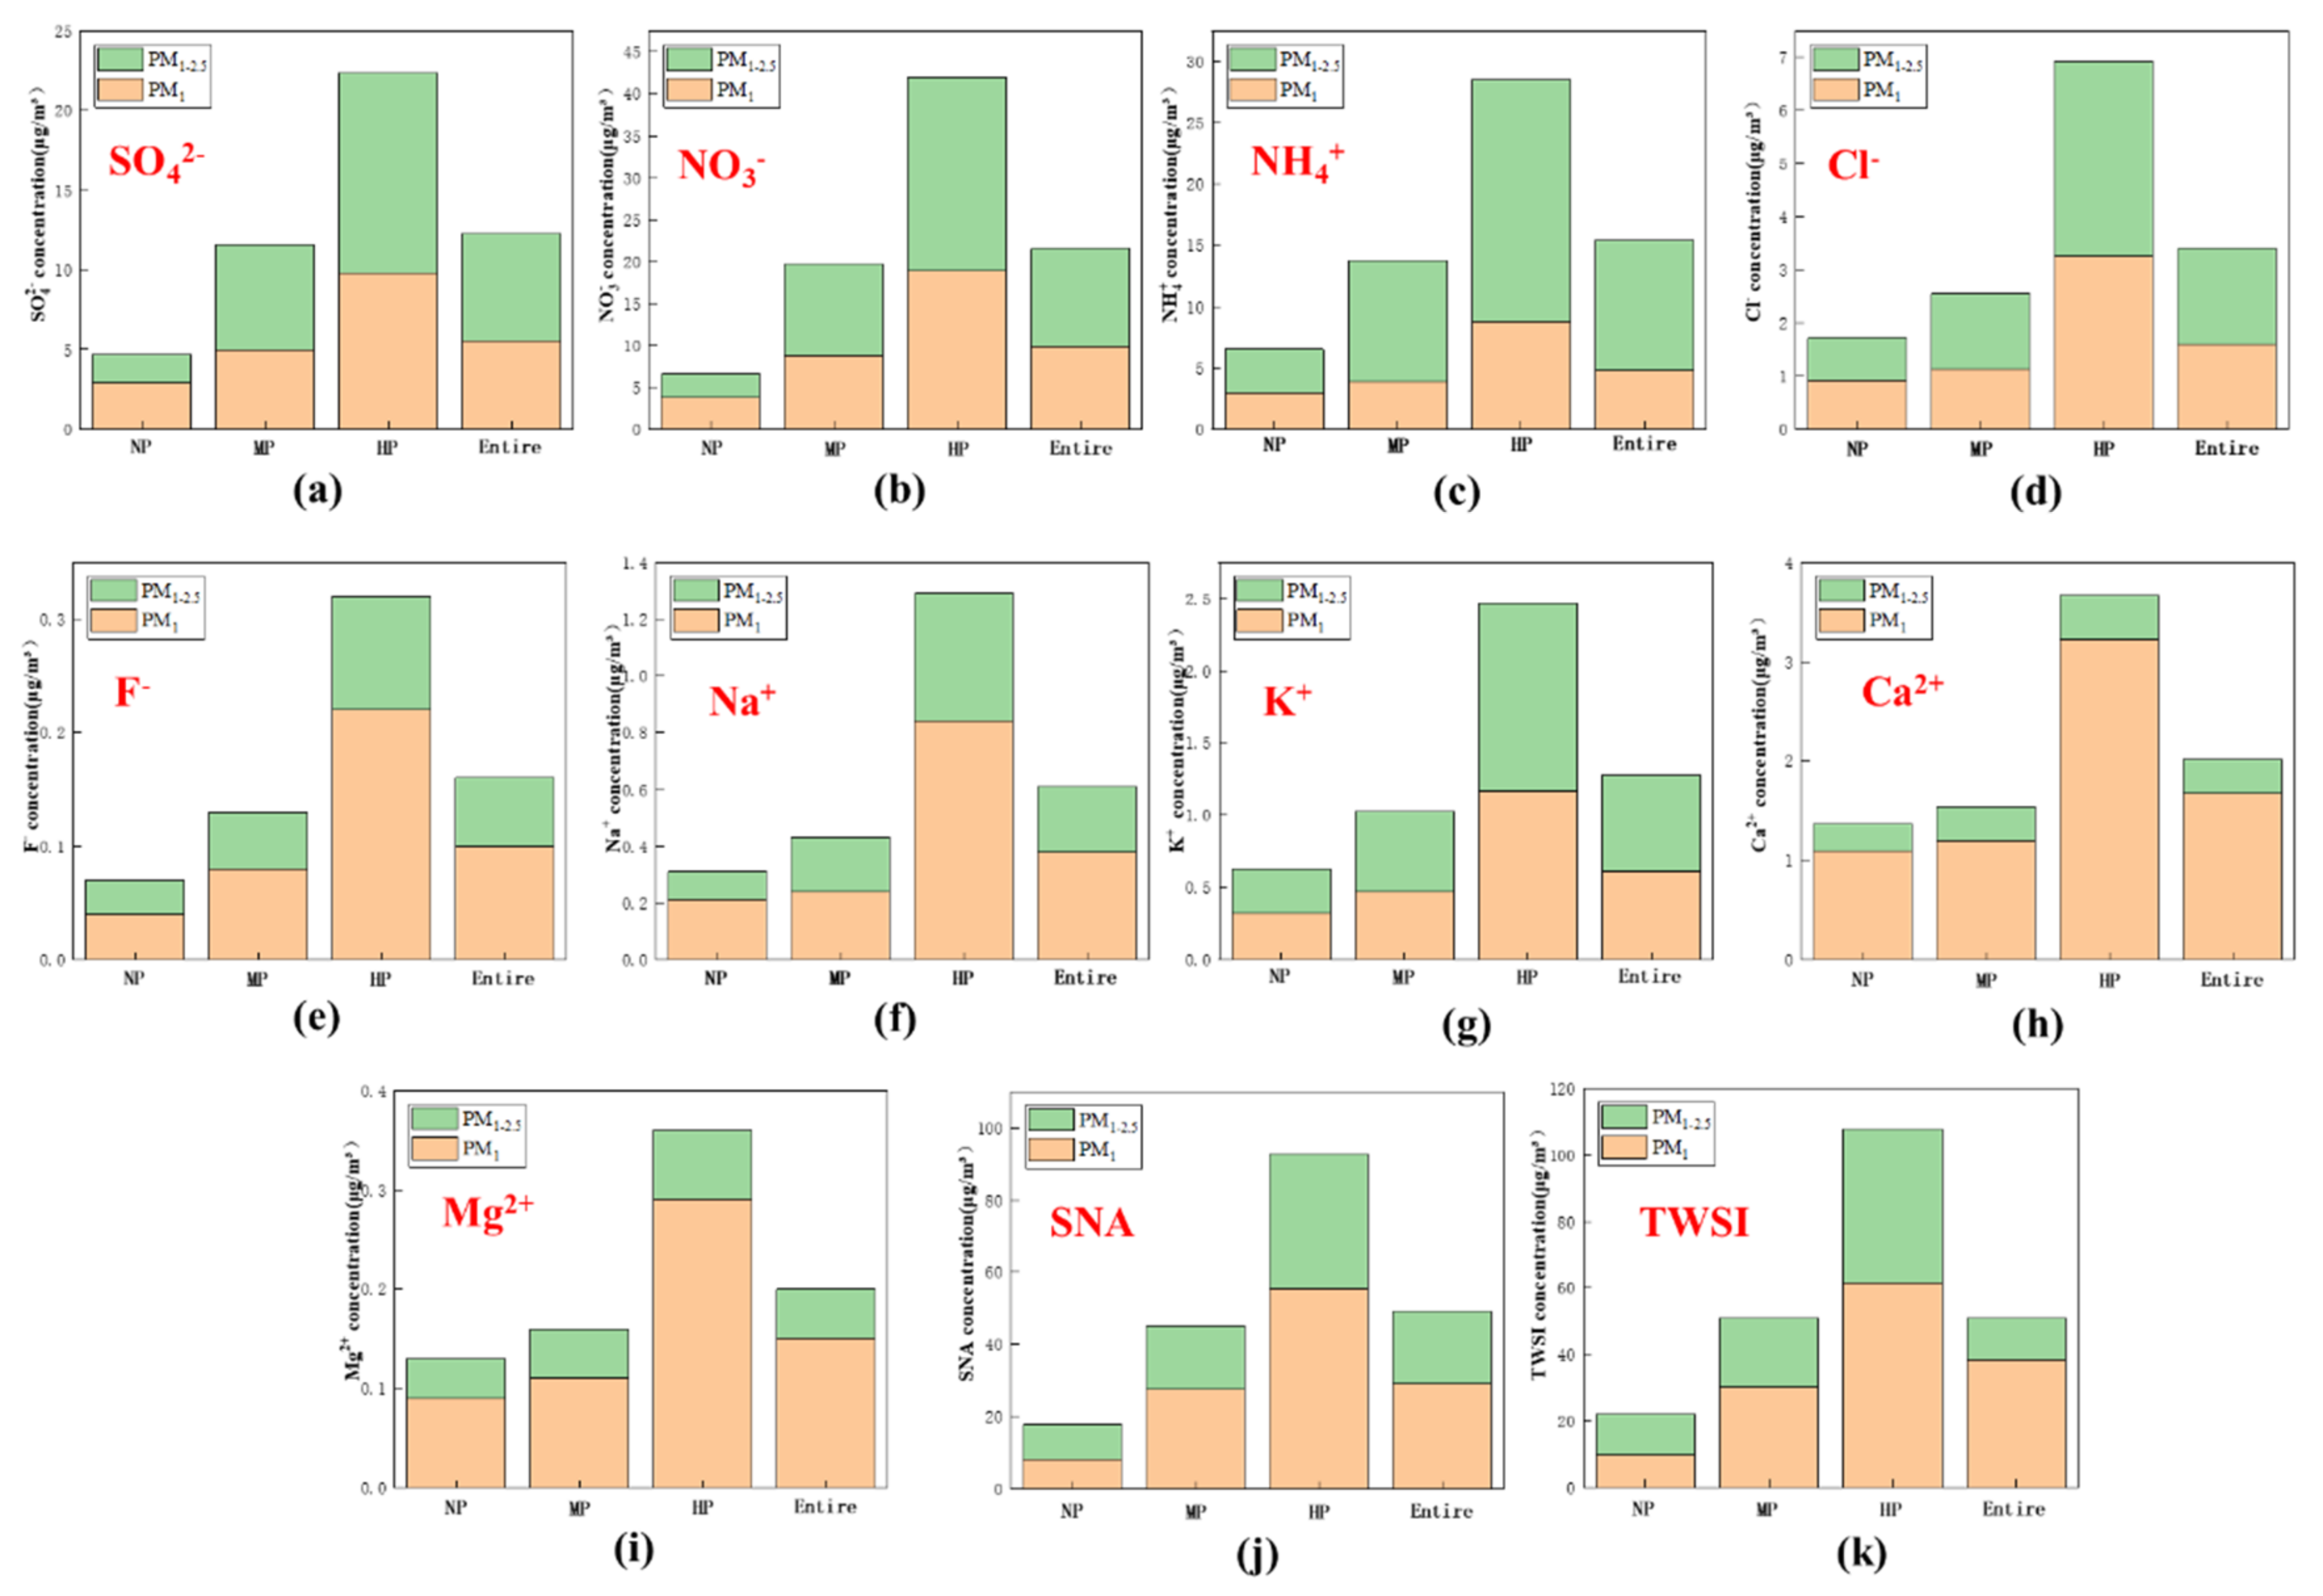
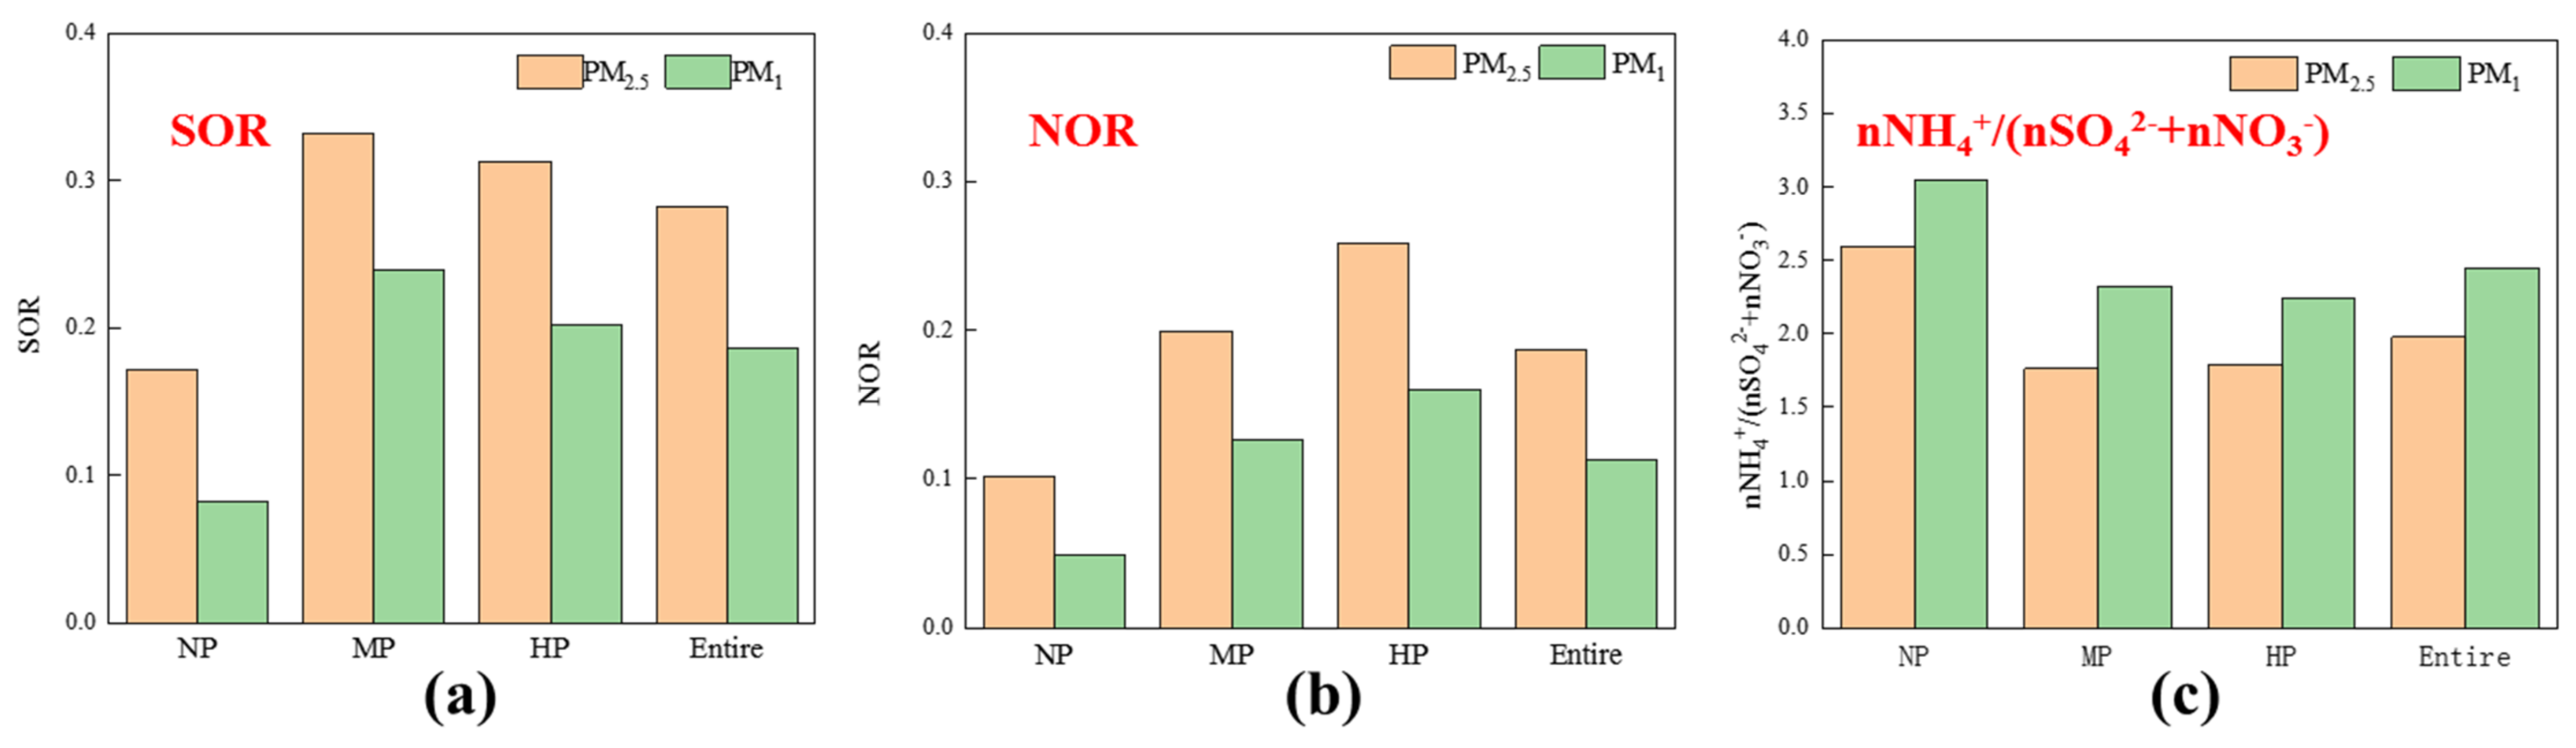
3.2. Water Soluble Inorganic Ions in PM1 and PM2.5

The total water-soluble inorganic ions (TWSI) were the major chemical species for PM1 and PM2.5, accounted for 43.2% and 41.8% in PM1 and PM2.5. Water soluble ion species in both PM1 and PM2.5 on NP, MP and HP during Sampling period in Handan are illustrated in Figure 2. The TWSI in PM1 on NP, MP and HP were 9.81, 30.2 and 61.5 μg/m3, while those in PM2.5 were 21.9, 50.9 and 108 μg/m3, respectively, demonstrating that TWSIs are more easily enriched in PM1. SNA (SO42−, NO3- and NH4+) formed from the precursors such as SO2, NO2 and NH3 and accounted more than 80% in TWSIs of both PM1 and PM2.5 on clean and polluted days. Both on clean and hazed days, the concentration of NO3 was higher than SO42− in PM1 and PM2.5, it was the most abundant among SNA except in PM1 on NP. In this study, EFs of SO42−, NO3 and NH4+ in PM2.5 on MP were 2.47, 3.01 and 2.12, and on HP were 4.79, 6.42 and 4.39. While EFs of SO42−, NO3 and NH4+ in PM1 on MP were 3.70, 3.86 and 2.76, and on HP were 7.05, 8.10 and 5.50, respectively. On haze episodes, EFs of SO42−, NO3- and NH4+ in PM1 were higher than for PM1–2.5 (i.e., SNA increased more in PM1).
Compared with previous studies, the differences for NO3 and SO42− are quite large, and nitrate had replaced SO42− as the most abundant component. Zhao’s studies [30] pointed out that most of the SO42- in Handan comes from local emissions. In recent years, reduction of coal consumption, improvement of desulfurization technology and upgrading of clean energy dosage have brought about a sharp drop in SO42− concentration. We usually regarded the ratio of NO3/SO42− as evidence of whether PM contributed by mobile or stationary sources [31], it is remarkable that NO3-/SO42− in PM2.5 and PM1 expanded with intensification of air pollution, we can infer that vehicles contributed much to PM2.5 and PM1 on polluted days and replacing coal with natural gas also increased NO2 emissions and decreased SO2 emissions. For estimating nitrogen and sulfur reaction degree, previous studies had defined nitrogen oxidation ratio (NOR = nNO3/(nNO3 + nNO2), n refers to molar concentration) and sulfur oxidation ratio (SOR = n SO42−/(nSO42− + nSO2)) [32]. As indicated in Figure 3, NOR in PM2.5 was higher than in PM1 and increased in both PM1 and PM2.5 with worse pollution, nevertheless, SOR was highest on MP both PM1 and PM2.5. In this investigation, SOR in both PM1 and PM2.5 was higher than NOR, as concentration of NO2 (63.8 μg/m3) was higher than SO2 (26.0 μg/m3), we had got a higher observation value of NO3 than SO42−. Scholars [32,33] discovered that haze pollution benefited from formation of NO3-, in addition, high concentrations of NOx promoted the conversion of SO2 to SO42− [34].
We also calculated the molar equivalent ratio of n NH4+/(nNO3+nSO42−) to get the information on connection of species in soluble fraction of PM. Both in PM2.5 and PM1, nNH4+/(NO3+nSO42−) on clean days and polluted days was larger than 1, demonstrating that NH4NO3 and (NH4)2SO4 were major form of SNA in PM2.5 and PM1. The presence of NH4NO3 is positive for water take-up and visibility decrease, it weaken the surface solar radiation by the feedback effect of particulate matter, the boundary layer height and wind speed decrease, further aggravated air contamination [35,36,37].
As a tracer component of coal utilization [16,38], Cl increased significantly in polluted days. EFs of Cl- in PM1 on MP and HP were 1.76 and 4.56, respectively, while those in PM2.5 were 1.45 and 4.02. This phenomenon explained that coal combustion had a more significant contribution. In addition, EFs of K+ in PM2.5 on MP and HP were 1.64 and 3.92, respectively, lower than those in PM1 (1.84 and 4.23). Biomass burning of straw and fallen leaves is the primary source of K+ [38], the EF of K increased rapidly on the polluted day, indicating that the pollution may be accompanied by biomass combustion emissions. True to form, Ca2+ and Mg2+ are crustal ions corresponded like fly ash and construction dust in urban aerosols. On the other hand, the application of a large amount of limestone gypsum desulphurization process promoted the discharge of calcium ions, increased of alkali metal elements such as K, Mg and Ca may be related to the use of desulfurizer.

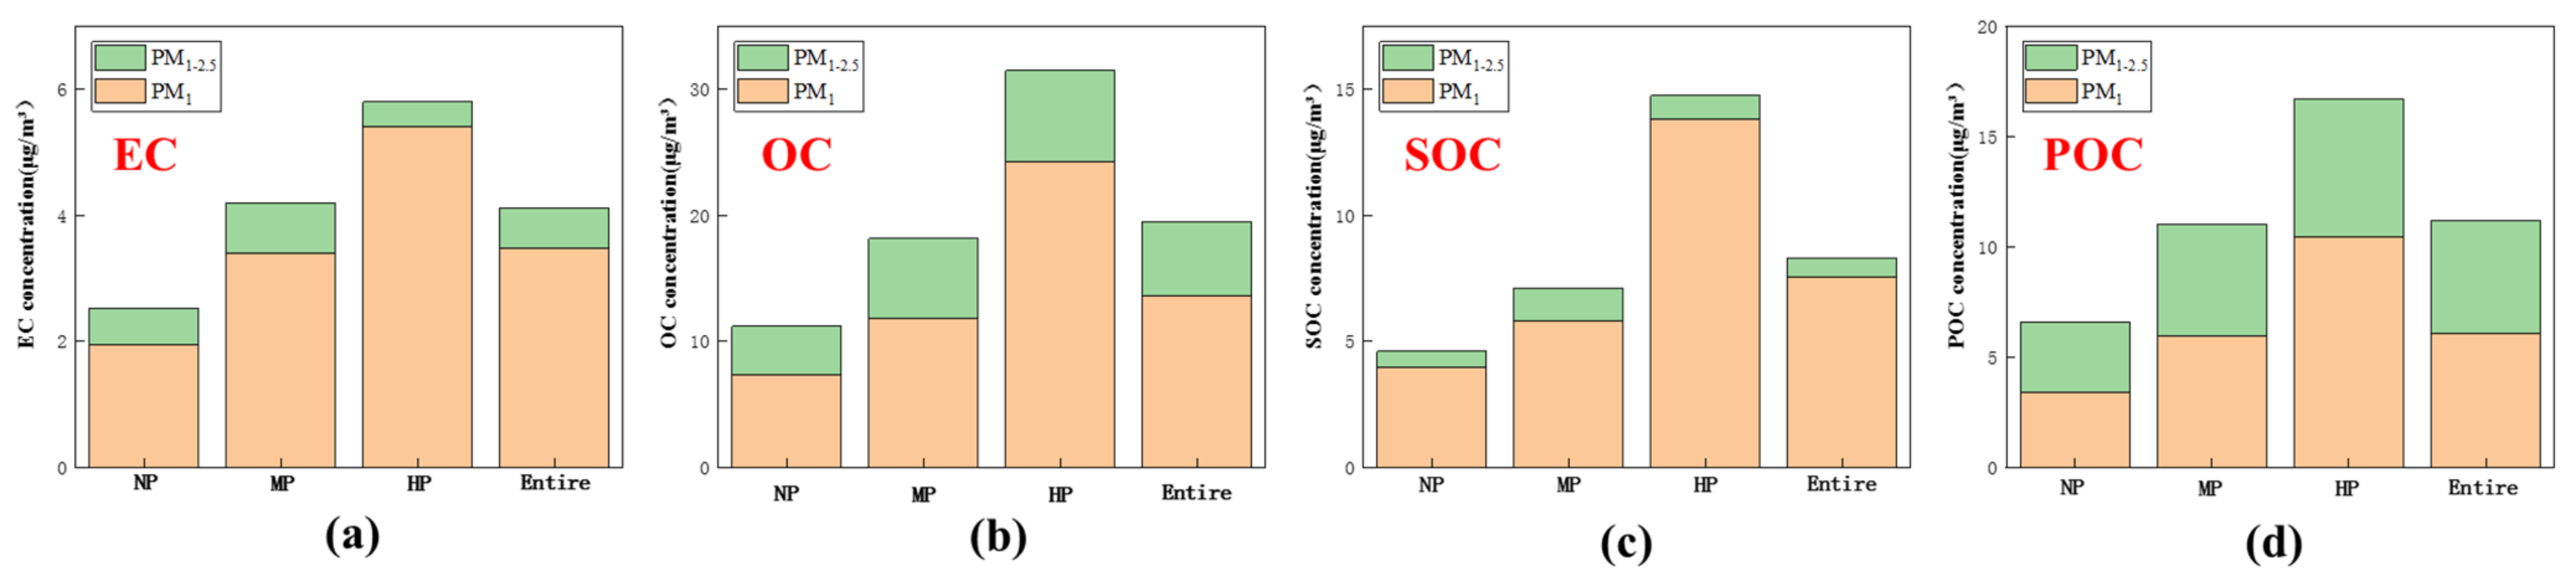
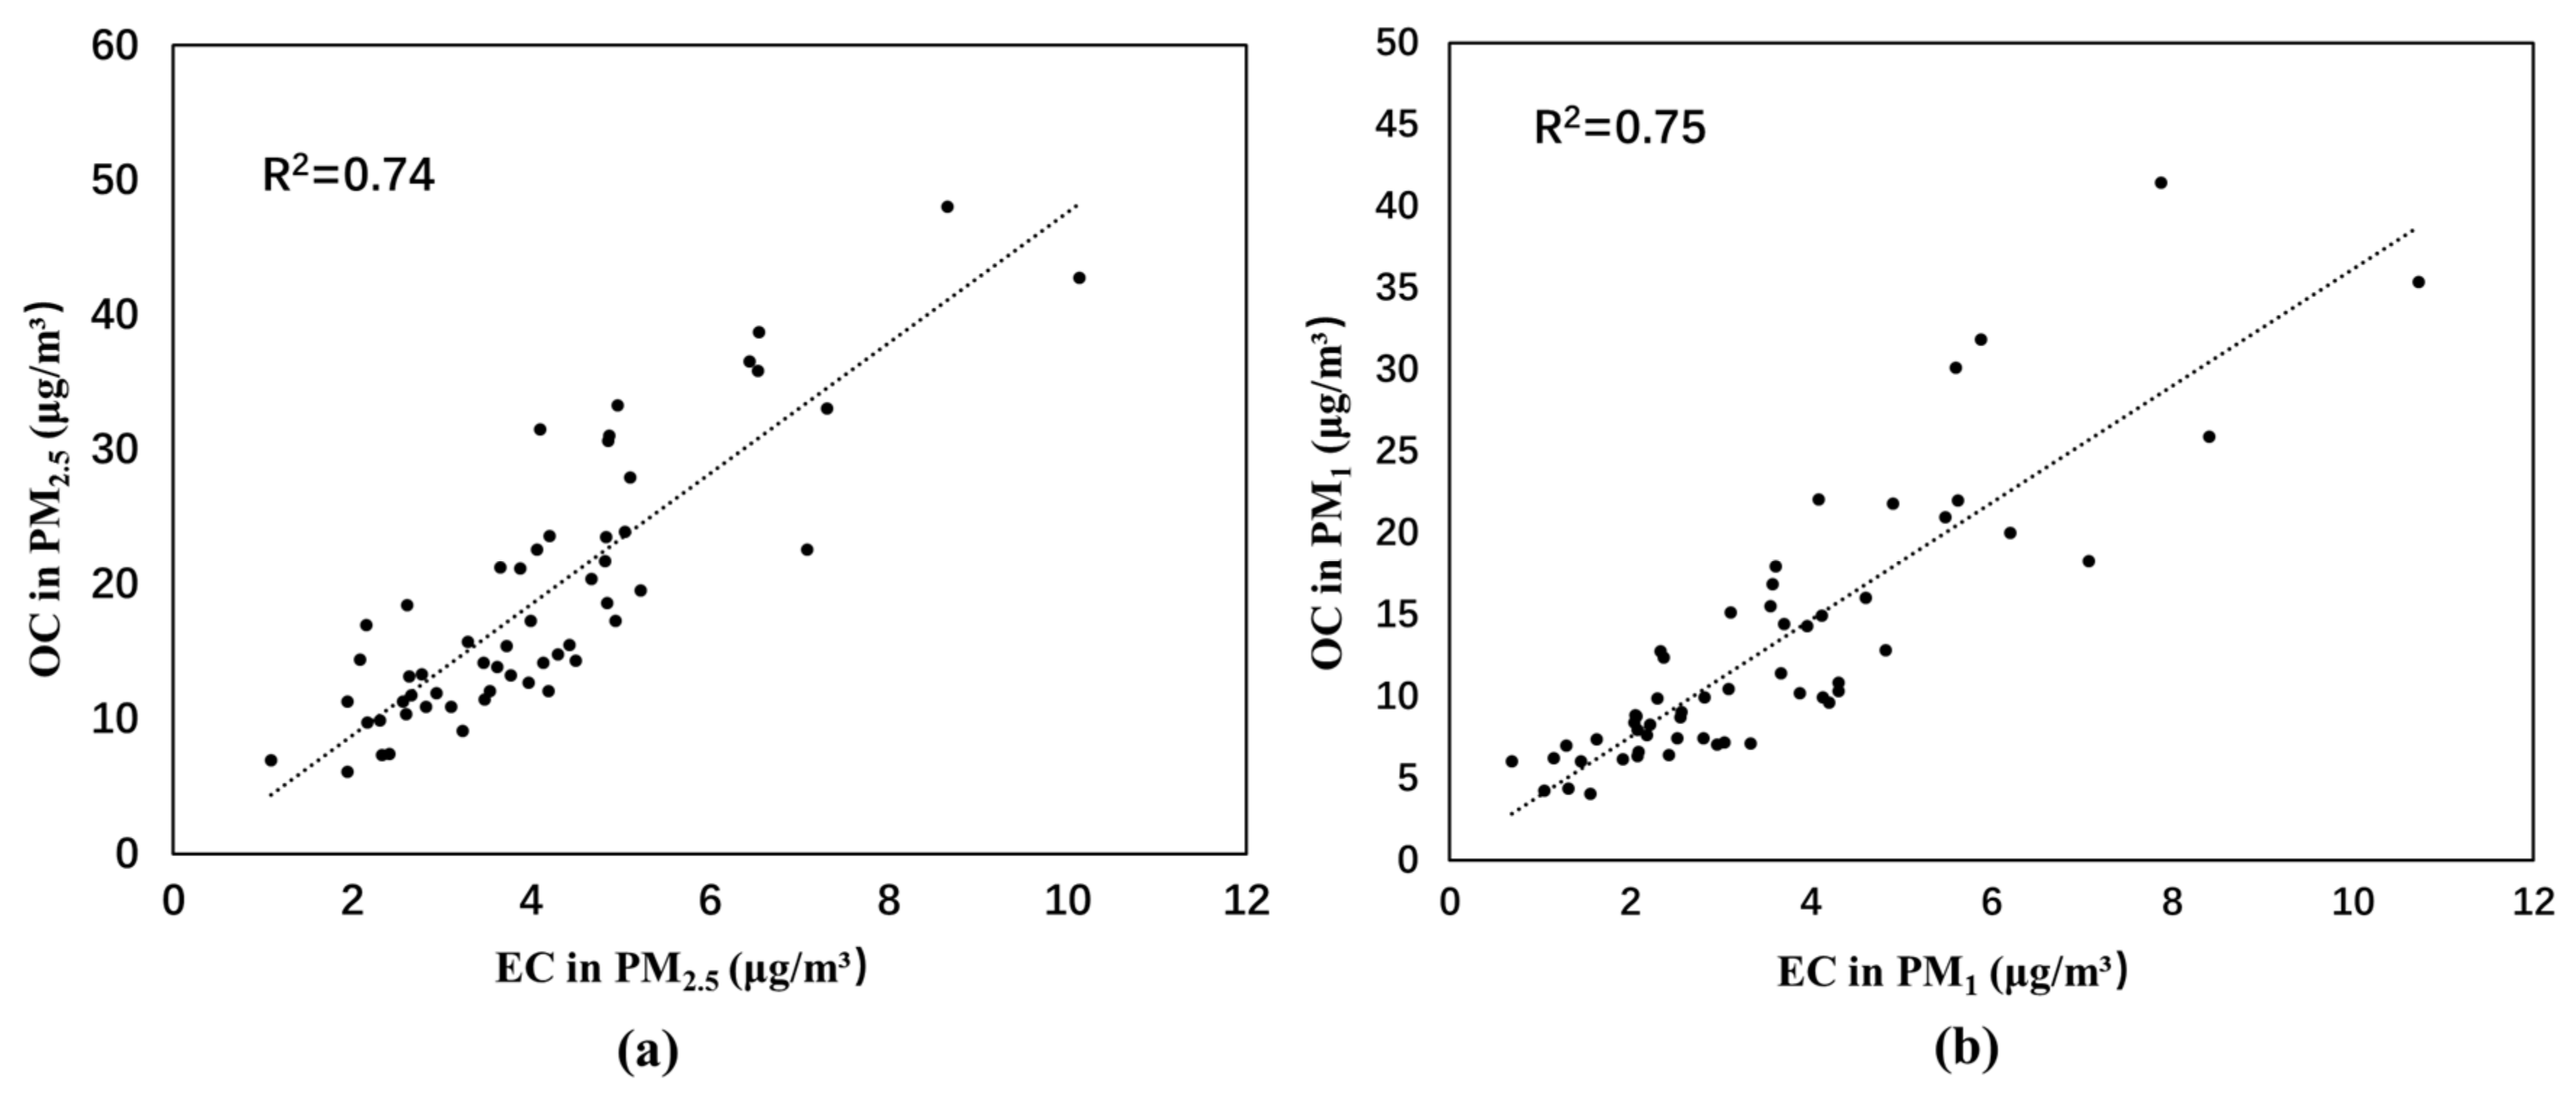
3.3. Carbonaceous Components in PM1 and PM2.5

During the campaign, OC represents 15.4% in PM1 and 16% in PM2.5; and EC 3.4% in PM1 and 3.9% in PM2.5. As shown in Figure 4, OC in PM1 increased from 7.38 μg/m3 on NP to 11.8 μg/m3 on MP, and increased to 24.3 μg/m3 on HP. While OC in PM2.5 were 11.2, 18.1 and 31.5 μg/m3 on NP, MP and HP, respectively. In terms of EC, it were 1.94, 3.93 and 5.41 μg/m3 on NP, MP and HP in PM1, while were 2.53, 4.19 and 5.80 μg/m3 in PM2.5, respectively. However, it is noteworthy that proportion of Total Carbon Aerosol (TCA = 1.6 × OC + EC) [39,40] in PM were stable, which were 28.6% for PM1 and 29.0% for PM2.5 on both polluted and clean days. Furthermore, ratios of OC/EC in PM1 on NP, MP and HP, were 4.25, 4.40 and 5.70, respectively, while those in PM2.5 were 4.09, 4.33 and 5.54. The ratio of OC/EC increased with the increased pollution, we could deduce that secondary formation might be main cause of increased pollution in Handan.
In this study, OC and EC in PM1 or PM2.5 both had distinctly strong correlations (R2 was all above 0.70), as shown in Figure 5, which implying that these constituents might come from fossil fuel combustion. Furthermore, the meteorological conditions including high temperature and humidity could accelerate the formation of secondary organic materials, which deteriorated the correlation to a certain extent [41]. Ratio of OC/EC, which is above 2 in this paper, manifested that Secondary Organic Carbon (SOC) was manly affected by secondary reaction processes such as photochemical reaction and liquid phase reaction. This phenomenon showed that the sources of OC and EC were different, it is contradictory to the higher correlation coefficient between OC and EC, therefore, we inferred that the correlation between OC and EC is not the only criterion for determining whether OC and EC had similar sources, and other factors also affect the source of the carbonaceous particles.
In this work, we applied EC-based theory [42] to discuss Secondary Organic Carbon (SOC), calculated Primary Organic Carbon (POC) by EC × (OC/EC) min, and achieved SOC by OC minus POC. As shown in Figure 4, SOC in PM1 on NP, MP and HP were 3.97, 5.80 and 13.8 μg/m3, respectively. Accordingly, POC in PM1 on NP, MP and HP were 3.41, 5.98 and 10.5 μg/m3, respectively. On polluted days, owing to stable atmospheric condition, multiphase reactions like in-cloud processes would be exacerbated, which further accelerated the generation of SOC [29]. EFs of POC in PM1 on MP and HP were 1.75 and 3.06, respectively, while those of SOC were 1.46 and 3.47. In term of PM2.5, EFs of POC were 1.67 and 2.54, while those of SOC were 1.54 and 3.20. Clearly, the growth rate of SOC in PM2.5 on polluted days is comparable to that in PM1, thus, we speculated that the SOC growth rates in PM1 and PM1–2.5 were similar, which could be related to the bimodal distribution of carbon components in particulate matter. Zhang’s research [43] have shown that the distribution of carbon components in particulate matter is bimodal, and the peak particle size is located on both sides of 1 μm.

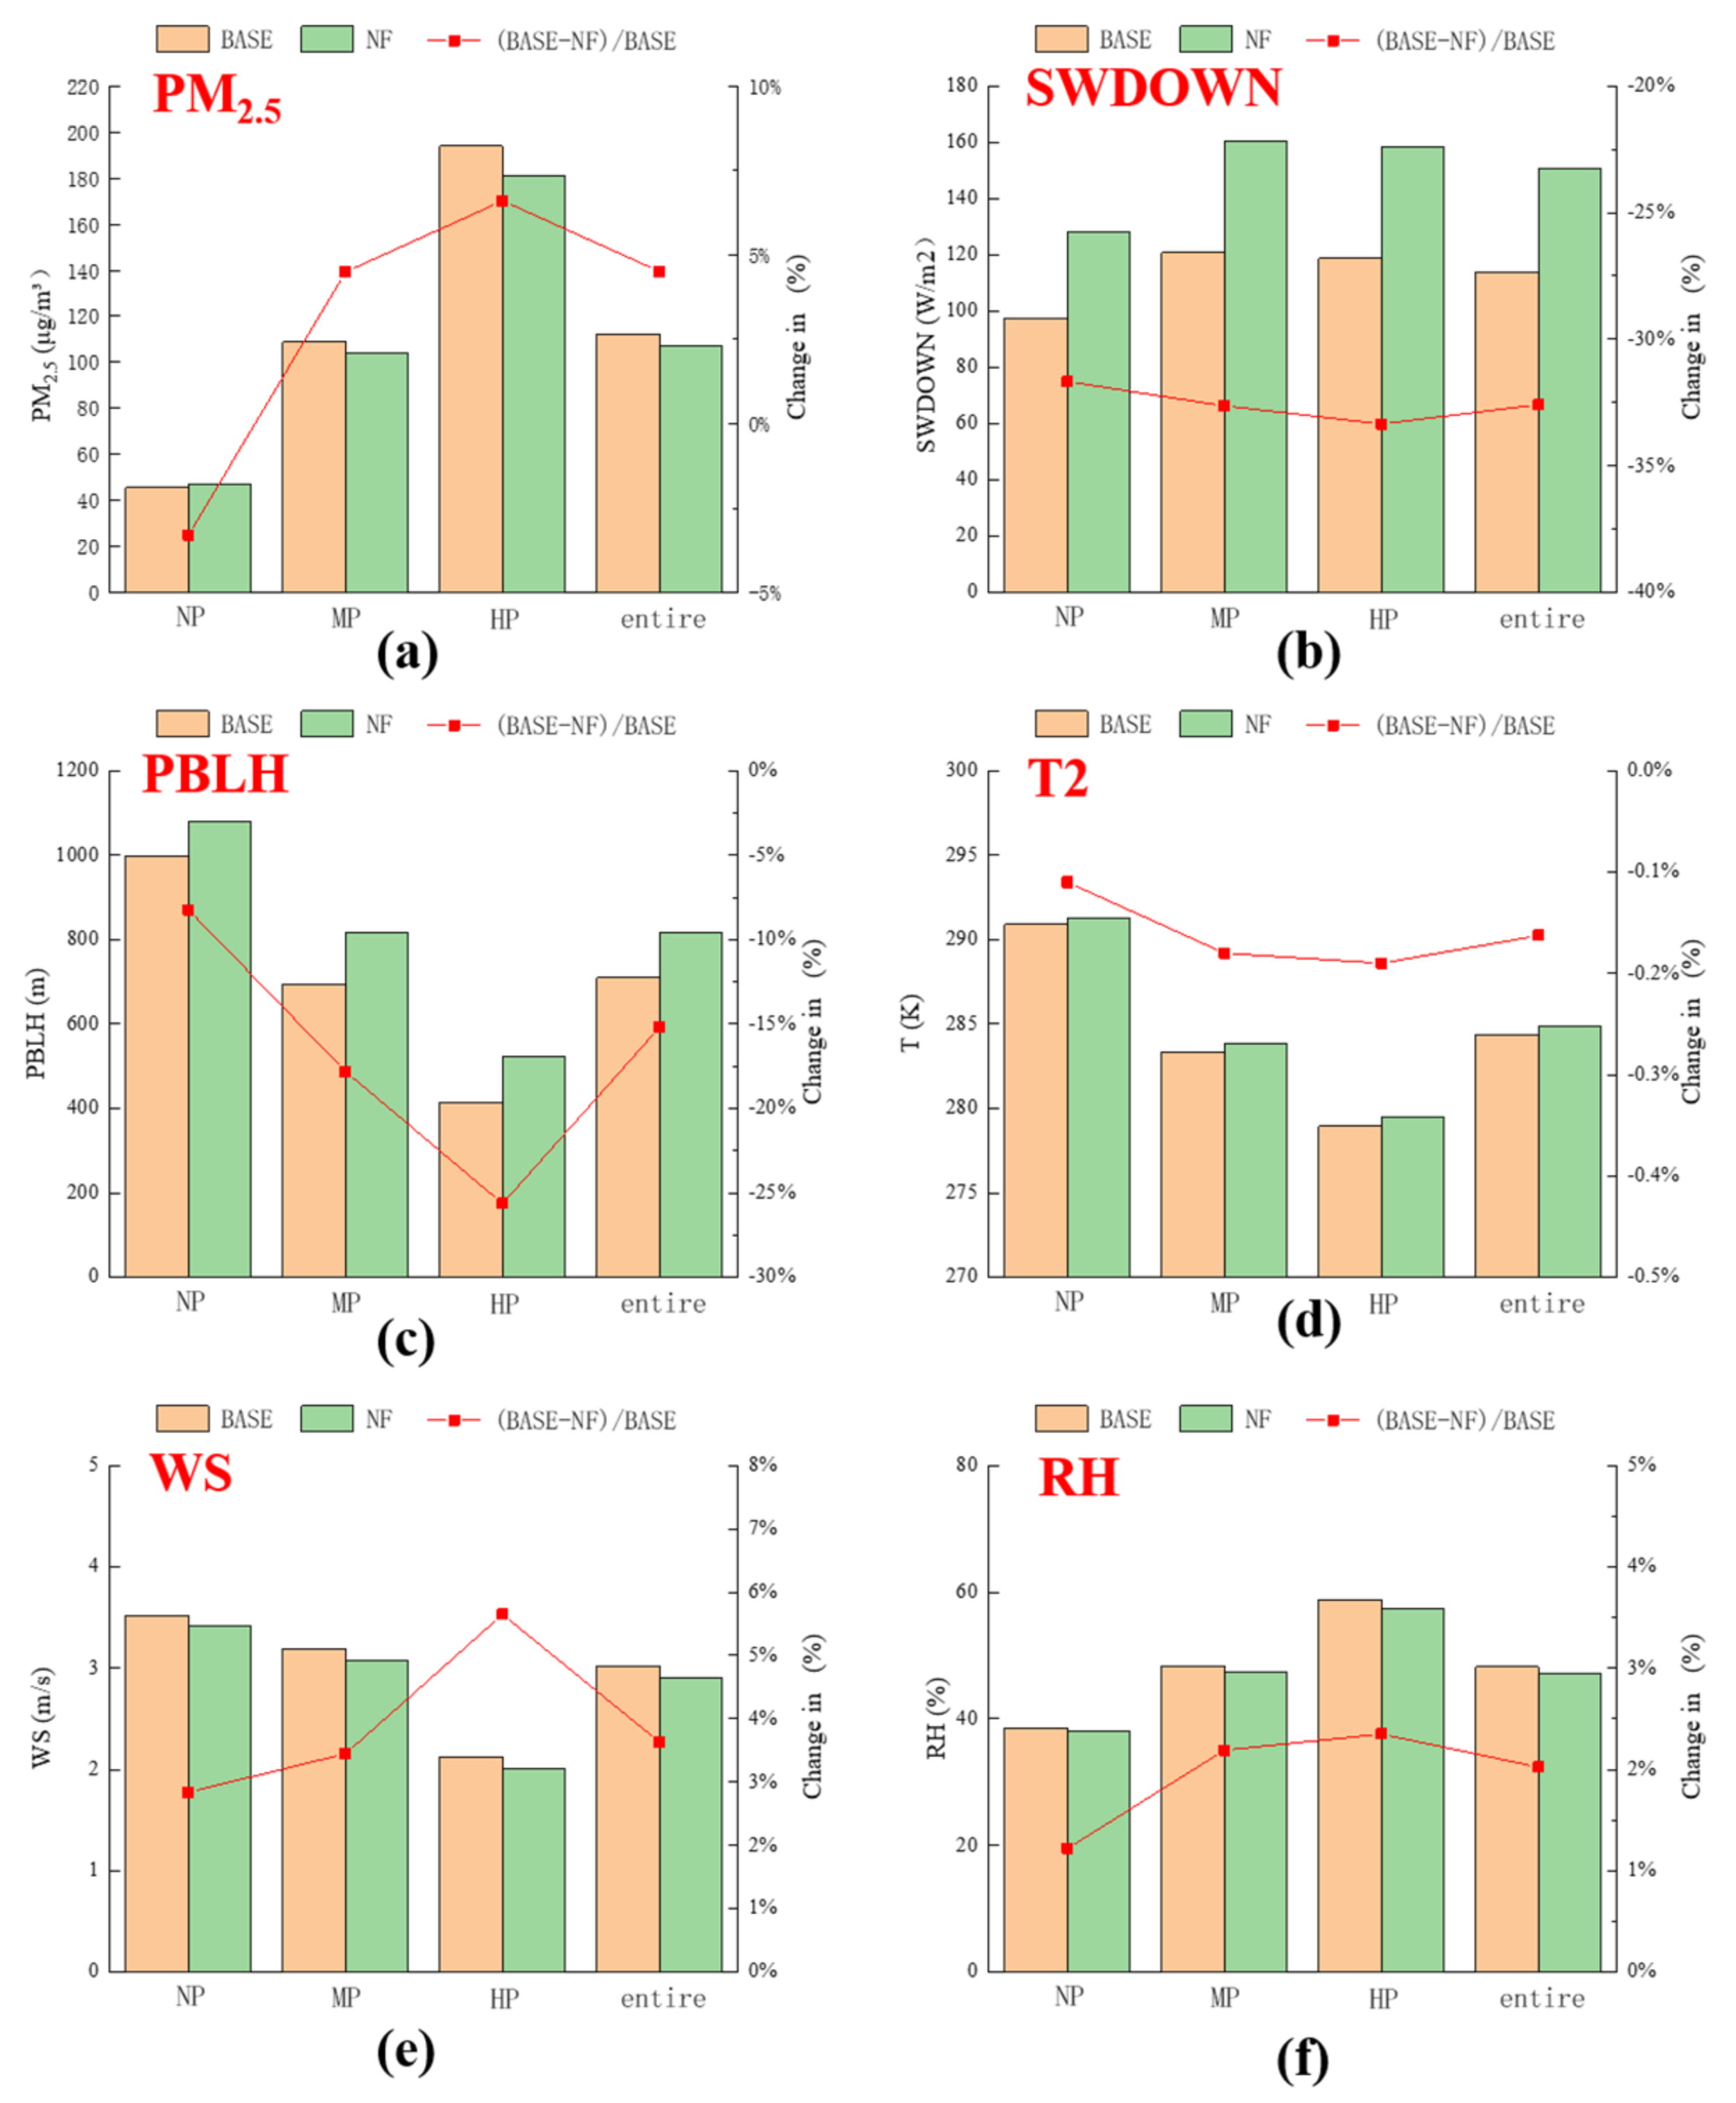
3.4. The Impact of Aerosol Feedback

Owing to the influence of aerosols absorbing and scattering of solar radiation, the amount of solar radiation reaching the Earth’s surface may be affected, which results in the change of the meteorological factors, such as T2, PBLH, RH and WS. For illustrating how feedback effect on meteorological factors, we estimated the change of PBLH, T2, WS and RH between BASE and NF scenarios in percentage. Figure 6a presented differences of PM2.5 concentration and meteorological factors between the BASE and NF scenarios. We also summarize the distinction between the two simulations under three PM2.5 concentrations ranges to comprehend the aerosol concentration influence as the same method in Chapter 3.1, i.e., <75 μg/m3 (NP), 75–150 μg/m3 (MP) and >150 μg/m3(HP).
Comparing the BASE and the NF simulations, we can find that the higher PM2.5 concentration, the influence of aerosol feedback was more obvious. First of all, the concentration change of PM2.5 was most conspicuous in HP, those effects for PM2.5 may reach as high as 6.6% (12.8 μg/m3) in HP, which was noteworthy in prediction and prevention of PM2.5. While in MP, impacts of aerosol feedback could prompt concentrations of PM2.5 raise by 4.5% (4.9 μg/m3). It’s remarkable that, in NP, the aerosol feedbacks lead to a mild decrease in Handan (−3.30%, −1.5 μg/m3), which indicates that the inhibition of PM2.5 concentrations resulted from the decrease in wind speed and atmospheric oxidation, conversely, the lower PBLH under clean days will promote PM2.5 increase.
This can be explained by that the aerosol feedbacks will reduce the solar radiation and thus lead to reduction of PBLH, it will aggravate pollutant accumulation. Meanwhile, the aerosol feedbacks may decrease the pollutant concentrations via changing wind field [44]. In addition, the reduction of radiation will result in a temperature decrease and concentrations of oxidant such as HO, HO2 and O3, which will inhibit the formation of secondary aerosol [45]. It can be summarized that the aerosol feedbacks will exacerbate the urban PM2.5 pollution during severe polluted period, but at the same time, when concentrations of PM2.5 was low, those effects will obviously decreased. As a consequence from the influence of aerosol feedbacks, PM2.5 concentrations would increase by 4.51% (5.1 μg/m3) during entire days in Handan.
As shown in Figure 6b–f, results of the BASE and the NF simulations demonstrated that the aerosol radiative effects would bring about an average 32.6% (36.2 W/m2) decrease in SWDOWN, an average 17.5% (39.2 m) and 0.16%(0.44 K) decrease in PBLH and T2 over Handan. The WS and RH will be increased by about 4.16% (0.11 m/s) and 1.89% (0.78%), respectively. The PBL height reduced by 27.4 m, 41.2 m and 35.5 m, accounted for 8.24%, 17.8% and 25.6% in NP, MP and HP, respectively. It can be found that the PBLH decrease in heavy pollution days was more pronounced, which can be attributed to the high aerosol concentrations. It is worth noting that PBL became more stable caused by reduction of PBLH, and finally further inhibited the diffusion of pollutants in Handan where serious pollution already exited. The influence of aerosol radiation on RH and WS is not strong as its impact on PBLH and solar radiation. As a consequence, the RH of the Handan increased 1.22%, 2.35% and 2.19% in NP, MP and HP, respectively. With WS increased 2.84%, 3.45% and 5.56%. The relative reduction in T2 was much weaker compared with Other meteorological elements, the average T2 decreases of 0.11%, 0.18% and 0.19% in NP, MP and HP, respectively. In conclusion, the more serious the pollution, the more obvious the effect of feedback on Meteorological parameters.

4. Conclusions

The distinction of PM1 and PM2.5 in clean and polluted days was discussed in this study, PM1 on non-pollution, mild-moderate pollution and heavy pollution were 34.8, 80.1 and 166 μg/m3 while those of PM2.5 were 51.6, 114 and 216 μg/m3, respectively. PM2.5 was mainly contributed by PM1 and the proportion of PM1 to PM2.5 increased on haze days, the corresponding ratios of PM1/PM2.5 on NP, MP and HP were 0.67, 0.70 and 0.77, respectively.
The total water-soluble inorganic ions (TWSI) were the major chemical species for PM1 and PM2.5, accounted for 43.2% and 41.8% in PM1 and PM2.5. SNA (SO42−, NO3 and NH4+) accounted more than 80% in TWSIs of both PM1 and PM2.5 on clean and polluted days, it is clear that SNA in PM1 on haze episodes increased more significant than in PM1–2.5. According to ratios of NO3-/SO42−, we can infer that vehicles contributed much to PM2.5 and PM1 on polluted days. In this investigation, SOR in both PM1 and PM2.5 was higher than NOR, and the value of NH4+/(NO3 + SO42−) in PM2.5 and PM1 demonstrating that NH4NO3 and (NH4)2SO4 were major form of SNA.
During the campaign, OC and EC accounted for 15.4% and 16.0% in PM1, 3.9% and 3.4% in PM2.5. OC and EC in PM1 or PM2.5 both had distinctly strong correlations, indicating these constituents might come from one or more co-genetic sources. POC in PM1 and in PM2.5 were 4.12 and 9.24, while SOC in PM1 and in PM2.5 were 7.54 and 8.29. It is obvious that OC/EC on haze days was higher than that on clean days in Handan, indicating that secondary formation of SOC might enhance haze events.
In severe polluted period aerosol feedback could exacerbate the urban PM2.5 pollution, while those effects was weaken as concentrations of PM2.5 was low. In conclusion, the more serious the pollution, the more obvious the effect of aerosol feedback on meteorological parameters. The results of the BASE and the NF simulations indicate that the aerosol radiative effects will result in an average 32.62% (36.18 W/m2) decrease in SWDOWN, an average 17.52% (39.15 m) and 0.16% (0.44 K) decrease in PBLH and T2 over Handan. The WS and RH will be increased by about 4.16% (0.11 m/s) and 1.89% (0.78%), respectively.
This study revealed the chemical characteristics of aerosol pollution including PM1 and PM2.5 in Handan, and evaluated the effect of aerosol feedback by WRF-Chem model. In addition, the aerosol-cloud-interaction should be further studied, and effects of precursors on particulate matter should be considered to effectively reduce the concentrations during heavily polluted days.

Supplementary Materials

The following are available online at https://www.mdpi.com/article/10.3390/atmos12060670/s1, Figure S1: Daily variation of observed data with simulated data during research period in Handan during the investigation period.

Author Contributions

Data Analysis, S.Y., Q.W., J.Z.; Writing-original draft, S.Y.; Writing-edited draft, J.Z.; Investigation, R.Z. All authors have read and agreed to the published version of the manuscript.

Funding

This work was supported by the Science and Technology Planning Project of Henan Province, China (No. 212102310078), Natural Science Foundation of Henan Province, China (No. 212300410322), Soft Science Research Program of Henan Province, China (No. 202400410320).

Institutional Review Board Statement

Not applicable.

Informed Consent Statement

Not applicable.

Data Availability Statement

The data presented in this study are available on request from the corresponding author.

Acknowledgments

The authors are grateful to the anonymous reviewers for their insightful comments.

Conflicts of Interest

The authors declare no conflict of interest.

References

  1. Gao, A.; Wang, J.; Luo, J.; Wang, P.; Zhang, H. Health and economic losses attributable to PM2.5 and ozone exposure in handan, china. Air Qual. Atmos. Health 2021, 14, 605–615. [Google Scholar] [CrossRef]
  2. Wang, L.T.; Wei, Z.; Yang, J.; Zhang, Y.; Zhang, F.F.; Su, J.; Meng, C.C.; Zhang, Q. The 2013 severe haze over southern Hebei, China: Model evaluation, source apportionment, and policy implications. Atmos. Chem. Phys. 2014, 14, 3151–3173. [Google Scholar] [CrossRef] [Green Version]
  3. Zhang, R.; Jing, J.; Tao, J.; Hsu, S.C.; Wang, G.; Cao, J.; Lee, C.S.L.; Zhu, L.; Chen, Z.; Zhao, Y.; et al. Chemical characterization and source apportionment of PM2.5 in Beijing: Seasonal perspective. Atmos. Chem. Phys. 2013, 13, 7053–7074. [Google Scholar] [CrossRef] [Green Version]
  4. Zhang, F.; Wang, L.; Su, J.; Yang, J.; Wei, Z.; Meng, C.; Zheng, Y. Characteristics and Source Apportionment of Carbonaceous Species in PM2.5 of Handan City. Environ. Sci. Technol. 2015, 38, 94–100. [Google Scholar]
  5. Li, H.; Zhang, Q.; Jiang, W.; Collier, S.; Sun, Y.; Zhang, Q.; He, K. Characteristics and sources of water-soluble organic aerosol in a heavily polluted environment in Northern China. Sci. Total Environ. 2020, 758, 143970. [Google Scholar] [CrossRef]
  6. Luo, L.; Tian, H.; Liu, H.; Bai, X.; Liu, W.; Liu, S.; Wu, B.; Lin, S.; Zhao, S.; Hao, Y.; et al. Seasonal variations in the mass characteristics and optical properties of carbonaceous constituents of PM2.5 in six cities of North China. Environ. Pollut. 2021, 268 (Pt B), 115780. [Google Scholar] [CrossRef]
  7. Sun, Y.; Du, W.; Wan, Q.; Zhang, Q.; Chen, C.; Chen, Y.; Chen, Z.; Fu, P.; Wang, Z.; Gao, Z.; et al. Real-Time Characterization of Aerosol Particle Composition above the Urban Canopy in Beijing: Insights into the Interactions between the Atmospheric Boundary Layer and Aerosol Chemistry. Environ. Sci. Technol. 2015, 49, 11340–11347. [Google Scholar] [CrossRef]
  8. Zhang, H.; Cheng, S.; Li, J.; Yao, S.; Wang, X. Investigating the aerosol mass and chemical components characteristics and feedback effects on the meteorological factors in the Beijing-Tianjin-Hebei region, China. Environ. Pollut. 2019, 244, 495–502. [Google Scholar] [CrossRef]
  9. Zhang, H.; Cheng, S.; Wang, X.; Yao, S.; Zhu, F. Continuous monitoring, compositions analysis and the implication of regional transport for submicron and fine aerosols in Beijing, China. Atmos. Environ. 2018, 195, 30–45. [Google Scholar] [CrossRef]
  10. Hu, X.; Sun, J.; Xia, C.; Shen, X.; Zhang, S. Simultaneous measurements of PM1 and PM10 aerosol scattering properties and their relationships in urban beijing: A two-year observation. Sci. Total Environ. 2021, 770, 145215. [Google Scholar] [CrossRef]
  11. Makar, P.A.; Gong, W.; Milbrandt, J.; Hogrefe, C.; Zhang, Y.; Curci, G.; Žabkar, R.; Im, U.; Balzarini, A.; Baró, R.J.A.E. Feedbacks between air pollution and weather, Part 1: Effects on weather. Atmos. Environ. 2015, 115, 442–469. [Google Scholar] [CrossRef]
  12. Huang, K.; Zhuang, G.; Wang, Q.; Fu, J.S.; Lin, Y.; Liu, T.; Han, L.; Deng, C.J.A.C. Extreme haze pollution in Beijing during January 2013: Chemical characteristics, formation mechanism and role of fog processing. Atmos. Chem. Phys. Discuss. 2014, 14, 479–486. [Google Scholar]
  13. Zheng, B.; Zhang, Q.; Zhang, Y.; He, K.B.; Wang, K.; Zheng, G.; Duan, F.K.; Ma, Y.L.; Kimoto, T.J.A.C. Heterogeneous chemistry: A mechanism missing in current models to explain secondary inorganic aerosol formation during the January 2013 haze episode in North China. Atmos. Chem. Phys. 2015, 14, 2031–2049. [Google Scholar] [CrossRef] [Green Version]
  14. Zheng, G.J.; Duan, F.K.; Su, H.; Ma, Y.L.; Cheng, Y.; Zheng, B.; Zhang, Q.; Huang, T.; Kimoto, T.; Chang, D.J.A.C. Exploring the severe winter haze in Beijing: The impact of synoptic weather, regional transport and heterogeneous reactions. Atmos. Chem. Phys. 2015, 15, 2969–2983. [Google Scholar] [CrossRef] [Green Version]
  15. Chen, D.; Liao, H.; Yang, Y.; Chen, L.; Wang, H. Simulated aging processes of black carbon and its impact during a severe winter haze event in the beijing-tianjin-hebei region. Sci. Total Environ. 2021, 755 (Pt 2), 142712. [Google Scholar] [CrossRef]
  16. Wang, G.; Cheng, S.; Wei, W.; Yang, X.; Wang, X.; Jia, J.; Lang, J.; Lv, Z. Characteristics and emission-reduction measures evaluation of PM2.5 during the two major events: APEC and Parade. Sci. Total Environ. 2017, 595, 81–92. [Google Scholar] [CrossRef]
  17. Wang, X.; Wei, W.; Cheng, S.; Li, J.; Zhang, H.; Lv, Z. Characteristics and classification of PM2.5 pollution episodes in Beijing from 2013 to 2015. Sci. Total Environ. 2018, 612, 170–179. [Google Scholar] [CrossRef]
  18. Yang, X.; Cheng, S.; Lang, J.; Xu, R.; Lv, Z. Characterization of aircraft emissions and air quality impacts of an international airport. J. Environ. Sci. 2018, 72, 198–207. [Google Scholar] [CrossRef]
  19. Zhou, Y.; Cheng, S.; Chen, D.; Lang, J.; Zhao, B.; Wei, W.J.A.E. A new statistical approach for establishing high-resolution emission inventory of primary gaseous air pollutants. Atmos. Environ. 2014, 94, 392–401. [Google Scholar] [CrossRef]
  20. Zhou, Y.; Cheng, S.; Lang, J.; Chen, D.; Zhao, B.; Liu, C.; Xu, R.; Li, T. A comprehensive ammonia emission inventory with high-resolution and its evaluation in the Beijing-Tianjin-Hebei (BTH) region, China. Atmos. Environ. 2015, 106, 305–317. [Google Scholar] [CrossRef]
  21. Jia, J.; Cheng, S.; Yao, S.; Xu, T.; Zhang, T.; Ma, Y.; Wang, H.; Duan, W. Emission characteristics and chemical components of size-segregated particulate matter in iron and steel industry. Atmos. Environ. 2018, 182, 115–127. [Google Scholar] [CrossRef]
  22. Zaveri, R.A.; Peters, L.K. A new lumped structure photochemical mechanism for large-scale applications. J. Geophys. Res. Atmos. 1999, 104, 30387–30415. [Google Scholar] [CrossRef]
  23. Zaveri, R.A.; Easter, R.C.; Fast, J.D.; Peters, L.K. Model for Simulating Aerosol Interactions and Chemistry (MOSAIC). J. Geophys. Res. Atmos. 2008, 113. [Google Scholar] [CrossRef]
  24. Chou, M.D.; Suarez, M.J.; Ho, C.H.; Yan, M.M.H.; Lee, K.T. Parameterizations for cloud overlapping and shortwave single-scattering properties for use in general circulation and cloud ensemble models. J. Clim. 1998, 11, 202–214. [Google Scholar] [CrossRef]
  25. Mlawer, E.J.; Taubman, S.J.; Brown, P.D.; Iacono, M.J.; Clough, S.A. Radiative transfer for inhomogeneous atmospheres: RRTM, a validated correlated-k model for the longwave. J. Geophys. Res. Atmos. 1997, 102, 16663–16682. [Google Scholar] [CrossRef] [Green Version]
  26. Hong, S.Y. A new vertical diffusion package with an explicit treatment of entrainment processes. Mon. Weather Rev. 2006, 134, 2318–2341. [Google Scholar] [CrossRef] [Green Version]
  27. Wang, Y.Q.; Zhang, X.Y.; Sun, J.Y.; Zhang, X.C.; Che, H.Z.; Li, Y.J.A.C. Spatial and temporal variations of the concentrations of PM10, PM2.5 and PM1 in China. Atmos. Chem. Phys. Discuss. 2015, 15, 3585–13598. [Google Scholar]
  28. Li, B.; Zhang, J.; Zhao, Y.; Yuan, S.; Zhao, Q.; Shen, G.; Wu, H. Seasonal Variation of Urban Carbonaceous Aerosols in a Typical City Nanjing in Yangtze River Delta, China. Atmos. Environ. 2015, 106, 223–231. [Google Scholar] [CrossRef]
  29. Tian, S.; Pan, Y.; Liu, Z.; Wen, T.; Wang, Y. Size-resolved aerosol chemical analysis of extreme haze pollution events during early 2013 in urban Beijing, China. J. Hazard. Mater. 2014, 279, 452–460. [Google Scholar] [CrossRef] [PubMed]
  30. Zhao, L.; Wang, L.; Tan, J.; Duan, J.; Ma, X.; Zhang, C.; Ji, S.; Qi, M.; Lu, X.H.; Wang, Y.; et al. Changes of chemical composition and source apportionment of PM2.5 during 2013-2017 in urban handan, china. Atmos. Environ. 2019, 206, 119–131. [Google Scholar] [CrossRef]
  31. Huang, T.; Chen, J.; Zhao, W.; Cheng, J.; Cheng, S.J.A. Seasonal Variations and Correlation Analysis of Water-Soluble Inorganic Ions in PM2.5 in Wuhan, 2013. Atmosphere 2016, 7, 49. [Google Scholar] [CrossRef] [Green Version]
  32. Sun, Y.L.; Zhuang, G.S.; Tang, A.H.; Wang, Y.; An, Z.S. Chemical characteristics of PM2.5 and PM10 in haze-fog episodes in Beijing. Environ. Sci. Technol. 2006, 40, 3148–3155. [Google Scholar] [CrossRef]
  33. Zhang, P.; Tan, S.; Wang, L.; Zhao, X.; Su, J.; Zhang, F.; Wei, Z.; Wei, W.; Cheng, D. Characteristics of atmospheric particulate matter pollution in Handan City. Acta Sci. Circum. 2013, 33, 2679–2685. [Google Scholar]
  34. Ma, J.; Chu, B.; Liu, J.; Liu, Y.; Zhang, H.; He, H. NO promotion of SO2 conversion to sulfate: An important mechanism for the occurrence of heavy haze during winter in Beijing. Environ. Pollut. 2018, 233, 662–669. [Google Scholar] [CrossRef]
  35. Shi, Y.; Chen, J.; Hu, D.; Wang, L.; Yang, X.; Wang, X. Airborne submicron particulate (PM1) pollution in Shanghai, China: Chemical variability, formation/dissociation of associated semi-volatile components and the impacts on visibility. Sci. Total Environ. 2014, 473, 199–206. [Google Scholar] [CrossRef]
  36. Zhou, G.; Yang, F.; Geng, F.; Xu, J.; Yang, X.; Tie, X. Measuring and Modeling Aerosol: Relationship with Haze Events in Shanghai, China. Aerosol Air Qual. Res. 2014, 14, 783–792. [Google Scholar] [CrossRef] [Green Version]
  37. Lee, H.-J.; Jo, H.-Y.; Song, C.-H.; Jo, Y.-J.; Park, S.-Y.; Kim, C.-H. Sensitivity of Simulated PM2.5 Concentrations over Northeast Asia to Different Secondary Organic Aerosol Modules during the KORUS-AQ Campaign. Atmosphere 2020, 11, 1004. [Google Scholar] [CrossRef]
  38. Liu, Z.; Xie, Y.; Hu, B.; Wen, T.; Xin, J.; Li, X.; Wang, Y. Size-resolved aerosol water-soluble ions during the summer and winter seasons in beijing: Formation mechanisms of secondary inorganic aerosols. Chemosphere 2017, 183, 119–131. [Google Scholar] [CrossRef]
  39. Turpin, B.J.; Lim, H.J. Species contributions to PM2.5 mass concentrations: Revisiting common assumptions for estimating organic mass. Aerosol Sci. Technol. 2001, 35, 602–610. [Google Scholar] [CrossRef]
  40. Cao, J.J.; Lee, S.C.; Ho, K.F.; Zhang, X.Y.; Zou, S.C.; Fung, K.; Chow, J.C.; Watson, J.G. Characteristics of carbonaceous aerosol in Pearl River Delta Region, China during 2001 winter period. Atmos. Environ. 2003, 37, 1451–1460. [Google Scholar] [CrossRef]
  41. Zhang, Y.Y.; Müller, L.; Winterhalter, R.; Moortgat, G.K.; Hoffmann, T.; Pöschl, U. Seasonal cycle and temperature dependence of pinene oxidation products, dicarboxylic acids and nitrophenols in fine and coarse air particulate matter. Atmos. Chem. Phys. 2010, 112, 213–215. [Google Scholar]
  42. Feng, J.; Li, M.; Zhang, P.; Gong, S.; Zhong, M.; Wu, M.; Zheng, M.; Chen, C.; Wang, H.; Lou, S. Investigation of the sources and seasonal variations of secondary organic aerosols in PM2.5 in Shanghai with organic tracers. Atmos. Environ. 2013, 79, 614–622. [Google Scholar] [CrossRef]
  43. Zhang, J.; Tong, L.; Huang, Z.; Zhang, H.; He, M.; Dai, X.; Zheng, J.; Xiao, H. Seasonal variation and size distributions of water-soluble inorganic ions and carbonaceous aerosols at a coastal site in Ningbo, China. Sci. Total Environ. 2018, 639, 793–803. [Google Scholar] [CrossRef] [PubMed]
  44. Gao, M.; Carmichael, G.R.; Saide, P.E.; Lu, Z.; Yu, M.; Streets, D.G.; Wang, Z. Response of winter fine particulate matter concentrations to emission and meteorology changes in North China. Atmos. Chem. Phys. 2016, 16, 11837–11851. [Google Scholar] [CrossRef] [Green Version]
  45. Gao, J.; Tian, H.; Cheng, K.; Lu, L.; Zheng, M.; Wang, S.; Hao, J.; Wang, K.; Hua, S.; Zhu, C.; et al. The variation of chemical characteristics of PM2.5 and PM10 and formation causes during two haze pollution events in urban Beijing, China. Atmos. Environ. 2015, 107, 1–8. [Google Scholar] [CrossRef]
Figure 1. Location of the sampling sites (c) and WRF-Chem modeling domain setting (a,b). The grey areas are the other “2 + 26” cities in Beijing-Tianjin-Hebei region and surrounding areas.
Atmosphere 12 00670 g001
Figure 2. Concentrations of SO42−, NO3, NH4+, Cl, F, Na+, K+, Ca2+, Mg2+, SNA, TWSI (ak) in PM1 and PM1–2.5 on non-pollution, mild-moderate pollution and heavy pollution in Handan in the period from 15 October to 15 November 2017 and from 29 December 2017 to 26 January 2018.
Atmosphere 12 00670 g002
Figure 3. NOR (a), SOR (b), nNH4+/(nNO3 + nSO42−) (c) in PM1 and PM1–2.5 on non-pollution, mild-moderate pollution and heavy pollution in Handan during the investigation period.
Atmosphere 12 00670 g003
Figure 4. Concentrations of elemental carbon (a), organic carbon (b), secondary organic carbon (c), primary organic carbon (d) in PM1 and PM1–2.5 on non-pollution, mild-moderate pollution and heavy pollution in Handan in the period from 15 October to 15 November 2017 and from 29 December 2017 to 26 January 2018.
Atmosphere 12 00670 g004
Figure 5. The relationship between OC and EC in PM2.5 (a) and PM1 (b) in Handan in the period from 15 October to 15 November 2017 and from 29 December 2017 to 26 January 2018.
Atmosphere 12 00670 g005
Figure 6. Changes of simulated aerosols feedback effect on PM2.5 (a), SWDOWN (b), PBLH (c), T2 (d), WS (e) and RH (f) in percentage on non-pollution, mild-moderate pollution and heavy pollution in Handan during the investigation period.
Atmosphere 12 00670 g006
Table 1. Concentrations of PM1 and PM2.5 on non-pollution, mild-moderate pollution and heavy pollution in Handan in the period from 15 October to 15 November 2017 and from 29 December 2017 to 26 January 2018.
ClassificationNumberPM1 (μg/m3)PM2.5 (μg/m3)PM1/PM2.5
Non-pollution (NP)1734.8 ± 10.951.6 ± 13.40.67 ± 0.09
Mild-moderate pollution (MP)2980.1 ± 18.6114.2 ± 20.70.70 ± 0.09
Heavy pollution (HP)15169.6 ± 33.6215.6 ± 52.50.77 ± 0.07
Entire 6188.5 ± 44.5122 ± 67.20.73 ± 0.1
Publisher’s Note: MDPI stays neutral with regard to jurisdictional claims in published maps and institutional affiliations.

